Applying FEATHERS for Travel Demand Analysis: Model Considerations
by
 ,
,
Qiong Bao
1,*, 
Bruno Kochan
2,
Yongjun Shen
1,2,*,
Lieve Creemers
2,
Tom Bellemans
2,
Davy Janssens
2 and
Geert Wets
2 1
School of Transportation, Southeast University, Sipailou 2, Nanjing 210096, China
2
Transportation Research Institute (IMOB), Hasselt University, Wetenschapspark 5 bus 6, 3590 Diepenbeek, Belgium
*
Authors to whom correspondence should be addressed.
Appl. Sci. 2018, 8(2), 211; https://doi.org/10.3390/app8020211
Submission received: 27 December 2017
/
Revised: 26 January 2018
/
Accepted: 28 January 2018
/
Published: 31 January 2018
Abstract
:Activity-based models of travel demand have received considerable attention in transportation planning and forecasting over the last few decades. FEATHERS (The Forecasting Evolutionary Activity-Travel of Households and their Environmental Repercussions), developed by the Transportation Research Institute of Hasselt University, Belgium, is a micro-simulation framework developed to facilitate the implementation of activity-based models for transport demand forecasting. In this paper, we focus on several model considerations when applying this framework. First, the way to apply FEATHERS on a more disaggregated geographical level is investigated, with the purpose of obtaining more detailed travel demand information. Next, to reduce the computation time when applying FEATHERS on a more detailed geographical level, an iteration approach is proposed to identify the minimum size of the study area needed. In addition, the effect of stochastic errors inherently included in the FEATHERS framework is investigated, and the concept of confidence intervals is applied to determine the minimum number of model runs needed to minimize this effect. In the application, the FEATHERS framework is used to investigate the potential impact of light rail initiatives on travel demand at a local network in Flanders, Belgium. In doing so, all the aforementioned model considerations are taken into account. The results indicate that by integrating a light rail network into the current public transport network, there would be a relatively positive impact on public transport-related trips, but a relatively negative impact on the non-motorized-mode trips in this area. However, no significant change is found for car-related trips.
1. Introduction
According to the latest International Transport Forum (ITF) Transport Outlook [1], transportation systems are expected to experience accelerated expansion in the next few decades due to ever-increasing population, rapid motorization, and rising incomes. However, the rapid growth of traffic volume has also resulted in continuously increasing social, economic, and environmental problems, such as traffic congestion, traffic crashes, energy dependence, greenhouse gas emissions, and air quality. In order to achieve sustainable development of our modern transportation systems and a more rational allocation of facility resources and public services, the original supply-oriented focus of transportation planning has expanded to include accessibility needs and problems by managing travel demand within the available transportation supply [2]. As a consequence, more and more attention has been paid to travel demand analysis in current transportation research.
Over the years, many techniques have evolved to estimate travel demand in different forms. Among others, the activity-based approach, as an alternative to the traditional four-step model of travel demand, has received considerable attention in transportation planning and forecasting in recent years [3,4]. Since the activity-based approach focuses on complete activity behavior patterns and adopts a holistic framework considering individual interactions and spatiotemporal constraints, it explicitly reveals the shortcomings of the conventional trip-based approach and can be used to address many policy issues and their impact ([4,5,6]. FEATHERS (The Forecasting Evolutionary Activity-Travel of Households and their Environmental Repercussions), developed by the Transportation Research Institute of Hasselt University, Belgium, is a multi-agent-based micro-simulation framework developed to facilitate the implementation of activity-based models for transport demand forecasting [7]. Since its birth, continuous efforts have been given to the methodological innovations and practical applications of this framework [8,9,10,11]. In this study, several model considerations on this framework are investigated synthetically with the purpose of applying it for real-life travel demand forecasting in a more detailed, more reliable, and more practical way.
First, to apply FEATHERS for travel demand forecasting, a geographical structure has to be determined in the first place, because based on different levels of geographical detail, i.e., the size of the traffic analysis zones (TAZs), the number of required data and the way to collect and compute these data are different, such as population density. Normally, when a more disaggregated geographical level is considered, more detailed travel demand information will be derived from the model, but, on the other hand, more input data are needed. Currently, the FEATHERS framework is being implemented in the Flanders region of Belgium, and the most detailed travel demand data can be obtained at the Subzone level, which consists of 2386 TAZs with an average area of 5.8 km2. Although a large amount of useful information can be deduced at this level, the size of each Subzone is still somewhat too large to avoid trip generation and attraction focusing too much on one point (e.g., TAZ centroid), which might result in unreasonable traffic allocation with some congested links and some empty links. Therefore, how to apply the FEATHERS framework to a zoning system with higher resolution is the first research question of this study.
Extension of the FEATHERS framework to a more disaggregated geographical level provides us with the opportunity to generate more detailed travel demand information. However, the computation time of the model will be magnified dramatically. For instance, in the FEATHERS framework, it takes approximately 16 h for a single model run based on 50% of the full population of Flanders at the Subzone level (based on an Intel Core i5 CPU at 2.30 GHz, with Windows Seven (32 bits)). If a more disaggregated geographical level is under consideration, the running time of FEATHERS is expected to increase from hour-based unit to day-based unit, which may influence to a great extent the efficient use and the real-life application of the model. To reduce the computation time when applying FEATHERS, one possible solution is to restrain the size of the study area and to conduct the computation only for the selected area, as it is often the case that a small territory (e.g., a municipality) rather than the whole of Flanders is the focus of a specific study. Therefore, the second aim of this study is to identify the minimum size of study area needed for a target territory.
In addition, activity-based models, focusing on activity-travel generation and activity scheduling decisions, use in most cases a micro-simulation approach, in which heterogeneity and randomness are fundamental characteristics since they simulate individual activity patterns by drawing randomly from marginal and conditional probability distributions that are defined for the various choice facets that make up an activity pattern [12]. Therefore, stochastic errors are inherently included in such models. As a result, running a transport micro-simulation model several times with the same input will result in different outputs due to the random number seed used in each run [13]. Analysis of their impacts on the model outputs thereby becomes a vital step for reliable transportation planning and forecasting.
By taking the aforementioned research questions into account, we apply the FEATHERS framework to a practical project that investigates the potential impact of light rail initiatives on travel demand in a local network in Flanders. In doing so, the city of Leuven—the capital of the province of Flemish Brabant—is selected as a case study to predict the travel demand. The city has quite a large transport potential, and yet is reasonably compact in size. Nevertheless, the city has no urban or regional light rail system so far.
The remainder of this paper is structured as follows. In Section 2 and Section 3, we briefly introduce the FEATHERS framework and the light rail initiatives in the city of Leuven, respectively. The model considerations and the methodology proposed in this study are elaborated on in Section 4. In Section 5, the application of the model and the corresponding results are provided. The paper ends with concluding remarks in Section 6.
2. FEATHERS Framework for Flanders
FEATHERS, developed by the Transportation Research Institute of Hasselt University, is a micro-simulation modeling framework developed to facilitate the implementation of activity-based models for transport demand forecasting [7]. It provides a toolbox to implement large-scale activity-based transportation simulations as well as methods to analyze the output generated from different modules inside the framework.
Currently, the FEATHERS framework is fully operational for the Flanders region of Belgium, and the activity-based scheduler from the ALBATROSS model (A Learning Based Transportation Oriented Simulation System) [14] is embedded, in which a rule-based approach based on a sequence of 26 decision trees, derived by means of the CHi-squared Automatic Interaction Detector (CHAID) algorithm, is used in the scheduling process, and decisions are based on a number of attributes of the individual (e.g., age, gender), the household (e.g., number of cars), and the geographical zone (e.g., population density, number of shops). For each individual person with his/her specific attributes, the model simulates whether an activity (e.g., shopping, working, leisure activity, etc.) is going to be carried out or not. Subsequently, the location, transport mode, and duration of the activity are determined, taking into account the attributes of the individual. Based on the estimated schedules or activity travel patterns, travel demand in the form of the number of trip interchanges between TAZs can be extracted and assigned to the transportation network, which can be further used to address many policy issues and their impact, such as, to what extent does an increase in public transport service affect individual activity-travel schedules as well as overall travel demand?
3. Light Rail Initiatives in Leuven
As a result of the early industrialization of Belgium, Flanders has a very dense network of railways, which has provided good intercity connections for inter-regional transfers. Also, there is a well-developed network of buses for local transport. However, no suitable public transport option is currently available for intra-regional movement, which actually become more and more frequent in people’s daily life due to the trend of suburbanization in Flanders. To meet these regional travel demands in a sustainable way, it is important to investigate the feasibility of a regional public transport system in Flanders. In addition, it would be good if such a system could use its own track, so that it is not subject to the ever-growing congestion on the Flemish roads.
In this study, we explore the implementation of a regional light rail system in the Leuven urban environment. The city has quite a large transport potential, and yet is reasonably compact in size. Nevertheless, the city has no urban or regional light rail system so far. Figure 1 shows the proposed light rail network for the region surrounding Leuven. The network consists of 10 different lines with a total length of about 250 km. The network has in general a spider-shaped structure. Apart from the two circular lines inside Leuven, i.e., T8 (north) and T9 (south), all of the remaining lines radiate from Leuven. Moreover, each line has a minimum frequency of four trains per hour, and each train has a fixed capacity of 90 seats and 110 standing places. During rush hour, this capacity will be doubled by increasing the train length.
4. Model Considerations
In this study, we aim to apply the FEATHERS framework to investigate the potential impact of the light rail initiative on travel demand in the regions surrounding the city of Leuven. In doing so, the aforementioned research issues and corresponding solutions are elaborated in the following sections.
4.1. Spatial Transferability
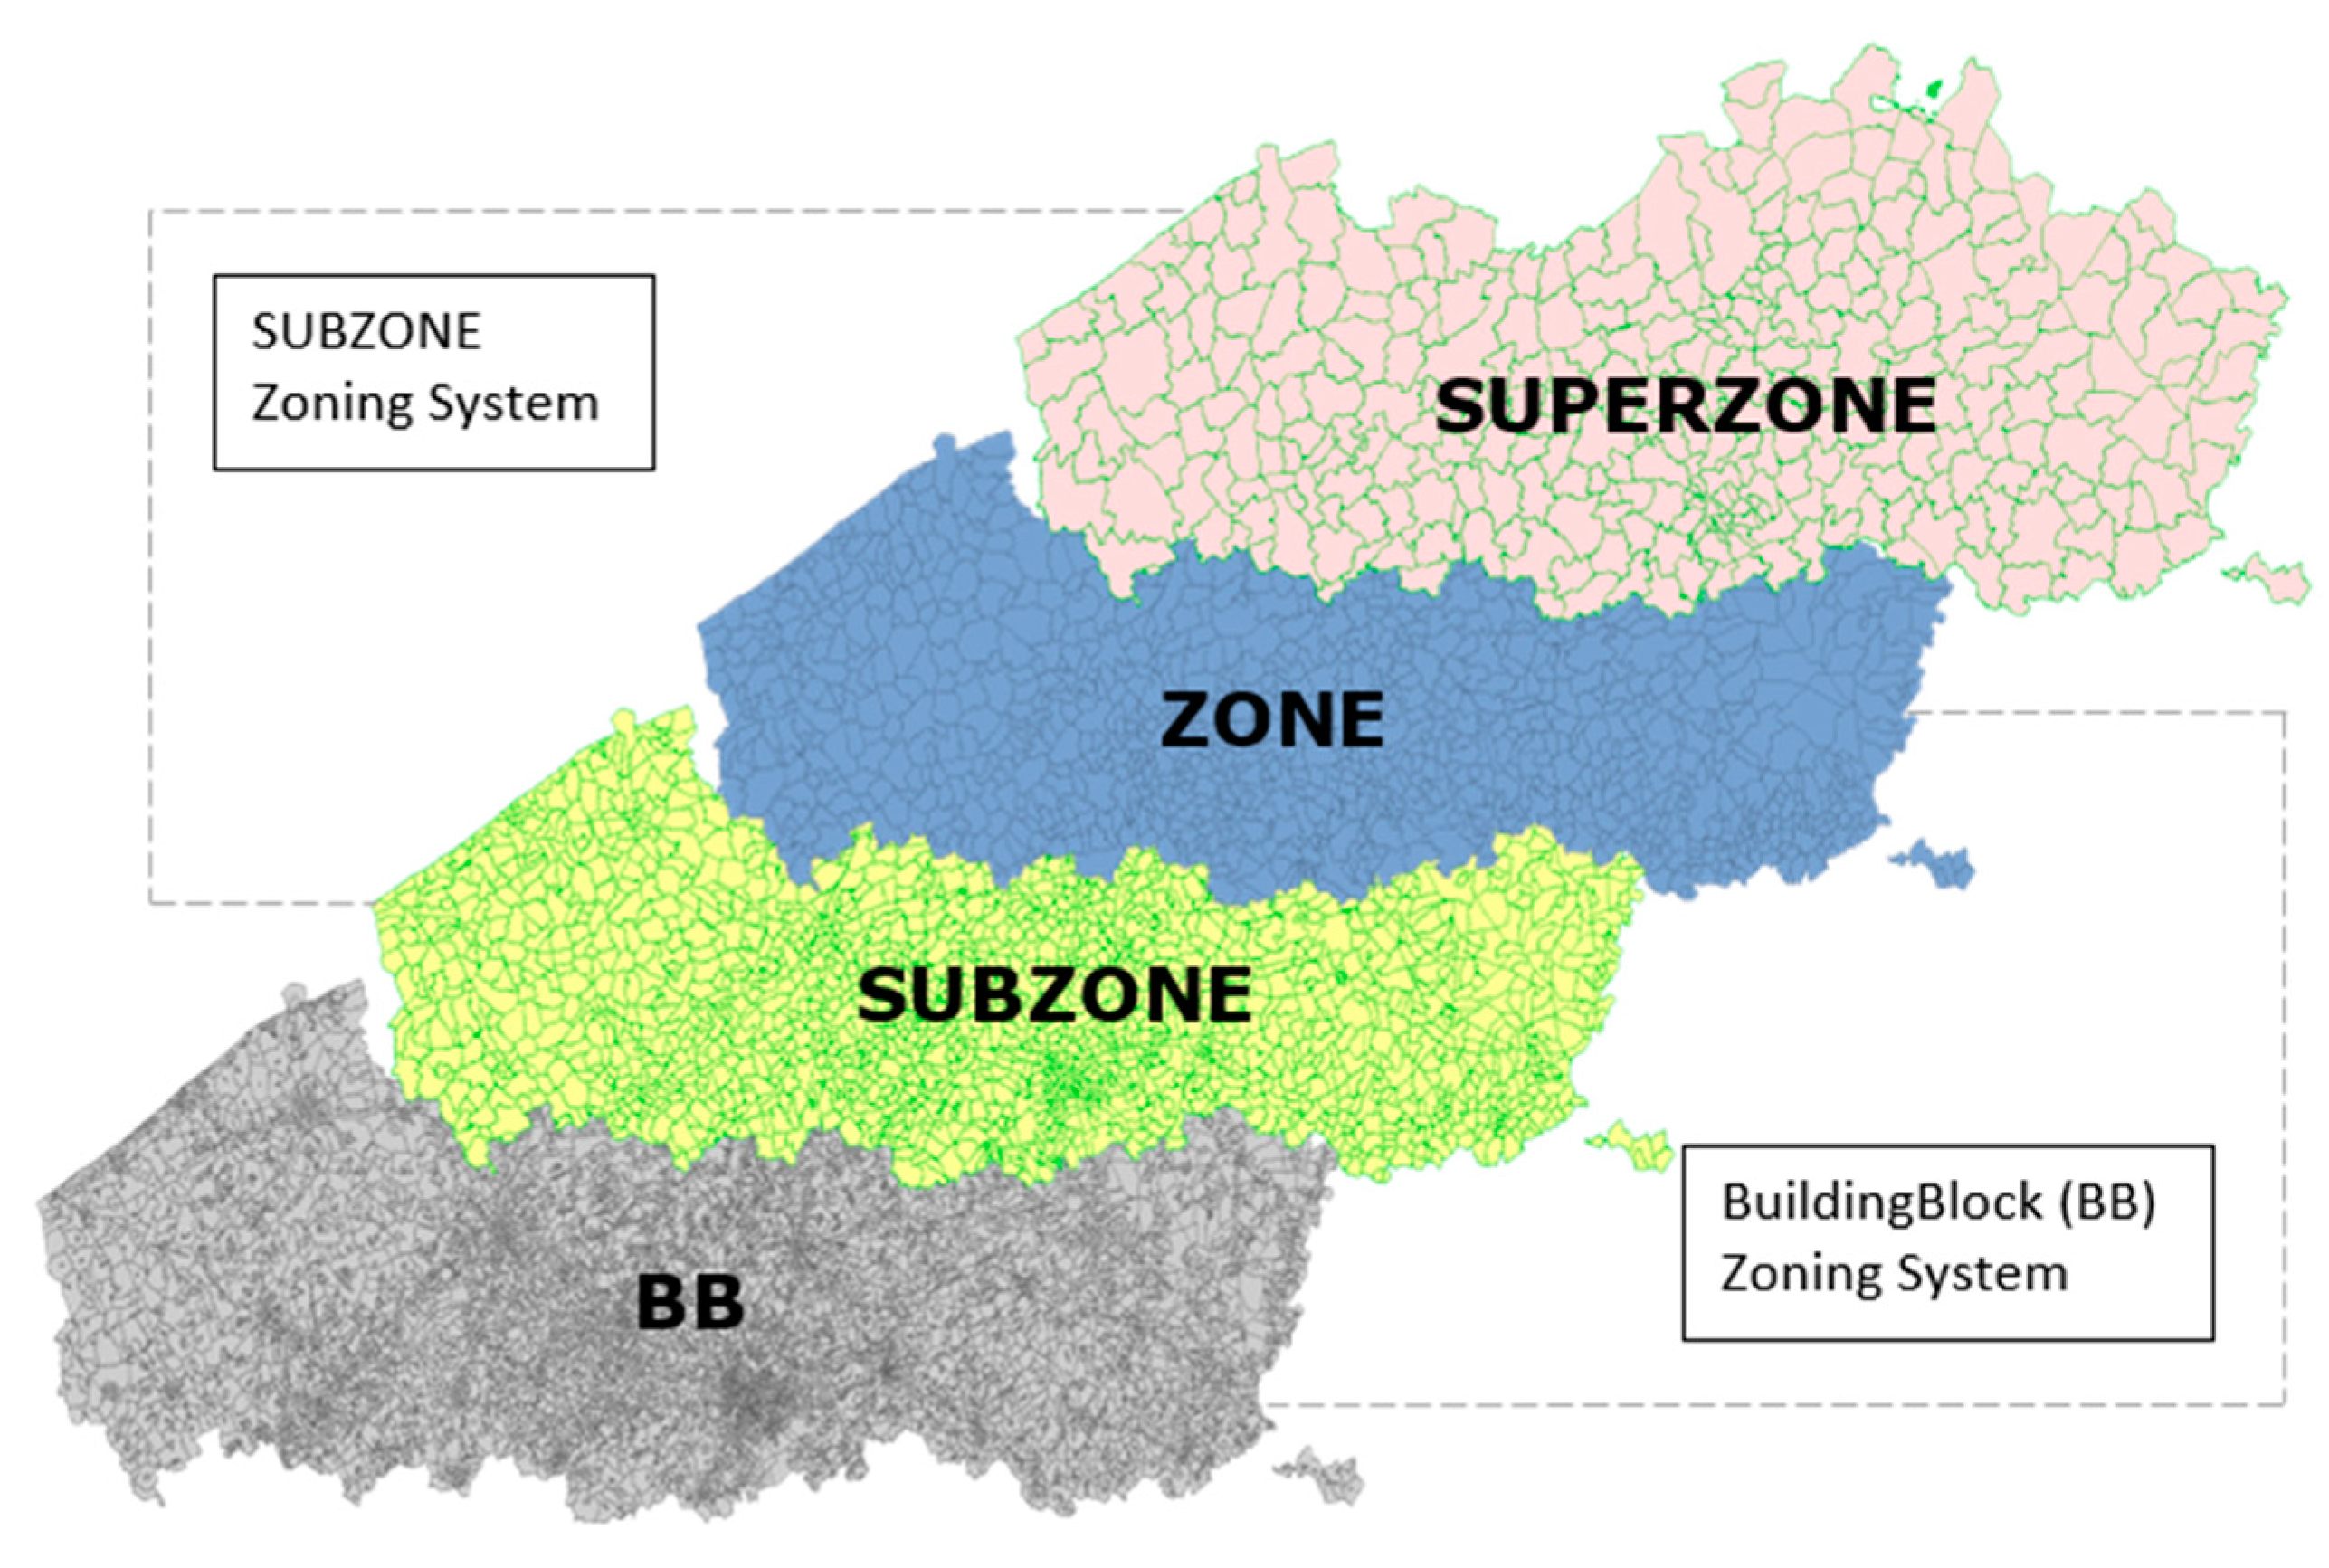
Currently, the FEATHERS framework is operational at the so-called Subzone zoning system for Flanders (see Figure 2), which is defined in the form of a spatial hierarchy composed of three layers. In order of increasing detail, they are: Superzone (compatible with 327 municipalities of Flanders), Zone (consisting of 1145 administrative units at one level lower than municipality), and Subzone (consisting of 2386 virtual areas according to homogeneous characteristics with an average area of 5.8 km2). Hence, using the current FEATHERS framework, the most detailed travel demand data can be obtained at the Subzone level.
Although a large amount of useful information can be deduced at this layer, the size of each Subzone—an average area of around 6 km2—is still too large to avoid trip generation and attraction focusing too much on one point (e.g., TAZ centroid), which might result in unreasonable traffic allocation with some congested links and some empty links. Therefore, a zoning system with higher resolution is desired to implement the FEATHERS framework on. To this end, a Building Block (BB) layer is introduced. It is the most disaggregated geographical level currently applicable in Belgium, which consists of 10,521 units with an average area of 1.3 km2. Taking the city of Leuven as an example, it is one of the Superzones in the geographical structure, which consists of 24 Subzones or 129 BBs (see Figure 3).
To apply the FEATHERS framework in the BB zoning system, which contains the geographical layers of Zone, Subzone, and BB, some input data currently derived from the Subzone zoning system have to be updated accordingly. The information on the fundamental transportation system is one of the most important aspects, as it monitors the availability and performance of the transportation system between every two zones in the study area, such as the travel distance and travel time with respect to different transport modes. All these data are represented by a set of Level of Service (LOS) matrices in the FEATHERS database. However, these data are not directly available for the BB level. Taking the car mode as an example, due to the fact that travel demand is highly dependent on the time of the day, the free-flow and the congested (morning and evening peak) travel time between every two building blocks have to be obtained, as they are not directly available in the current database. To obtain this information, we apply the network skimming tool in TransCAD (Version 5.0 R4 Build 2035, Caliper Corporation, Newton, MA, USA, 2015) to compute the travel distance and travel time for every two BBs based on the Flemish road network. More specifically, the Flemish road network provides all the road links with attribute values regarding travel distance and travel time. Thus, by identifying the travel path connecting every two BB centroids (based on the shortest travel time, for example), the total travel distance and free-flow travel time between every two BBs can be calculated.
Apart from this, the activity-based schedule diary data, the synthetic population data, and some other environmental data (such as the land use system) have to be updated as well. For instance, the schedule diary data should cover the demographic (e.g., age, gender), socioeconomic (e.g., income, work status), activity (e.g., beginning time, duration and the location of the activity), household (e.g., number of cars, age of children), and travel information (e.g., transport mode, origin and destination of the journey), as well as the interrelationship between a multitude of facets of activity profiles on an individual level. For the Subzone zoning system, the schedule diary data were obtained based on the OVG travel survey (OVG (Onderzoek VerplaastingsGerdarg Vlaanderen) is a trip-based survey used to collect data for the Flemish study area. It was conducted with 8800 persons selected based on a random sample from the national register, primarily by means of a face-to-face interview), and grouped into six datasets, i.e., Activities, Cars, Households, Journeys, Lags, and Persons. To obtain the schedule data for the BB zoning system, the basic information on persons, households or journeys at the Subzone level can continue to be used without any problem, such as the age of the person, the number of the household members, and the duration of the journey. However, the location IDs used to mark up the occurrence of activities or journeys need to be refilled to correspond to the IDs of the BB layer. For more information about data preparation, we refer to [15].
Based on the new dataset, the FEATHERS framework can now be applied using the BB zoning system. A full activity-travel diary schedule for each individual can be predicted using the relearned decision trees inside FEATHERS, and a series of origin and destination (OD) matrices can be generated representing the travel demand with respect to each origin and destination at the BB level. The results for the other geographical levels can then be aggregated according to the hierarchical relationship of the BB zoning system.
4.2. Study Area Determination
As highlighted before, one of the practical limitations of applying most of the currently available activity-based models is their computation time, especially when detailed geographical unit level is taken into account. In general, the more detailed the geographical unit level considered, the longer computation time is needed. Specifically, to apply the FEATHERS framework based on the BB zoning system, more than two days are needed to complete the model execution if 50% of the full population of Flanders is under consideration, which is three times more than the situation of using the Subzone zoning system.
To reduce the computation time of FEATHERS, several tradeoffs can be made in actual applications, one of which is to restrain the size of the study area and conduct the computation only for the selected region [16]. In this study, given the fact that the city of Leuven is the target territory, it is possible to apply FEATHERS to a relatively small study area surrounding this target territory rather than to take the whole of Flanders into account. In this way, the computation time of the model is reduced. The question then becomes: what should the minimum size of the study area surrounding the target territory be, and how do we determine it?
In this study, by defining the accuracy level of the model, we propose an iteration approach to determine the minimum size of study area required for the city of Leuven when performing travel demand forecasting. Different transport modes are taken into account. More specifically, for the target territory of Leuven, one more zone with the shortest centroid distance to this target territory is added, constituting a new study area (SA). Then, the travel demand (e.g., number of trips) of both departing mode and arriving mode with respect to this new study area to and from Leuven is computed. The difference (D) between the occurrence of both the departing trips (DTs) and the arriving trips (ATs) derived based on this study area and that based on the whole of Flanders can be calculated by Equation (1), which can be further used to estimate the accuracy rate (A) of this study area using Equation (2):
Such a procedure is repeated, i.e., more zones are added, from close to distant, until the predefined accuracy requirement is reached. The obtained study area is thus the minimum size needed for the travel demand prediction of the target municipality.
Now, by defining an accuracy level of 90%, the study area for the public transport of Leuven is identified. In fact, it is the largest study area among the different transport modes. In total, 135 municipalities (or Superzones) are included, as illustrated in Figure 4. It should be mentioned here that this restrained study area covers the whole light rail network proposed in Section 3.
By applying FEATHERS on such a study area, it turns out that the computation time can be reduced considerably. For a single model run, fewer than 29 h are needed (using 50% of the full population), which is only 45% of the computation time if the whole of Flanders is under consideration (see Table 1).
It should be noted that to determine the required study area for the city of Leuven, we have to first run FEATHERS for the whole of Flanders in order to apply Equations (1) and (2). However, the total computation time will be reduced when multiple model runs are needed (see Section 4.3).
4.3. Stochastic Error Minimization
Before applying the FEATHERS framework for this case study, another model issue has to be properly addressed, which is minimizing the effect of stochastic errors in FEATHERS. As highlighted before, activity-based models use in most cases a micro-simulation approach; stochastic errors are therefore inherently included in such models [17]. As a result, running a transport micro-simulation model, such as FEATHERS, several times with the same input will generate different outputs due to the random number seed used in each run. Consequently, it is natural to run FEATHERS multiple times, estimate the effects of stochastic errors by analyzing the variation of the outputs between the runs, and use the average value of these outputs for further analysis. The question then becomes: what is the minimum number of runs required to ensure that at least a certain percentile of zones in the study area reach a stable result?
To answer this question, 100 successive model runs are performed based on a 50% fraction of the whole Flanders population. After each model run, the prediction file, containing the whole activity travel pattern or schedule information for each individual, is generated, based on which the average daily number of trips per person (X) for each of the 327 Superzones can be computed. Next, the concept of confidence interval (CI) is adopted [18,19], using the following equation:
where represents a confidence interval for the true average value; is the probability of the true average value not lying within the confidence interval; is the Student’s t-statistic for the probability of a two-sided error adding up to with N − 1 degrees of freedom; N is the required number of model runs; and s denotes the estimated standard deviation of the results.
In this study, a 95% level of confidence is selected and the desired confidence interval, which acts as the predefined stable condition, is set as a 10% fraction of the final average value (after 100 runs) of the corresponding index under study (X), i.e., , where . Also, the standard deviation of the results among 100 runs is used as the estimation of s. By using Equation (3), an iterative process is applied for each Superzone to estimate the minimum number of model runs required in terms of the average daily number of trips per person (X). The iteration continues until the estimated number of model runs N matches, the number of repetitions assumed when looking up the Student’s t-statistic. In this way, the minimum number of FEATHERS runs needed to ensure each Superzone to achieve stable results with respect to the corresponding index can be derived.
As indicated in Section 4.2, a total of 135 municipalities (i.e., Superzones) have been identified for the Leuven case study. To ensure all these Superzones achieve a stable result with respect to the average daily number of trips per person, a maximum of seven model runs is required. The detailed results are shown in Table 2. In fact, most of the Superzones involved need fewer than five model runs.
5. Application and Results
By taking the above model considerations into account, we now apply the FEATHERS framework to the case study that investigates the potential impact of the light rail initiative on travel demand in the region surrounding Leuven. The analysis is conducted by performing two scenarios in FEATHERS. Initially there is a null scenario that is limited to the situation where no light rail network is included. The public transport network contains only train lines (e.g., NMBS) and bus lines (e.g., De Lijn). In the second scenario, the light rail network is integrated with the current public transport network, which is therefore called the light rail scenario.
After running FEATHERS seven times for each of these scenarios based on the BB zoning system for the 50% fraction of the full population and using the study area shown in Figure 4, the predicted daily travel demand (i.e., the number of trips) of four different traffic modes (i.e., car as driver, car as passenger, non-motorized mode, and public transport) is presented in Table 3.
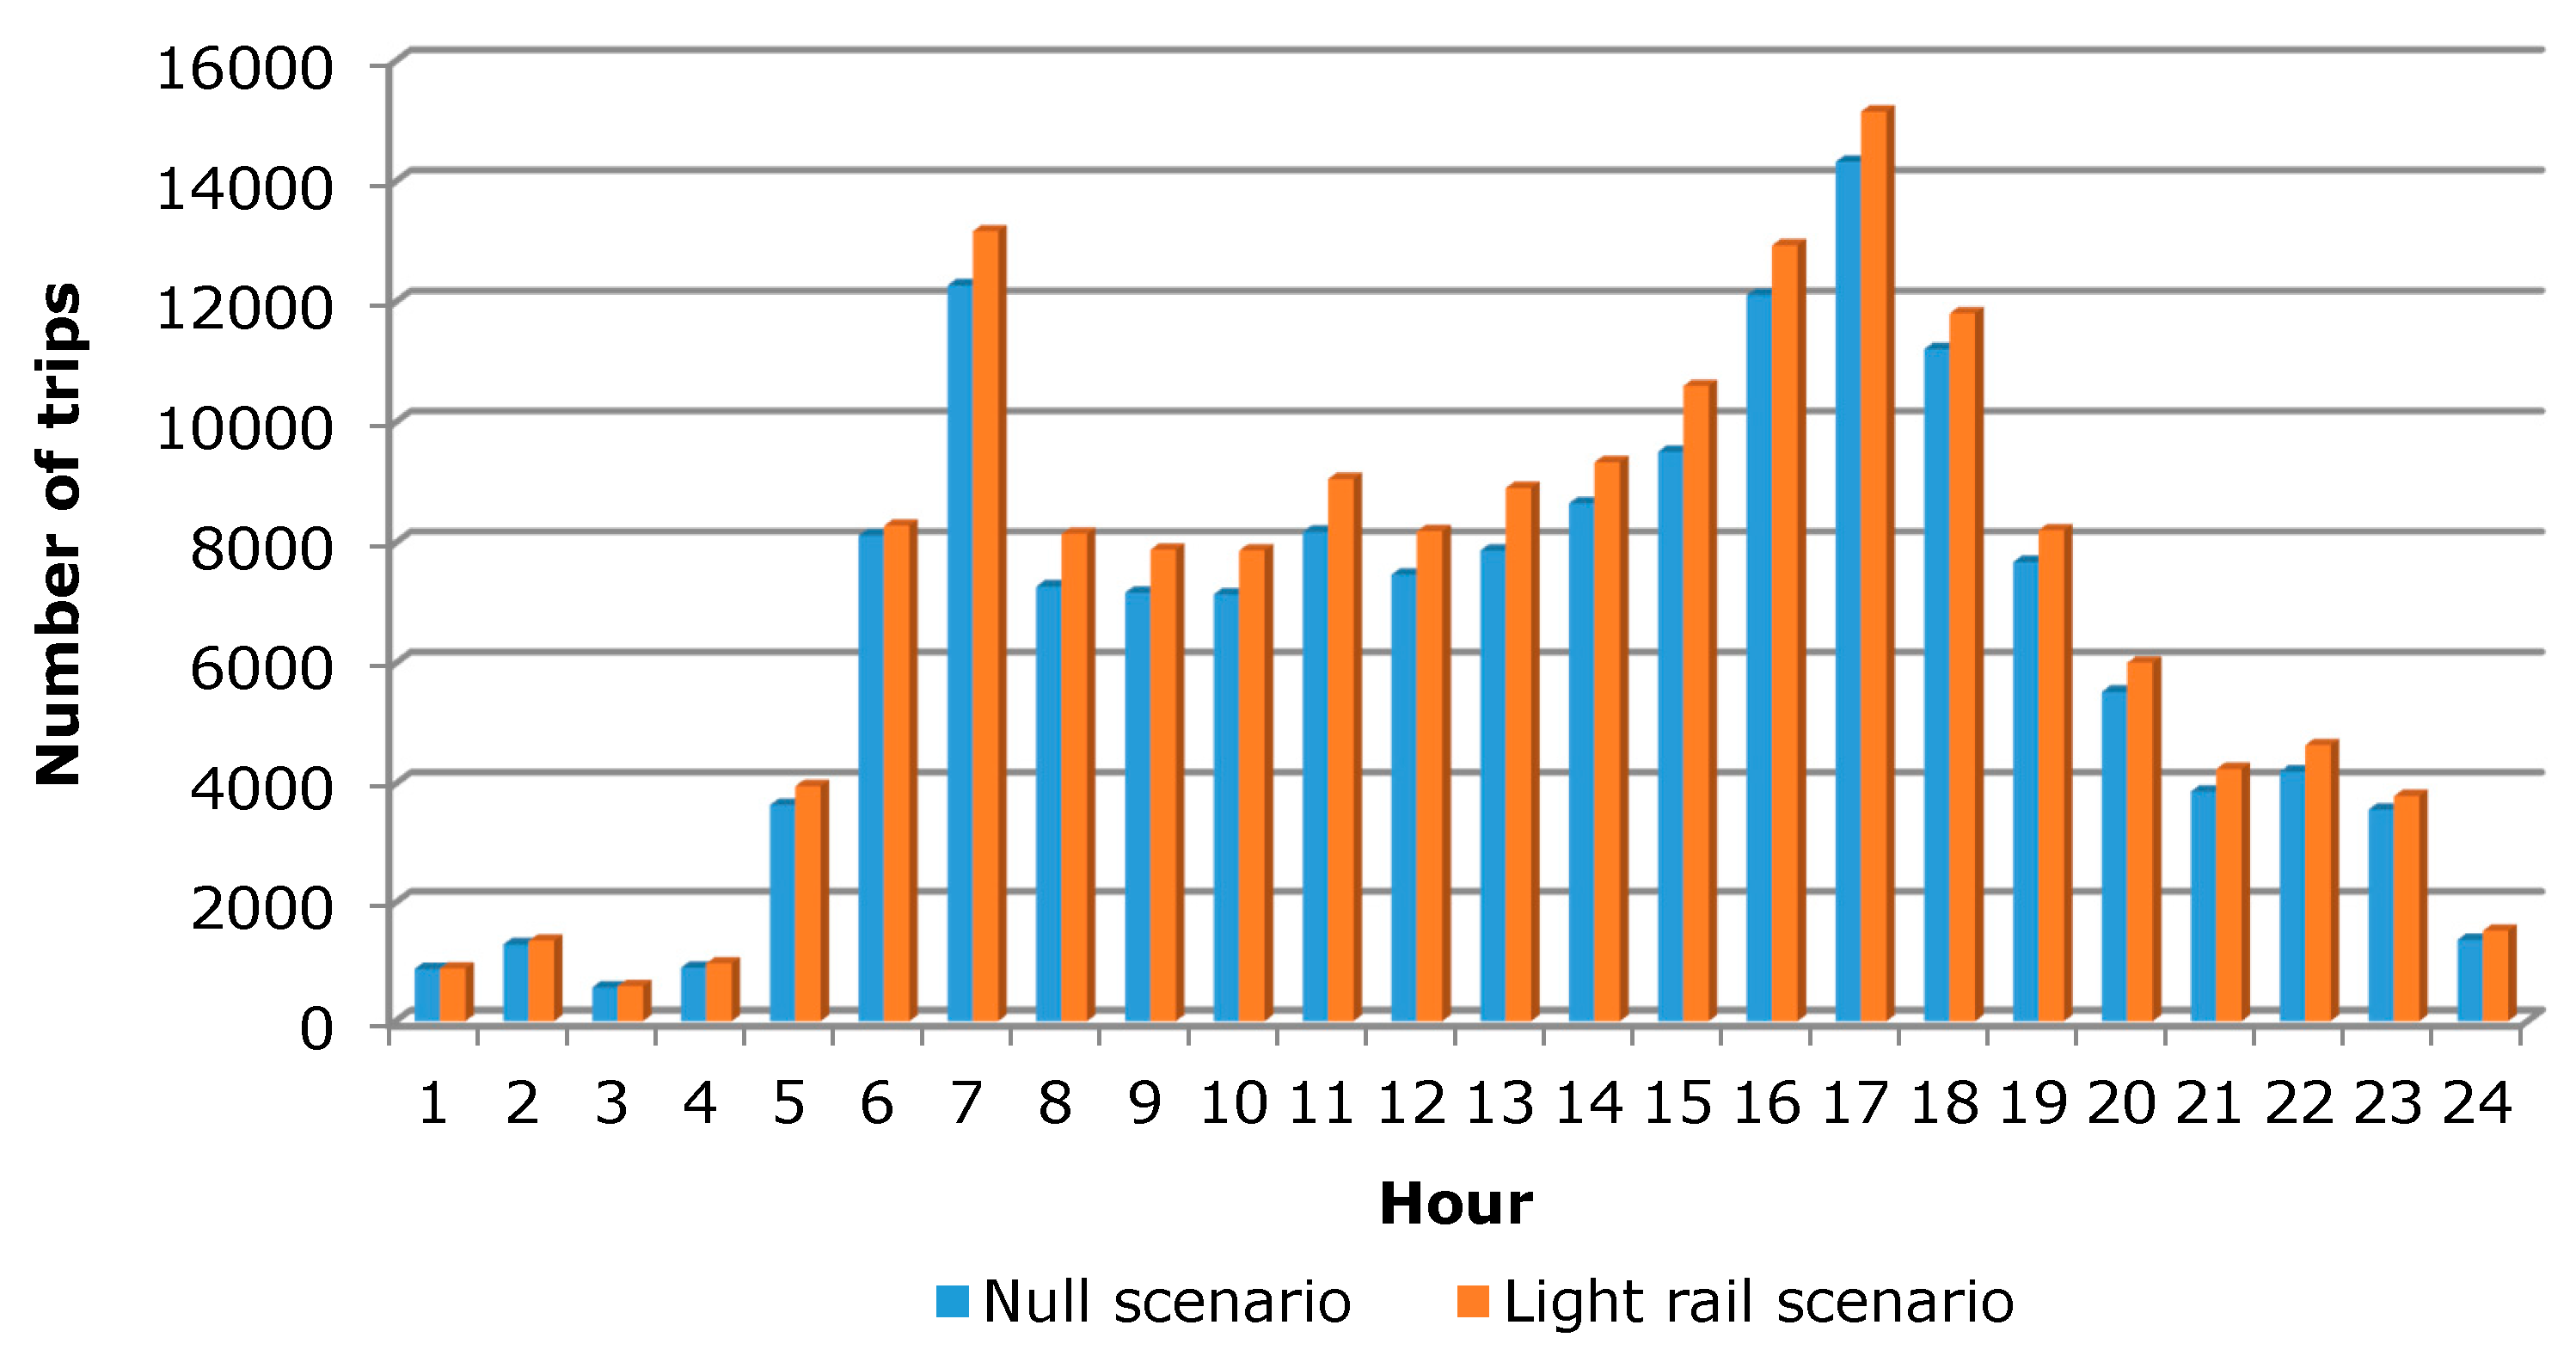
Based on the average value of the model outputs, we find that the addition of the light rail network has a relatively positive impact on public transport trips in Leuven, but a relatively negative impact on non-motorized modes such as cycling. The share of public transport trips increases by approximately 8% compared to the null scenario. The detailed change in the number of trips in each hour of the day is illustrated in Figure 5. On the other hand, non-motorized trips reduced by over 4%, probably due to the convenience of taking the light rail, which attracts some road users (such as cyclists) to change their mode of travel. However, concerning the car-related transport modes, including both the car as driver and car as passenger, the change in the number of related trips is negligible, since the value of zero is located within the difference range among the runs, which is [−0.13%, 0.57] and [−0.97%, 0.93%], respectively. Such a result implies that the implementation of a light rail system has only limited effects on car-related transport, especially in the short term.
6. Concluding Remarks
In this study, we applied the FEATHERS framework to investigate the potential impact of light rail initiatives on travel demand in a local network around the city of Leuven, assessed by comparing the predicted number of trips between the null scenario (i.e., the current situation) and the light rail scenario. In doing so, several model considerations were explored. First, the most disaggregated geographical level currently applicable in Belgium, i.e., the Building block level, was used to apply the FEATHERS framework, so that the most detailed travel demand information was guaranteed. Next, in order to reduce the computation time when applying FEATHERS on such a detailed geographical level, the minimum size of the study area that was required to perform accurate travel demand forecasting for the city of Leuven was determined, and it turned out that running the model in such a restrained study area improved the model’s operational efficiency significantly. In addition, by deducing the minimum number of model runs needed and computing the average value of the model outputs, the stochastic errors inherent to the FEATHERS framework were minimized. In the case study, the comparison of the results indicated that by integrating a light rail network into the current public transport network in Leuven, there would be a relatively positive impact on public transport, but a relatively negative impact on non-motorized trips in this area. However, no significant change was seen in car-related transport.
FEATHERS has proven to be a valuable toolbox for travel demand modeling and forecasting. However, challenges remain in further improving the performance of this modeling framework. First, any model is a simplified reflection of reality. It requires a series of assumptions in order to work and is limited by the data available to make forecasts. Therefore, the development of activity-based models requires careful and extensive data preparation procedures to construct entire sequences of activities. In this study, we extended the FEATHERS modeling system from a relatively broader geographical structure level (i.e., the Subzone level) to a more disaggregated territorial level (i.e., the Building block level). In doing so, a large amount of fundamental transportation system data was refreshed. However, at the BB level, most of these data were currently estimated based on the Flemish road (or public transport) network. Although this is a feasible solution for data generation, the quality of the data is questionable. In the future, to further improve the prediction accuracy of the model, the data should be updated once the exact values are available.
Second, it appeared in this study that the computation time of the model could be significantly reduced by restraining the size of the study area. In doing so, however, a tradeoff between the prediction accuracy and the running time is required. In the future, the best tradeoff between these two should be explored. In addition, other techniques may also be tried to reduce the computation time when applying FEATHERS, such as cloud computing approaches or data caching and multi-threading.
With regard to stochastic error, the results obtained in this study can be consulted as a reference for those who plan to use the FEATHERS framework. However, more aspects could be investigated. For instance, the impact of the population fraction on the stochastic errors should be studied. New insights could probably be gained by repeating the experiment based on the full population instead of the 50% fraction used in this study.
Finally, it should be noticed that this study only focused on one modeling framework. Generalization of the proposed methodologies and the findings to other activity-based travel demand models should therefore be a meaningful future research direction.
Author Contributions
Davy Janssens, Geert Wets, and Qiong Bao conceived and designed the concept; Qiong Bao, Bruno Kochan, Tom Bellemans worked on the model development; Qiong Bao, Yongjun Shen, Lieve Creemers analyzed the data; Qiong Bao and Yongjun Shen wrote the paper.
Conflicts of Interest
The authors declare that there is no conflict of interests regarding the publication of this article.
References
- Organization for Economic Co-operation and Development/International Transport Forum. ITF Transport Outlook 2017; Joint Transport Research Centre of the OECD and the ITF: Paris, France, 2017. [Google Scholar]
- Transportation Research Board. National Cooperative Highway Research Program (NCHRP) REPORT 716: Travel Demand Forecasting: Parameters and Techniques; TRB: Washington, DC, USA, 2012. [Google Scholar]
- McNally, M.G. The activity-based approach. In Handbook of Transport Modelling; Hensher, D.A., Button, K.J., Eds.; Elsevier Science: Oxford, UK, 2008; pp. 53–70. [Google Scholar]
- McNally, M.G. The four step model. In Handbook of Transport Modelling; Hensher, D.A., Button, K.J., Eds.; Elsevier Science: Oxford, UK, 2008; pp. 35–52. [Google Scholar]
- Jones, P.M.; Koppelman, F.S.; Orfueil, J.P. Activity analysis: State-of-the-art and future directions. In New Developments in Dynamic and Activity-Based Approaches to Travel Analysis; Jones, P.M., Ed.; Gower Publishing: Aldershot, UK, 1990; pp. 34–55. [Google Scholar]
- Malayath, M.; Verma, A. Activity based travel demand models as a tool for evaluating sustainable transportation policies. Res. Transp. Econ. 2013, 38, 45–66. [Google Scholar] [CrossRef]
- Bellemans, T.; Janssens, D.; Wets, G.; Arentze, T.A.; Timmermans, H.J.P. Implementation framework and development trajectory of Feathers activity-based simulation platform. Transp. Res. Rec. J. Transp. Res. Board 2010, 2175, 111–119. [Google Scholar] [CrossRef]
- Dons, E.; Beckx, C.; Arentze, T.A.; Wets, G.; Int Panis, L. Using activity-based framework to determine effects of a policy measure on population exposure to NO2. Transp. Res. Rec. J. Transp. Res. Board 2011, 2233, 72–79. [Google Scholar] [CrossRef]
- Knapen, L.; Kochan, B.; Bellemans, T.; Janssens, D.; Wets, G. Activity-based modeling to predict spatial and temporal power demand of electric vehicles in Flanders, Belgium. Transp. Res. Rec. J. Transp. Res. Board 2012, 2287, 146–154. [Google Scholar] [CrossRef]
- Galland, S.; Knapen, L.; Yasar, A.; Gaud, N.; Janssens, D.; Lamotte, O.; Koukam, A.; Wets, G. Multi-agent simulation of individual mobility behavior in carpooling. Transp. Res. Part C Emerg. Technol. 2014, 45, 83–98. [Google Scholar] [CrossRef]
- Bao, Q.; Kochan, B.; Shen, Y.; Bellemans, T.; Janssens, D.; Wets, G. Activity-based travel demand modeling framework FEATHERS: Sensitivity analysis with decision trees. Transp. Res. Rec. J. Transp. Res. Board 2016, 2564, 89–99. [Google Scholar] [CrossRef]
- Arentze, T.A.; Timmermans, H.J.P. Representing mental maps and cognitive learning in micro-simulation models of activity-travel choice dynamics. Transportation 2005, 32, 321–340. [Google Scholar] [CrossRef]
- Castiglione, J.; Freedman, J.; Bradley, M. Systematic investigation of variability due to random simulation error in an activity-based micro-simulation forecasting model. Transp. Res. Rec. J. Transp. Res. Board 2003, 1831, 76–88. [Google Scholar] [CrossRef]
- Arentze, T.A.; Timmermans, H.J.P. A learning-based transportation oriented simulation system. Transp. Res. Part B Methodol. 2004, 38, 613–633. [Google Scholar] [CrossRef]
- Bao, Q.; Kochan, B.; Bellemans, T.; Shen, Y.; Creemers, L.; Janssens, D.; Wets, G. Travel demand forecasting using activity-based modeling framework FEATHERS: An extension. Int. J. Intell. Syst. 2015, 30, 948–962. [Google Scholar] [CrossRef]
- Bao, Q.; Shen, Y.; Creemers, L.; Kochan, B.; Bellemans, T.; Janssens, D.; Wets, G. Investigating the minimum size of study area for an activity-based travel demand forecasting model. Math. Probl. Eng. 2015, 2015, 162632. [Google Scholar] [CrossRef]
- Rasouli, S. Uncertainty in Modeling Activity-Travel Demand in Complex Urban Systems. Ph.D. Thesis, Eindhoven University, Eindhoven, The Netherlands, 2015. [Google Scholar]
- Dowling, R.; Skabardonis, A.; Alexiadis, V. Traffic Analysis Toolbox Volume III: Guidelines for Applying Traffic Microsimulation Modeling Software; FHWA-HRT-04-040; FHWA, US Department of Transportation: Washington, DC, USA, 2004.
- Bao, Q.; Kochan, B.; Bellemans, T.; Janssens, D.; Wets, G. Investigating micro-simulation error in activity-based travel demand forecasting: A case study of the FEATHERS framework. Transp. Plan. Technol. 2015, 38, 425–441. [Google Scholar] [CrossRef]
Figure 1.
The proposed regional light rail network surrounding Leuven.
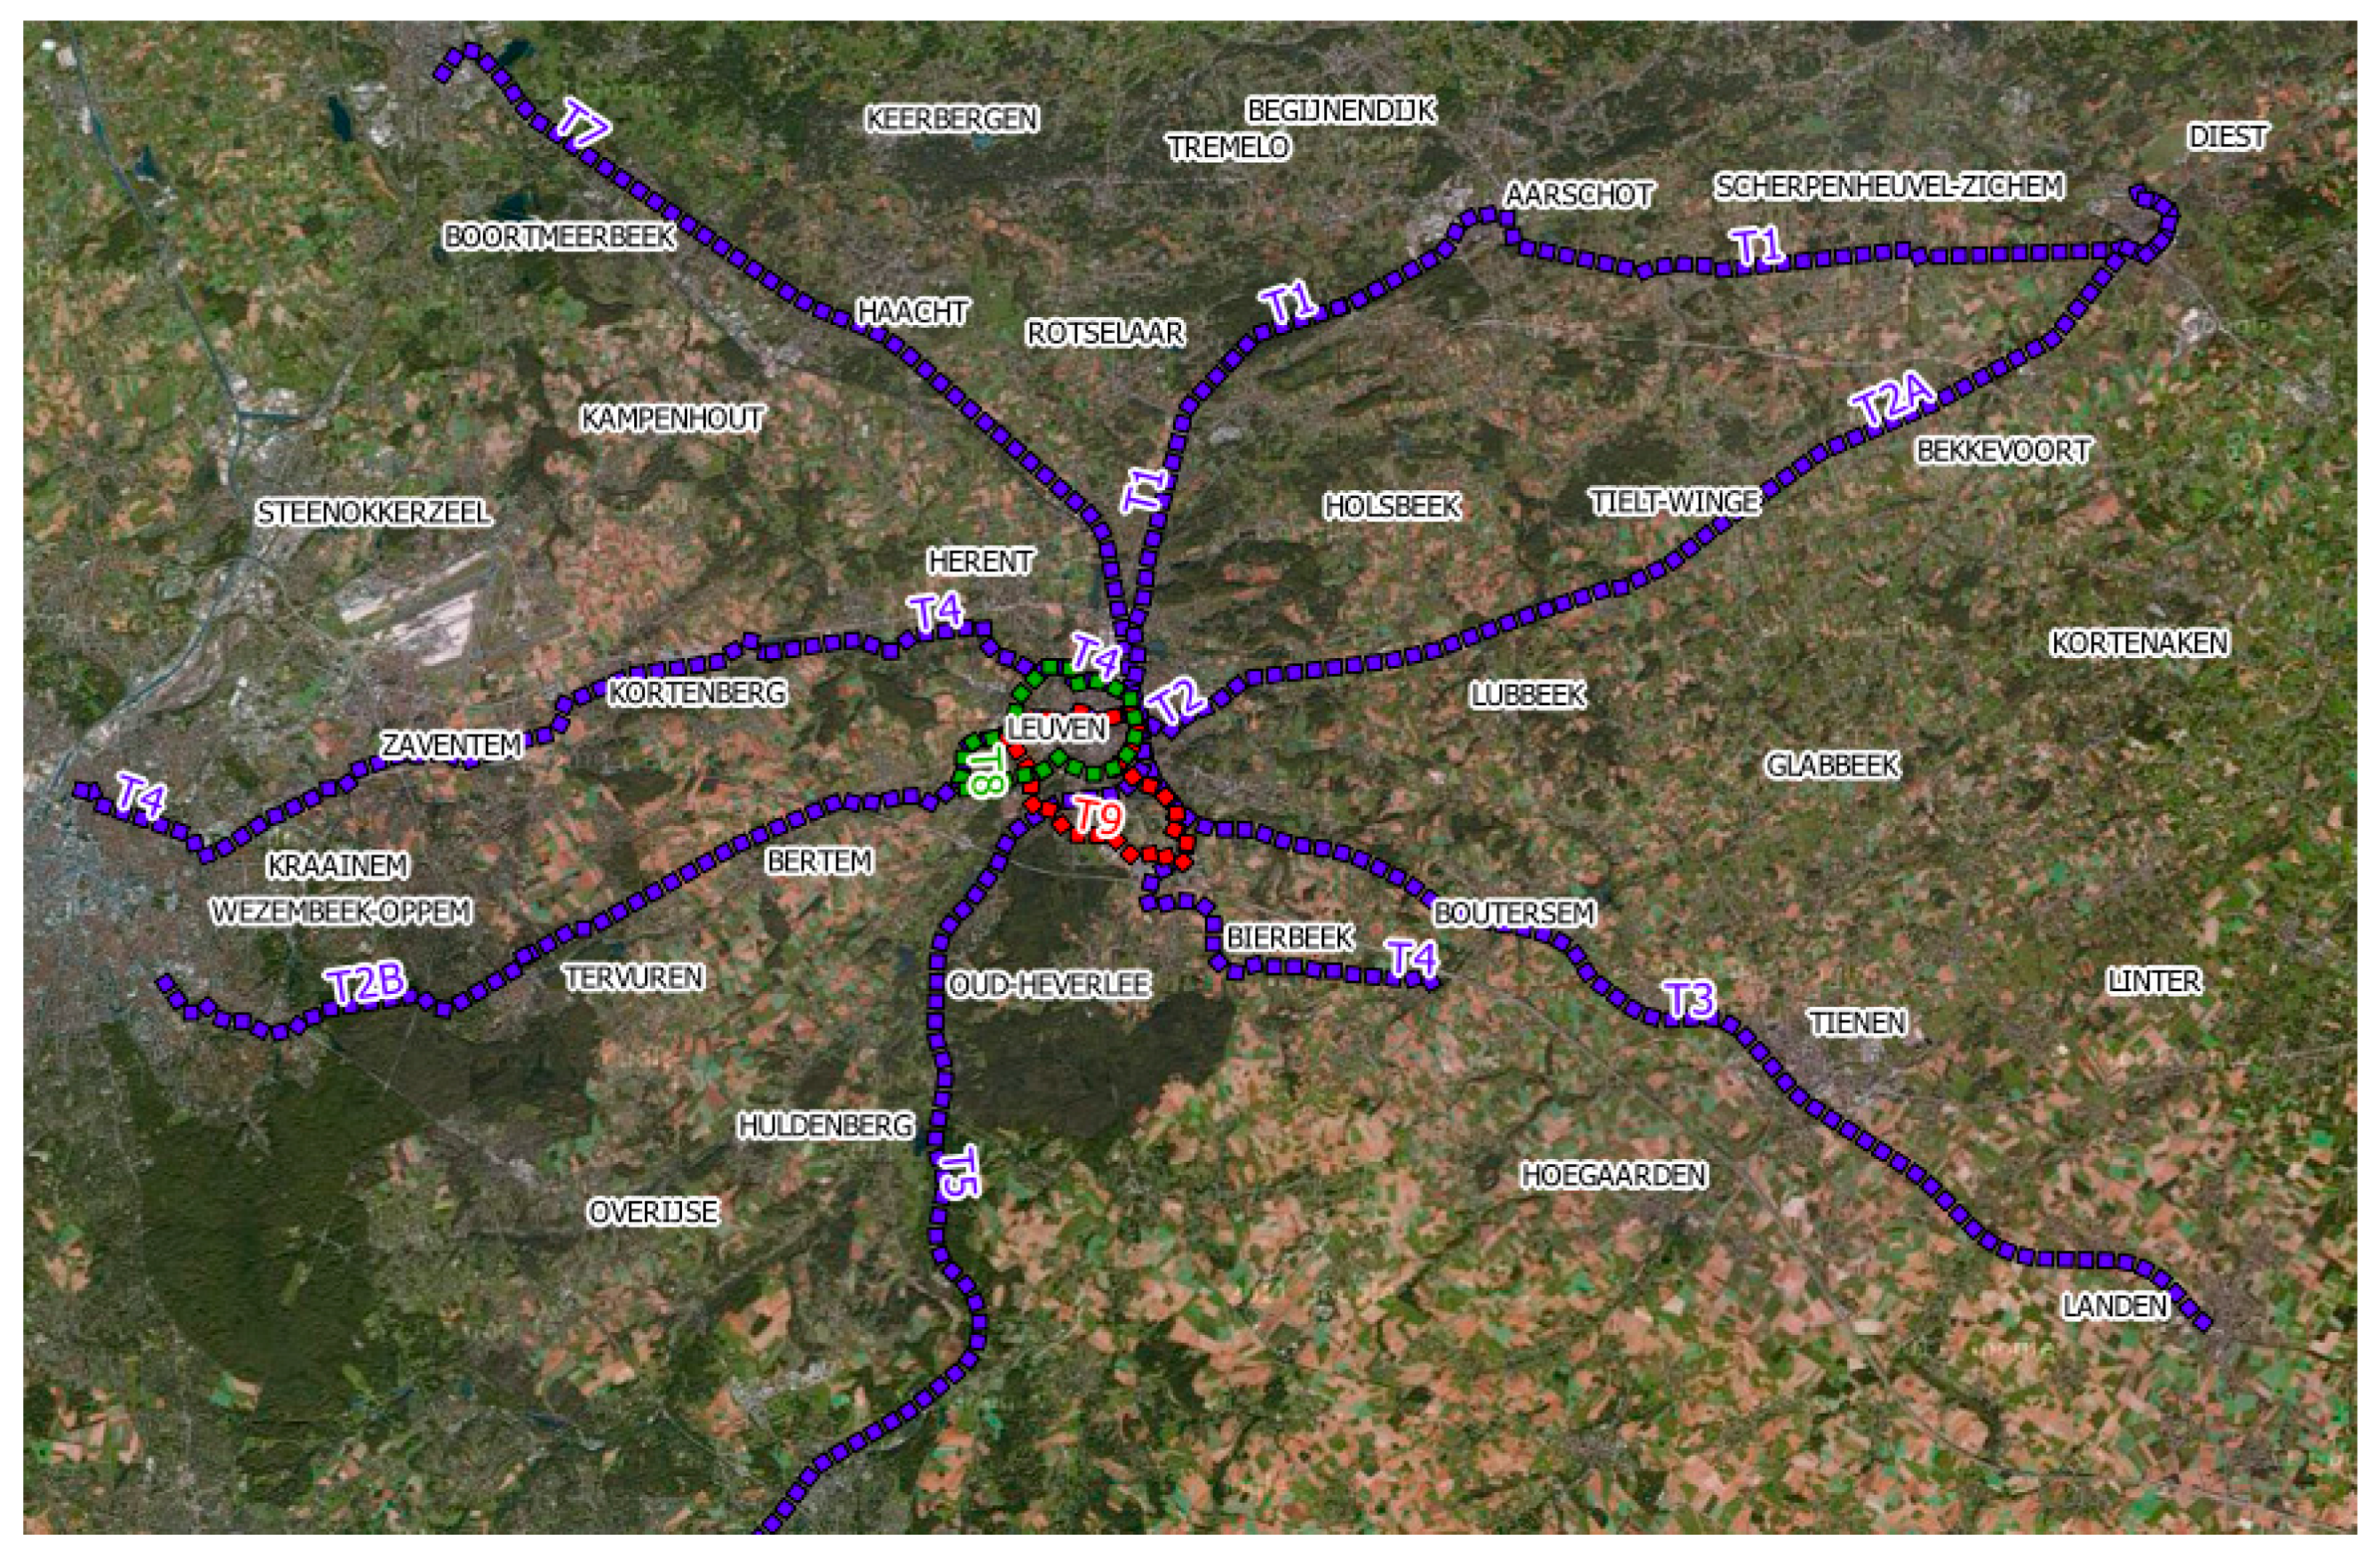
Figure 2.
Geographical structures of Subzone and BB zoning systems.

Figure 3.
Classification of Subzones and BBs in Leuven.
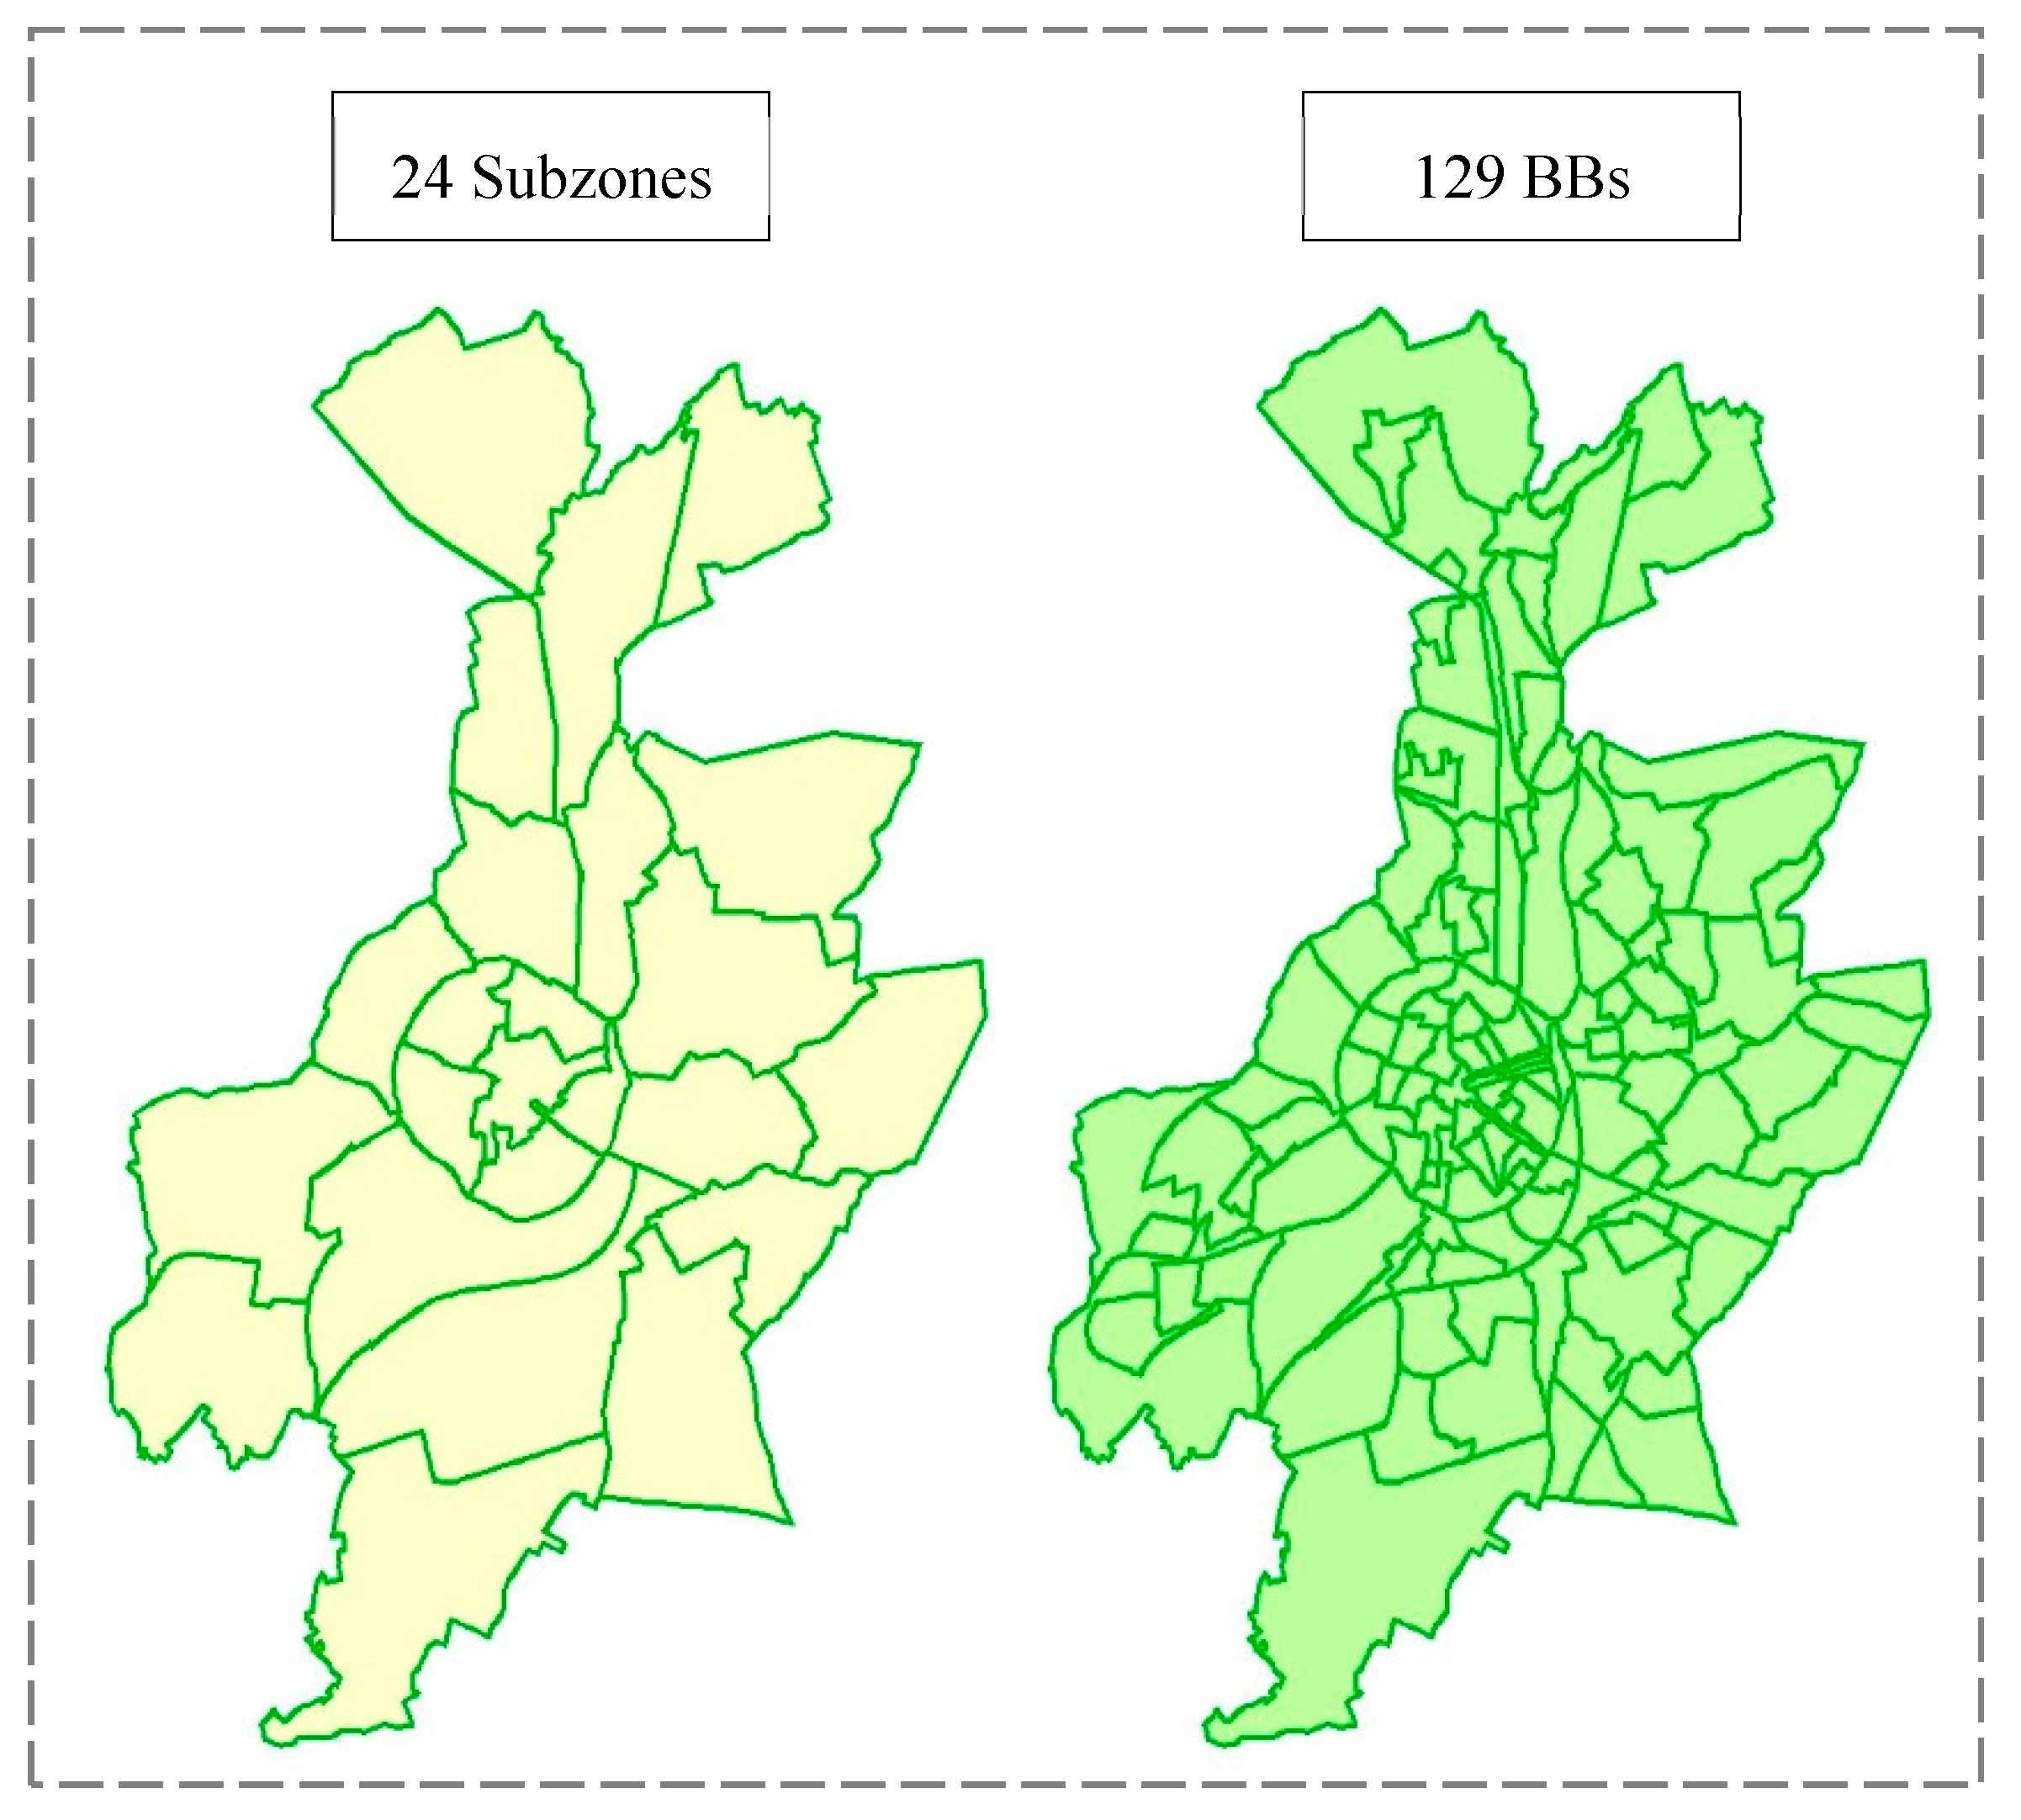
Figure 4.
The study area for the city of Leuven with regard to public transport mode.
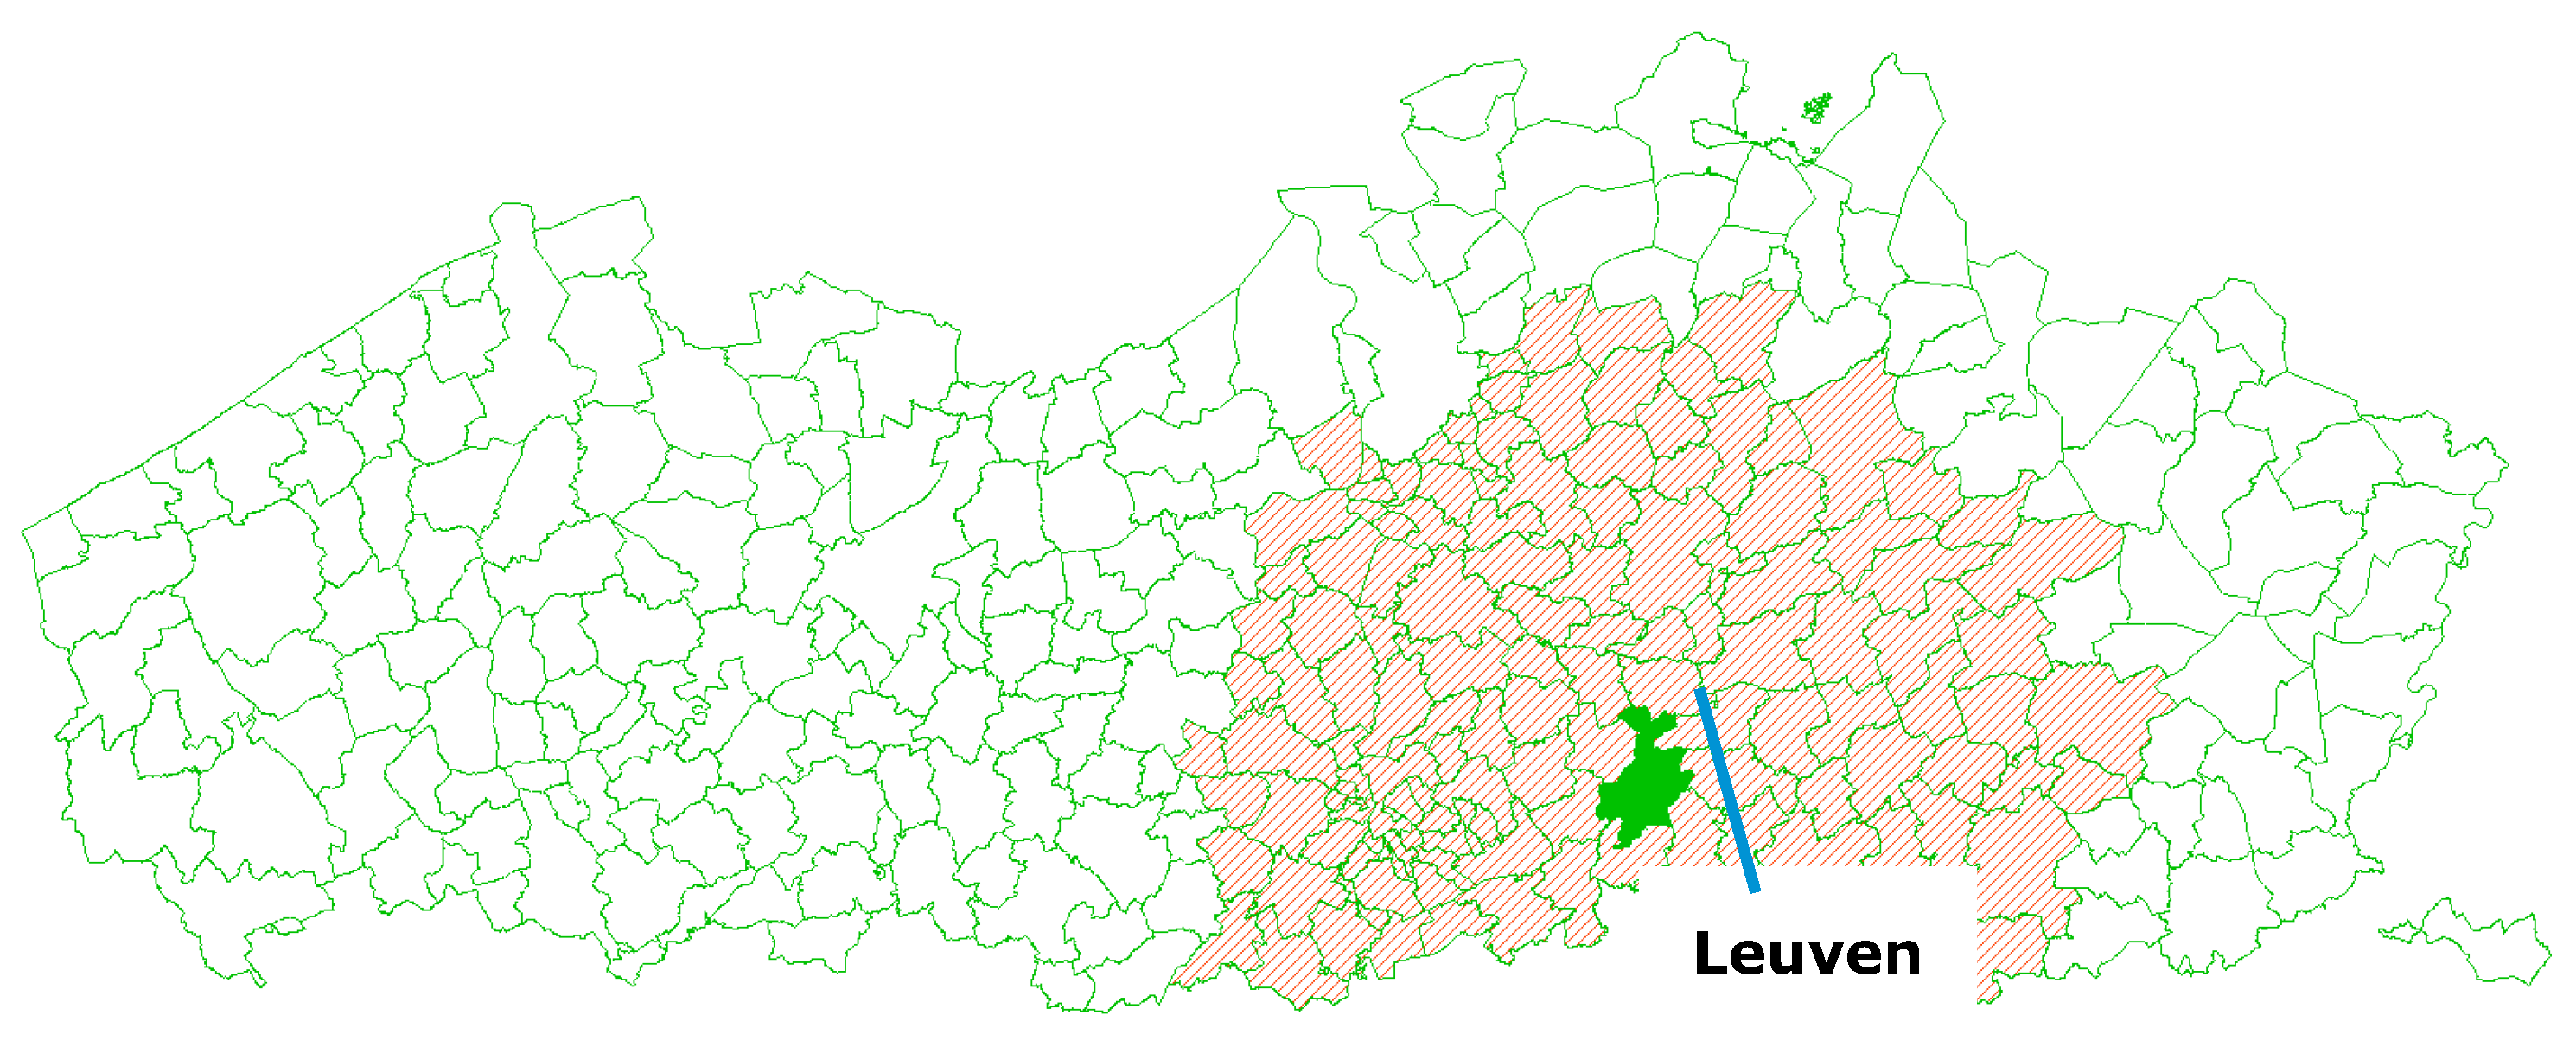
Figure 5.
The number of public transport trips in each hour based on two scenarios.

Table 1.
Comparison between the Leuven study area and the whole of Flanders with regard to public transport mode.
Table 1.
Comparison between the Leuven study area and the whole of Flanders with regard to public transport mode.
| Travel Mode | Study Area (SA) | No. of Persons within the SA (50%) | No. of Households within the SA (50%) | Running Time (Hour) | Accuracy Level | Time Saving |
|---|---|---|---|---|---|---|
| Public transport | Leuven SA | 1,021,660 | 633,216 | 28.8 | 89.6% | 55% |
| Flanders | 2,395,514 | 1,449,213 | 64.5 |
Table 2.
The number of model runs required to ensure each of the Superzones in the Leuven study area to be stable (with 95% level of confidence) with respect to the average daily number of trips per person.
Table 2.
The number of model runs required to ensure each of the Superzones in the Leuven study area to be stable (with 95% level of confidence) with respect to the average daily number of trips per person.
| No. of Super Zones | Super Zone ID | Required no. of Model Runs | No. of Super Zones | Super Zone ID | Required no. of Model Runs | No. of Super Zones | Super Zone ID | Required no. of Model Runs |
|---|---|---|---|---|---|---|---|---|
| 1 | 8 | 3 | 46 | 327 | 3 | 91 | 120 | 4 |
| 2 | 16 | 3 | 47 | 1 | 4 | 92 | 122 | 4 |
| 3 | 28 | 3 | 48 | 3 | 4 | 93 | 123 | 4 |
| 4 | 33 | 3 | 49 | 4 | 4 | 94 | 125 | 4 |
| 5 | 35 | 3 | 50 | 5 | 4 | 95 | 126 | 4 |
| 6 | 36 | 3 | 51 | 10 | 4 | 96 | 127 | 4 |
| 7 | 37 | 3 | 52 | 14 | 4 | 97 | 128 | 4 |
| 8 | 38 | 3 | 53 | 18 | 4 | 98 | 130 | 4 |
| 9 | 40 | 3 | 54 | 19 | 4 | 99 | 133 | 4 |
| 10 | 43 | 3 | 55 | 21 | 4 | 100 | 134 | 4 |
| 11 | 49 | 3 | 56 | 25 | 4 | 101 | 211 | 4 |
| 12 | 51 | 3 | 57 | 27 | 4 | 102 | 259 | 4 |
| 13 | 69 | 3 | 58 | 31 | 4 | 103 | 270 | 4 |
| 14 | 71 | 3 | 59 | 32 | 4 | 104 | 272 | 4 |
| 15 | 72 | 3 | 60 | 34 | 4 | 105 | 274 | 4 |
| 16 | 74 | 3 | 61 | 39 | 4 | 106 | 278 | 4 |
| 17 | 77 | 3 | 62 | 42 | 4 | 107 | 281 | 4 |
| 18 | 78 | 3 | 63 | 50 | 4 | 108 | 296 | 4 |
| 19 | 86 | 3 | 64 | 53 | 4 | 109 | 311 | 4 |
| 20 | 89 | 3 | 65 | 55 | 4 | 110 | 316 | 4 |
| 21 | 91 | 3 | 66 | 57 | 4 | 111 | 319 | 4 |
| 22 | 94 | 3 | 67 | 58 | 4 | 112 | 322 | 4 |
| 23 | 95 | 3 | 68 | 61 | 4 | 113 | 11 | 5 |
| 24 | 96 | 3 | 69 | 67 | 4 | 114 | 15 | 5 |
| 25 | 106 | 3 | 70 | 70 | 4 | 115 | 17 | 5 |
| 26 | 113 | 3 | 71 | 80 | 4 | 116 | 20 | 5 |
| 27 | 124 | 3 | 72 | 81 | 4 | 117 | 24 | 5 |
| 28 | 129 | 3 | 73 | 84 | 4 | 118 | 41 | 5 |
| 29 | 266 | 3 | 74 | 85 | 4 | 119 | 52 | 5 |
| 30 | 271 | 3 | 75 | 87 | 4 | 120 | 82 | 5 |
| 31 | 277 | 3 | 76 | 88 | 4 | 121 | 108 | 5 |
| 32 | 309 | 3 | 77 | 92 | 4 | 122 | 110 | 5 |
| 33 | 310 | 3 | 78 | 93 | 4 | 123 | 114 | 5 |
| 34 | 312 | 3 | 79 | 99 | 4 | 124 | 117 | 5 |
| 35 | 313 | 3 | 80 | 101 | 4 | 125 | 118 | 5 |
| 36 | 314 | 3 | 81 | 102 | 4 | 126 | 121 | 5 |
| 37 | 315 | 3 | 82 | 103 | 4 | 127 | 131 | 5 |
| 38 | 317 | 3 | 83 | 104 | 4 | 128 | 132 | 5 |
| 39 | 318 | 3 | 84 | 105 | 4 | 129 | 135 | 5 |
| 40 | 320 | 3 | 85 | 107 | 4 | 130 | 269 | 5 |
| 41 | 321 | 3 | 86 | 109 | 4 | 131 | 275 | 5 |
| 42 | 323 | 3 | 87 | 111 | 4 | 132 | 100 | 6 |
| 43 | 324 | 3 | 88 | 115 | 4 | 133 | 112 | 6 |
| 44 | 325 | 3 | 89 | 116 | 4 | 134 | 90 | 7 |
| 45 | 326 | 3 | 90 | 119 | 4 | 135 | 98 | 7 |
Table 3.
The comparison of daily travel demand on different traffic modes based on two scenarios.
| Car as Driver | Car as Passenger | Non-Motorized Mode | Public Transport | ||
|---|---|---|---|---|---|
| Null scenario | Run1 | 1,384,997 | 333,402 | 818,210 | 154,913 |
| Run2 | 1,386,325 | 332,784 | 818,387 | 155,000 | |
| Run3 | 1,383,779 | 332,003 | 820,958 | 154,692 | |
| Run4 | 1,383,371 | 333,463 | 815,492 | 156,014 | |
| Run5 | 1,384,407 | 334,249 | 817,158 | 154,650 | |
| Run6 | 1,384,264 | 333,080 | 818,885 | 154,290 | |
| Run7 | 1,380,316 | 333,205 | 816,984 | 155,437 | |
| Average | 1,383,923 | 333,169 | 818,011 | 154,999 | |
| Light rail scenario | Run1 | 1,384,585 | 334,431 | 779,447 | 167,609 |
| Run2 | 1,386,632 | 335,106 | 781,763 | 166,223 | |
| Run3 | 1,386,480 | 331,012 | 780,364 | 167,564 | |
| Run4 | 1,386,265 | 333,690 | 782,130 | 167,427 | |
| Run5 | 1,388,175 | 332,199 | 781,431 | 166,685 | |
| Run6 | 1,385,187 | 333,697 | 781,025 | 167,742 | |
| Run7 | 1,388,022 | 332,826 | 779,965 | 166,980 | |
| Average | 1,386,478 | 333,280 | 780,875 | 167,176 | |
| % change among the runs | [−0.13%, 0.57%] | [−0.97%, 0.93%] | [−5.06%, −4.09%] | [6.54%, 8.72%] | |
| % change between the average values | 0.18% | 0.03% | −4.54% | 7.86% |
© 2018 by the authors. Licensee MDPI, Basel, Switzerland. This article is an open access article distributed under the terms and conditions of the Creative Commons Attribution (CC BY) license (http://creativecommons.org/licenses/by/4.0/).
Share and Cite
MDPI and ACS Style
Bao, Q.; Kochan, B.; Shen, Y.; Creemers, L.; Bellemans, T.; Janssens, D.; Wets, G. Applying FEATHERS for Travel Demand Analysis: Model Considerations. Appl. Sci. 2018, 8, 211. https://doi.org/10.3390/app8020211
AMA Style
Bao Q, Kochan B, Shen Y, Creemers L, Bellemans T, Janssens D, Wets G. Applying FEATHERS for Travel Demand Analysis: Model Considerations. Applied Sciences. 2018; 8(2):211. https://doi.org/10.3390/app8020211
Chicago/Turabian StyleBao, Qiong, Bruno Kochan, Yongjun Shen, Lieve Creemers, Tom Bellemans, Davy Janssens, and Geert Wets. 2018. "Applying FEATHERS for Travel Demand Analysis: Model Considerations" Applied Sciences 8, no. 2: 211. https://doi.org/10.3390/app8020211
Note that from the first issue of 2016, this journal uses article numbers instead of page numbers. See further details here.