Applicability of Emotion Recognition and Induction Methods to Study the Behavior of Programmers


Department of Software Engineering, Faculty Of Electronics, Telecommunications and Informatics, Gdansk University of Technology, 80-233 Gdańsk, Poland
Appl. Sci. 2018, 8(3), 323; https://doi.org/10.3390/app8030323
Submission received: 22 December 2017
/
Revised: 7 February 2018
/
Accepted: 24 February 2018
/
Published: 26 February 2018
(This article belongs to the Special Issue Socio-Cognitive and Affective Computing)
Abstract
:Recent studies in the field of software engineering have shown that positive emotions can increase and negative emotions decrease the productivity of programmers. In the field of affective computing, many methods and tools to recognize the emotions of computer users were proposed. However, it has not been verified yet which of them can be used to monitor the emotional states of software developers. The paper describes a study carried out on a group of 35 participants to determine which of these methods can be used during programming. During the study, data from multiple sensors that are commonly used in methods of emotional recognition were collected. The participants were extensively questioned about the sensors’ invasiveness during programming. This allowed us to determine which of them are applicable in the work of programmers. In addition, it was verified which methods are suitable for use in the work environment and which are only suitable in the laboratory. Moreover, three methods for inducing negative emotions have been proposed, and their effectiveness has been verified.
1. Introduction
In the age of global information, it is of paramount importance to provide reliable and high-quality software at a reasonable cost and duration. Because of the continuous increase in the number of IT projects, the demand for information and communication technology (ICT) specialists is steadily growing [1]. Software development companies already have difficulties in recruiting specialists with the required knowledge and experience [2]. One of the solutions to the problem of an insufficient workforce in the ICT sector may be to increase employee productivity.
Introducing affect awareness in software development management may be one of the solutions to this problem. Recent research has already shown that, in IT projects, positive emotions increase productivity, while negative emotions can significantly reduce performance [3,4,5,6,7]. Affect-aware IT project management can help software developers stay productive as well as detect when emotions, such as frustration, reduce their performance [5]. However, to bring these ideas to life, tools to recognize the emotions of software developers while working are essential.
The affective computing domain has provided many methods and tools for recognizing the emotions of computer users. However, it has not been verified yet whether they can be used to monitor the emotions of programmers during their daily work and to what extent. Moreover, some of them, as a result of their invasiveness or cost, are not suitable for use in a work environment and can be used only in a laboratory.
Spontaneous emotions cannot be expected during laboratory experiments. Therefore, to study the emotional states of programmers in such an environment, they should be induced somehow. Only the induction of negative emotions was considered. Previous studies have shown that it is more efficient than in the case of positive emotions [8].
The aim of the study is to review the available emotion recognition methods for their use in a software development environment. In addition, selected methods of stimulating emotions during programming in a laboratory environment have been evaluated. Three research questions have been formulated:
- RQ1
- What methods and tools known from affective computing research can be used to recognize the emotions of programmers in a laboratory environment?
- RQ2
- Which of the identified methods are suitable for programming in a real working environment?
- RQ3
- How can the negative emotions of programmers be induced in a laboratory environment?
2. Related Work
So far, several studies, which involved emotion recognition of members of IT teams, have been conducted in the field of software engineering. Numerous attempts were made to identify emotions using various available channels.
The most comprehensive research on utilizing physiological sensors during software developers’ work was conducted by Müller and Fritz [5,9,10]. During their study [5] on 17 software developers, they collected the following data: electroencephalography (EEG) data using a Neurosky MindBand sensor, temperature, electrodermal activity (EDA) and blood volume pulse (BVP) using an Empatica E3 wrist band, and eye-tracking data using Eye Tribe. The results of the experiment showed that the EDA tonic signal, the temperature, the brainwave frequency bands, and the pupil size were the most useful predictive factors to classify the progress of software developers, and brainwave frequency bands, the pupil size, and heart rate were the most useful to classify their emotions. Nevertheless, they noted strong individual differences with respect to the correlation and classification of physiological data [5]. Similar differences have also been found in our other studies on the use of sensors to monitor the physiology of computer game players [11].
Müller and Fritz, along with Begel, Yigit-Elliott and Züger, also conducted an experiment to classify the difficulty of source code comprehension tasks using the same set of input channels. They stated that it is possible to use off-the-shelf physiological sensors in order to predict software developer task difficulty [12].
Facial electromyography (fEMG) is commonly regarded as a reliable method for measuring emotional reactions [13]. Ten et al. have proved, in an experiment with 20 participants, that fEMG activities are effective and reliable indicators of negative and positive emotions [14]. Bhandari et al. successfully used fEMG, along with EDA, to determine emotional responses during an evaluation of mobile applications [15].
Eye-tracking methods have previously been successfully used in other research in the software engineering domain [16,17,18,19,20]. For example, Bednarik and Tukiainen proved the usefulness of eye-movement tracking in a study of the comprehension processes of programmers [21]. An eye-tracking environment (iTrace) has been developed to facilitate eye-tracking studies in software systems [22].
One of the most popular methods of recognizing emotions is the analysis of facial expressions [23,24,25]. It has gained popularity mainly as a universal and non-invasive approach. Algorithms analyze video frames to identify face muscle movements and, on the basis of the Facial Action Coding System (FACS) [26], assess the user’s emotional state. Successful attempts are also made to identify emotions on the basis of voice [27]. There are even frameworks that allow such an analysis to be performed [28]. A relatively new approach, which can be well suited for recognizing the emotions of programmers, uses keystroke dynamics and mouse movement analysis. It is completely non-intrusive and does not require any additional hardware [29]. There have already been attempts to use this method to monitor software developers [30].
The only channel used in previous research (e.g., [31,32]) that was excluded from the presented study was EEG. The Biometric Stand [33], on which the experiment was conducted, contains only a 3-channel EEG sensor that does not provide reliable data.
A number of studies have also been conducted on the use of sentiment analysis techniques to identify emotions on the basis of IT project artifacts (e.g., [34,35]). However, the purpose of this study was to check the ability to recognize emotions of developers while working, and therefore these methods have not been included.
3. Study Design
The aim of the study was to determine which of the methods can be used to detect the emotions of programmers. Emotion recognition methods are based on data received from one or more channels. For example, methods based on the analysis of facial expressions use video camera images, and methods based on the analysis of the physiological response of the human body use data from biosensors.
For the purpose of this study, the following input channels were selected on the basis of the analysis of methods used in the presented research in the field of software engineering:
- Video
- Audio
- Biosensors:
- -
- Skin conductance
- -
- Heart rate
- -
- Respiration
- -
- fEMG
- Computer keyboard and mouse movements
During the study, the participants were asked to solve simple algorithmic tasks in the Java language using a popular integrated development environment (IDE). While the participants were solving tasks, data were collected from multiple channels. At the same time, activities were performed to elicit the emotions of the developers. Before the study, the participants were informed about the purpose of the study but were not aware of attempts to influence their emotional states.
The study was designed to be conducted at a biometric stand in the Laboratory of Innovative IT Applications at Gdansk University of Technology (GUT). The room was divided into one part for the participant and one part for the observer, separated by an opaque partition (Figure 1). On the participant’s desk there was a monitor, a keyboard and a mouse connected to the computer on which the tasks were performed. The computer itself was physically located in the second part of the room; it is labeled as Computer 2 on Figure 1. In addition, a video camera was located in front of the participant at the top of the monitor, followed by a lighting set, supplied with Noldus FaceReader software, which was used to recognize emotions on the basis of facial expressions [36]. Underneath the monitor, a myGaze Eye Tracker device was situated. A number of sensors were attached to the participant and were linked through the Coder FlexComp Infiniti by the Thought Technology analytical device with Computer 1, which was located in the observer’s area. The BioGraph Infiniti application, developed by Thought Technology, was running on this computer and allowed visualization, pre-processing and exporting of the data from the physiological sensors. The observer also had a monitor, mouse, and keyboard connected to the participant’s Computer 2. This allowed the observer to interfere in the activities of the participant. On Computer 2, Morae Recorder software was installed, which recorded the participant’s desktop image, mouse movement, and fixation from the eye tracker. There was also a data acquisition program for keystroke analysis available on the same computer [30]. Computer 3 was used to collect all other data useful for the recognition of emotions, including recordings from the video camera and the microphone located in front of the participant.
3.1. Plan of the Study
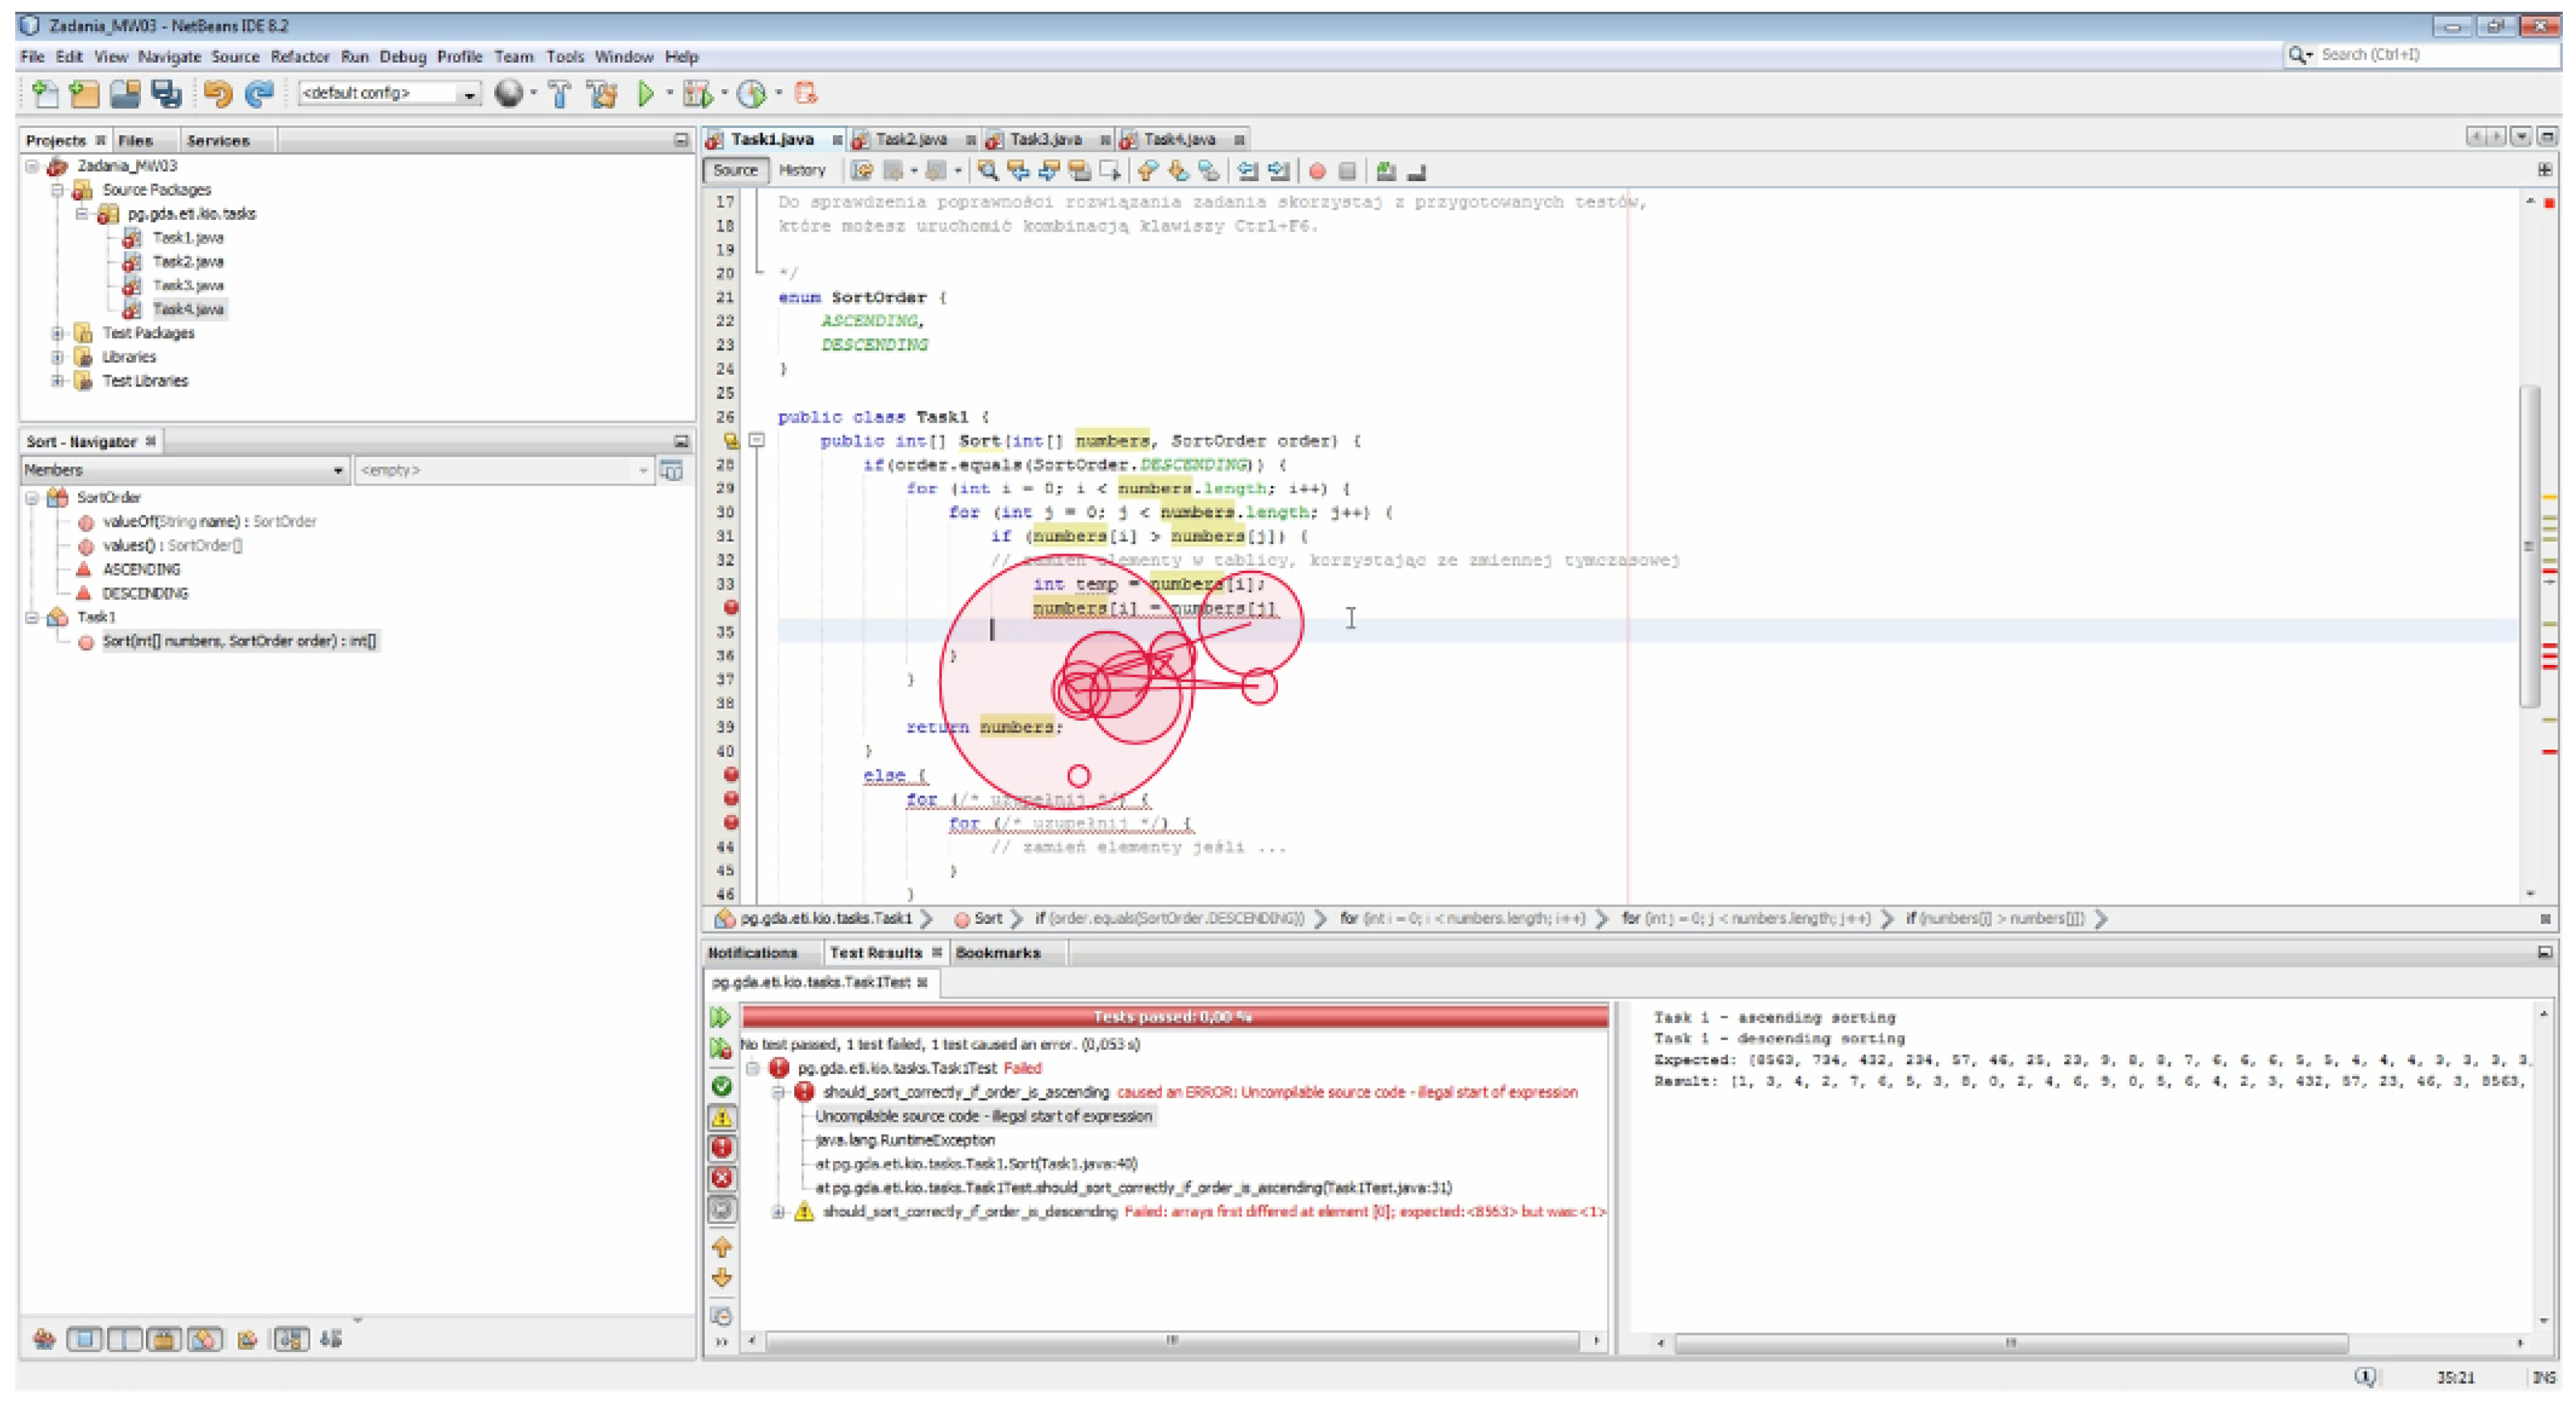
The study was organized in the form of consecutive sessions. During a session, the participant individually solved four programming tasks. Each participant took part in only one session; therefore, the number of sessions was equal to the number of participants. The purpose of each task was to solve one algorithmic problem. For each, the Java program was prepared, and then the key fragments of the source code were removed. The participant’s goal was to complete the program code in the NetBeans environment and validate the solution by running a unit test, prepared for the purpose of this study.
During the session, the participant had to solve the following problems:
- Sort the array using the bubble sort algorithm (Appendix A.1).
- Return the indicated position within the Fibonacci sequence (Appendix A.2).
- Check if the word is a palindrome (Appendix A.3).
- Transpose a matrix (Appendix A.4).
To solve the first three tasks, the participants had a maximum of 5 min, and they had 3 min for the last task. Including the time necessary for the introduction and switching of the sensors, as well as the completion of the final questionnaire, the duration of the session was estimated at 40 min.
During the session, data was logged from channels that may be useful in the process of recognizing emotions. Before the participant started solving the tasks, the eye tracker was calibrated and the video camera was adjusted. During the session videos from the camera, eye-tracking data, microphone sound and mouse and keyboard patterns were constantly recorded. To verify the physiological sensors’ obtrusiveness, they were switched on during the subsequent tasks. Only the respiration sensor, as the least onerous, was attached during all the tasks. During the first task, an EDA sensor was connected; during the second, fEMG was used; and during the third, BVP was used. The fourth task was carried out without any additional sensor.
After completing each task, the participants were asked to self-assess their emotional state using the Self-Assessment Manikin (SAM) [37]. Figure 2 presents the assessment form integrated with NetBeans, which was prepared for the purpose of the study. The top panel shows the happy–unhappy scale, which ranges from a smile to a frown. The middle panel corresponds to an excited-to-calm scale. Finally, the bottom scale reflects whether the participant feels controlled or in control. The SAM form is a recognized method of assessing the emotional state in the three-dimensional valence, arousal and dominance (VAD) scale.
3.2. Negative Emotion Induction
On the basis of the classification of emotion induction techniques proposed by Quigley et al. [38], the “real-world stimuli” technique was chosen. Three methods were applied that reflected the situations occurring in the working environment of software developers that are associated with negative emotions.
The participants performed their tasks using the NetBeans IDE. The functionality of this environment was enhanced with a plug-in called MaliciusIDE, which was developed for the purpose of this study. This allowed malice to be generated that would interfere with the participant during coding. During the study, malfunctions such as suspending a program for a specified number of seconds, duplicating the characters entered, or moving the mouse cursor were triggered manually via a Web interface running on Computer 3. This Wizard-of-Oz (WOZ) technique was implemented to ensure an appropriate number of events. Too few occurrences might not have induced emotions, but too many could have led to the disclosure of the malicious activity of the observer. Preliminary tests were conducted with automatically triggered malices. Their results revealed an insufficient number of malicious events that were noticed by the participants. For example, users did not notice that the content of the clipboard had been cleaned, because it was not used in a particular task.
For the second task, the goal of which was to return an indicated element of the Fibonacci sequence, an incorrect test case was prepared. Even in spite of the correct solution, the participants were always informed that the program had returned incorrect output. The purpose of such an action was to create confusion and consequently irritability and discouragement.
During the last task, an attempt was made to put time pressure on the participant. After 2 min, a beep signal was generated imitating the observer receiving the message. The participant was informed that the test had to be shortened and that he or she should try to finish the task within 1 min.
3.3. Questionnaire
After completing all tasks and disconnecting the sensors, the participant was asked to complete a survey implemented using the Google Forms service. The purpose of the questionnaire was to gather information on the participants’ feelings about the methods of recognizing and inducing emotions.
The survey consisted of seven questions (Appendix B). In the first question, using the seven-level Likert scale, the participants assessed the nuisance of particular emotion recognition methods. A value of 1 corresponded to the claim that the sensor was unnoticeable, and a value of 7 corresponded to it having made the work completely impossible.
In the second question, the participants were asked to indicate which of the applied methods could be used in the daily work of programmers. In the next question, the participants reported which emotions were triggered by the emotion-inducing methods.
In the remaining questions, the participants answered how often they express emotions aloud, whether a wristwatch is intrusive during prolonged periods of typing, how often in real work an emotional self-assessment form could be used, and whether they would agree to investigate their emotional state during their daily work.
4. Execution and Results
The study was conducted in April and May 2017 at the Gdansk University of Technology, Poland. Altogether, 35 undergraduate computer science students, 6 women and 29 men, participated in the study. A single session lasted between 30 and 45 min, depending on the pace at which individual tasks were solved and the number of additional questions. Sample pictures of the participants during the study are shown in Figure 3.
4.1. Availability
In order to check the possibility of using eye-tracking and video recording to recognize emotions of programmers, the availability metrics AV_EYE and AV_VIDEO, respectively, were introduced. For eye tracking, the AV_EYE metric was defined as the percentage of time for which the pupil’s readings per minute were above the assumed sample quality threshold. Depending on the required accuracy of the measurements, four thresholds were presented, as shown in Table 1. Over most of the time (64.50%), the device recorded more than 29 readings per minute, with the sampling rate of the device at 30 Hz. Only 3.68% of the 1 min periods were without even a single detected fixation point, and 11.28% were with less than 10. The device did not recognize the position of the pupils when the head was tilted too far over the keyboard and also when the head was turned in one direction or the other. However, the collected data was sufficient to generate video clips with fixations and saccades during the solving of the tasks, as shown in Figure 4.
Clips from the camera that recorded the faces of the participants were analyzed using Noldus FaceReader software. This recognizes emotional states on the basis of the FACS. For each video frame, the tool provides results as intensiveness vectors for the following emotions: joy, anger, fear, disgust, surprise, sadness and a neutral state. In the case of an error, instead of numerical values, the label FIND_FAILED is returned if the face cannot be detected on the frame, and FIT_FAILED is returned when the emotion cannot be recognized. In order to assess the accessibility of video-based emotion recognition of software developers during work, three metrics were proposed:
- AV_VIDEO—percentage of time for which emotion was recognized.
- FINDF—percentage of time for which a face was not detected.
- FITF—percentage of time for which the face was detected, but no emotion was recognized.
The results are shown in Table 2. The average availability across the samples exceeded 77%. However, a thorough analysis of the provided data has shown that the algorithm implemented in the Noldus FaceReader software had a major problem with recognizing the emotions of people with glasses. In this case, the availability decreased to just 55%, whereas for the remaining cases, it equaled 85% (Table 3). Other factors that reduced availability were fringes that partially covered the eyes, beards and moustaches (e.g., participant P21). Therefore, to obtain the best accuracy, the recognition of emotions on the basis of facial expressions can only be used for programmers without glasses or facial hair.
4.2. Disturbance
On the basis of the questionnaire survey (Appendix B), the degree of disturbance of individual data collection methods was assessed. All methods were evaluated using the seven-level Likert scale, where a value of 1 corresponded to the claim that the method was unnoticeable, and a value of 7 indicated that it made the work impossible. Figure 5 shows the compilation of response distributions for all the examined channels.
Among the physiological sensors used in the study, the respondents pointed to the EDA sensor placed on the wrist as being the least cumbersome. As many as 16 respondents indicated that it was completely unnoticeable during coding, while only 3 were moderately disturbed.
The next two sensors, a respiration device placed on the chest and a BVP placed on the earlobe, were also rated as slightly intrusive. The last physiological sensor, the fEMG device, was considered the most cumbersome.
Other methods of collecting data for the purpose of emotion recognition were found by most respondents to be almost completely unnoticeable. Because of the bright light set, the camera that recorded the participant’s face was evaluated slightly worse. However, the result of the assessment was still lower than the rating of the least intrusive physiological sensor.
Among all the tested methods of emotional recognition, the participants indicated the eye tracker as being the most acceptable in everyday work. Only one person did not indicate this method. Over half of the respondents reported that they would not be disturbed by collecting mouse movements and typing patterns (85.7%), by video camera recording (65.7%), by SAM (62.9%) or by EDA (62.9%). On the other hand, almost every respondent reported that the electromyographic sensor attached to the face would not usable in the work environment.
The respondents also revealed how often they thought the SAM questionnaire could be used in their daily work. The vast majority (71.4%) indicated that such data could be collected twice a day, for example, while starting and closing the IDE.
In view of the growing smart-watch market, the question as to whether a wrist watch interferes with the daily work of a software developer was raised. Over half of the respondents indicated that it is only slightly intrusive, and only four indicated otherwise. The detailed distribution of the response is shown in Figure 6.
Over 60% of the respondents stated that they often or very often express their emotions verbally while programming. Only seven claimed that they do so rarely or very rarely. However, during the study, no participants except one expressed their emotions this way. Therefore, voice recordings were not analyzed further.
4.3. Inducing Negative Emotions
According to the plan, attempts were made to induce emotions during each session. During all tasks, the observer disrupted the participant’s work by causing malicious events in the NetBeans environment. The most commonly used events were adding additional characters while entering text, changing the position of the mouse pointer, freezing the environment for 7 s, clearing the contents of the clipboard, and temporarily hiding the IDE screen. These actions were carried out to disrupt work, but in a way that would seem to be natural behaviour of the application. The frequency of events was manually adjusted so that the users remained unaware of the intended actions of the observer. In addition, for task 2, an invalid test case was prepared, and the time for the last task was shortened.
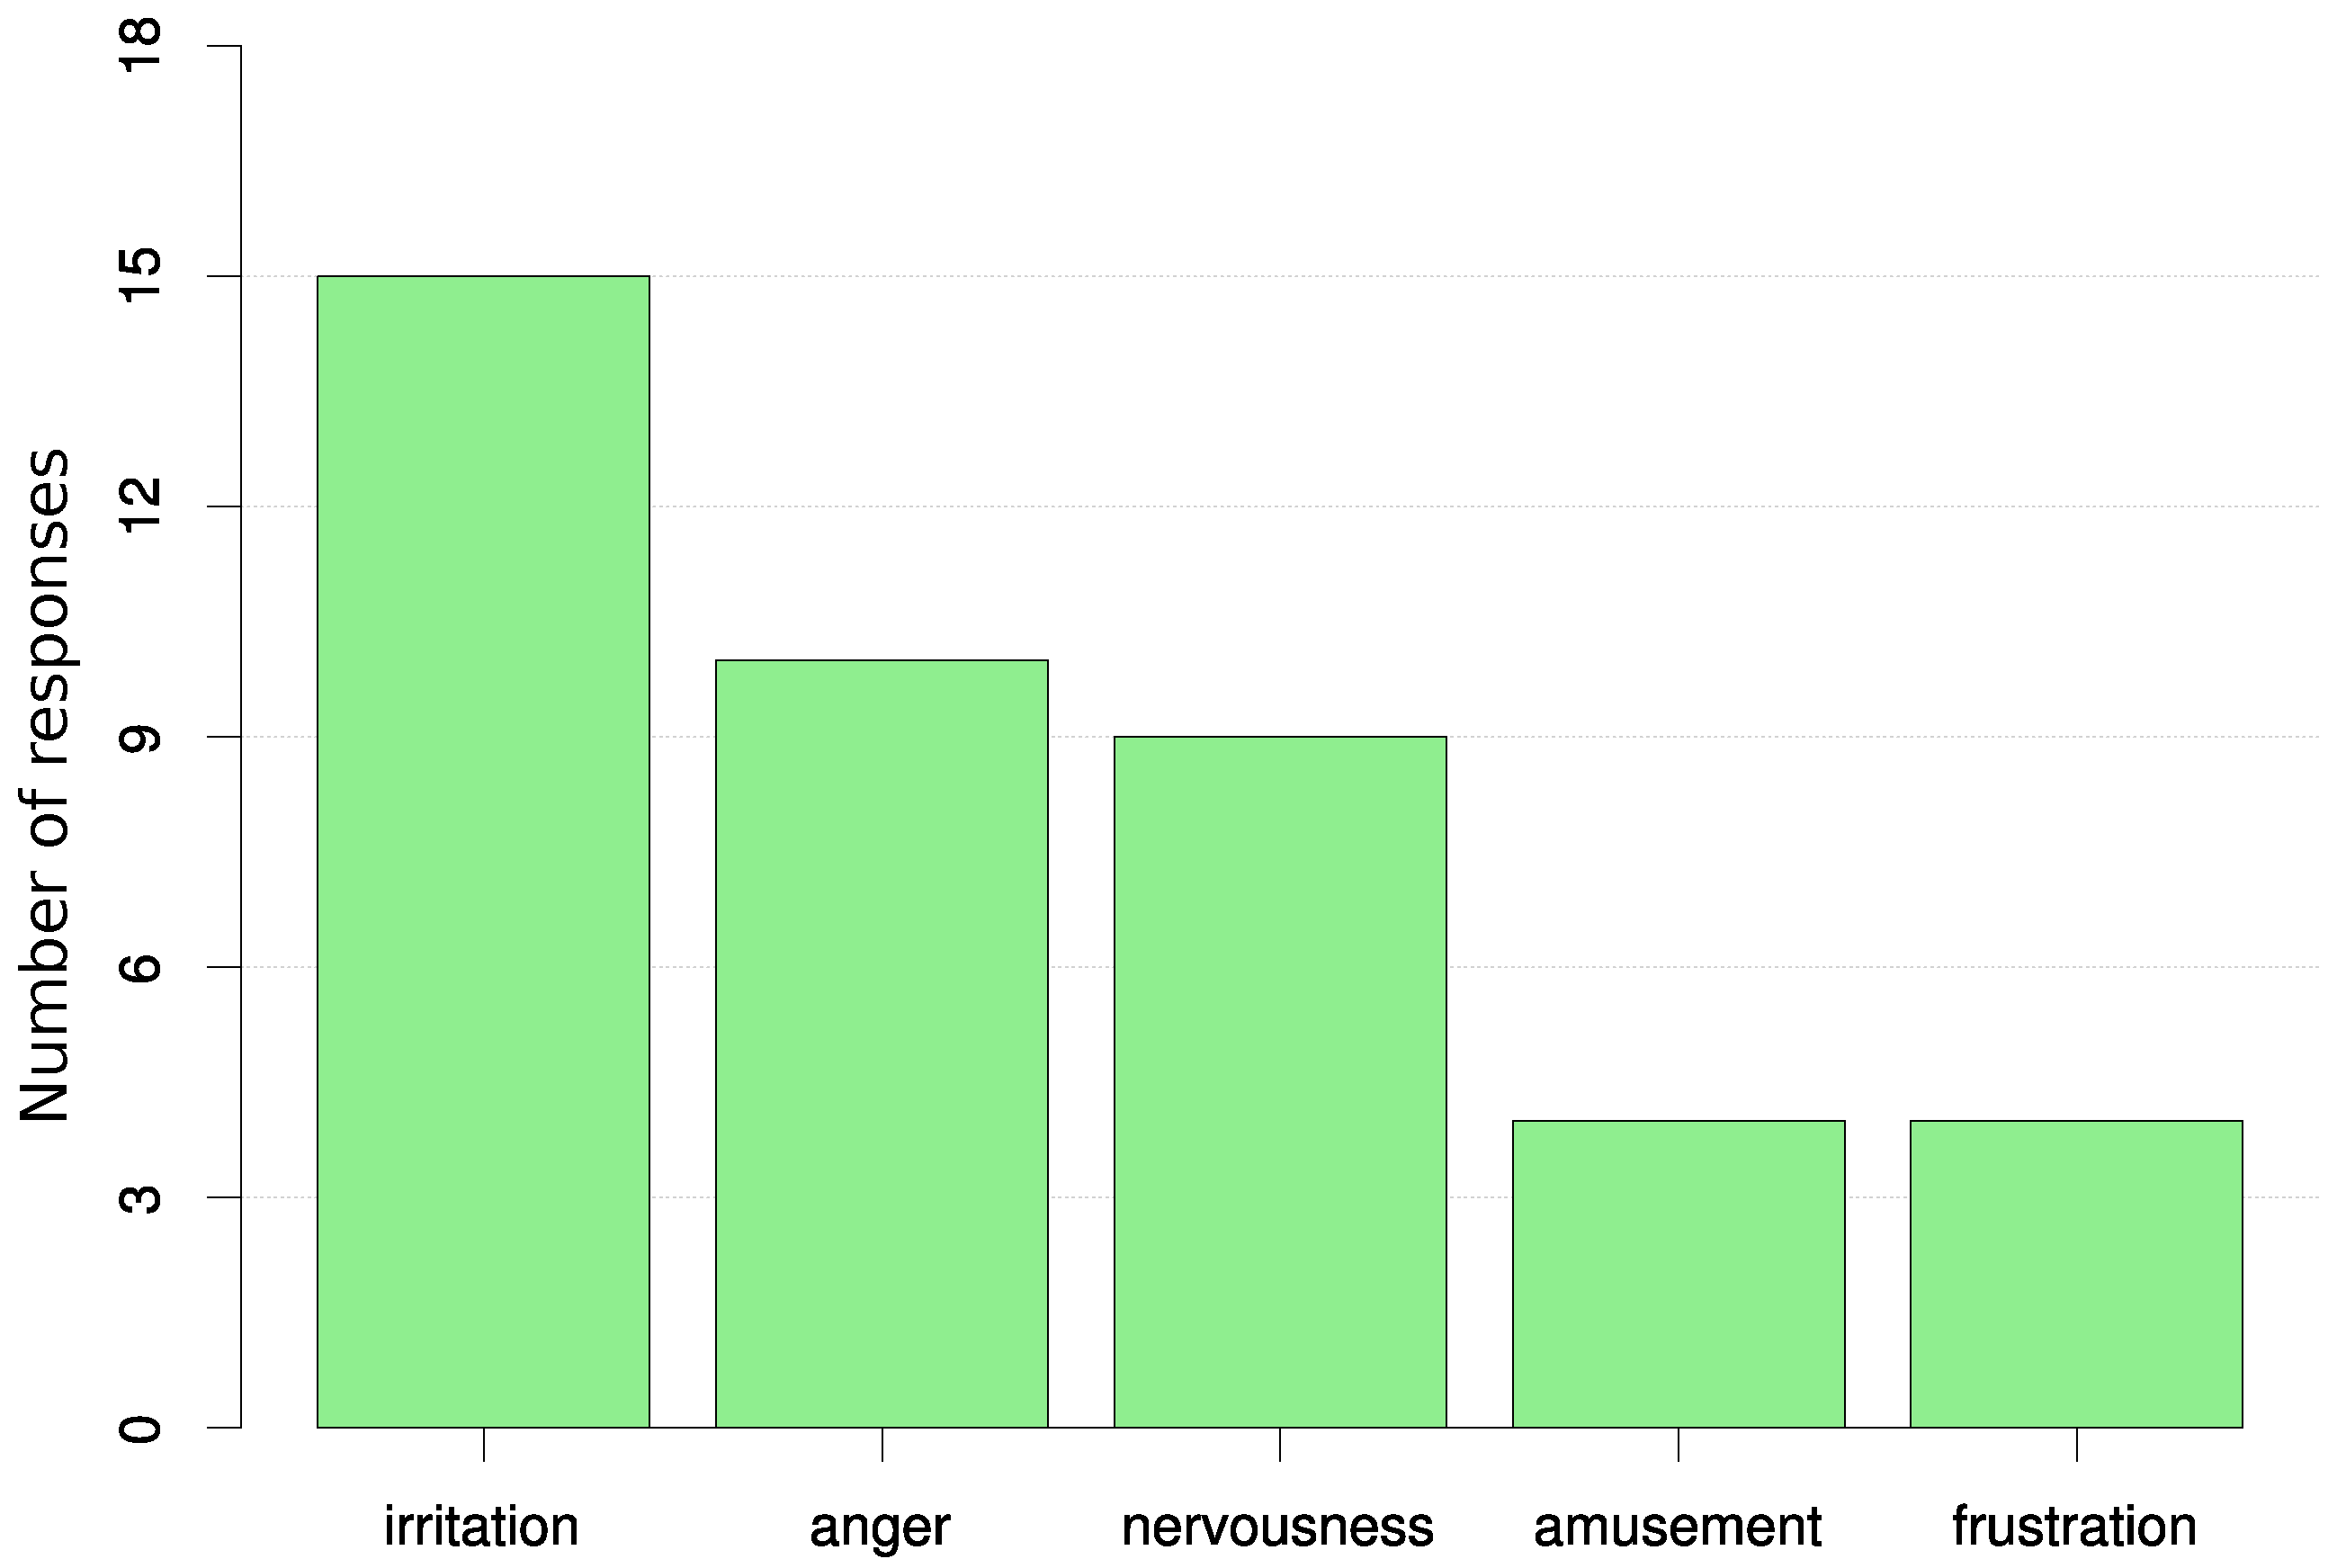
In the questionnaire survey, the participants were asked to list which emotions were induced by specific actions. In the case of an unstable IDE, irritation most frequently appeared (42.86%), then anger (28.57%), followed by nervousness (25.71%) and frustration (11.43%). Four of the respondents (11.43%) indicated amusement (Figure 7). A post-study informal interview revealed that it was related to the fact that these participants had figured out that this unstable work was due to the deliberate actions of the observer. Other emotions were pointed out by only one or two participants and therefore were omitted from the analysis.
An incorrect test case in one of the tasks had a lower impact on the emotional state of the programmer. Astonishment, the most commonly reported emotion, was indicated by only six people (17.14%). In addition, the respondents listed anger (14.29%), frustration (14.29%), uncertainty (11.43%) and irritation (11.43%). Other emotions were mentioned by fewer than three respondents.
Attempts to put time pressure on the participants almost completely failed. This had a negligible impact on the emotional state of the participants. Nearly half of the respondents indicated that this had no effect at all. On the other hand, this was the only action with a positive response—20% of the respondents indicated that the shortening of time was a mobilizing factor. Among the remaining responses, only five people listed negative emotions such as nervousness, irritation or fear.
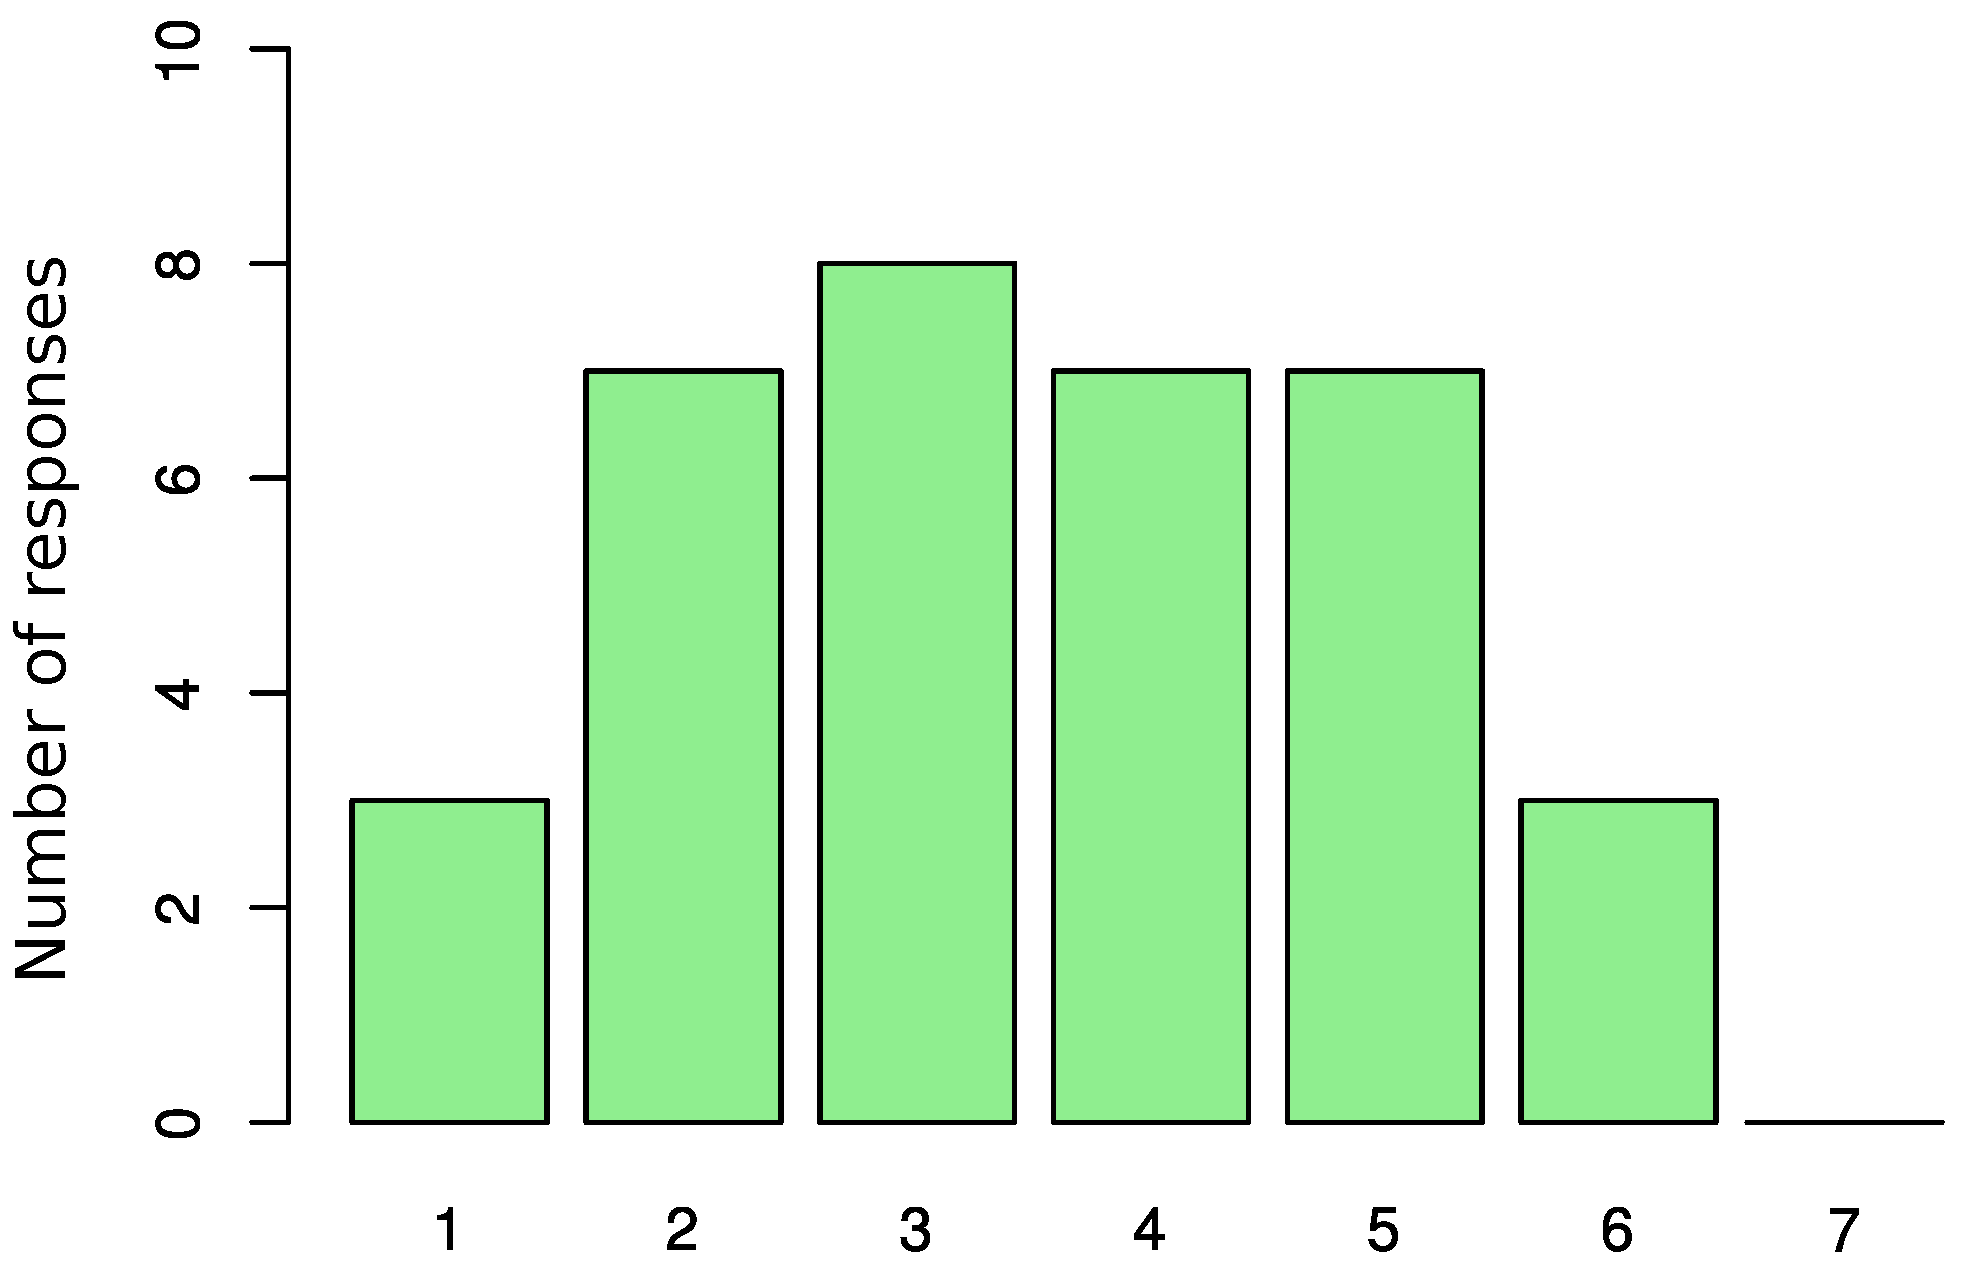
The answers to the question about consent to monitor emotions in the work environment were not conclusive. The distribution of responses was similar to a normal distribution and is shown in Figure 8.
5. Discussion
On the basis of the results of the study, the most appropriate methods for the recognition of the participants’ emotions were those that were completely transparent to the subjects. Despite their low efficiency, keyboard- and mouse pattern-based methods were the most acceptable to the programmers. Of course, the key factor in their implementation in the real work environment is to ensure privacy. The keylogger should not record which keys are pressed, but only patterns of typing, speed, the number of errors and, if possible, key pressures.
At first glance, the differences between the responses to the inconvenience when using the eye tracker and video camera were puzzling. As many as 11 participants pointed out that only the first device could be used in a working environment. Informal interviews conducted after the study revealed that this was related to lighting. During the study, a powerful light set (over 30,000 lm) was used, which was a prerequisite for obtaining high-accuracy results using the Noldus FaceReader software. Some respondents felt discomfort as a result of the very bright light.
Both the availability of eye-tracker data during programming and the user acceptance rating were high. However, studies conducted so far have shown that emotion recognition cannot be performed with high accuracy only on the basis of data from this channel. It can only be used in a multimodal approach. On the other hand, extended pupil movement pattern analysis, combined with keystroke dynamics or mouse movement [30], can reveal interesting results.
Although emotion recognition on the basis of facial expression is widely used, there are some major problems. The conducted study revealed that it can be used only in the case of people without glasses, a fringe or facial hair. For others, the availability is low; therefore, the recognition accuracy may be insufficient.
During the study, the results of the questionnaire on the expression of emotion vocally were not confirmed. Although the participants were informed that they could speak during the study, among all the participants, only one developer commented on his work, sometimes expressing emotions such as frustration or anger. This led to the surprising conclusion that the method of detecting emotion on the basis of audio analysis is not applicable in laboratory tests. However, the results of the questionnaire showed that it can likely be used in real work environments. To confirm this assumption, it is necessary to collect relevant data from the natural development environment.
Of all the physiological sensors used during the study, the EMG sensor located on the subject’s face was recognized as the most intrusive. However, even this sensor was rated as moderately obstructive. This allowed us to conclude that from the point of view of work disruption, all studied sensors can be applied in a laboratory environment to monitor the physiology of software developers.
EDA is known as the physiological signal that allows emotions to be recognized with one of the highest accuracies [39]. However, the best locations for these sensors are the fingers. Clearly, because of the nature of the work of programmers, it is not possible to use this location. The research participant must be able to use the computer as in everyday work, and for programmers, the freedom to move the fingers is crucial. Therefore, an alternative location was chosen, and the sensor was attached to the participant’s wrist. It has been shown in studies that this allows correct but less-accurate monitoring of EDA [40]. For similar reasons, the BVP sensor was placed on the ear lobe instead of the tip of the finger. However, it is necessary to be aware that such workarounds may lead to decreasing accuracy of collected data.
One of the possible solutions for the use of physiological sensors in everyday work is the smart watch. These are watches equipped with a set of sensors and software that allows it to collect, pre-analyze and transfer physiological data to a computer or smartphone. Commonly available devices are equipped with a BVP and some come with an EDA sensor. Among the participants, only four indicated that the watch bothered them significantly while typing. The widespread availability of smart watches, equipped with at least BVP and EDA sensors, would certainly allow for extensive monitoring of the emotional state of developers in their natural environment.
The most effective way to induce the participants’ emotions was the manipulation of the IDE by the observer. Its unstable work evoked negative emotions in 32 participants (91.42%). The IDE is a basic tool for developers. Therefore, its unexpected behaviour over a prolonged time can lead to frustration and anger.
The second of the applied methods—an incorrect unit test—also elicited negative emotions, although in a lower number of participants. Over time, some developers began to suspect that the test was invalid. This method should be used for more complex tasks. In the study, it was used in a relatively simple task, which the participants solved in under half the time limit. The other half was spent on searching for an error—an error that was not there. One participant even opened the unit test code and modified it to complete the task.
Threats to Validity
Several threats to validity could have affected the results of this study. First of all, it was assumed that undergraduate students could participate in the study. They do not have as much experience working as a programmer as professional developers. Therefore, this threat may have had a particular impact on RQ2. On the other hand, the participants had used IDEs intensively when programming numerous student projects. Therefore, in the case of analyzing data related to availability and disturbance as well as methods of inducing emotions, the impact of this threat was rather low.
Another threat was the short time allocated for completing the tasks. Emotions related to the tasks performed may not have occurred in such a short time or could have been the result of previous activities. However, the observations of students during the sessions and the post-study interviews did not confirm this threat.
According to the study plan, each of the three physiological sensors was used in only one (the same) task for all participants. Such a study design may introduce a threat of confounding effects, in which the results are valid only for the particular sensor–task pair. However, because of the similar difficulty of each task, this was not believed to be the case for this study.
6. Conclusions
During the study, emotion recognition methods suitable for monitoring the emotional states of software developers in a laboratory environment were examined. Analysis of the collected data has allowed the research questions to be answered.
In response to RQ1, it can be stated that most of the tested channels can be used successfully during programming. Only audio channels are completely useless in a laboratory environment. Although in the survey the participants reported that they often express emotions verbally while programming, this was not confirmed during the study. In the case of tools for recognizing emotions on the basis of facial expressions, attention should be paid to the appearance of the subject. Studies have revealed that recognition results may be seriously compromised when a participant wears glasses, has a long fringe or has thick stubble.
Among the methods that can be used to monitor the emotion of programmers in the work environment (RQ2), non-invasive methods were indicated first and foremost. The suggested data channels that can be used in daily work include the eye tracker, typing patterns, mouse movements and video recordings. Most respondents also agreed to the use of the EDA sensor. Combined with the results on wearing a wrist watch while programming, it can be claimed that smart watches can be successfully used to monitor the emotions of developers.
Finally, emotion-inducing methods in a laboratory environment were evaluated (RQ3). The malicious plug-in to the IDE proved to be the best approach for triggering negative emotions. Of the remaining methods, shortening the task time did not meet the assumptions of creating time pressure. This incorrect test case, on the other hand, can be used in more complex tasks.
The study has revealed that, while most methods of recognizing the emotions of programmers can be used in laboratory tests, only those that are non-intrusive, such as an analysis of facial expressions or typing patterns, are accepted in the real working environment. In practice, this means that physiological sensors can be used to monitor the emotions of programmers only in the least invasive form—for example, biosensors built into smart watches. In addition, inducing the emotions in the laboratory environment proved to be challenging. Among the three evaluation methods, only the malicious behaviour of the IDE had an impact on the majority of the participants. To conduct research on the emotional states of programmers in a laboratory environment, it may be necessary to develop and validate more approaches to the problem of inducing emotions.
Conflicts of Interest
The author declares no conflict of interest.
Appendix A. Source Code of Provided Programming Tasks
Appendix A.1. Bubble Sort

Appendix A.2. Fibonacci Sequence

Appendix A.3. Palindrome

Appendix A.4. Matrix Transponse

Appendix B. Questionnaire
- How intrusive were the methods of data collection?
- (a)
- Blood pressure sensor (ear):
- (unnoticeable) 1 2 3 4 5 6 7 (made the work completely impossible)
- (b)
- Breath sensor (belt on chest):
- (unnoticeable) 1 2 3 4 5 6 7 (made the work completely impossible)
- (c)
- Skin conductance (armband):
- (unnoticeable) 1 2 3 4 5 6 7 (made the work completely impossible)
- (d)
- Facial EMG (sensor on the face):
- (unnoticeable) 1 2 3 4 5 6 7 (made the work completely impossible)
- (e)
- Eye tracker (camera under the monitor):
- (unnoticeable) 1 2 3 4 5 6 7 (made the work completely impossible)
- (f)
- Video image (camera over the monitor + lighting set):
- (unnoticeable) 1 2 3 4 5 6 7 (made the work completely impossible)
- Choose methods that could be used during the daily work of the programmer according to comfort levels (you can select multiple options).
- Blood pressure sensor (ear)
- Breath sensor (belt on chest)
- Skin conductance (armband)
- Facial EMG (sensor on the face)
- Eye tracker (camera under the monitor)
- Video image (camera over the monitor + lighting set)
- Mouse movements and typing
- SAM self-assessment questionnaire
- Does wearing a watch bother you during prolonged computer work?
- (it is unnoticeable) 1 2 3 4 5 6 7 (makes the work completely impossible)
- Do you sometimes express your emotions (e.g., anger or frustration) aloud when programming?
- (never) 1 2 3 4 5 6 7 (always)
- Which emotions were induced by:
- Unstable work of the IDE: __________________
- Invalid test case in task 2: __________________
- Shortening the time allocated for completing the last task: __________________
- How often could the SAM self-assessment form be displayed during the work so that it is not disruptive?
- Every 5 min
- Every 1 h
- Every commit
- When starting and closing the IDE
- Twice a day
- Would you agree to monitor your emotional state while working?
- Yes
- No
References
- ICT Specialists in Employment—Eurostat Report. Available online: http://ec.europa.eu/eurostat/statistics-explained/index.php/ICT_specialists_in_employment (accessed on 30 November 2017).
- ICT Specialists—Statistics on Hard-To-Fill Vacancies in Enterprises—Eurostat Report. Available online: http://ec.europa.eu/eurostat/statistics-explained/index.php/ICT_specialists_-_statistics_on_hard-to-fill_vacancies_in_enterprises (accessed on 30 November 2017).
- Denning, P.J. Moods. Commun. ACM 2012, 55, 33–35. [Google Scholar] [CrossRef] [Green Version]
- Graziotin, D.; Wang, X.; Abrahamsson, P. Do feelings matter? On the correlation of affects and the self-assessed productivity in software engineering. J. Softw. Evol. Process 2015, 27, 467–487. [Google Scholar] [CrossRef]
- Müller, S.C.; Fritz, T. Stuck and frustrated or in flow and happy: Sensing developers’ emotions and progress. In Proceedings of the 2015 IEEE/ACM 37th IEEE International Conference on Software Engineering (ICSE), Florence, Italy, 16–24 May 2015; Volume 1, pp. 688–699. [Google Scholar]
- Fountaine, A.; Sharif, B. Emotional awareness in software development: Theory and measurement. In Proceedings of the IEEE/ACM 2nd International Workshop on Emotion Awareness in Software Engineering, Buenos Aires, Argentina, 21 May 2017; pp. 28–31. [Google Scholar]
- Graziotin, D.; Fagerholm, F.; Wang, X.; Abrahamsson, P. Consequences of unhappiness while developing software. In Proceedings of the 2nd International Workshop on Emotion Awareness in Software Engineering, Buenos Aires, Argentina, 20–28 May 2017; IEEE Press: Piscataway, NJ, USA, 2017; pp. 42–47. [Google Scholar]
- Uhrig, M.K.; Trautmann, N.; Baumgärtner, U.; Treede, R.D.; Henrich, F.; Hiller, W.; Marschall, S. Emotion elicitation: A comparison of pictures and films. Front. Psychol. 2016, 7, 180. [Google Scholar] [CrossRef] [PubMed]
- Fritz, T.; Müller, S.C. Leveraging biometric data to boost software developer productivity. In Proceedings of the 2016 IEEE 23rd International Conference on Software Analysis, Evolution, and Reengineering (SANER), Suita, Japan, 14–18 March 2016; Volume 5, pp. 66–77. [Google Scholar]
- Müller, S.C.; Fritz, T. Using (bio) metrics to predict code quality online. In Proceedings of the 38th International Conference on Software Engineering, Austin, TX, USA, 14–22 May 2016; pp. 452–463. [Google Scholar]
- Landowska, A.; Wróbel, M.R. Affective reactions to playing digital games. In Proceedings of the 2015 8th International Conference on Human System Interactions (HSI), Warsaw, Poland, 25–27 June 2015; pp. 264–270. [Google Scholar]
- Fritz, T.; Begel, A.; Müller, S.C.; Yigit-Elliott, S.; Züger, M. Using psycho-physiological measures to assess task difficulty in software development. In Proceedings of the 36th International Conference on Software Engineering, Hyderabad, India, 31 May–7 June 2014; pp. 402–413. [Google Scholar]
- Van Boxtel, A. Facial EMG as a tool for inferring affective states. In Proceedings of the Measuring Behavior. Noldus Information Technology Wageningen, Eindhoven, The Netherland, 24–27 August 2010; pp. 104–108. [Google Scholar]
- Tan, J.W.; Walter, S.; Scheck, A.; Hrabal, D.; Hoffmann, H.; Kessler, H.; Traue, H.C. Facial electromyography (fEMG) activities in response to affective visual stimulation. In Proceedings of the 2011 IEEE Workshop on Affective Computational Intelligence (WACI), Paris, France, 11–15 April 2011; pp. 1–5. [Google Scholar]
- Bhandari, U.; Neben, T.; Chang, K.; Chua, W.Y. Effects of interface design factors on affective responses and quality evaluations in mobile applications. Comput. Hum. Behav. 2017, 72, 525–534. [Google Scholar] [CrossRef]
- Sharif, B.; Maletic, J.I. An eye tracking study on camelcase and under_score identifier styles. In Proceedings of the 2010 IEEE 18th International Conference on Program Comprehension (ICPC), Braga, Portugal, 30 June–2 July 2010; pp. 196–205. [Google Scholar]
- Rodeghero, P.; McMillan, C.; McBurney, P.W.; Bosch, N.; D’Mello, S. Improving automated source code summarization via an eye-tracking study of programmers. In Proceedings of the 36th International Conference on Software Engineering, Hyderabad, India, 31 May–7 June 2014; pp. 390–401. [Google Scholar]
- Sharif, B.; Falcone, M.; Maletic, J.I. An eye-tracking study on the role of scan time in finding source code defects. In Proceedings of the Symposium on Eye Tracking Research and Applications, Santa Barbara, CA, USA, 28–30 March 2012; pp. 381–384. [Google Scholar]
- Sharafi, Z.; Shaffer, T.; Sharif, B.; Guéhéneuc, Y.G. Eye-tracking Metrics in Software Engineering. In Proceedings of the 2015 Asia-Pacific Software Engineering Conference (APSEC), New Delhi, India, 1–4 December 2015; pp. 96–103. [Google Scholar]
- Kevic, K.; Walters, B.; Shaffer, T.; Sharif, B.; Shepherd, D.C.; Fritz, T. Eye gaze and interaction contexts for change tasks—Observations and potential. J. Syst. Softw. 2017, 128, 252–266. [Google Scholar] [CrossRef]
- Bednarik, R.; Tukiainen, M. An eye-tracking methodology for characterizing program comprehension processes. In Proceedings of the 2006 Symposium on Eye Tracking Research & Applications, San Diego, CA, USA, 27–29 March 2006; pp. 125–132. [Google Scholar]
- Shaffer, T.R.; Wise, J.L.; Walters, B.M.; Müller, S.C.; Falcone, M.; Sharif, B. Itrace: Enabling eye tracking on software artifacts within the ide to support software engineering tasks. In Proceedings of the 2015 10th Joint Meeting on Foundations of Software Engineering, Bergamo, Italy, 30 August–4 September 2015; pp. 954–957. [Google Scholar]
- Fragopanagos, N.; Taylor, J.G. Emotion recognition in human—Computer interaction. Neural Netw. 2005, 18, 389–405. [Google Scholar] [CrossRef] [PubMed]
- Gunes, H.; Piccardi, M. Affect recognition from face and body: Early fusion vs. late fusion. In Proceedings of the 2005 IEEE International Conference on Systems, Man and Cybernetics, Waikoloa, HI, USA, 12 October 2005; Volume 4, pp. 3437–3443. [Google Scholar]
- Majumder, A.; Behera, L.; Subramanian, V.K. Emotion recognition from geometric facial features using self-organizing map. Pattern Recognit. 2014, 47, 1282–1293. [Google Scholar] [CrossRef]
- Sayette, M.A.; Cohn, J.F.; Wertz, J.M.; Perrott, M.A.; Parrott, D.J. A psychometric evaluation of the facial action coding system for assessing spontaneous expression. J. Nonverbal Behav. 2001, 25, 167–185. [Google Scholar] [CrossRef]
- Ooi, C.S.; Seng, K.P.; Ang, L.M.; Chew, L.W. A new approach of audio emotion recognition. Expert Syst. Appl. 2014, 41, 5858–5869. [Google Scholar] [CrossRef]
- Eyben, F.; Wöllmer, M.; Schuller, B. OpenEAR—Introducing the Munich open-source emotion and affect recognition toolkit. In Proceedings of the 3rd International Conference on Affective Computing and Intelligent Interaction and Workshops, Amsterdam, The Netherlands, 10–12 September 2009; pp. 1–6. [Google Scholar]
- Kołakowska, A. A review of emotion recognition methods based on keystroke dynamics and mouse movements. In Proceedings of the 2013 The 6th International Conference on Human System Interaction (HSI), Sopot, Poland, 6–8 June 2013; pp. 548–555. [Google Scholar]
- Kołakowska, A. Towards detecting programmers’ stress on the basis of keystroke dynamics. In Proceedings of the 2016 Federated Conference on Computer Science and Information Systems (FedCSIS), Gdansk, Poland, 11–14 September 2016; pp. 1621–1626. [Google Scholar]
- Khezri, M.; Firoozabadi, M.; Sharafat, A.R. Reliable emotion recognition system based on dynamic adaptive fusion of forehead biopotentials and physiological signals. Comput. Methods Programs Biomed. 2015, 122, 149–164. [Google Scholar] [CrossRef] [PubMed]
- Crk, I.; Kluthe, T.; Stefik, A. Understanding programming expertise: An empirical study of phasic brain wave changes. ACM Trans. Comput.-Hum. Interact. (TOCHI) 2016, 23, 2. [Google Scholar] [CrossRef]
- Landowska, A. Emotion monitor-concept, construction and lessons learned. In Proceedings of the 2015 Federated Conference on Computer Science and Information Systems (FedCSIS), Lodz, Poland, 13–16 September 2015; pp. 75–80. [Google Scholar]
- Novielli, N.; Calefato, F.; Lanubile, F. Towards discovering the role of emotions in stack overflow. In Proceedings of the 6th International Workshop on Social Software Engineering, Hong Kong, China, 17 November 2014; pp. 33–36. [Google Scholar]
- Jurado, F.; Rodriguez, P. Sentiment Analysis in monitoring software development processes: An exploratory case study on GitHub’s project issues. J. Syst. Softw. 2015, 104, 82–89. [Google Scholar] [CrossRef]
- Brodny, G.; Kołakowska, A.; Landowska, A.; Szwoch, M.; Szwoch, W.; Wróbel, M.R. Comparison of selected off-the-shelf solutions for emotion recognition based on facial expressions. In Proceedings of the 2016 9th International Conference on Human System Interactions (HSI), Portsmouth, UK, 6–8 July 2016; pp. 397–404. [Google Scholar]
- Bradley, M.M.; Lang, P.J. Measuring emotion: The self-assessment manikin and the semantic differential. J. Behavior Ther. Exp. Psychiatry 1994, 25, 49–59. [Google Scholar] [CrossRef]
- Quigley, K.; Lindquist, K.A.; Barrett, L.F. Inducing and measuring emotion and affect: Tips, tricks, and secrets. In Handbook of Research Methods in Social and Personality Psychology; Cambridge University Press: Cambridge, UK, 2014; pp. 220–252. [Google Scholar]
- Picard, R.W. Affective computing: From laughter to IEEE. IEEE Trans. Affect. Comput. 2010, 1, 11–17. [Google Scholar] [CrossRef]
- Landowska, A. Emotion monitoring—Verification of physiological characteristics measurement procedures. Metrol. Meas. Syst. 2014, 21, 719–732. [Google Scholar] [CrossRef]
Figure 1.
Study stand.
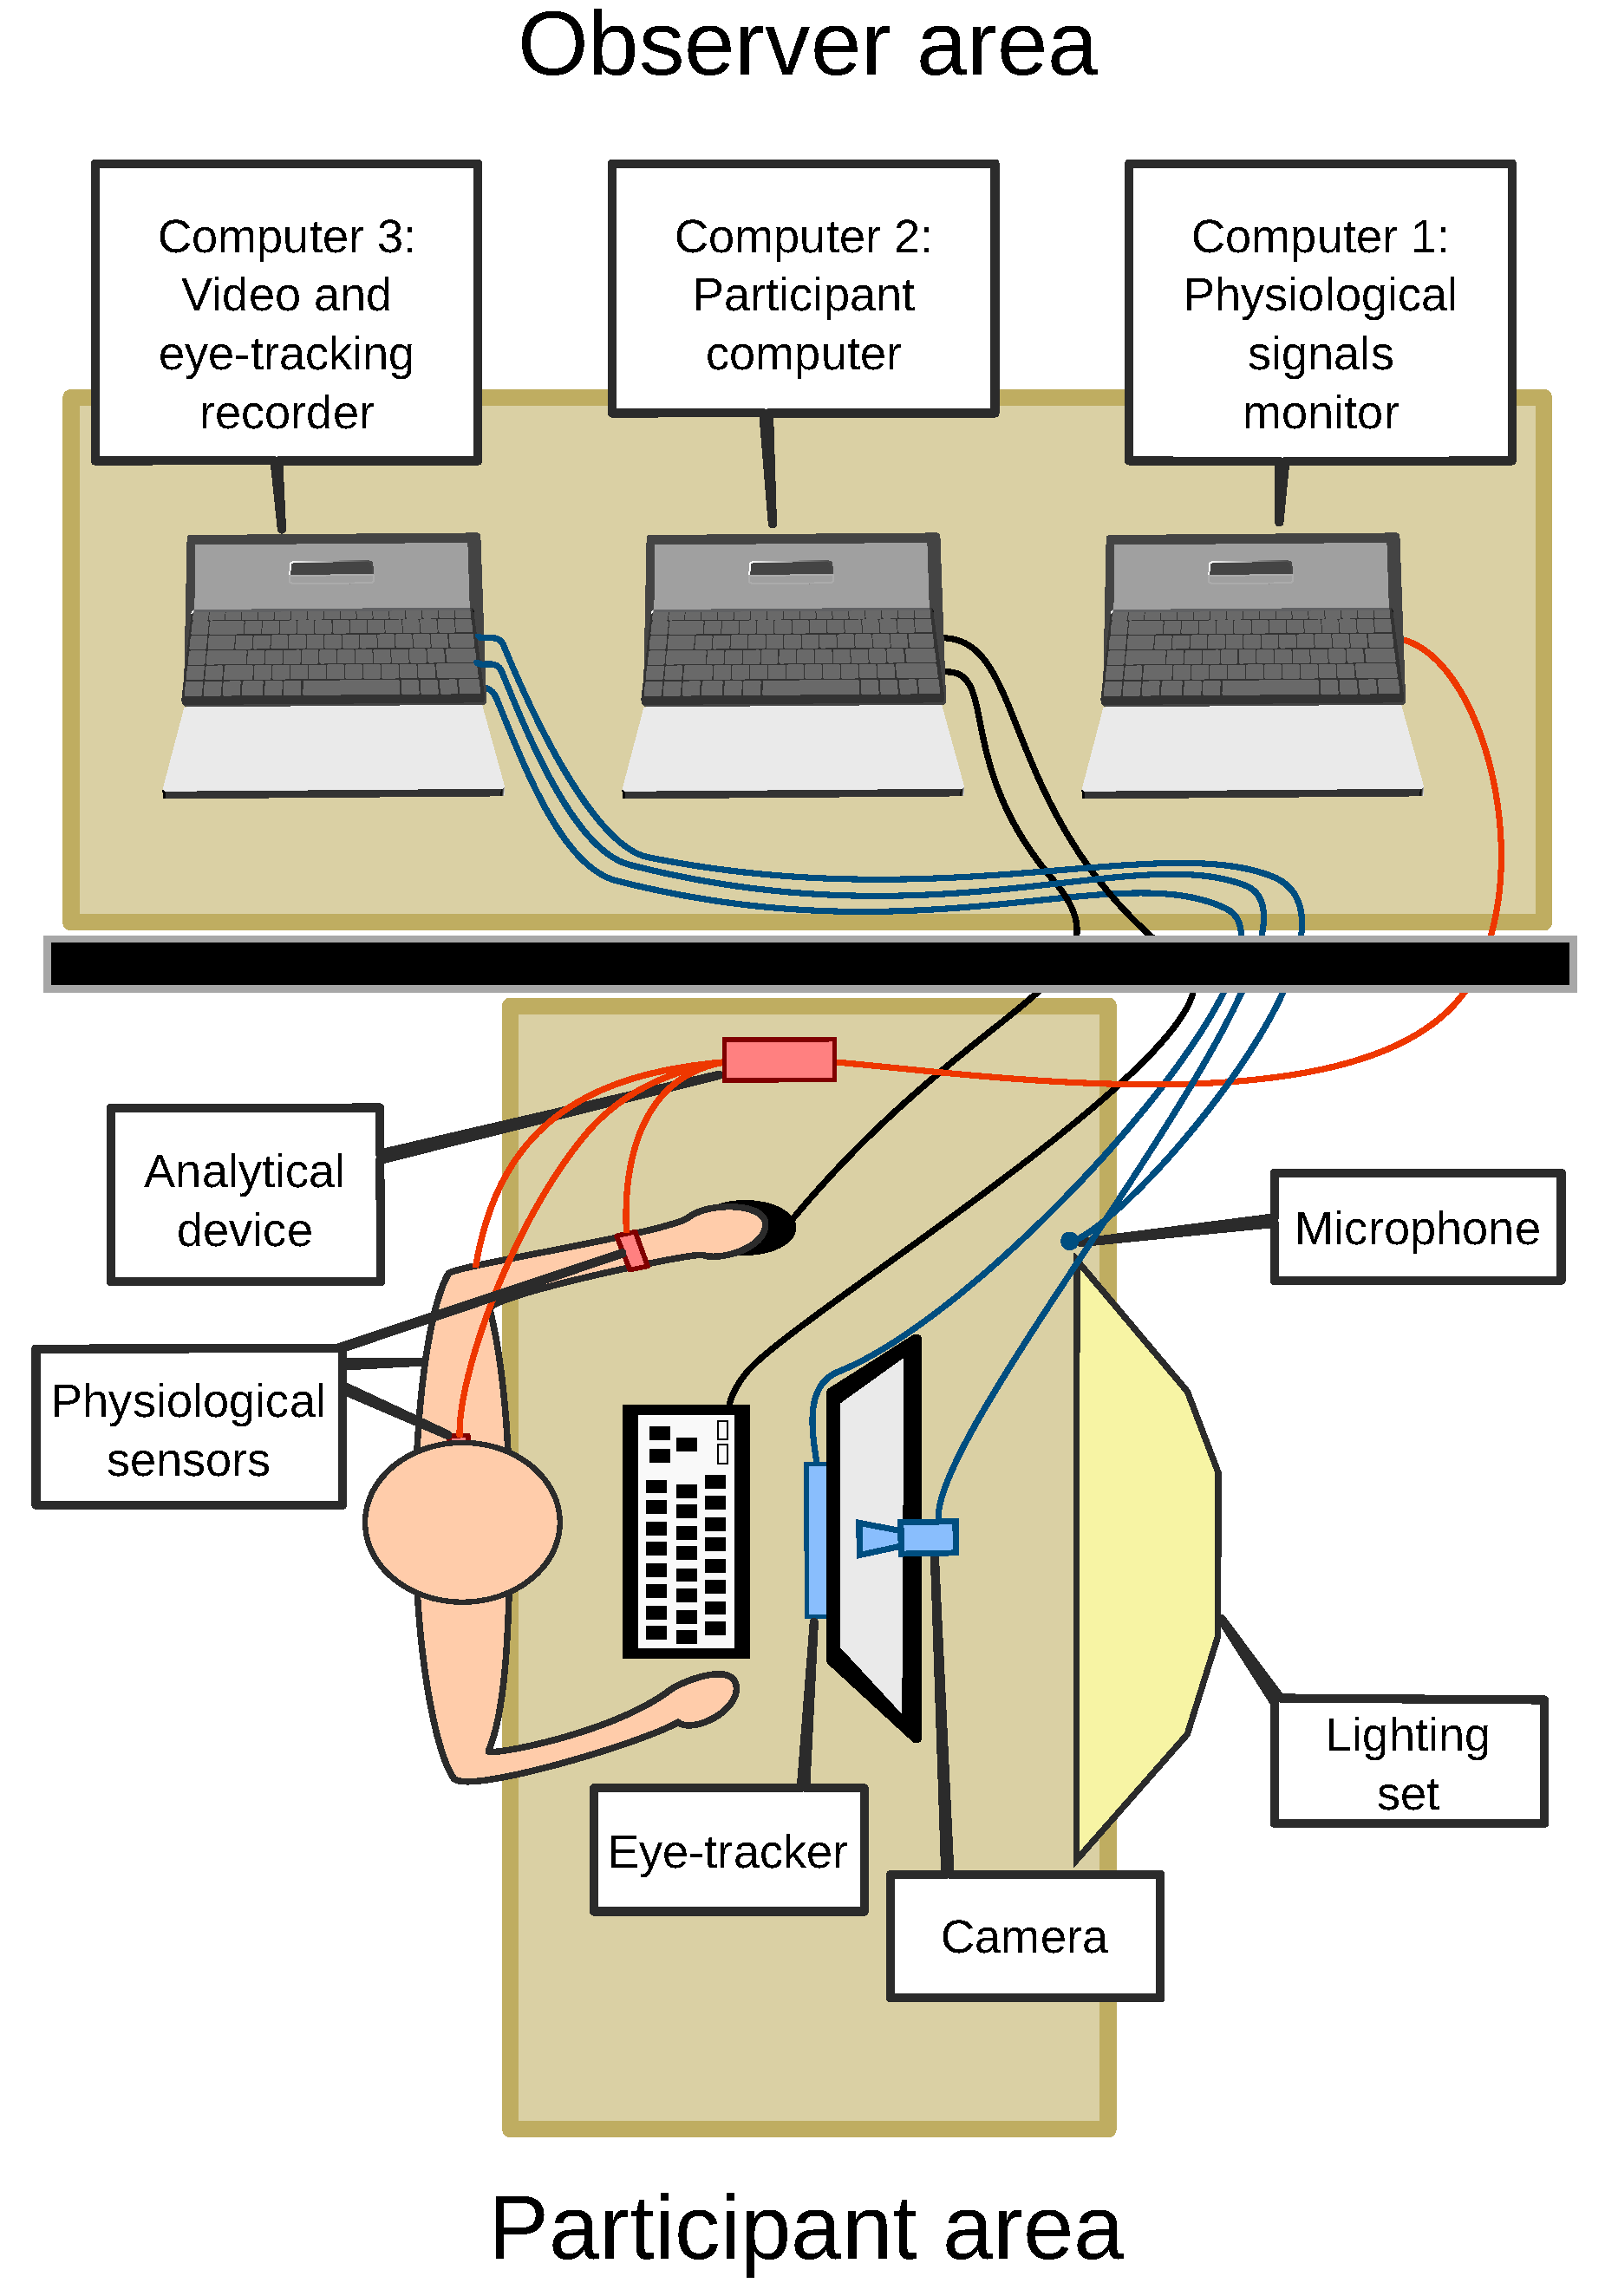
Figure 2.
Self-Assessment Manikin used during the study.
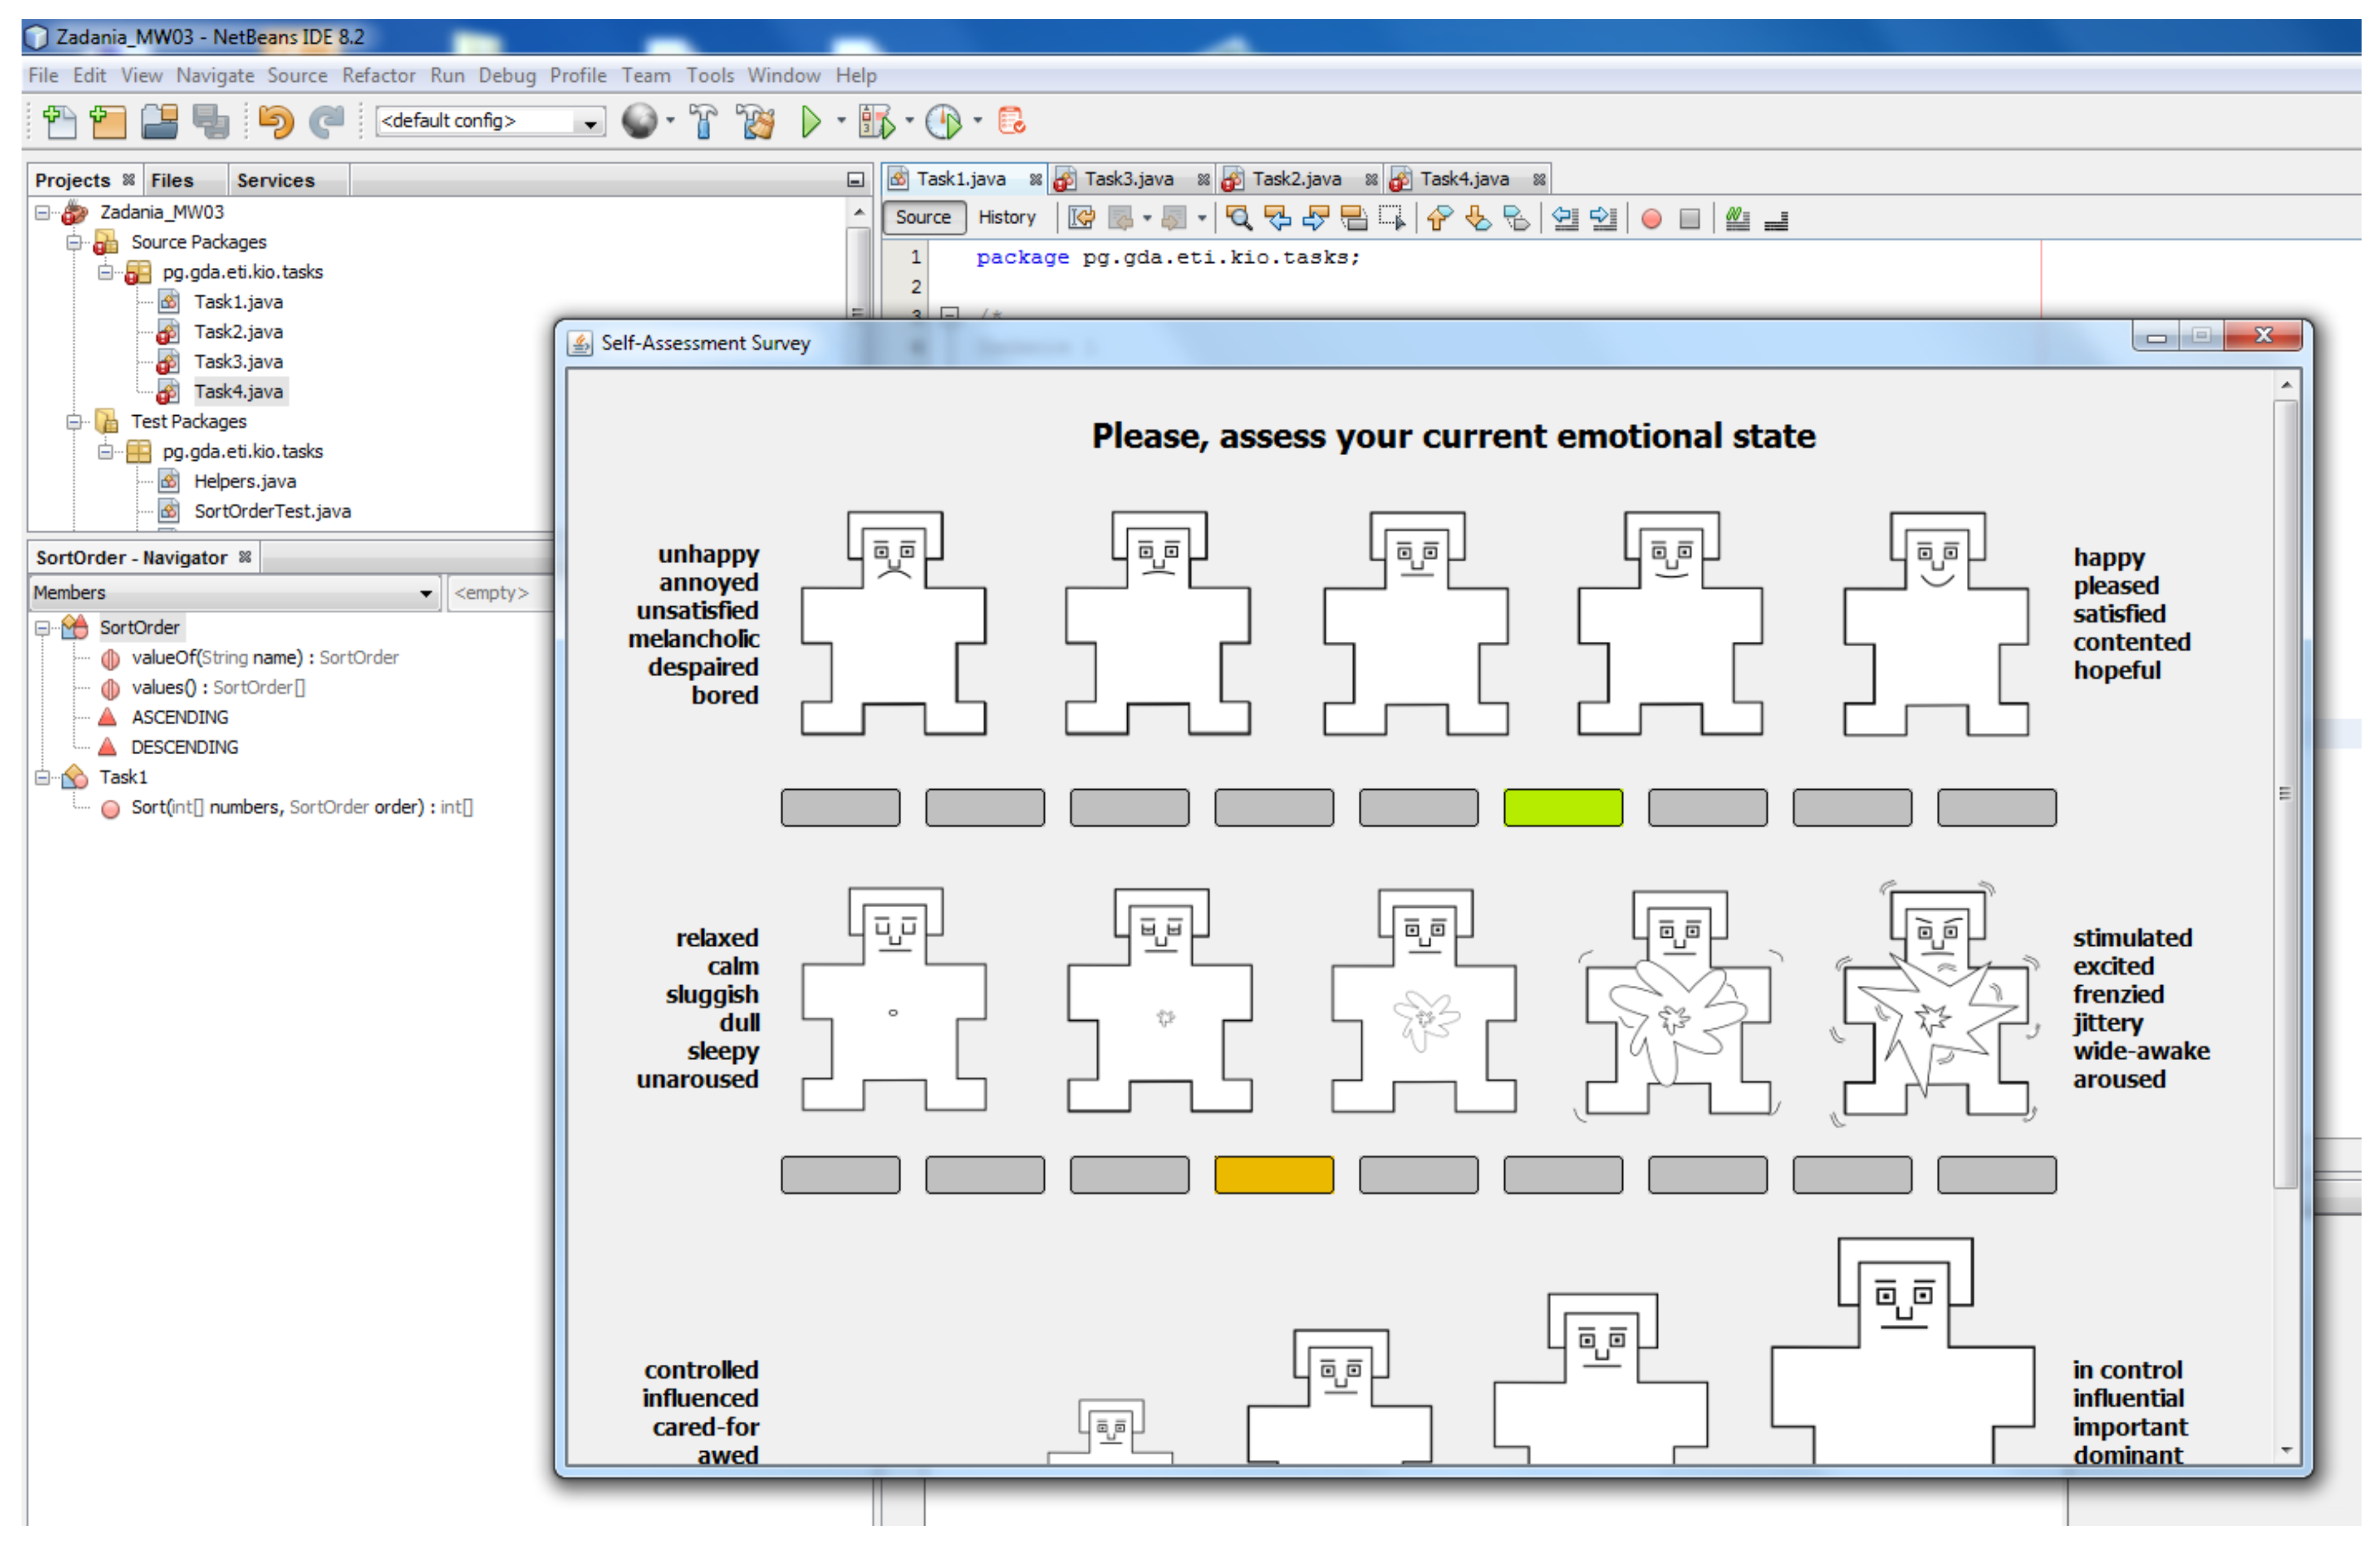
Figure 3.
Images of the participants from the video camera: the first with glasses and a long fringe on the left, and another with the blood volume pulse (BVP) sensor attached to the earlobe on the right.
Figure 3.
Images of the participants from the video camera: the first with glasses and a long fringe on the left, and another with the blood volume pulse (BVP) sensor attached to the earlobe on the right.
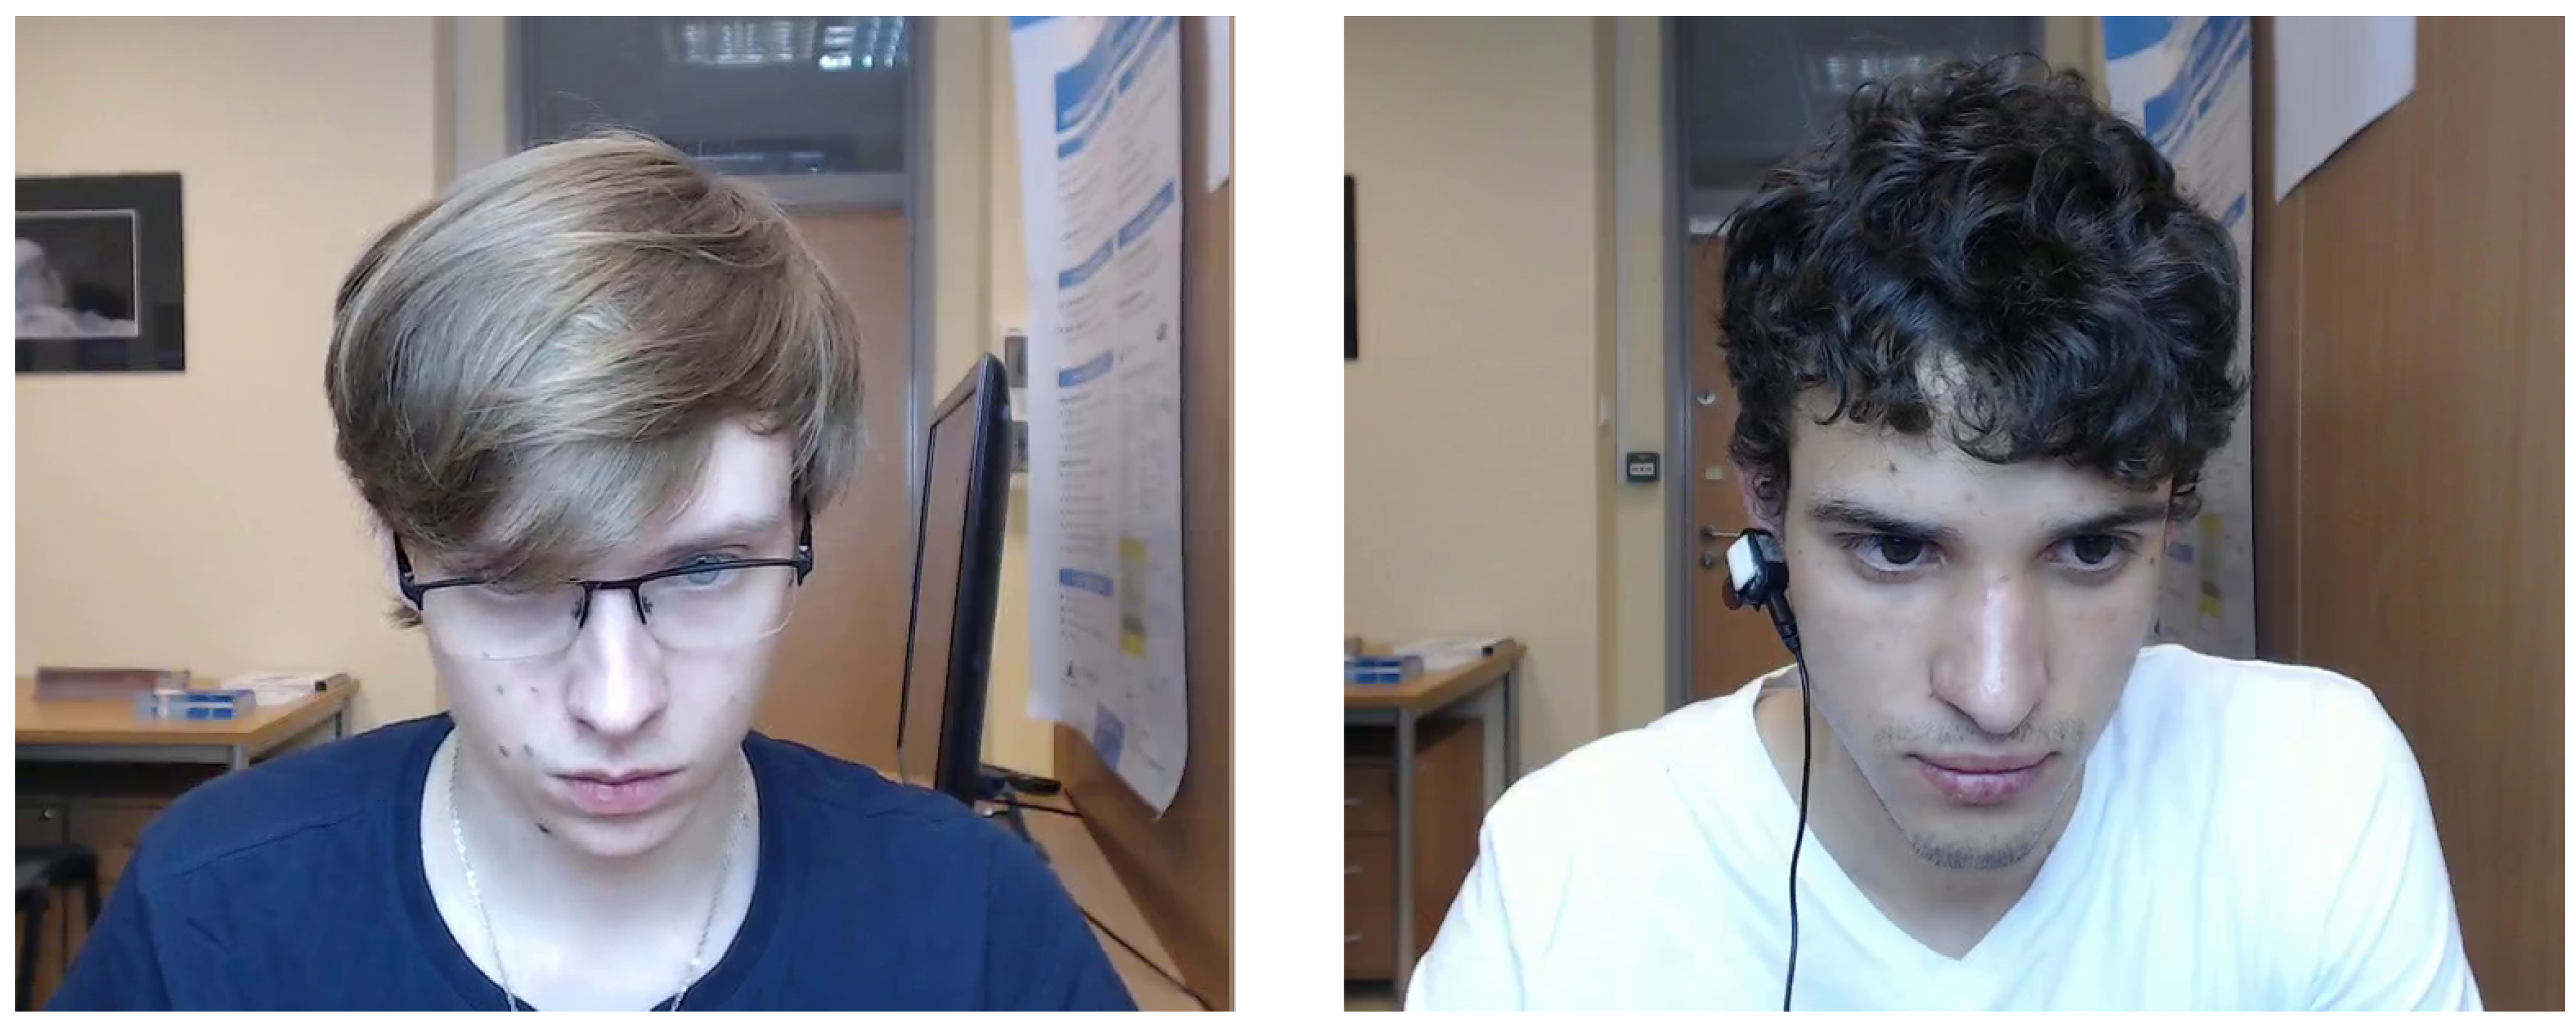
Figure 4.
Fixations and saccades during Task 1.

Figure 5.
Disturbance rating distribution of channels.
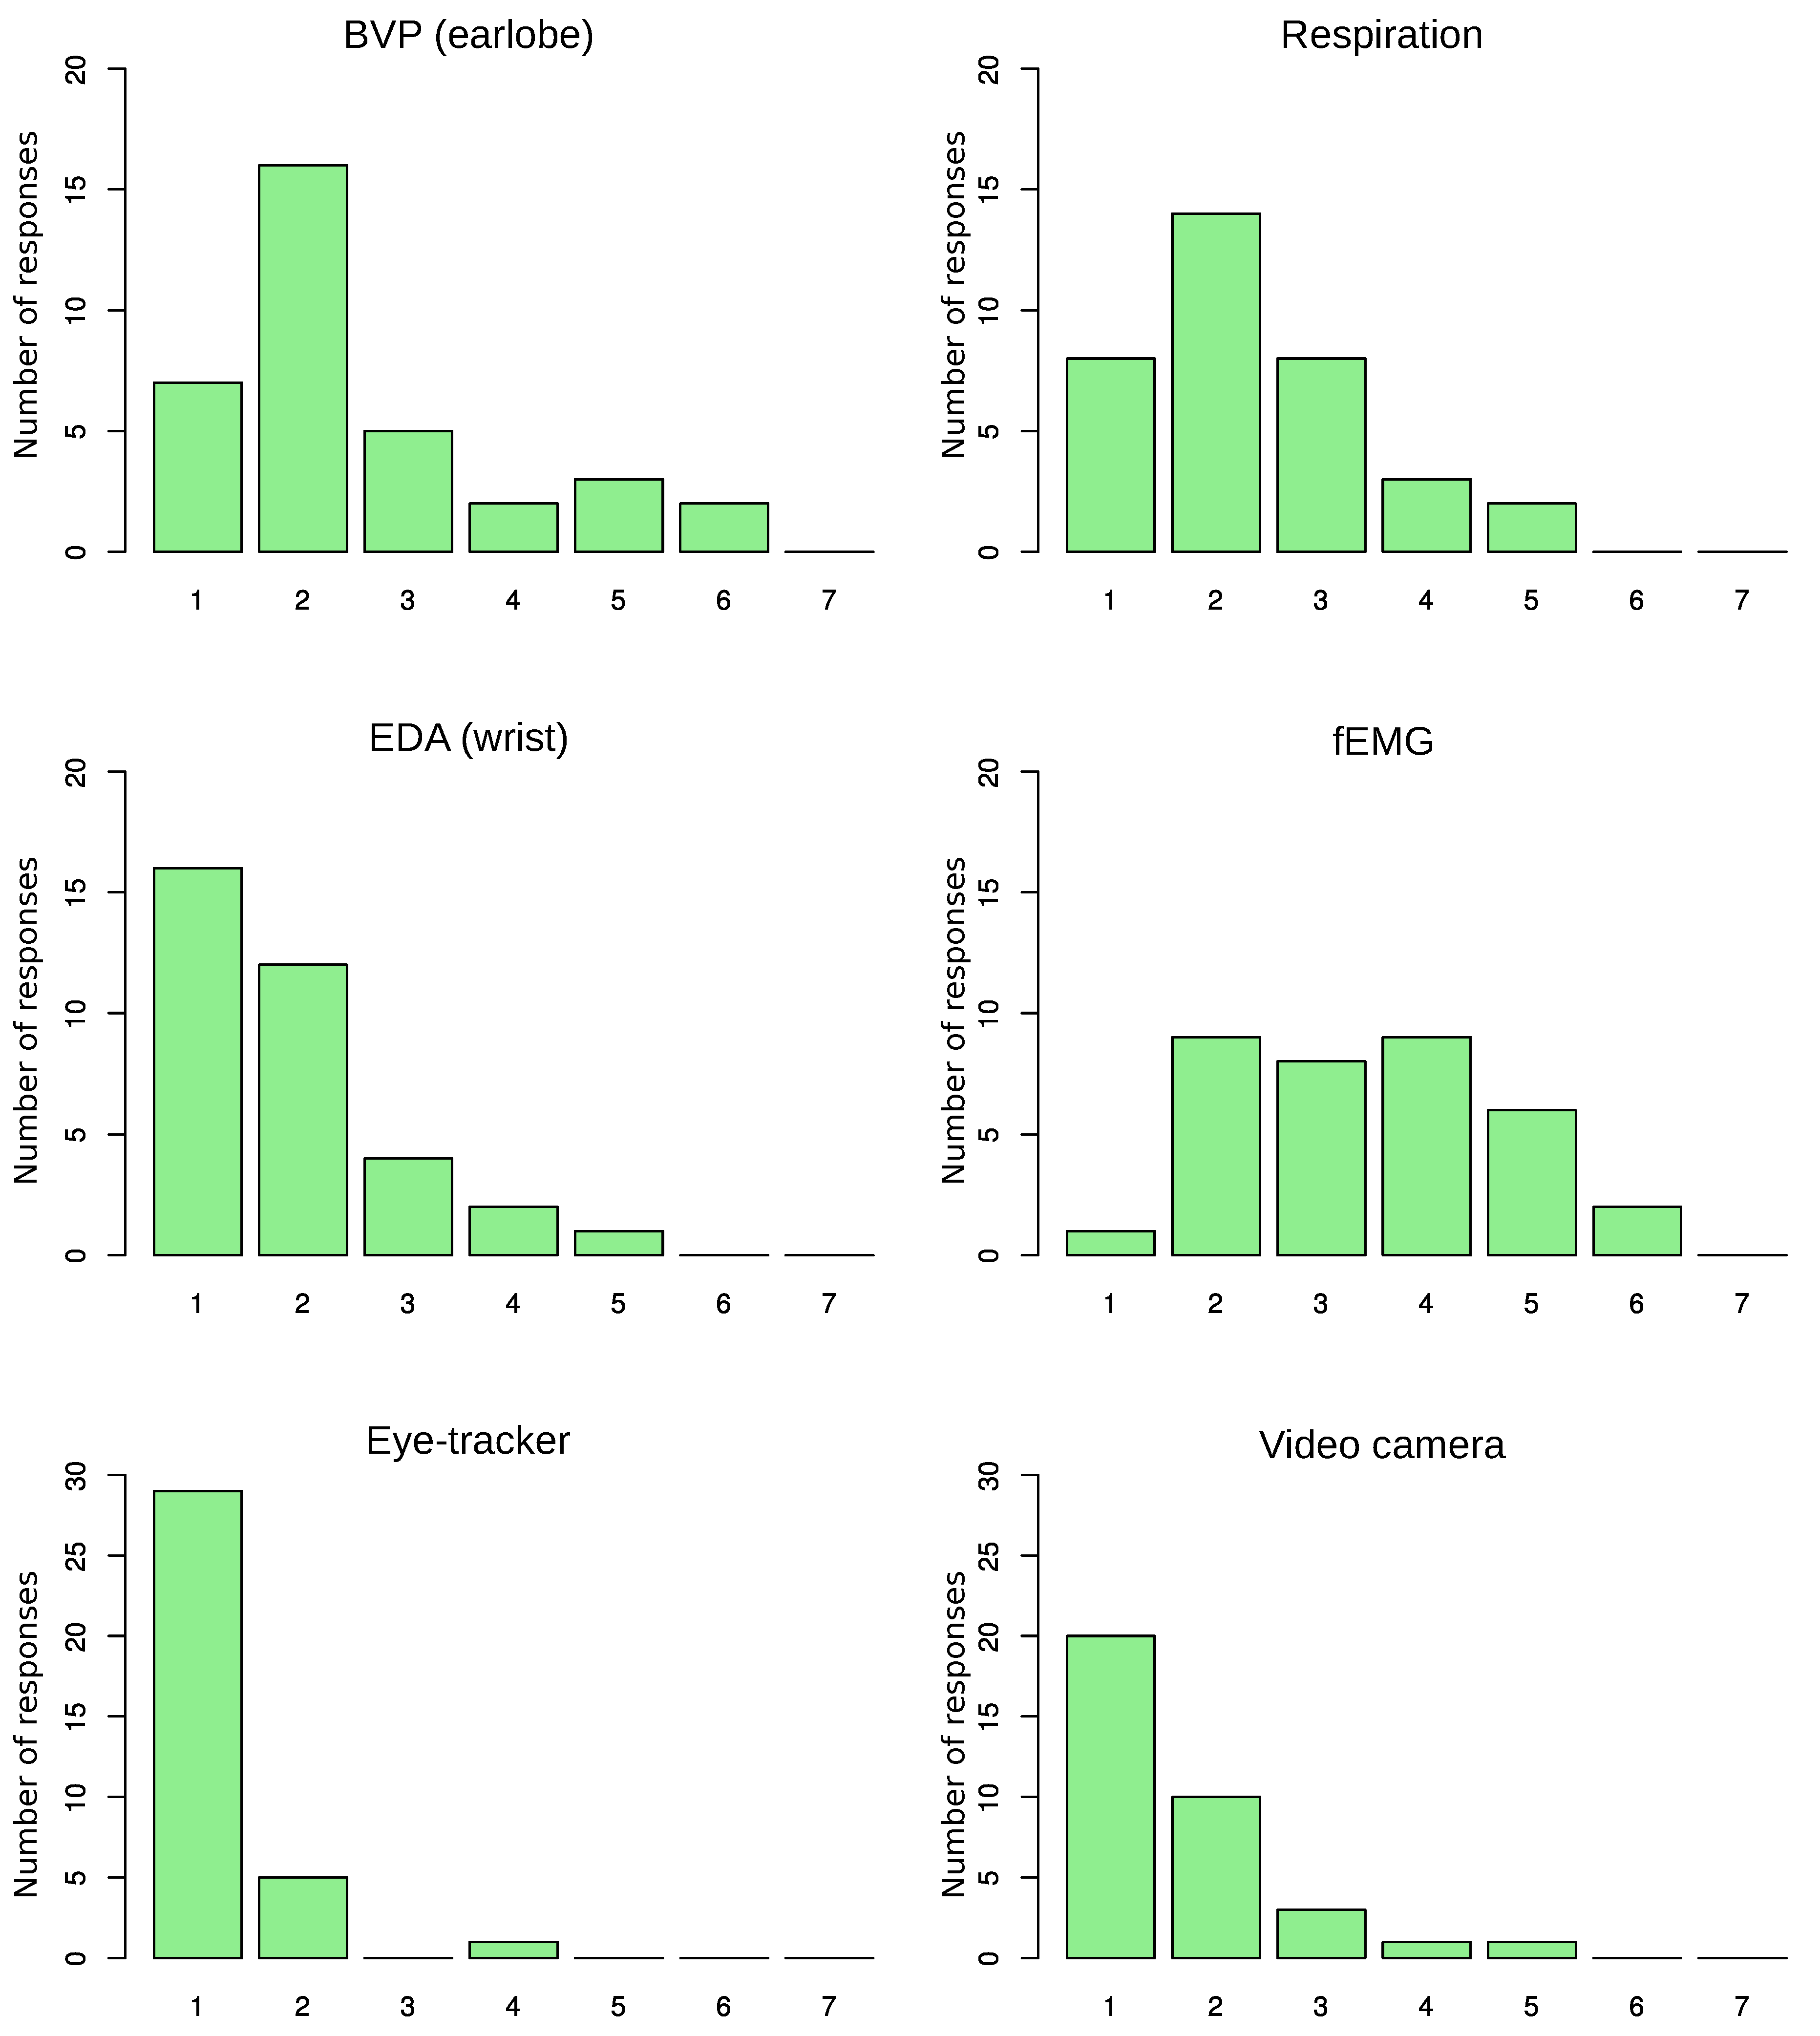
Figure 6.
Evaluation of disturbance of the wrist watch in daily work.
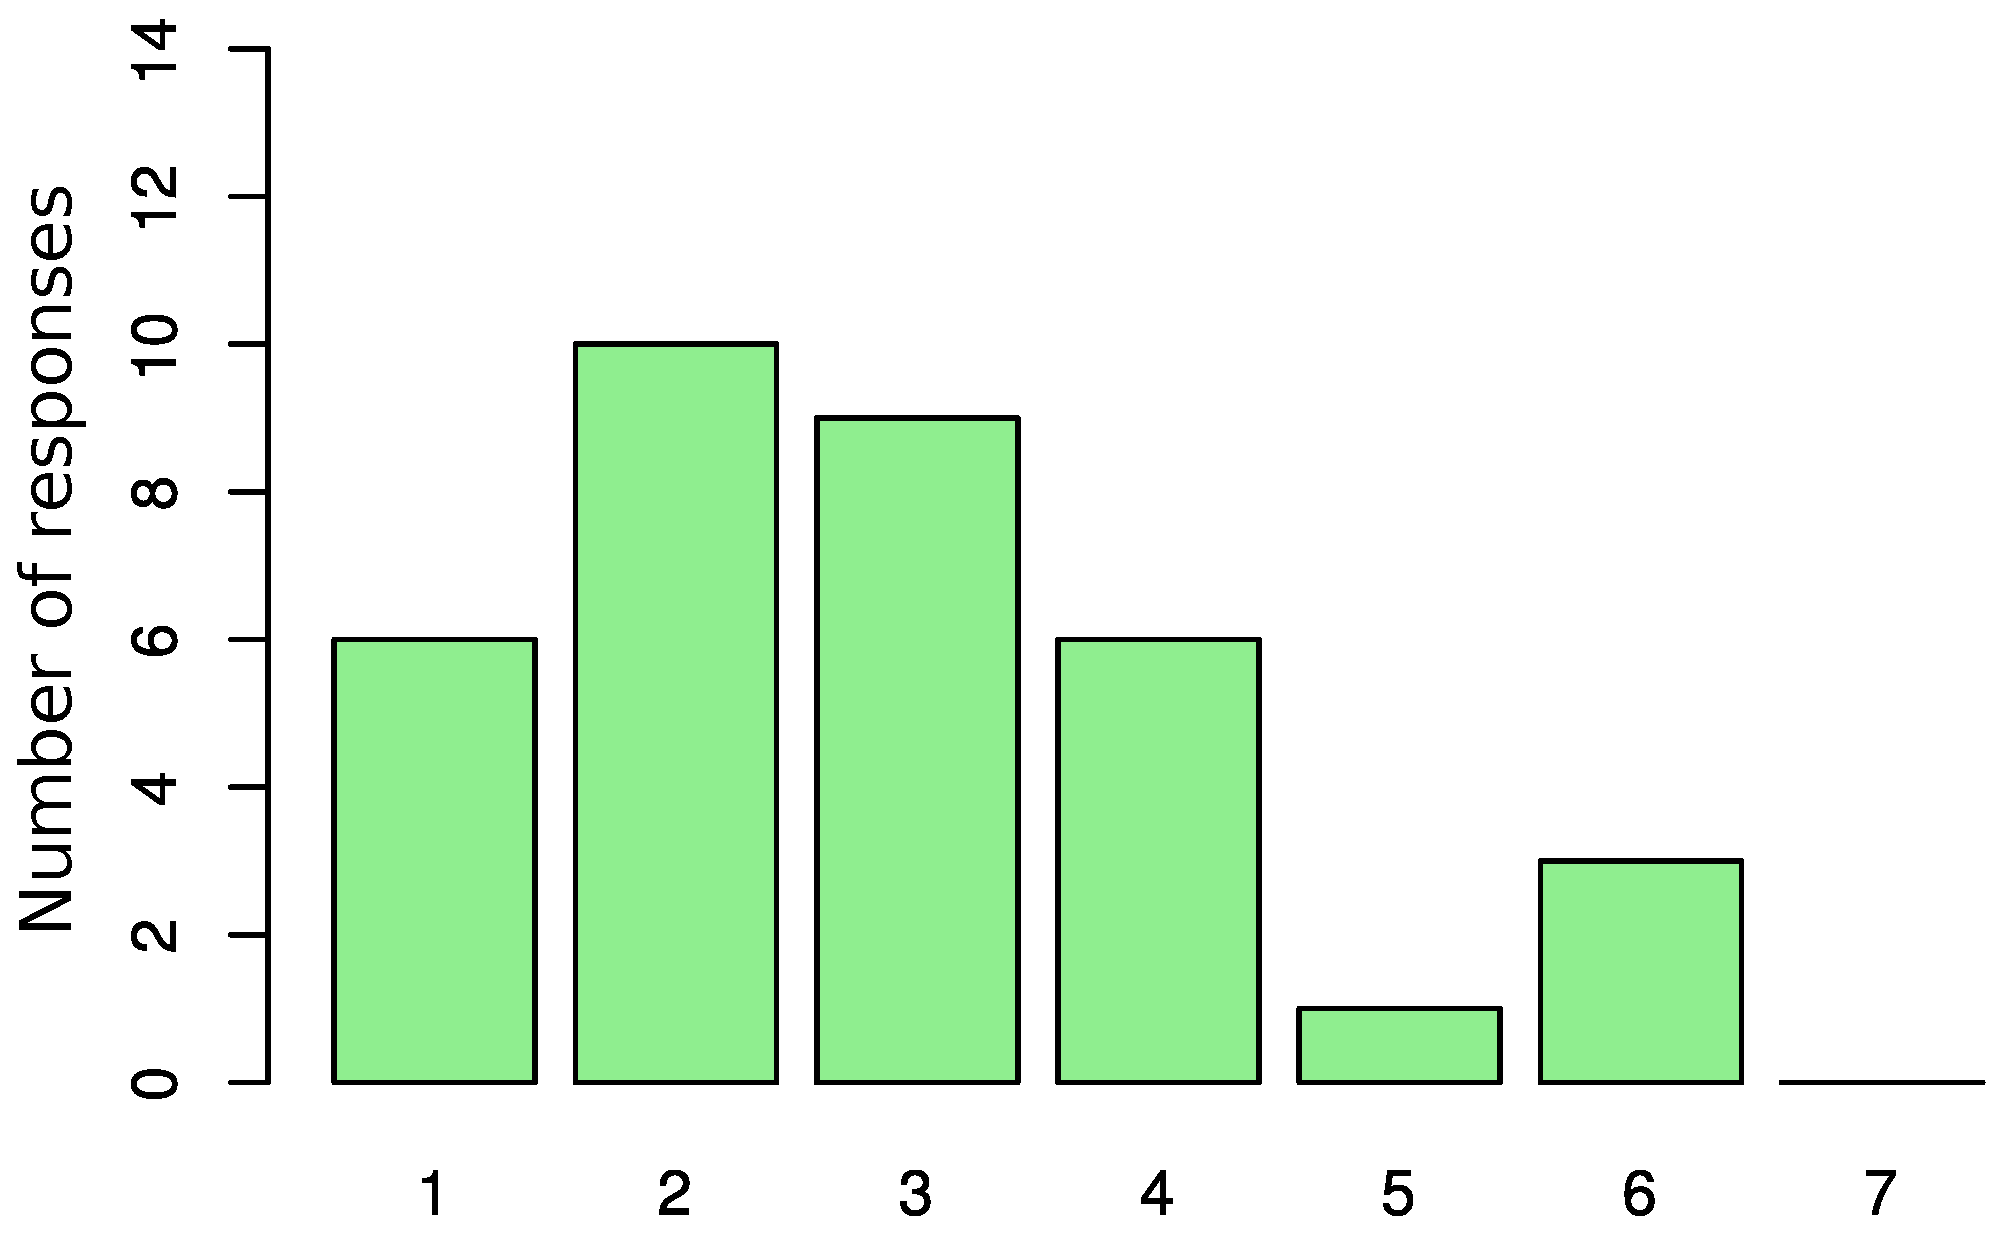
Figure 7.
Negative emotions induced by the malicious behaviour of the integrated development environment (IDE).
Figure 7.
Negative emotions induced by the malicious behaviour of the integrated development environment (IDE).

Figure 8.
Distribution of answers on consent to monitor emotions at work.

Table 1.
Eye-tracker sample quality threshold and corresponding availability.
| Sample Quality Threshold | Number of Samples Above Threshold | AV_EYE |
|---|---|---|
| % (Readings per Minute) | (N = 40,352) | |
| 80% (≥24) | 29,309 | 72.63% |
| 85% (≥26) | 28,080 | 69.59% |
| 90% (≥27) | 27,512 | 68.18% |
| 95% (≥29) | 26,026 | 64.50% |
Table 2.
Availability of video-based emotion recognition.
| Participant | FINDF | FITF | AV_VIDEO | Glasses |
|---|---|---|---|---|
| P04 | 0.92% | 3.73% | 95.35% | No |
| P06 | 3.89% | 16.52% | 79.59% | No |
| P07 | 3.78% | 2.76% | 93.46% | No |
| P08 | 1.91% | 5.47% | 92.62% | No |
| P09 | 6.23% | 25.67% | 68.10% | No |
| P10 | 5.64% | 22.47% | 71.89% | Yes |
| P11 | 0.44% | 2.84% | 96.72% | No |
| P12 | 7.10% | 33.83% | 59.06% | Yes |
| P13 | 4.53% | 28.16% | 67.31% | Yes |
| P14 | 3.70% | 11.72% | 84.58% | No |
| P15 | 2.17% | 0.86% | 96.97% | No |
| P16 | 4.73% | 13.58% | 81.69% | No |
| P17 | 5.92% | 5.79% | 88.29% | No |
| P18 | 2.95% | 5.10% | 91.95% | No |
| P19 | 5.88% | 36.41% | 57.71% | Yes |
| P20 | 31.54% | 19.96% | 48.51% | No |
| P21 | 39.46% | 7.87% | 52.67% | No |
| P22 | 2.52% | 4.77% | 92.71% | No |
| P23 | 44.79% | 50.23% | 4.98% | Yes |
| P24 | 1.67% | 13.18% | 85.16% | Yes |
| P25 | 2.63% | 4.22% | 93.14% | No |
| P26 | 4.11% | 50.73% | 45.16% | Yes |
| P27 | 3.95% | 3.46% | 92.59% | No |
| P28 | 4.87% | 3.23% | 91.91% | No |
| P29 | 12.10% | 10.44% | 77.45% | No |
| P30 | 1.71% | 2.99% | 95.30% | No |
| P31 | 3.51% | 16.19% | 80.31% | No |
| P32 | 2.22% | 8.02% | 89.75% | No |
| P33 | 13.42% | 30.58% | 56.00% | No |
| P34 | 10.65% | 54.71% | 34.64% | Yes |
| P35 | 9.29% | 20.27% | 70.44% | Yes |
| P36 | 5.08% | 7.49% | 87.42% | No |
| P37 | 2.04% | 4.41% | 93.55% | No |
| P38 | 2.24% | 3.72% | 94.04% | No |
| P39 | 1.33% | 0.96% | 97.72% | No |
Table 3.
Average availability of video-based emotion recognition.
| FIND | FIT | AV | ||
|---|---|---|---|---|
| All | Mean | 7.40% | 15.21% | 77.39% |
| SD | 10.28% | 15.06% | 21.35% | |
| No Glasses | Mean | 6.36% | 8.55% | 85.09% |
| SD | 9.15% | 7.66% | 13.97% | |
| Glasses | Mean | 10.41% | 34.44% | 55.15% |
| SD | 13.17% | 14.86% | 24.04% |
© 2018 by the author. Licensee MDPI, Basel, Switzerland. This article is an open access article distributed under the terms and conditions of the Creative Commons Attribution (CC BY) license (http://creativecommons.org/licenses/by/4.0/).
Share and Cite
MDPI and ACS Style
Wrobel, M.R. Applicability of Emotion Recognition and Induction Methods to Study the Behavior of Programmers. Appl. Sci. 2018, 8, 323. https://doi.org/10.3390/app8030323
AMA Style
Wrobel MR. Applicability of Emotion Recognition and Induction Methods to Study the Behavior of Programmers. Applied Sciences. 2018; 8(3):323. https://doi.org/10.3390/app8030323
Chicago/Turabian StyleWrobel, Michal R. 2018. "Applicability of Emotion Recognition and Induction Methods to Study the Behavior of Programmers" Applied Sciences 8, no. 3: 323. https://doi.org/10.3390/app8030323
Note that from the first issue of 2016, this journal uses article numbers instead of page numbers. See further details here.