1. Introduction
Biomass residues arise from nearly all agricultural and agro-industrial productions. Such kind of waste requires proper disposal, in accordance to law requirements. Therefore, it represents a cost to producers and local communities as a whole. Owing to that, policies are currently oriented towards the valorization of such waste materials, as a source for both new materials and (renewable) energy. Between these two alternatives, valorization to produce new valued materials is preferred [
1].
In the present study, grape seeds are utilized as a secondary raw material to produce granular activated carbon, with potential utilization as an adsorbent or catalyst support. Grape seeds arise from winemaking process, and they contribute up to 15% of the total solid waste that is generated by the process [
2]. Nowadays, when not disposed of as a waste, grape seeds are mostly utilized for the extraction of grape seed oil [
3], which is universally recognized for its valuable properties, as it contains a number of noble compounds [
4]. Such oil is thus utilized for food and nutraceutical applications. Grape seeds can be also used in animal feed mixture [
5], although this is a lower added-value application.
The production of activated carbon from biomass residues is getting popular recently due to the abundant availability of such feedstock and its very low cost. Almost all sorts of biomass waste have been investigated as activated carbon precursors, such as wood [
6], seeds [
2,
7], shells [
8,
9,
10], stones [
11,
12], straw [
13], husk or hulls [
6,
13,
14], sawdust [
14], and even ashes [
15,
16,
17]. However, not every substrate can be considered as a potential candidate for activated carbon production. Indeed, in order to move from research applications to actual industrial production, continuous supply of the chosen biomass should be ensured. If a mere agricultural residue (e.g., rice husk, date stone, and durian shell) is taken into account, it should be collected over very wide areas to obtain the amounts and the continuity required by industrial operations. This would be detrimental for the economic feasibility of the waste biomass valorization path. It would be more practical if the considered feedstocks were accumulated in an industry as a side product of an existing agro-industrial process, so that the steadiness of the supply could be assured. Potential candidates could be palm kernel shells from palm oil industries [
9], bagasse fly ashes from sugarcane industries [
17], potato peels from food industry [
18], Jatropha shells from biodiesel production facilities [
19], and grape seeds from winemaking industries.
Some experimental works reported the possibility to use grape seeds as precursor for activated carbon [
2,
8,
20,
21,
22]. The highest surface area (S
BET) of 1339 m
2/g was obtained by a laborious method of cyclic oxygen chemisorption-desorption activation [
21], while the conventional chemical impregnation followed by thermal activation method was able to reach a surface area of 1238 m
2/g using 50 wt % potassium carbonate (K
2CO
3) at 800 °C [
22]. Most of the grape seeds activated carbons showing high-surface area (S
BET > 1000 m
2/g) possesses a large volume fraction of micro-pores with low development of larger pores, which may limit the application for liquid adsorption, except for ZnCl
2 activated samples [
8]. As a drawback, the cyclic method seems ill-suited to further industrial development due to its laborious and time-consuming procedure.
In these previous studies, except for the cyclic activation method, the activated carbon is prepared by means of a single stage process, i.e., chemical activation, where carbonization and activation occur simultaneously. Such a method requires a single high-temperature reactor, and carbonization and activation steps necessarily take place at the same reaction conditions. Therefore, it is not possible to find distinct optimal parameters for each process step (i.e., carbonization and activation), which could potentially result into more efficient operations.
If, rather than a single-stage, a two-stage process is considered, the optimal conditions for the carbonization step would result in less usage of activator. This would translate into less harmful chemicals being involved in the process. Furthermore, moving to a two-stage process would imply a potentially better control of porosity development, with the possibility of tailoring the final product for the desired application. Therefore, despite the need for two reactors, a two-stage process could potentially give interesting and valuable advantages. In such a scheme, the carbonization of the precursor can be performed through different alternative technologies, such as torrefaction, pyrolysis, and hydrothermal carbonization (HTC), among which HTC can be considered as the most “green” process, as it minimizes the energy uptake [
23].
Indeed, by applying HTC alone, hydrochar (i.e., the solid product from HTC) from lignocellulosic materials already gains ability as adsorbent due to its surface chemistry. Even though the porosity of hydrochar is very low, less than 10 m
2/g, the hydrochar surface is rich in oxygenated functional groups (carboxylic, hydroxyl/phenolic, carbonyl), which have significant capabilities for the sorption of particular molecules in solution through cation exchange mechanisms [
24]. The adsorption capacity of hydrochar can be further increased by developing its porosity using activation at an elevated temperature. The heat treatment with a chemical or physical activating agent is effective for pore development, but may suffer from surface functional group losses as a tradeoff [
16].
Recently, HTC of biomass followed by physical or chemical activation to produce activated carbon has been extensively studied. Sevilla and Fuertes [
25] tested sawdust in order to produce high surface area activated carbon (>1200 m
2/g) by the two-stage method: HTC followed by chemical activation. They used a KOH/hydrochar ratio of 2, or, alternatively, 4, which allowed for the development of a large number of micro-pores suitable for CO
2 capture. Hao et al. [
26] performed HTC followed by CO
2 or H
3PO
4 activation using four different wastes: grass cuttings, horse manure, beer waste, and bio-sludge. They produced activated carbons showing a wide range of surface areas (489–1073 m
2/g) to be used for CO
2 adsorption. Pari et al. [
27] produced porous carbon spheres from HTC at 250 °C followed by KOH activation at 800 °C. Starting from cassava and tapioca flour, they obtained surface areas approaching 1000 m
2/g. Larger pore size (meso-pores) activated carbon, suitable for wastewater treatment applications, was prepared form hard biomass (coconut shells and date stones) hydrochar by using NaOH as activating agent [
28,
29]. Raw hydrochar and hydrochar activated with KOH was prepared and used for water treatment by Chung et al. [
30], starting from sewage sludge. Recently, Rodriguez Correa et al. [
31] produced hydrochar from the digestate of a biogas plant and activated it with KOH. The resulting activated product revealed to be very effective for gas treatment, with a good affinity towards CO
2.
In the present study, grape seeds activated carbon was produced by means of a two-stage process. The first stage is represented by HTC: grape seeds were treated in liquid pressurized water at moderate temperatures in the range 180–250 °C. Through HTC, the seeds can be processed without prior drying, thus avoiding the considerable amount of energy that is required for water evaporation. This can be a crucial advantage when compared to other carbonization processes, like pyrolysis, which requires relatively dry substrates (maximum acceptable moisture content ≈30%) and a dry environment [
32].
Moreover, hydrochar is known to have a very low porosity. This can be beneficial for the development of (micro) porosity during the subsequent activation stage, which was performed with KOH at 600 °C at different KOH:hydrochar ratios. Following this approach, it can be thus expected to obtain a valuable, highly micro-porous carbonaceous solid, by operating at milder conditions than the current state-of-art technologies.
To our knowledge, it is the first time that a two-stage process involving HTC and chemical activation is utilized for grape seeds to produce granular activated carbon (GSAC). The materials that are produced by each processing step were fully investigated by means of BET, SEM and FTIR characterization techniques. The various samples were also characterized in terms of thermal stability, and elemental and proximate analyses. In this way, it was possible to compare effectively the process outcomes with those of the one-stage approach and to understand how process parameters influence the quality of the produced solids. The results here presented allow for demonstrating that, when compared to single-stage processes, milder reaction conditions can be adopted in the two-stage process to obtain similar surface areas. Interestingly, GSACs were quite thermally stable and their surface resulted rather free of functional groups.
2. Materials and Methods
Grape seeds were collected from an alcohol producer company located in the Trentino province, in the North-East of Italy. The company receives grape marc from local winemaking producers. Grape seeds are separated from grape skins by wet sieving. They are then dried and normally sold for grape seed oil extraction. Thus, grape seeds were collected dry, with a residual moisture content of about 5 wt %, as measured in our laboratory. In a hypothetical GSAC industrial production process, the drying step could be avoided and the moist grape seeds could be directly fed to the HTC reactor.
The production of GSAC was carried out through two stages: HTC followed by KOH activation. Importantly, grape seeds were not ground in order to preserve the granular nature of the seeds. Such choice was done in order to obtain a granular material that can be directly utilized as an adsorbent, without prior granulation operation, or, eventually, size reduction.
HTC was carried out in a batch autoclave. The experimental setup included a 50 mL cylindrical stainless steel reactor whose walls were surrounded by an electrical band heater. A thermocouple and a pressure meter allowed for the measurement of process temperature and pressure. The reactor temperature was kept constant by means of a temperature control loop. Further details about such experimental apparatus can be found elsewhere [
33,
34].
HTC experiments were carried out at three different temperatures: 180, 220, and 250 °C. For each run, 6.0 g of grape seeds were loaded in the reactor, along with 20.0 g of distilled water: HTC runs were performed at a dry biomass to water ratio of about 0.3. The use of such a high ratio is motivated by the fact that a HTC industrial plant should work at high biomass loads to minimize operating and investment costs [
35]. The reactor was then heated up to reaction temperature; the heating phase lasted about 15–20 min, depending on the desired reaction temperature. Once the set-point temperature had been reached, it was held constant for 1 h. The reactor was then cooled down by placing a cold (−24 °C) massive metal disk at the reactor base and blowing compressed air at the reactor walls, in order to ensure a relatively fast cooling (15 min or lower).
After carbonization, the solid product, i.e., hydrochar, was separated from the aqueous-phase by filtration and then dried overnight at 105 °C in a ventilated oven. Such a drying operation was executed in order to determine the hydrochar yield. Indeed, this would not be strictly necessary in an actual industrial process, since the subsequent impregnation operations have to be conducted in a wet environment.
The dried hydrochar was then subjected to chemical impregnation using potassium hydroxide (KOH, Merck, Darmstadt, Germany). The KOH:hydrochar weight ratio was varied between 0.25 and 1, in order to test the effect of a reduced amount of chemical as activating agent. Indeed, the proposed two-step approach is able to greatly reduce the amount of chemical needed. When only KOH activation is utilized, it is common to use a KOH amount that is even more than three times the char weight. Impregnation was done by manually mixing hydrochar with a KOH concentrated aqueous solution at room temperature, and then drying in an oven at 100 °C overnight. The impregnated hydrochar was then weighed, supported inside a ceramic pipe, and subjected to the heat treatment at 600 °C under N
2 flow inside a horizontal furnace. After reaching the set-point temperature, it was held for 1 h before cooling down to room temperature. The so activated hydrochar, i.e., GSAC, was then removed from the pipe and washed using 0.5 N HCl solution several times, followed by hot distilled water, until a constant pH of the filtrate was reached. The sample was then dried overnight and weighed again, in order to calculate the activation yield Y
act:
The overall yield Y
ovr (for both products: hydrochars and GSACs) was then obtained as:
The identification codes of hydrochars and GSAC samples are listed in
Table 1, which also reports the process conditions utilized.
Hydrochars and GSAC samples were characterized using NOVA 2000 surface area analyzer (Quantachrome, Boynton Beach, FL, USA). The apparent surface areas were calculated following the BET equation from the N
2 isotherms measured at 77 K. Total pore volume was defined as the volume of liquid nitrogen corresponding to the amount adsorbed at a relative pressure P/P
0 = 0.99. Micro-pore volume was determined from the DR (Dubinin–Radushkevich) method [
36] through N
2 adsorption up to P/P
0 ≤ 0.1. The degassing of the samples was performed under vacuum at a temperature of 110 °C and for a duration of 12 h. NLDFT method was utilized to obtain the pore size distribution (PSD) of the samples. The determination of pH
PZC (point of zero charge) was carried out through the method of Noh and Schwarz [
37].
Ultimate analyses were performed using a LECO 628 analyser (LECO, Moenchengladbach, Germany) for CHN (ASTM D-5373 standard method). Each analysis was performed in duplicate using about 80 mg of sample per trial. Proximate analyses were carried out by a Setaram Thermogravimetric Analyser TG-DTA/DSC (SETARAM, Caluire, France), employing a thermal program modified from ASTM D-3175-89 standard method: 20 °C/min ramp to 105 °C in air, hold time 30 min (moisture content); 16 °C/min ramp from 105 °C to 900 °C in N2, hold time 7 min (loss due to volatile matter VM); isothermal hold at 900°C in air, 30 min (loss attributed to fixed carbon FC). Inorganic matter (“ash”) comprised the residual. About 25 mg of sample were used for each thermogravimetric analysis. The thermal stability of the samples was evaluated while considering the derivative thermogravimetric (DTG) curves relevant to the 16 °C/min ramp in N2.
Fourier Transform Infrared Spectroscopy (FTIR, IR-Prestige-21, Shimadzu, Tokyo, Japan) was used for characterizing functional groups on the sample surface, and scanning electron microscopy (SEM, JEOL JSM 6510LA, JEOL, Tokyo, Japan) was utilized for morphological observations.
3. Results and Discussion
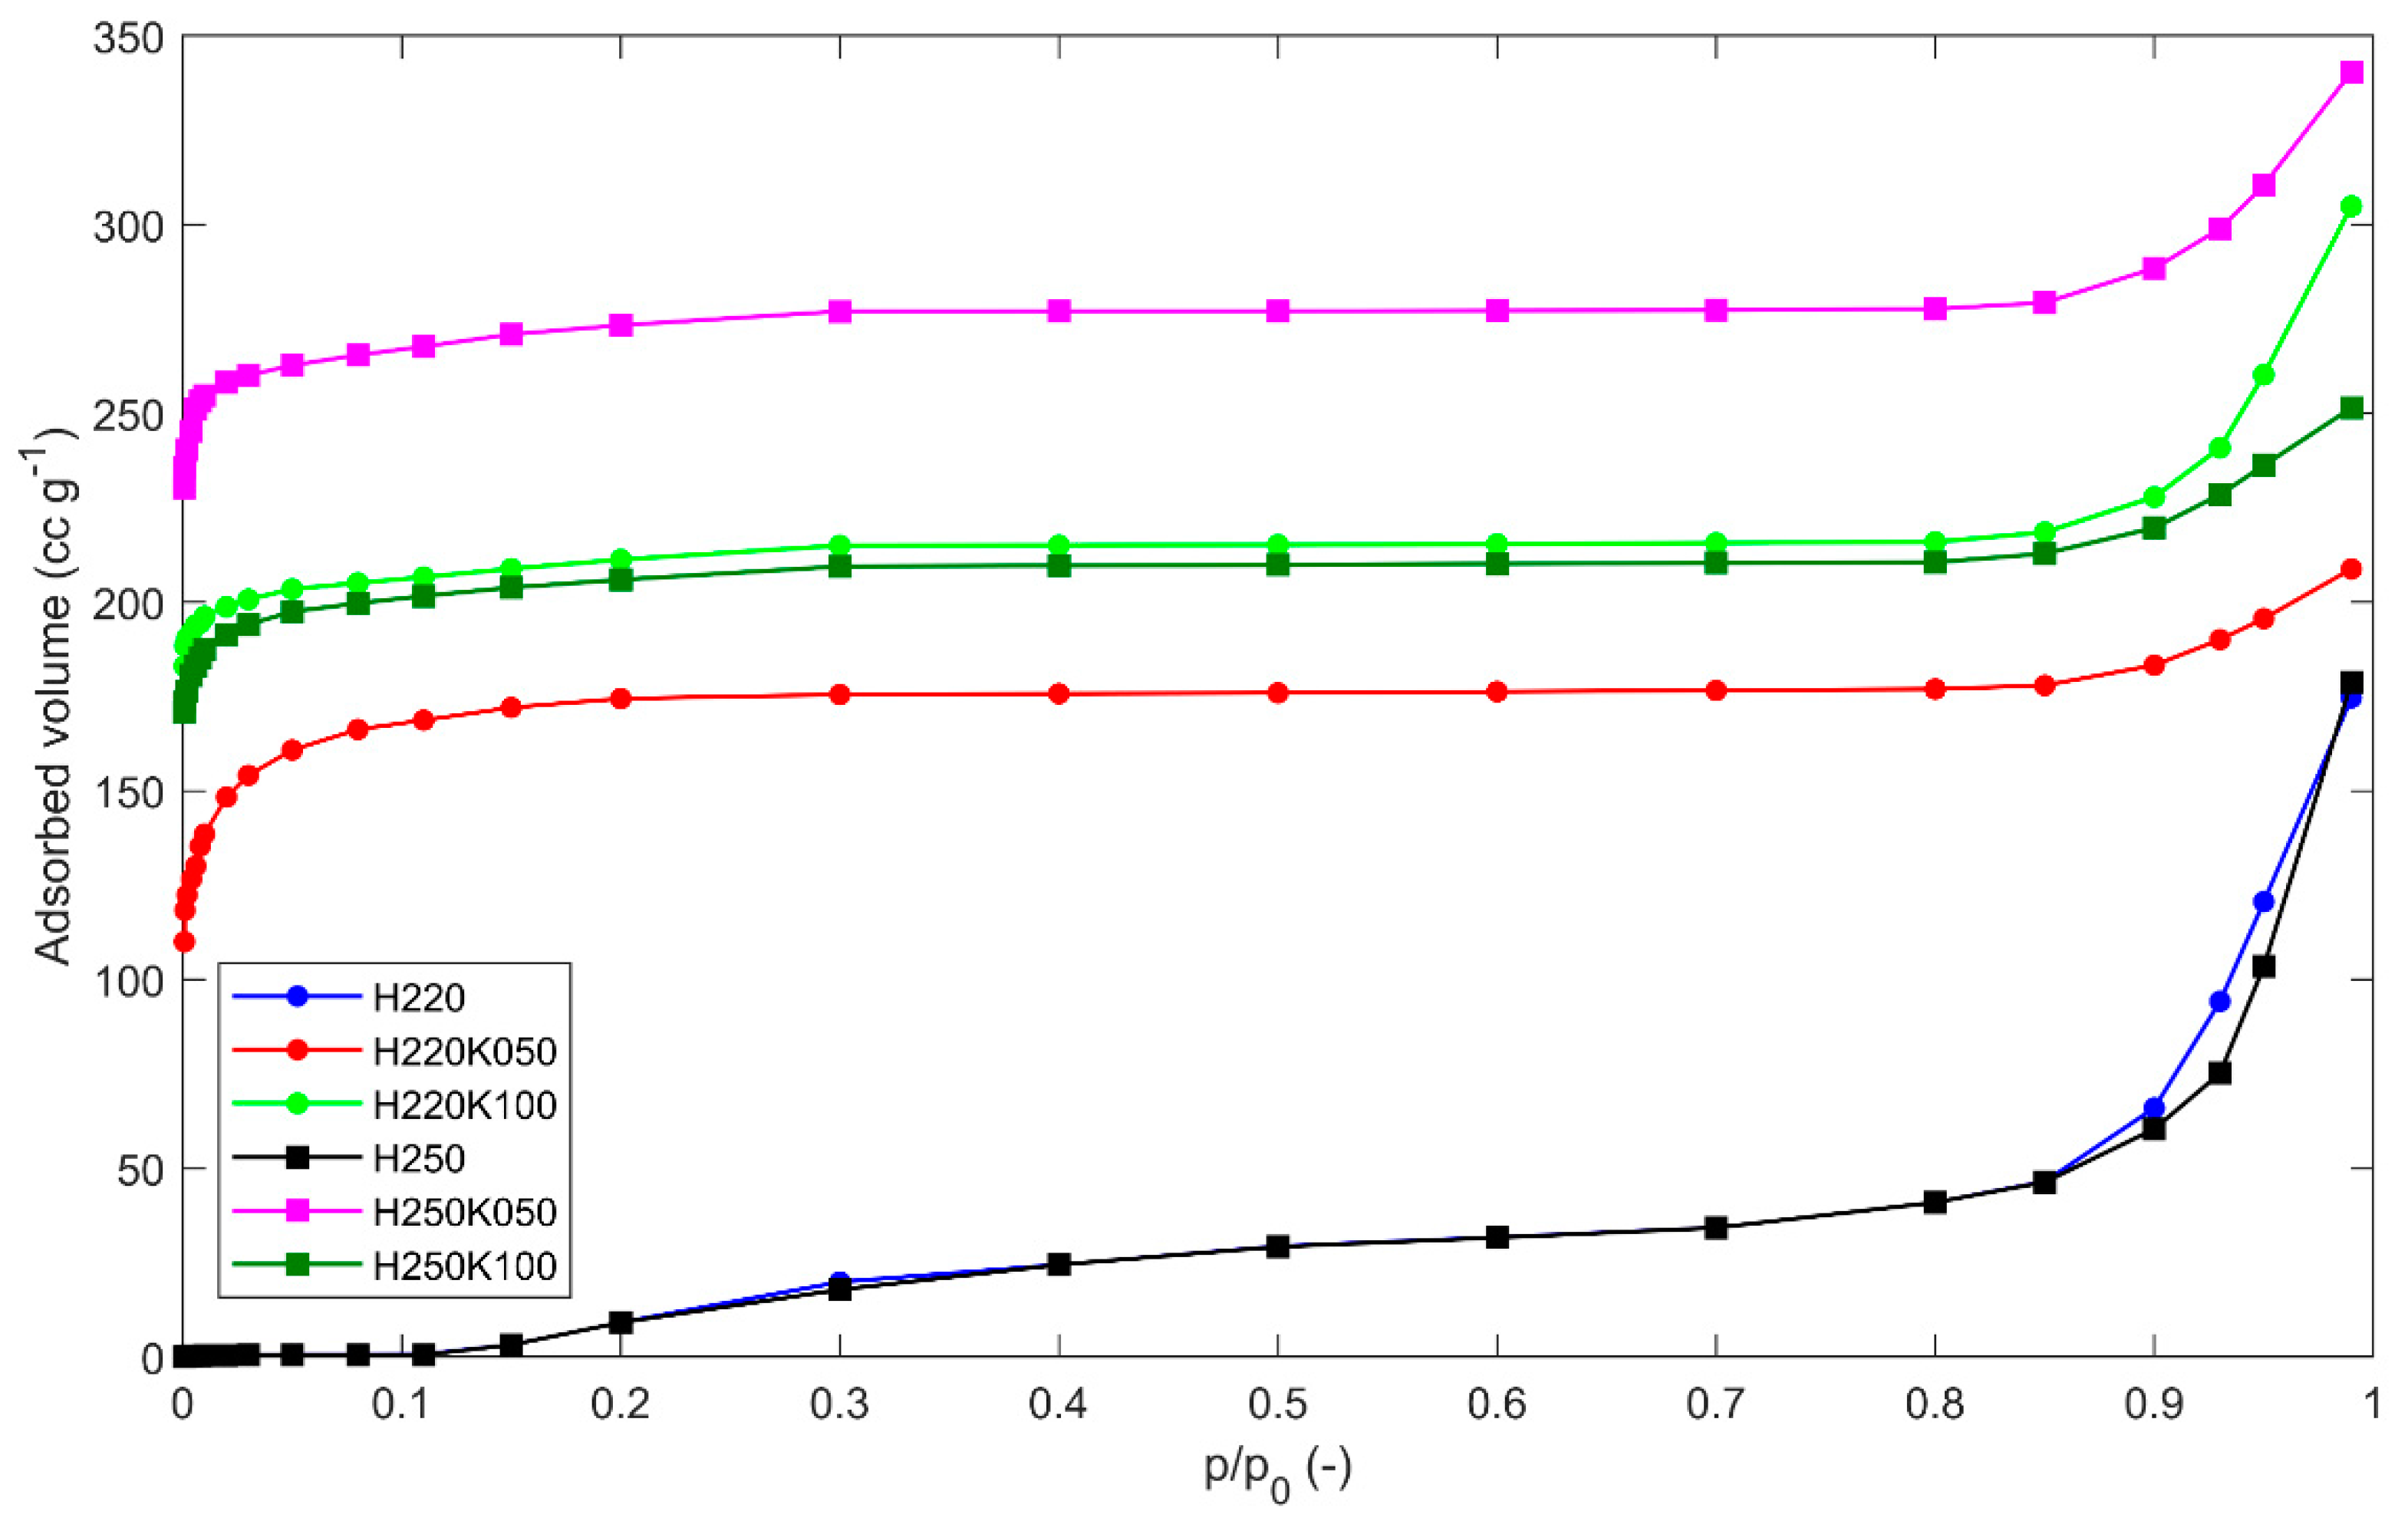
3.1. Pore Volumes and Textural Characterization by Nitrogen Physisorption at 77 K
Figure 1 shows selected adsorption nitrogen isotherms at 77 K of hydrochars and GSACs. Desorption isotherms have not been reported because they substantially overlap with adsorption isotherms. Hydrochars present gas physisorption isotherms of type II according to the IUPAC classification [
38], typical of adsorbents with macro-pore dominance or non-porous structures. A small shoulder at low P/Po indicates a small portion of micro-pores, which accommodate monolayer adsorption. By chemical activation, micro-pores are progressively developed that transform Type II isotherms of precursors into reversible Type I, which are typical of highly microporous adsorbents. The GSAC samples show Type Ia isotherms, concave to the P/P
O axis, and the nitrogen amount adsorbed at 77 K approaches a limiting value. This limiting uptake is governed by the accessible micro-pore volume, rather than by the internal surface area. A steep uptake at very low P/P
0 is due to enhanced adsorbent-adsorptive interactions in narrow micro-pores (micro-pores of molecular dimensions), resulting in micro-pore filling at very low P/P
O. These Type Ia isotherms are specifically given by microporous materials having mainly narrow micro-pores (of width < ~1 nm). The sharp increase occurring in the high P/P
0 region represents unrestricted adsorption due to macro-pores. Such a sharp increase is still present in the GSAC samples, witnessing that macro-pores are not eliminated by the activation treatment.
Table 2 shows, for each produced sample, the yields (Y
act and Y
ovr, Equations (1) and (2)) and the textural characterization: apparent surface area S
BET, apparent micro-pore surface area S
micro, total pore volume V
tot, micro-pore volume V
micro and its percentage in respect to total pore volume, the acid-basic character pH
pzc.
When the sole HTC step is considered, a higher carbonization temperature resulted in a lower hydrochar yield. This result can be explained with the increased severity of the HTC process, as reported for grape marc, i.e., a mixture of grape seeds and skins [
39,
40], and, more generally, agro-wastes [
41,
42].
Conversely, when the activation step is also considered, the GSAC yields were quite similar and did not reflect the dependence of hydrochar yield on temperature. GSAC yields were comprised in the range 30–37% for all of the samples, but H250K025 that showed a higher yield (41%). Likely, a mild HTC treatment leaves significant amounts of soft biomass matter that is easily consumed by the activator, thus causing a mere loss of matter, instead of an increase in porosity. Conversely, severe HTC conditions are more effective in yielding a material that can be later successfully activated by developing (micro) porosity, as evidenced in
Figure 2 below discussed in detail.
Table 2 shows that hydrochars had a very low surface area, which was dramatically increased by the activation step. After activation, apparent BET surface area (S
BET) increased up to three orders of magnitude, from a single digit to 1018 m
2/g. In general, a higher HTC temperature and a higher amount of activator favored the development of surface area. However, such a general trend was not respected by the results that were obtained with sample H250K050, at the highest HTC temperature (250 °C). In this case, the surface area obtained after activation at intermediate KOH:hydrochar ratio (0.50) was higher than that obtained at the highest ratio.
It is evident that the activation treatment was able to develop micro-pores. If hydrochars are taken into account, very low values of pore volume were obtained: never higher than 0.028 cc/g. Moreover, such volume was almost entirely (~90%) represented by meso- and macro-pores. The activation treatment enormously increased pore volume, up to around 0.5 cc/g. For GSACs, micro-pores were clearly preponderant, as they represented 60–90% of the total pore volume.
In general, higher amounts of activator resulted in higher micro-pore volume. However, especially for the samples that were derived from the HTC treatment at higher temperatures, a very high amount of activator induced the development of large pores. This is especially evident for the samples obtained at a HTC temperature of 250 °C. Here, with the highest amount of activator, meso- and macro-pores increased from 10.4% (H250K050) to 29.5% (H250K100) of the total pore volume that, notably, was approximately constant (~0.48 cc/g). Such result is in perfect agreement with the clear diminution in specific surface area occurred when passing from H250K050 sample to H250K100 sample.
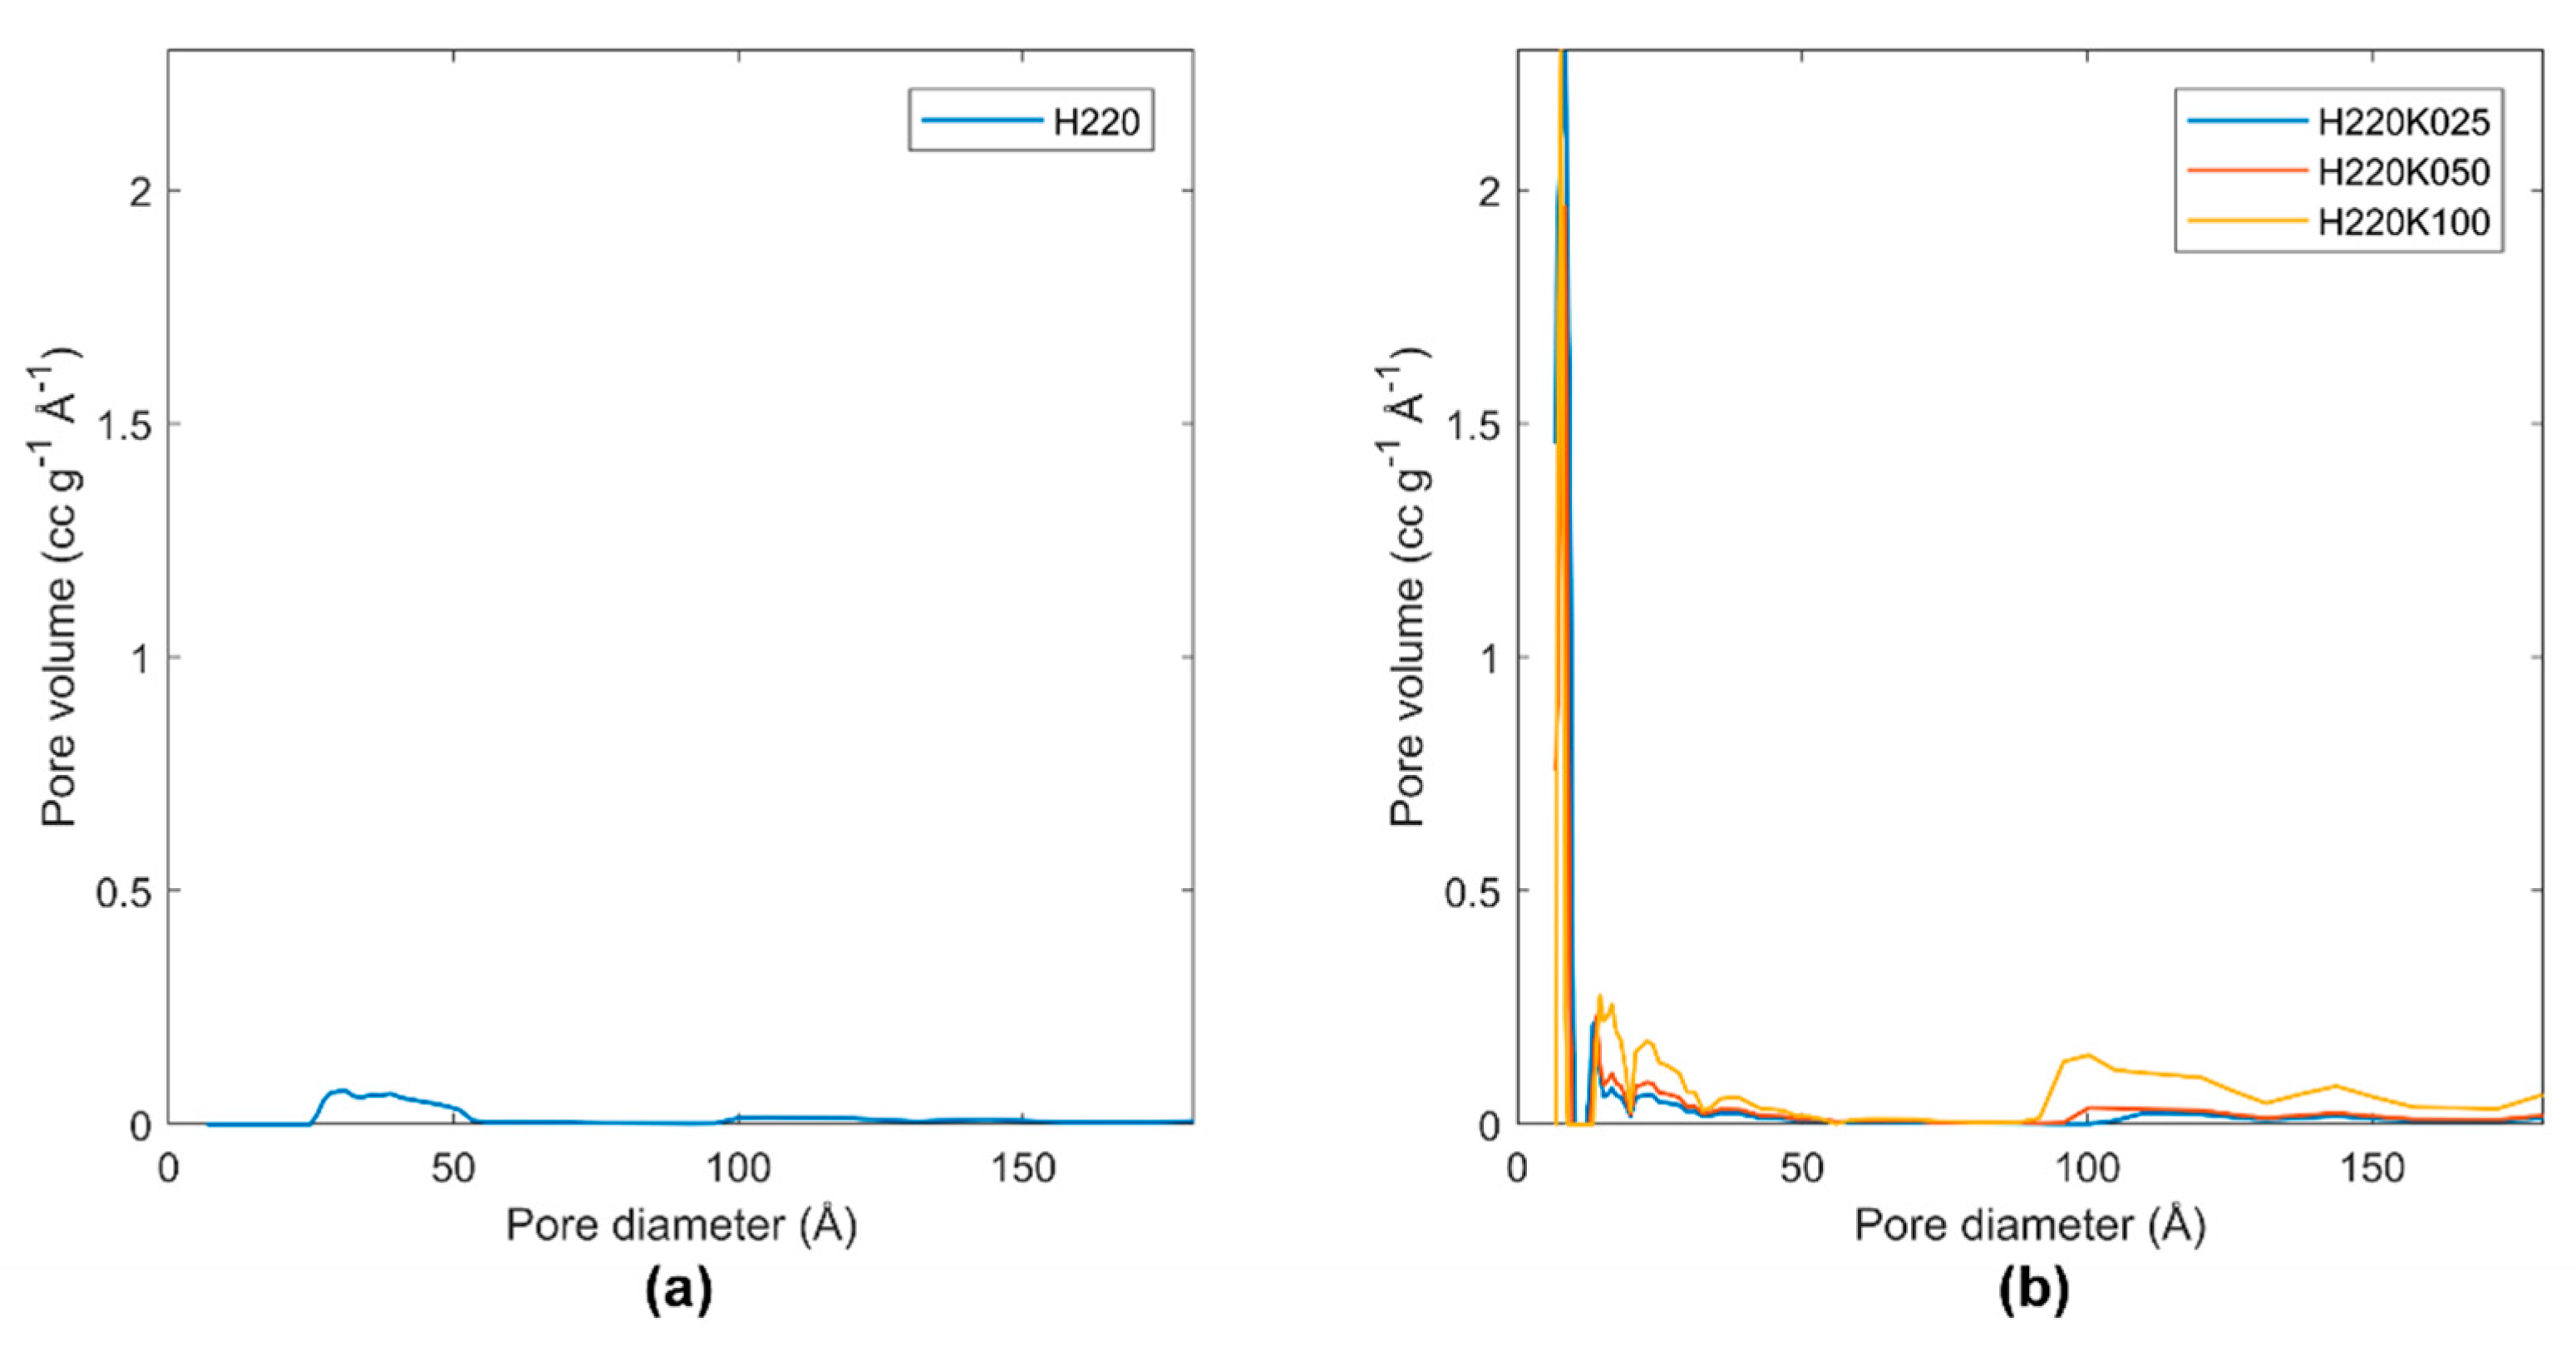
The evolution of the pore size can be observed in
Figure 2. Here, the pore size distribution (PSD) of the hydrochar and GSAC samples obtained at a HTC temperature of 220 °C is represented. A comparable situation was observed for the samples obtained at a HTC temperature of 180 °C and 250 °C, hence, the corresponding PSDs were omitted. It is confirmed that the raw char has a very low pore volume (
Figure 2a). The pores of hydrochar are in the range of meso-pores and larger. Meanwhile, the GSAC samples have a narrow micro-pore distribution, peaked at 6 Å, with a significant pore improvement in the meso-pore region in comparison to the parent hydrochar. By increasing the concentration of the activating agent, further meso-pores in the 20–50 Å range were developed. Another effect of increasing KOH concentration was the enlargement of narrow micro-pores (10 Å) into wider micro-pores (10 to 20 Å) and meso-pores, as indicated by the increase of the wider size pore peaks.
The activation procedure also caused important changes to the nature of the surface. Indeed, the pH point of zero charge (pH
PZC) data, as reported in
Table 2, testifies that the hydrochar has normally an acidic nature, with pH
PZC values ranging between 5.6 and 6.4. After the activation treatment, the resulting GSACs tend to have a basic surface. However, the addition of increasing amounts of activator tends to reduce the basic nature of the GSACs. Indeed, with a KOH:hydrochar ratio of 0.25, pH
PZC ranged between 9.5 and 10.7, while with a ratio of 1, pH
PZC was in the range 7.8–8.1.
The above discussion actually reflects the activation theory related to KOH, which foresees the following main reactions [
43]:
Reactions (4) and (6) are responsible for the decrease of yield by activation since carbon is consumed while creating cavities. It is generally accepted that the activation mechanism for pore development consists of three different paths, which can occur in sequence or in parallel: (1) opening inaccessible pores, (2) creating new pores, and, (3) widening existing pores [
43]. Our data support that the first and second paths are predominant at relatively low KOH:hydrochar ratio, while the third path prevails at higher KOH:precursor ratio. The development of micro-porosity with low amounts of activator was also observed by Okman et al. [
22]. It can be inferred that, by increasing the amount of activator, such micro-pores enlarged, until they eventually collapsed and formed larger cavities. By this process, meso- and macro-porosity increased (
Table 2). However, the HTC temperature played a crucial role. Increasing the KOH:hydrochar ratio from 0.25 to 0.50 was beneficial in terms of surface area and micro-porosity development for all of the samples, independently of the HTC temperature used. A different situation is obtained when further increasing the KOH:hydrochar ratio, namely from 0.50 to 1. Actually, the use of the highest HTC temperature and the highest amount of activator was counterproductive for surface area and micro-pore development (H250K100):
Table 2. At such operating conditions, pore walls clearly collapsed and surface area reduced.
Thus, it is definitely counterproductive carbonizing at 250 °C and activating at a KOH:hydrochar ratio equal to 1, while it is definitely positive to use a KOH:hydrochar of at least 0.50. Given this, it is not obvious to state which are the best operating conditions for the two-stage process analyzed. A techno-economic assessment would help in their selection, although such considerations are outside the scope of this work.
3.2. Proximate and Ultimate Analysis
Table 3 reports the proximate and ultimate analyses of the hydrochar and GSAC samples. The hydrothermal treatment at mild conditions (180–220 °C) did not imply significant changes in the proximate composition, when compared with the raw feedstock. Conversely, when carbonization was conducted at 250 °C, FC increased significantly, from 29.2% to 41.6%. HTC determines a diminution of the oxygen content and an increase in the carbon content, as it is well-known in the literature: the data of
Table 3 confirms that the higher is the HTC temperature, the higher is the C content and the lower is the O content.
After the activation treatment, VM is definitely reduced, dropping from a value of 64.9% ± 6.6% (standard deviation) for the three hydrochars to a value of 32.0% ± 3.4% for the nine GSACs. Correspondingly, FC increases to a value of 61.8% ± 4.3% for the GSACs. It is worth noticing that the amount of activator does not determine a trend in the values of VM. This is consistent with the yield data reported in
Table 2. A large reduction in VM already occurs with relatively low amounts of activator: higher quantities of KOH do not cause evident changes in VM and FC.
Ashes show an interesting trend. Indeed, GSACs show much higher ash contents than the corresponding hydrochar samples, which could be only partially caused by their concentration due to the overall mass loss occurring during activation. The ash content diminishes when increasing the activator amount. It could be thus hypothesized that the activation step produces ash constituents whose removal during the acid washing phase occurs only partially (see
Section 2). The clear trends observed for the ash content versus KOH amount most likely depend on the combination of activator amount and washing step. Interestingly, the higher the amount of ashes, the higher the pH
PZC of the GSACs (
Table 2).
As far as the elemental composition is concerned, it is remarkable that the amount of hydrogen drops considerably from 6.4% ± 0.2% for the three hydrochars to 1.5% ± 0.5% for the nine GSACs. The H contents of the GSACs found here is in good agreement with literature data relevant to GSACs obtained by means of (one stage) chemical activation [
22]. Such behavior can be attributed to reactions occurring during the activation procedure, such as reactions (4), (5) and (6) above. The same reactions may lead to a decrease in the oxygen content of the GSACs, which reduces from 24.4% ± 2.1% (values for the hydrochars) to 19.1% ± 5.1% for the GSACs. However, the O content is highly variable for the various GSACs, and in one case (sample H180K100), it is even higher than for the parent hydrochar. No trend of the O content with respect to the amount of activator can be seen. A similar reasoning can be made regarding the carbon content of the various samples. C content moves from 57.7% for the raw grape seeds to 67.5% ± 1.9% for the three hydrochars to 77.8% ± 5.3% for the nine GSACs, without a trend with respect to the amount of KOH. Nitrogen content slightly increases with the increase in HTC temperature, both for hydrochars and GSACs.
3.3. Thermal Stability
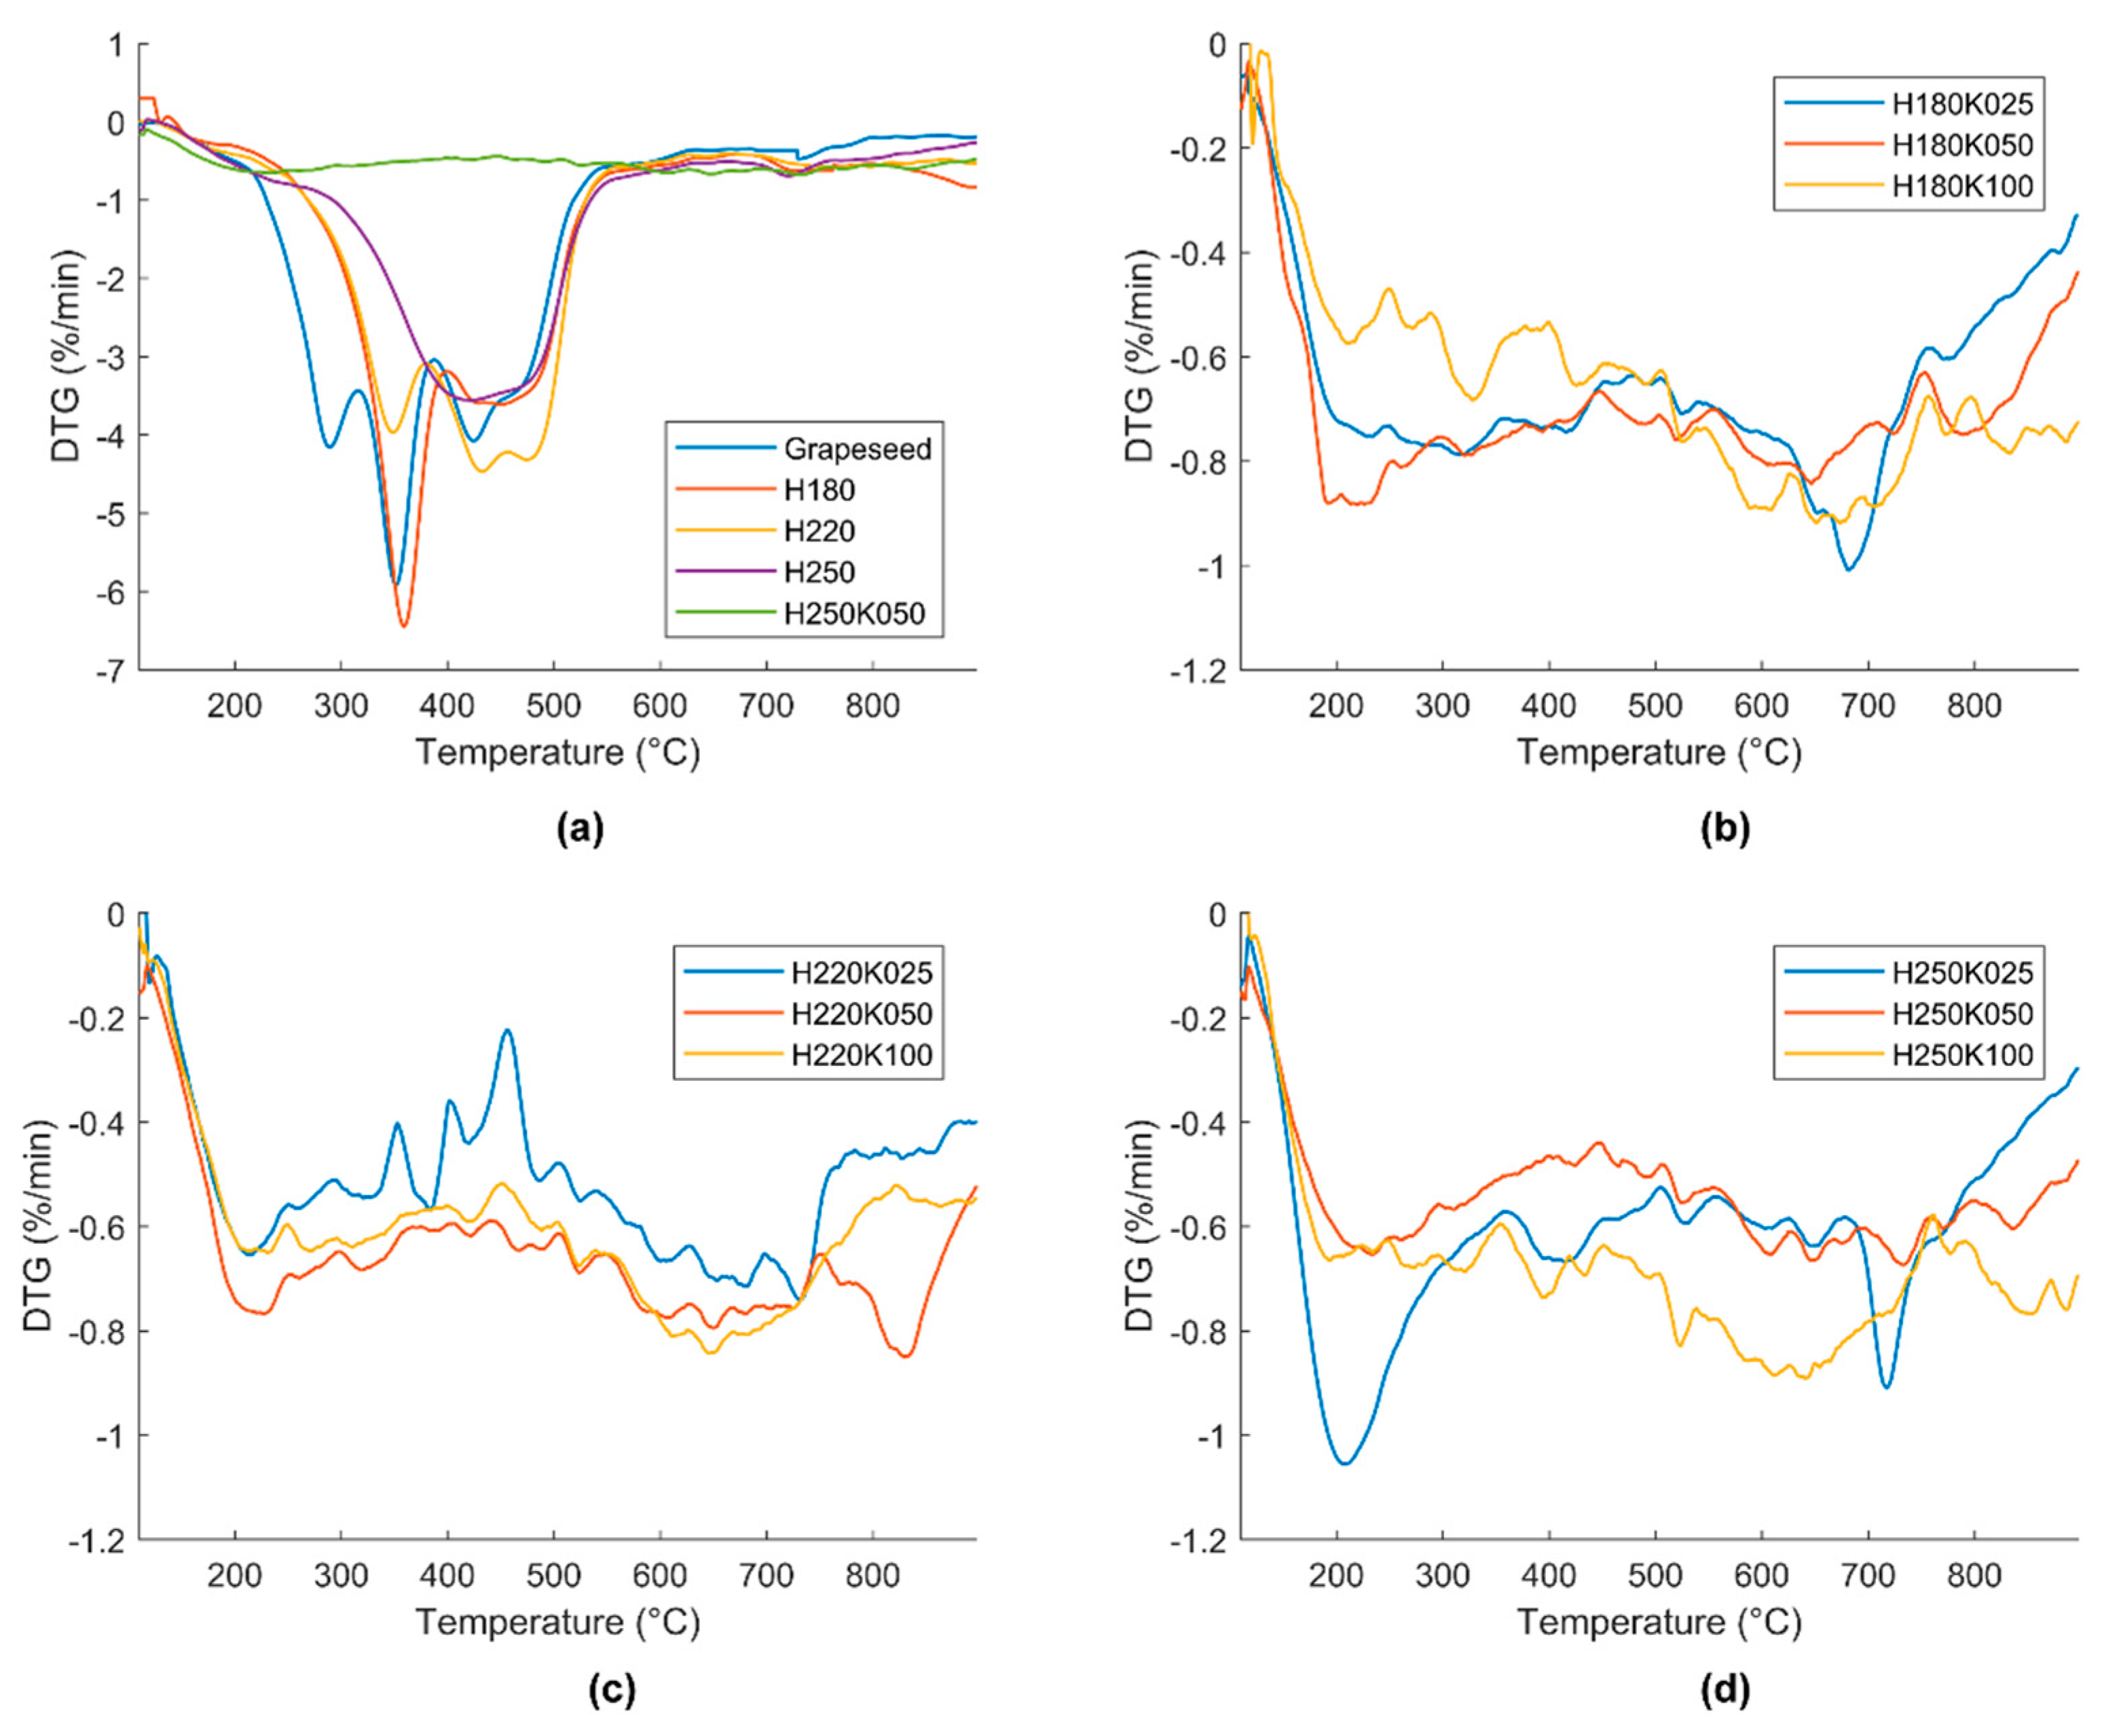
Figure 3 reports the DTG curves that are relevant to all samples. The derivative mass loss is plotted versus temperature in the temperature range 110–900 °C.
In
Figure 3a raw grape seeds, the three different hydrochar samples and one selected GSAC (H250K050) are compared. Raw biomass and all of the three hydrochars show much more evident weight losses than the activated carbon sample. In particular, grape seeds present three evident peaks, namely at about 290 °C, 350 °C, and 425 °C, the last with a shoulder at 465 °C. The different peaks could be ascribed to the degradation and volatilization of grape seeds main constituents: the oil fraction (grape seeds contains 10–15% oil [
44]), hemicellulose and cellulose, lignin. The increment of the HTC temperature results in a progressive disappearance of such peaks. Sample H180 maintains the peak at about 350 °C, and it presents a second large peak centered at about 450 °C. For sample H220, the peak at 350 °C is reduced, while the peaks at 425–465 °C increase in intensity. The hydrochar that is produced at 250 °C only presents a single wide peak at around 450 °C. The behavior shown by such samples is evident: the HTC treatment makes the less thermally stable constituents to disappear, and/or transforms them into much more stable matter.
Importantly, the subsequent activation treatment makes the difference with regard to sample thermal stability. In
Figure 3a, the DTG curve of GSAC sample H250K050 evidences this: it appears quite flat when compared to the DTG curves of hydrochars and raw biomass. Raw grape seeds and sample H180 present DTG values as low as −6%/min, samples H220 and H250 reach DTG values of about −4%/min. For sample H250K050, the DTG curve does not decrease below −0.6%/min.
Figure 3b–d evidence that all nine GSAC samples share a similar thermal stability. After the activation treatment, the derivative weight losses are far more contained, never lower than −1%/min in all of the temperature range for all the GSACs samples. In accordance with the previous discussion on proximate analysis data, GSACs do not show clear trends of thermal stability based on the amount of activator or on the HTC temperature. All of the GSAC samples, regardless their production conditions, show quite contained weight losses during TGA in N
2. The produced GSACs are thus potentially promising materials for applications involving high temperatures, for example, as catalyst supports.
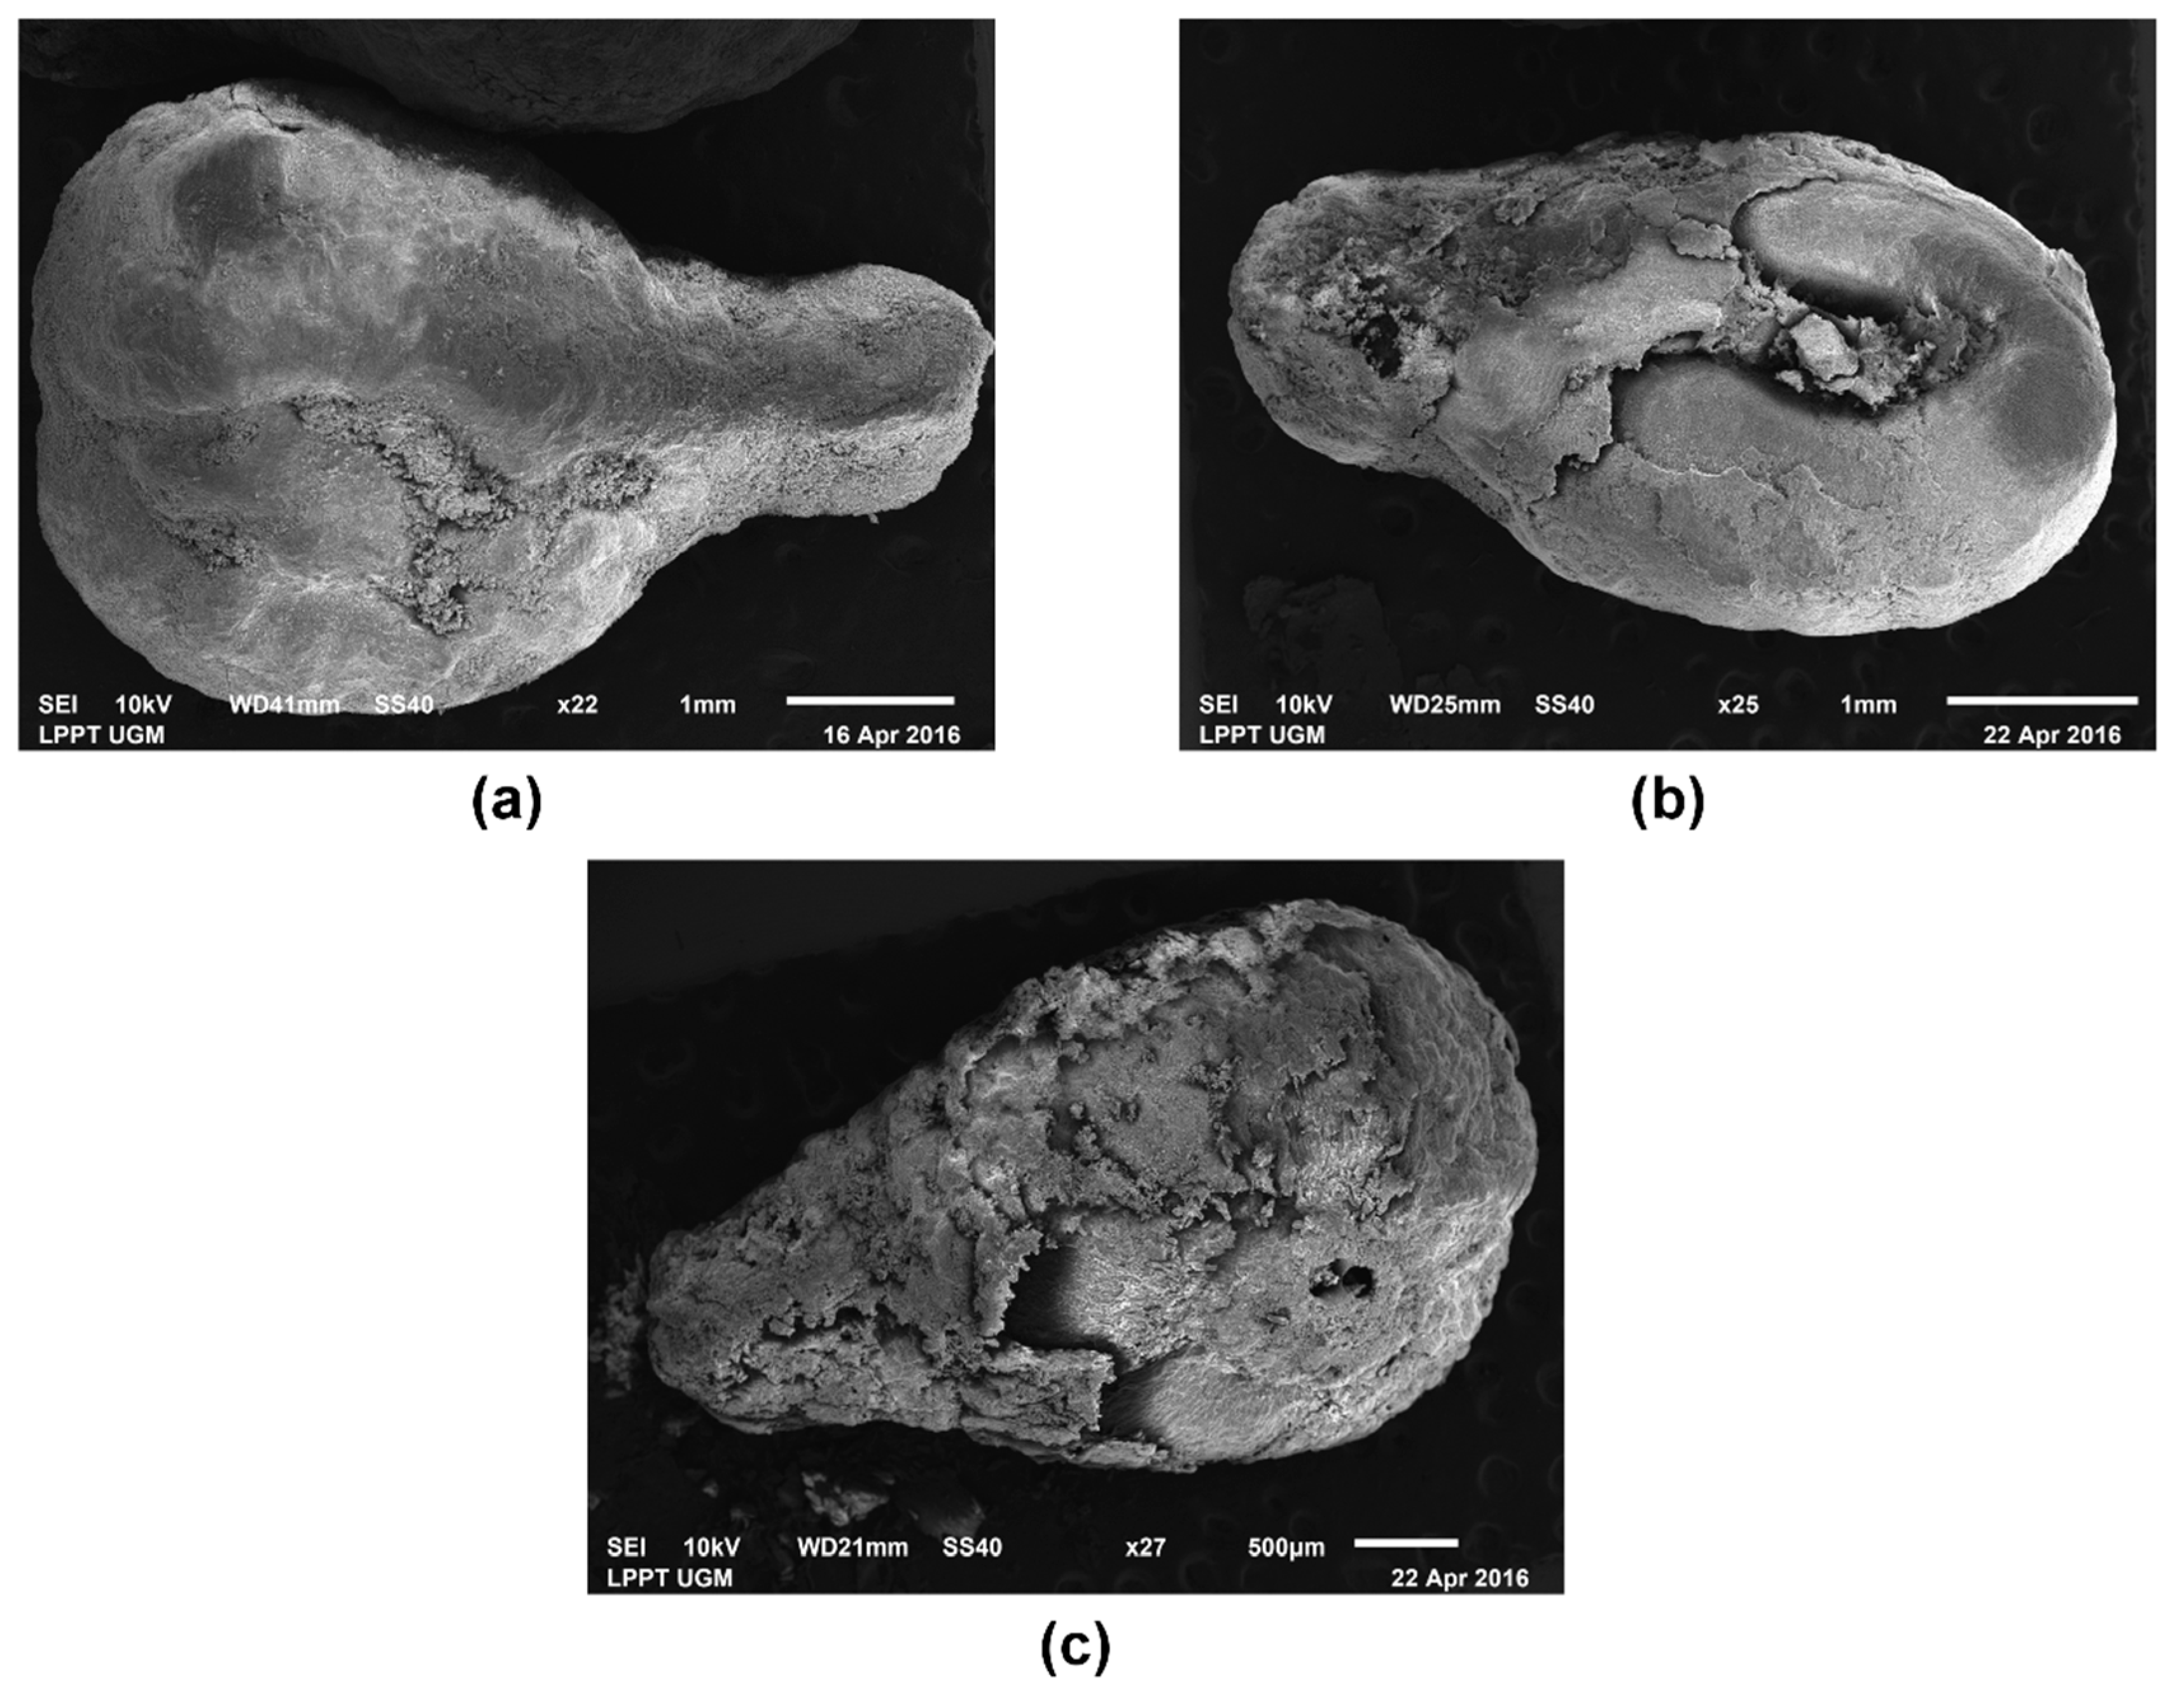
3.4. Surface Morphology by SEM
Figure 4 shows SEM images of three GSACs obtained at three different HTC temperatures and when performing the activation step with the same amount of activator (KOH:hydrochar ratio equal to 0.5).
The seed shape was preserved during the whole process, comprising carbonization and activation. However, a higher HTC temperature had a severe impact on the surface of the GSAC. At 180 °C (
Figure 4a), the surface of the seed appears quite smooth, without any major fracture. In such conditions, the inner part of the seed is almost not exposed. Things are different for the sample obtained at 220 °C (
Figure 4b). Here, some major fractures appear on the outer shell, which partially disclose the inner part of the seed. Nevertheless, the surface of the seed is still relatively smooth. For the sample obtained at a HTC temperature of 250 °C, this tendency becomes even more pronounced (
Figure 4c). Here, the shell was mostly destroyed and some large holes on the inner part of the seed char were created. Surface looks evidently rougher with respect to the previous cases, with many cavities and pores. Such visual observations support the porosity and surface area measurements shown in
Table 2.
It can be thus concluded that the process involving HTC and chemical activation was strongly influenced by the HTC temperature, which was able to increase porosity.
3.5. Chemistry Characterization by FTIR
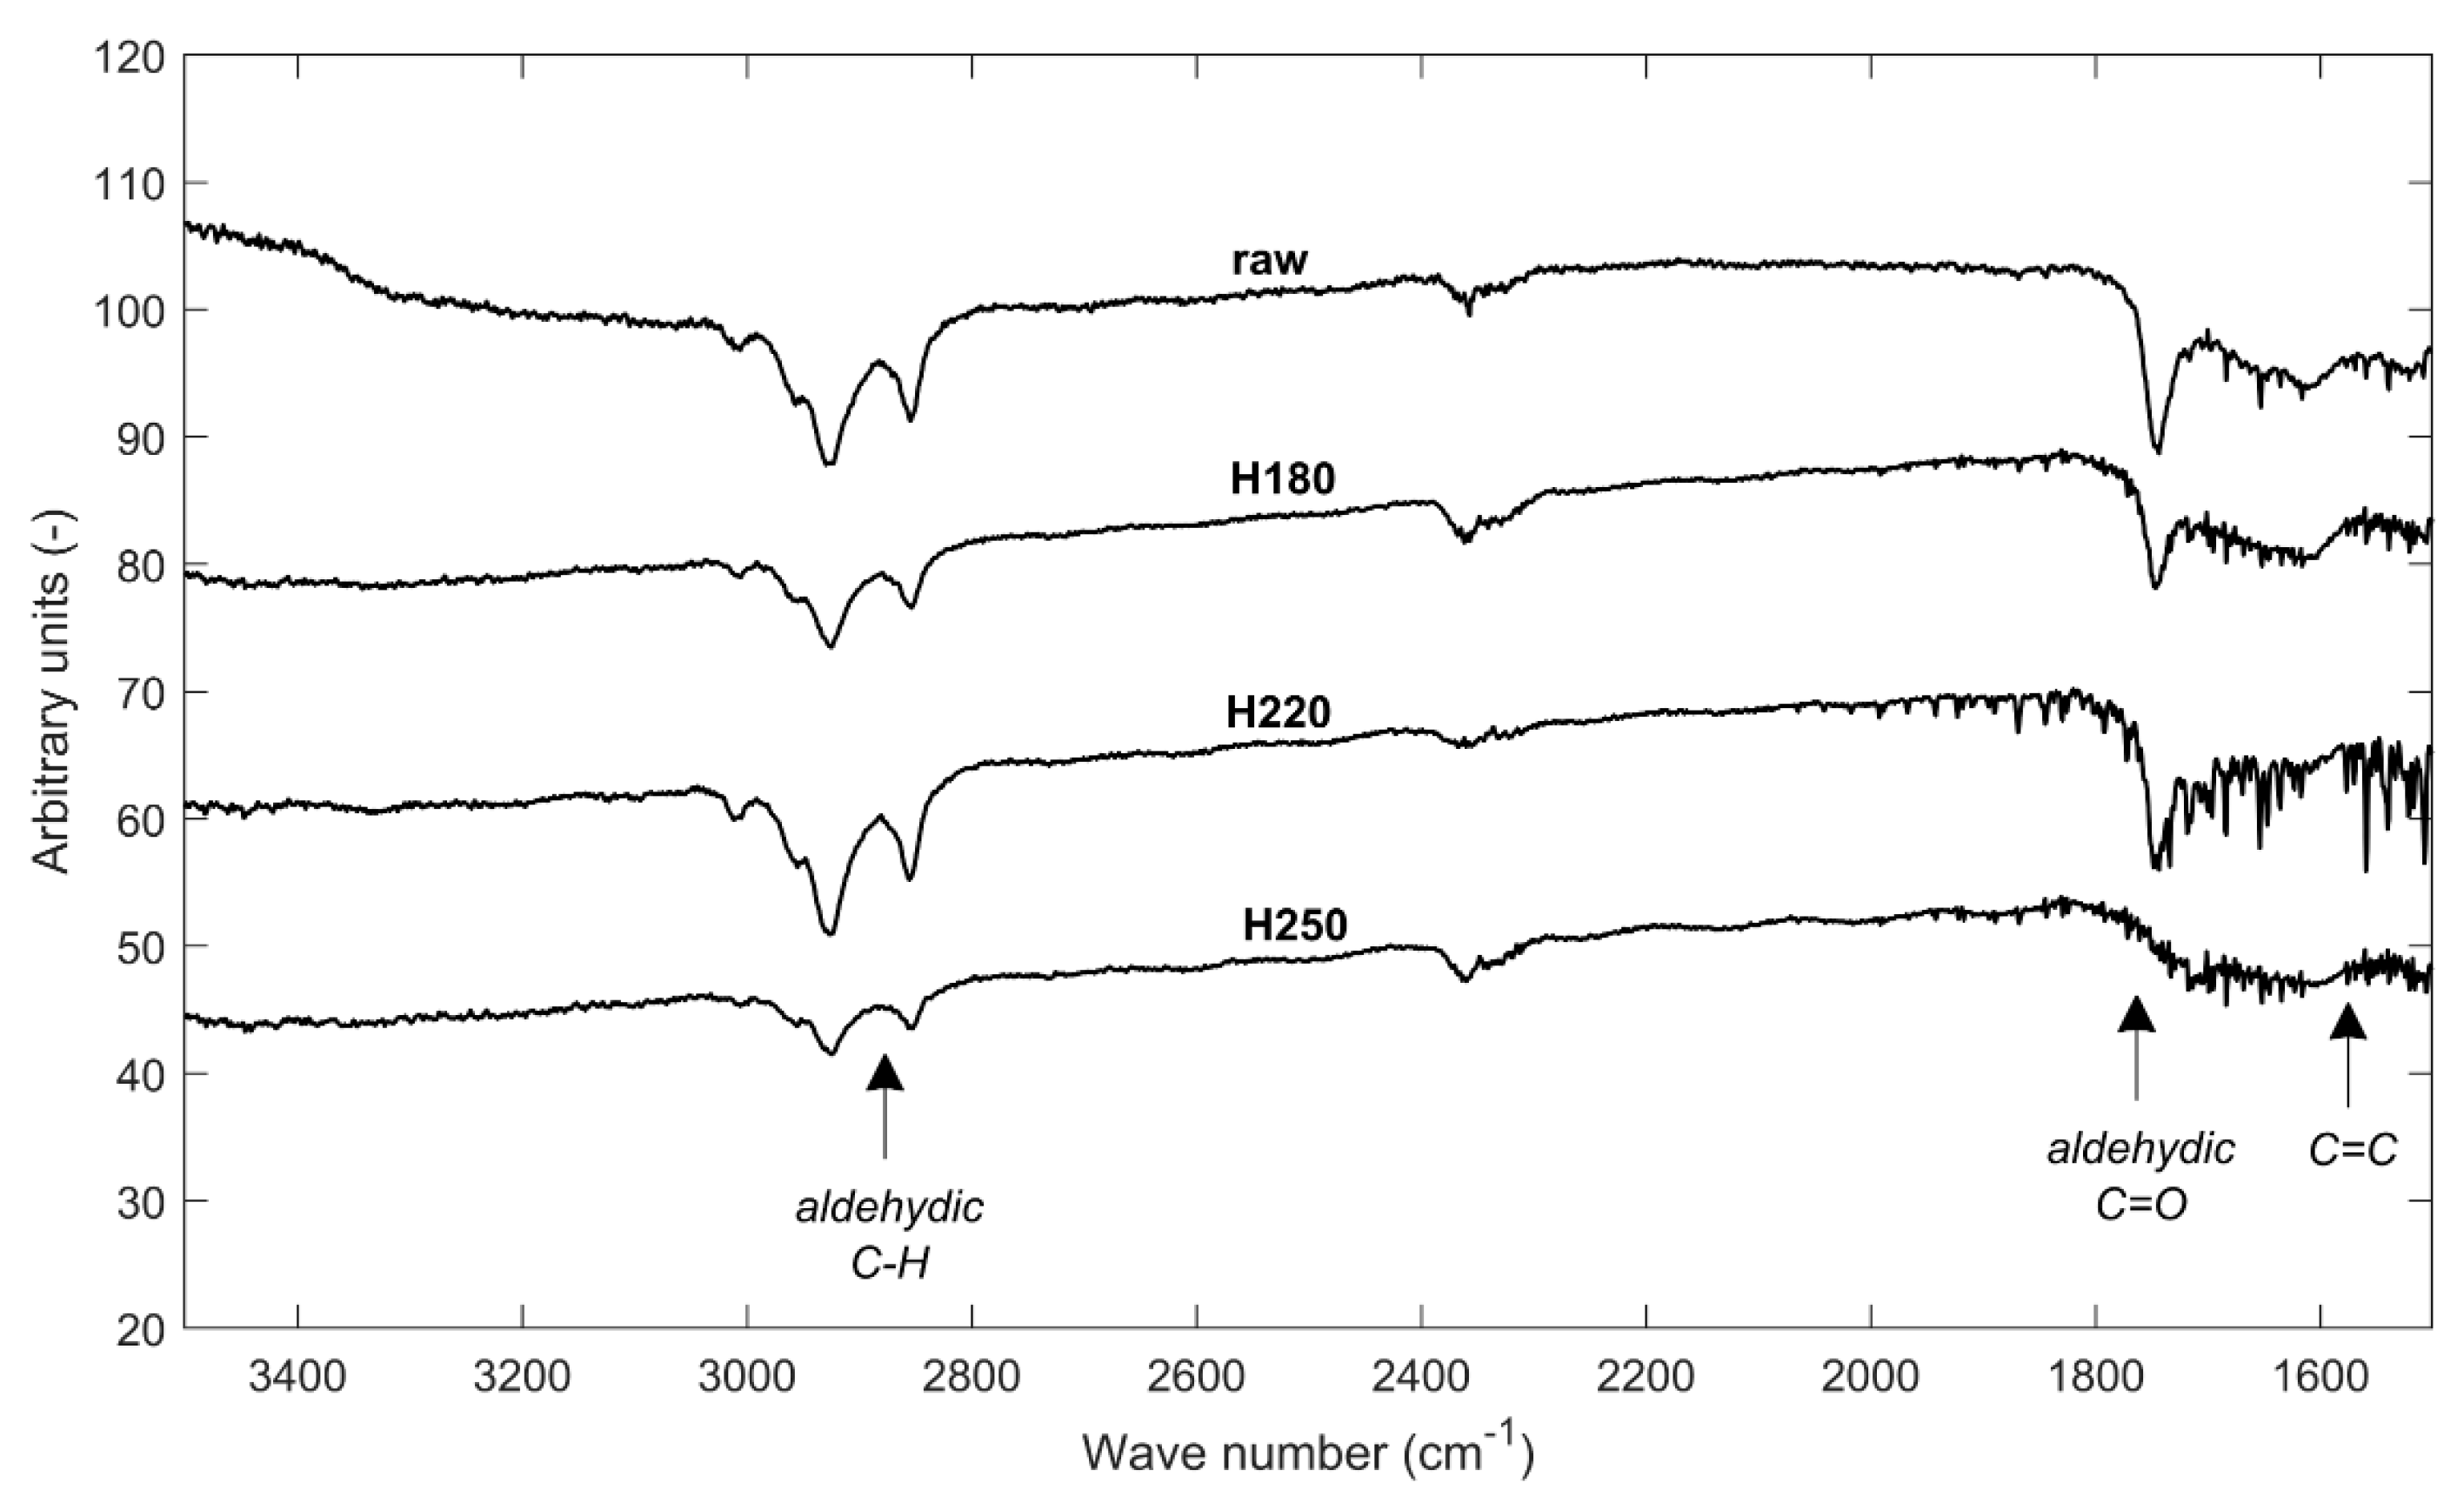
The chars produced from HTC, as well as the raw grape seeds, were analyzed by means of FTIR.
Figure 5 reports the relevant results.
The HTC chars retained some characteristic functional groups of the starting material. The peak around 3000 cm−1 represents hydrogen bounded to the unsaturated carbon chain (C–H), while slightly lower wavelength peaks indicate the group that is attached to the saturated carbon chain. The unsaturated carbon-carbon bond, possibly in the form of aromatic, is confirmed by dense peaks at about 1600 cm−1. The moderate peak around 2800 cm−1 is associated with aldehydic C–H. The existence of carbonyl (C=O), possibly in the form of aldehyde, is confirmed by the peak at 1740 cm−1.
It is interesting to notice that the signal corresponding to alkenes C–H attached to the unsaturated carbons is more pronounced at 220 °C than at 180 °C. This result is in agreement with other research studies, and can be due to aromatization reactions [
45]. However, at the highest temperature, such as peak diminishes, which is likely due to high temperature decomposition of aromatic species. Interestingly, the peak testifying the existence of carbonyl functional groups is less pronounced at the highest HTC temperature. In general, the hydrochar obtained at the highest HTC temperature shows a lower intensity for all of the peaks, suggesting that severe HTC conditions may strip the oxygen functional groups off the char surface. This is in agreement with the results of Kumar et al. [
24], who found that the lower the HTC temperature, the higher = the carbon-oxygen complexes availability on the hydrochar surface.
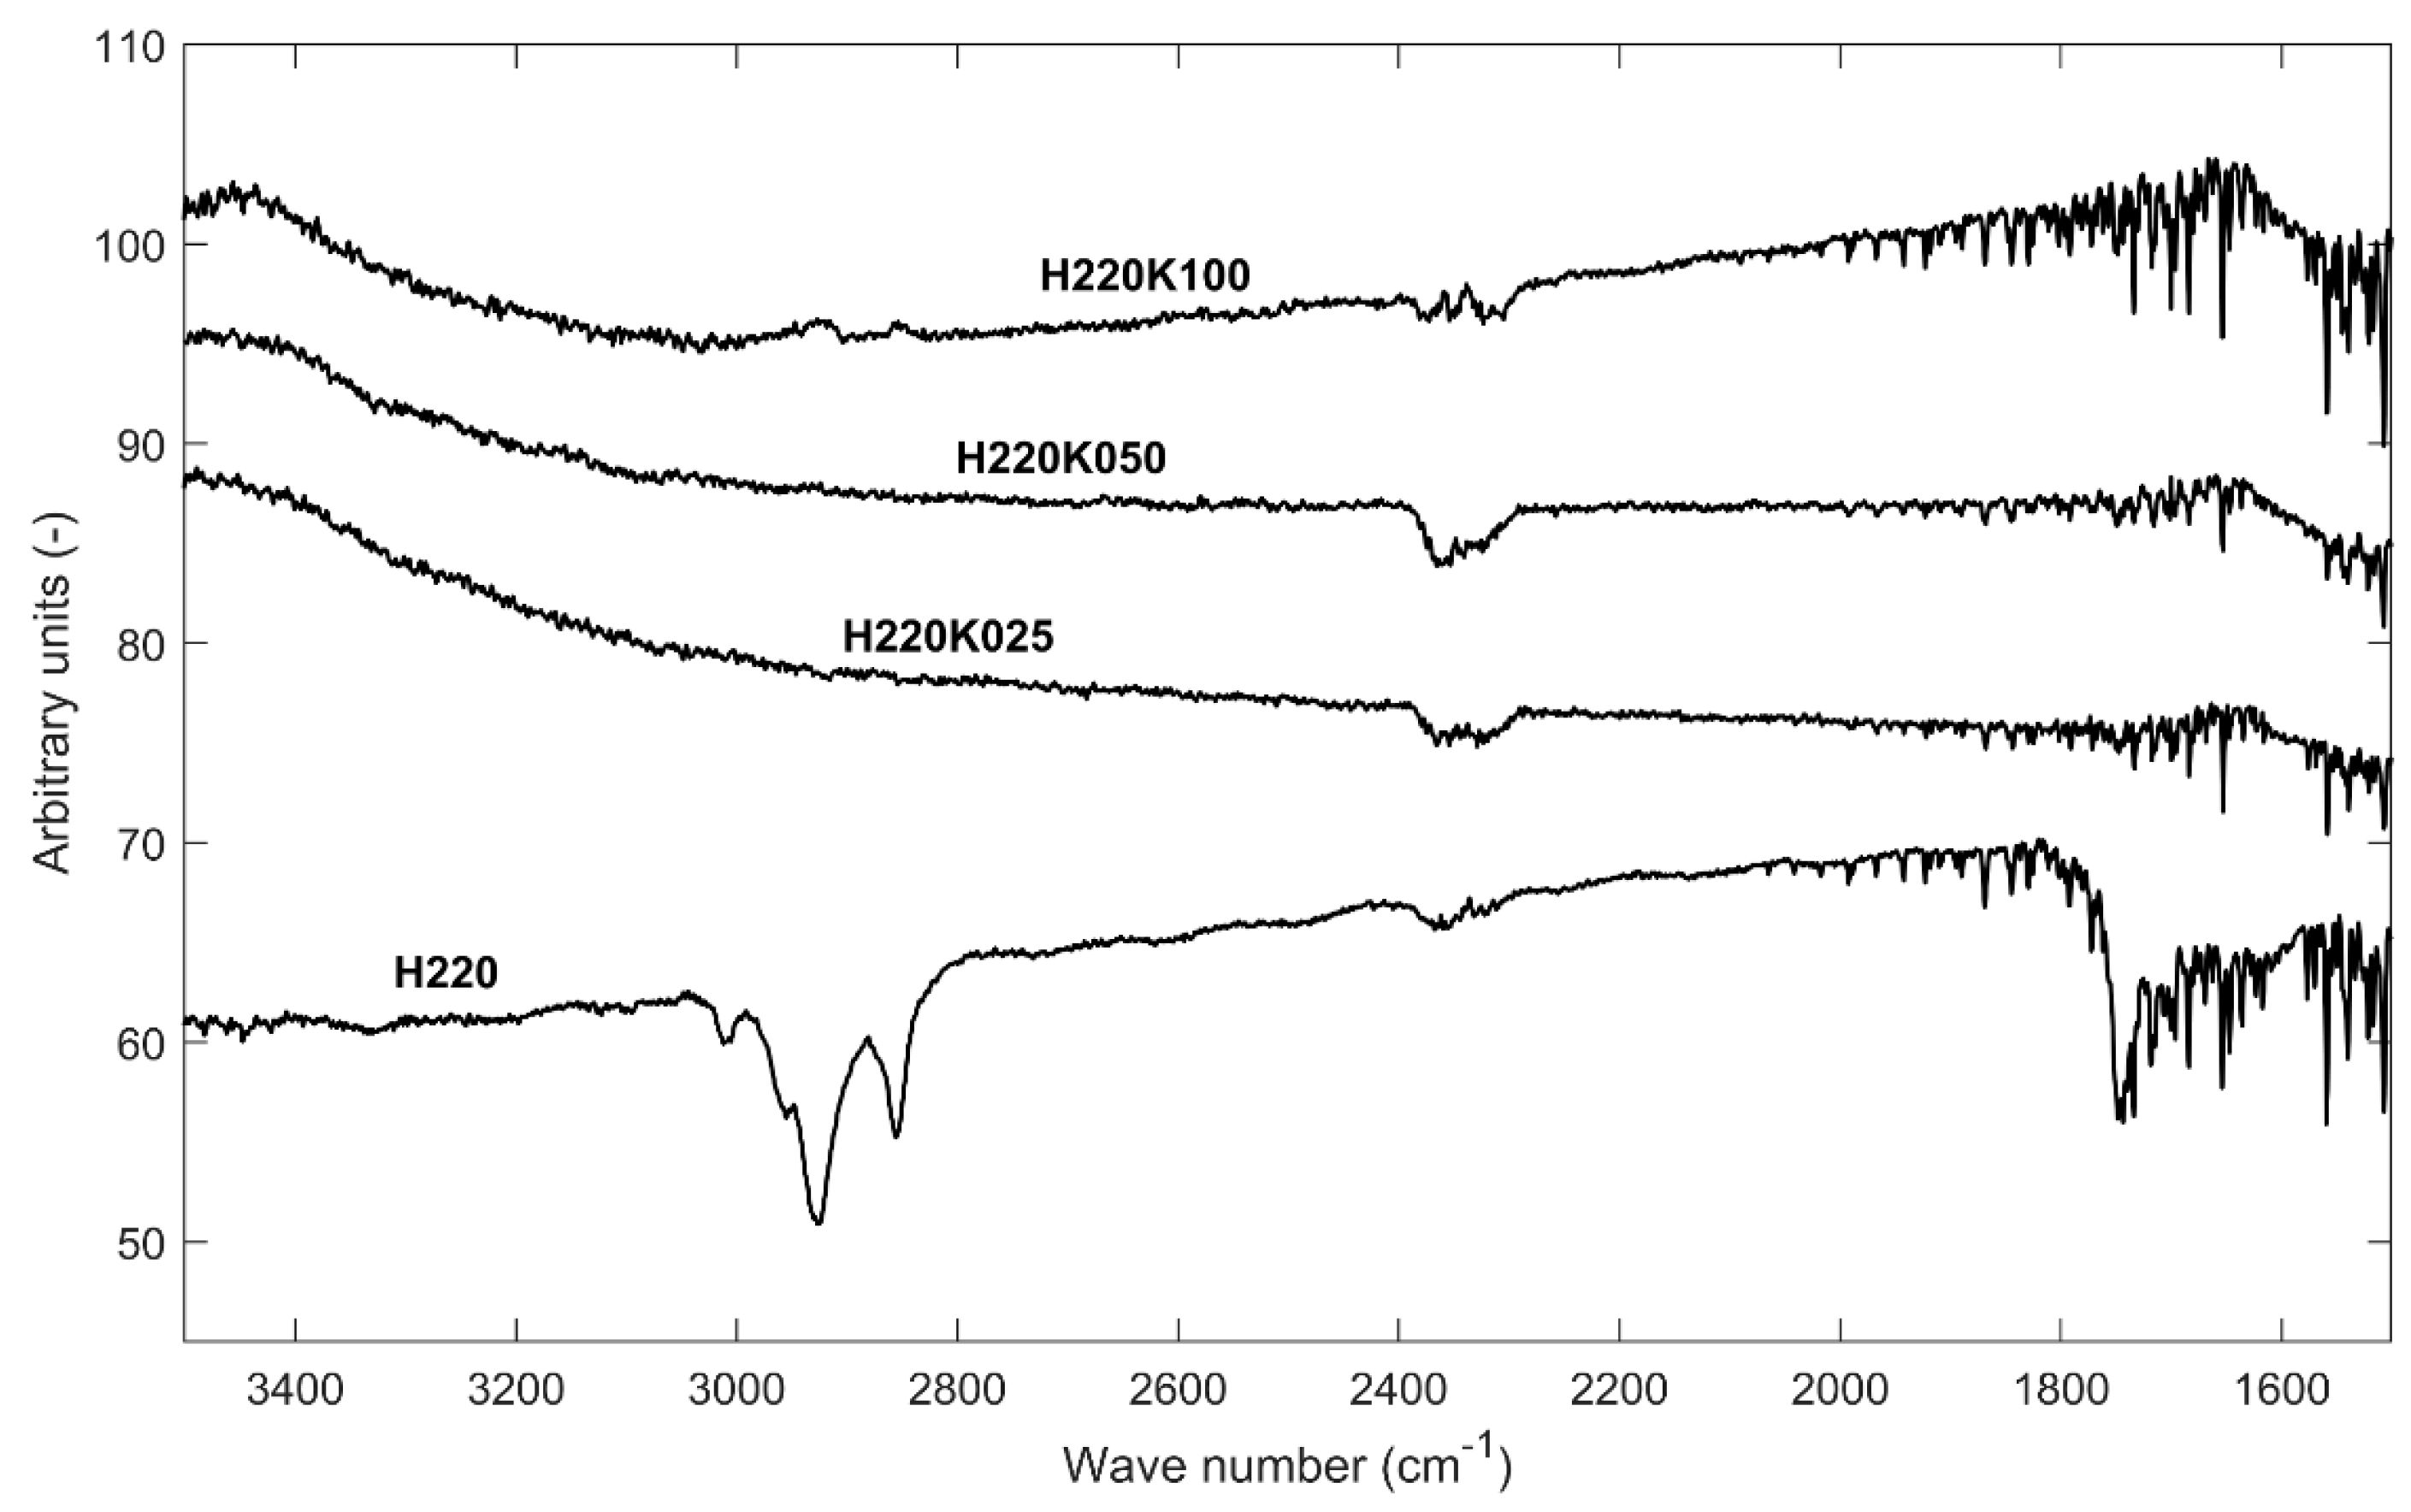
Figure 6 shows the results of FTIR analysis of a selection of GSAC samples and the relevant hydrochar precursor.
Figure 6 testifies that most of the oxygen functional groups that are present in the parent hydrochar were removed from the surface after activation. Moreover, KOH activation did not promote the development of any new functional group. According to Al Bahri et al. [
2], functional groups might be preserved and still appear on the FTIR spectra when the activation temperature does not exceed 500 °C: higher temperatures degrade most functional groups, including oxygen-containing groups, and this is confirmed in
Figure 6. Actually, Regmi et al. [
46] showed that KOH activated chars retain all of their initial surface functional groups if the activation is performed at room temperature.
The band at 3000–2850 cm−1 corresponding to C–H stretch of alkanes practically disappeared: KOH removed a considerable amount of hydrogen from the surface.
As a whole, the procedure that is described in the present paper allows for obtaining an activated carbon that is relatively free of oxygen functional groups. This opens very interesting possibilities for commercial exploitation: the GSAC surface could be functionalized for specific technological applications.
3.6. A Comparison with Other Research Works
In the literature, different activation schemes have been implemented using grape seeds as the carbon precursor. Apart from the work by Jimenez-Cordero et al. [
21], based on physical activation with oxygen, all of the other research studies were based on (single stage) the chemical activation method, i.e., involving simultaneous carbonization and activation.
Table 4 provides a summary of such experiments. When compared with the results of the present work, most of the previous results show lower yields at similar porosity development. A higher yield was obtained in the work by Al Bahri et al. [
2], where phosphoric acid was utilized. However, in this case, such a higher yield was likely due to the larger amount of activator that was utilized. It is possible that larger usage of activating agent can increase the yield of activated carbon in certain conditions, and especially when low activation temperatures are used [
14]. Surface area of activated carbon samples higher than those of the present study can only be reached by higher activation temperatures or larger usage of chemical agents. At a lower activation temperature, the addition of chemical agent until a certain limit can enhance the development of micro-porosity, which leads to a significant increase in surface area without suffering from yield decrease [
14,
22]: this is confirmed by the results here presented.
4. Conclusions
A two-stage process was successfully developed to produce high surface granular activated carbon from grape seeds (GSAC), by using HTC, followed by low temperature activation with relatively small amounts of KOH. The overall final yields were around 35%, in line with (or even higher than) those that were obtained in other works and based on a single-stage process. Very high surface areas can be obtained, with most of the pores falling in the micro-pore range. When compared to single-stage processes, milder reaction conditions can be adopted to obtain similar surface areas. Additionally, the obtained surface was quite clean from functional groups and the GSACs that resulted were quite thermally stable.
The best results in terms of material quality were obtained at the highest HTC temperature (250 °C) with the intermediate KOH:hydrochar ratio of 0.5: surface area higher than 1000 m2/g and micro-pore-volume accounting for 90% of total pore volume (0.4857 cc/g). Actually, in a wide range of operating conditions, the higher were the HTC temperature and the KOH:hydrochar ratio, the higher was the surface area of the GSAC. But, at the highest values tested for both process parameters (HTC temperature: 250 °C, KOH:hydrochar ratio equal to 1), the whole process resulted too severe: a portion of micro-pores collapsed and larger pores formed, causing surface area reduction. In any case, also low HTC temperatures and the intermediate KOH:hydrochar ratio allowed for producing GSACs with relatively high surface areas (≈ 600 m2/g) and well developed micro-porosity. Actually, the two-stage process can be very advantageous, owing to such a high grade of flexibility. It can be thus a concrete path for the valorization of grape seeds as well as other agro-industrial waste, with high value creation and improved sustainability.


