Article

Numerical Simulation of Early Age Cracking of Reinforced Concrete Bridge Decks with a Full-3D Multiscale and Multi-Chemo-Physical Integrated Analysis

1
Department of Civil Engineering, The University of Tokyo, Tokyo 113-8656, Japan
2
Institute of Industrial Science, The University of Tokyo, Tokyo 153-8505, Japan
3
Research Institute of General Research Laboratory, Yokogawa Bridge Holdings Co., Ltd., Chiba 261-0002, Japan
4
College of Engineering, Nihon University, Fukushima 963-8642, Japan
*
Author to whom correspondence should be addressed.
Appl. Sci. 2018, 8(3), 394; https://doi.org/10.3390/app8030394
Submission received: 13 February 2018 / Revised: 1 March 2018 / Accepted: 2 March 2018 / Published: 7 March 2018

Abstract

:
In November 2011, the Japanese government resolved to build “Revival Roads” in the Tohoku region to accelerate the recovery from the Great East Japan Earthquake of March 2011. Because the Tohoku region experiences such cold and snowy weather in winter, complex degradation from a combination of frost damage, chloride attack from de-icing agents, alkali–silica reaction, cracking and fatigue is anticipated. Thus, to enhance the durability performance of road structures, particularly reinforced concrete (RC) bridge decks, multiple countermeasures are proposed: a low water-to-cement ratio in the mix, mineral admixtures such as ground granulated blast furnace slag and/or fly ash to mitigate the risks of chloride attack and alkali–silica reaction, anticorrosion rebar and 6% entrained air for frost damage. It should be noted here that such high durability specifications may conversely increase the risk of early age cracking caused by temperature and shrinkage due to the large amounts of cement and the use of mineral admixtures. Against this background, this paper presents a numerical simulation of early age deformation and cracking of RC bridge decks with full 3D multiscale and multi-chemo-physical integrated analysis. First, a multiscale constitutive model of solidifying cementitious materials is briefly introduced based on systematic knowledge coupling microscopic thermodynamic phenomena and microscopic structural mechanics. With the aim to assess the early age thermal and shrinkage-induced cracks on real bridge deck, the study began with extensive model validations by applying the multiscale and multi-physical integrated analysis system to small specimens and mock-up RC bridge deck specimens. Then, through the application of the current computational system, factors that affect the generation and propagation of early age thermal and shrinkage-induced cracks are identified via experimental validation and full-scale numerical simulation on real RC slab decks.

1. Introduction

Much of Japan’s infrastructure was constructed during the past half century, and parts of this infrastructure are undergoing severe deterioration due to environmental and loading actions. Road structures in cold and snowy regions are reported to deteriorate more quickly and severely than expected due to a combination of frost damage, chloride attack from de-icing agents, alkali–silica reaction (ASR), cracking and fatigue. For such structures, it is necessary to combat deterioration and ensure durability performance in design and to consider the inevitable environmental and loading actions during service.
In November 2011, the Japanese government resolved to build “Revival Roads” in the Tohoku region to accelerate recovery from the Great East Japan Earthquake of March 2011. The Tohoku region experiences cold and snowy weather in the winter, so complex degradation involving multiple factors, such as those mentioned above, is anticipated. Thus, to enhance the durability performance of road structures, more particularly reinforced concrete (RC) slab decks, multiple countermeasures are proposed: a low water-to-cement ratio in the mix, mineral admixtures such as blast furnace slag (BFS) and/or fly ash to mitigate the risks of chloride attack and ASR, anticorrosion rebar and 6% entrained air for frost damage [1]. It should be emphasised here that such high durability specifications may contradictorily increase the risk of early age cracking induced by temperature and shrinkage due to the large amount of cement and the use of mineral admixtures.
Meanwhile, to achieve the rational design, construction and maintenance of concrete structures, prediction of the performance of structures throughout their lifespan is crucial, from the beginning of the hydration reaction to the end of their service life, with consideration of various material and mix proportions, structural dimensions and curing and environmental conditions. Faria et al. [2] proposed a thermo-mechanical model for computing strain and stresses whereby the effects are coupled. Once there is a thermal gradient, volumetric change would occur. If the volumetric change is not permitted, the thermal stresses would increase. On the contrary, once discontinuity occurs due to concrete cracking, the thermal field would be altered. In this model, the moisture equilibrium and transport is not considered. Furthermore, Jendele et al. [3] proposed thermo-hygro-mechanical simulations of early-age concrete cracking considering stress state, concrete creep, autogenous shrinkage and drying shrinkage to predict the early-age shrinkage and crack width. The hydration model was first fitted to the semi-adiabatic measurements on relatively small specimens, which are then scaled up to a structural level. In terms of computational process, various variables were required as the inputs for simulations such as sorption isotherms, intrinsic and relative permeability, porosity, Young’s modulus, Poisson’s ratio, compressive strength, and other parameters. While the former could not be extended for other durability issues which requires moisture transport such as chloride ingression, carbonation, ASR, calcium leaching and corrosion, the latter requires quite a high amount of material parameters that would be practically complicated. On the other hand, aiming for a unified approach to the evaluation of the behaviour of concrete structures in various conditions, the Concrete Laboratory of the University of Tokyo has been working to develop a multiscale integrated analysis platform, DuCOM-COM3 [4,5]. The platform consists of two systems: a thermodynamic coupled analysis system, DuCOM, which integrates various micro-physical-chemical–based models of cementitious composites, and a nonlinear dynamic RC structure analysis system COM3, which deals with macroscopic mechanical responses and damage to RC structures. With using only simple inputs such as such as mix proportions, structural geometry and boundary conditions in terms of history of environmental exposure of the structure, DuCOM-COM3 attempts to tackle the physio-chemical properties of concrete structures from its young age onward while also incorporate various ion transport phenomena for future performance-based durability design.
Against this background, this paper presents a numerical simulation of early age deformation and cracking of RC structures with full 3D multiscale and multi-physical integrated analysis. First, a multiscale constitutive model of solidifying cementitious materials is briefly introduced based on systematic knowledge of microscopic thermodynamic phenomena and microscopic structural mechanics. With the aim to assess the early age thermal and shrinkage-induced cracks on real bridge decks, the study began with extensive model validations by applying the multiscale and multi-physical integrated analysis system to small specimens and mock-up RC bridge deck specimens. Then, through the application of the current computational system, factors that affect the generation and propagation of early age thermal and shrinkage-induced cracks are identified via experimental validation and full-scale numerical simulation on real RC slab decks.

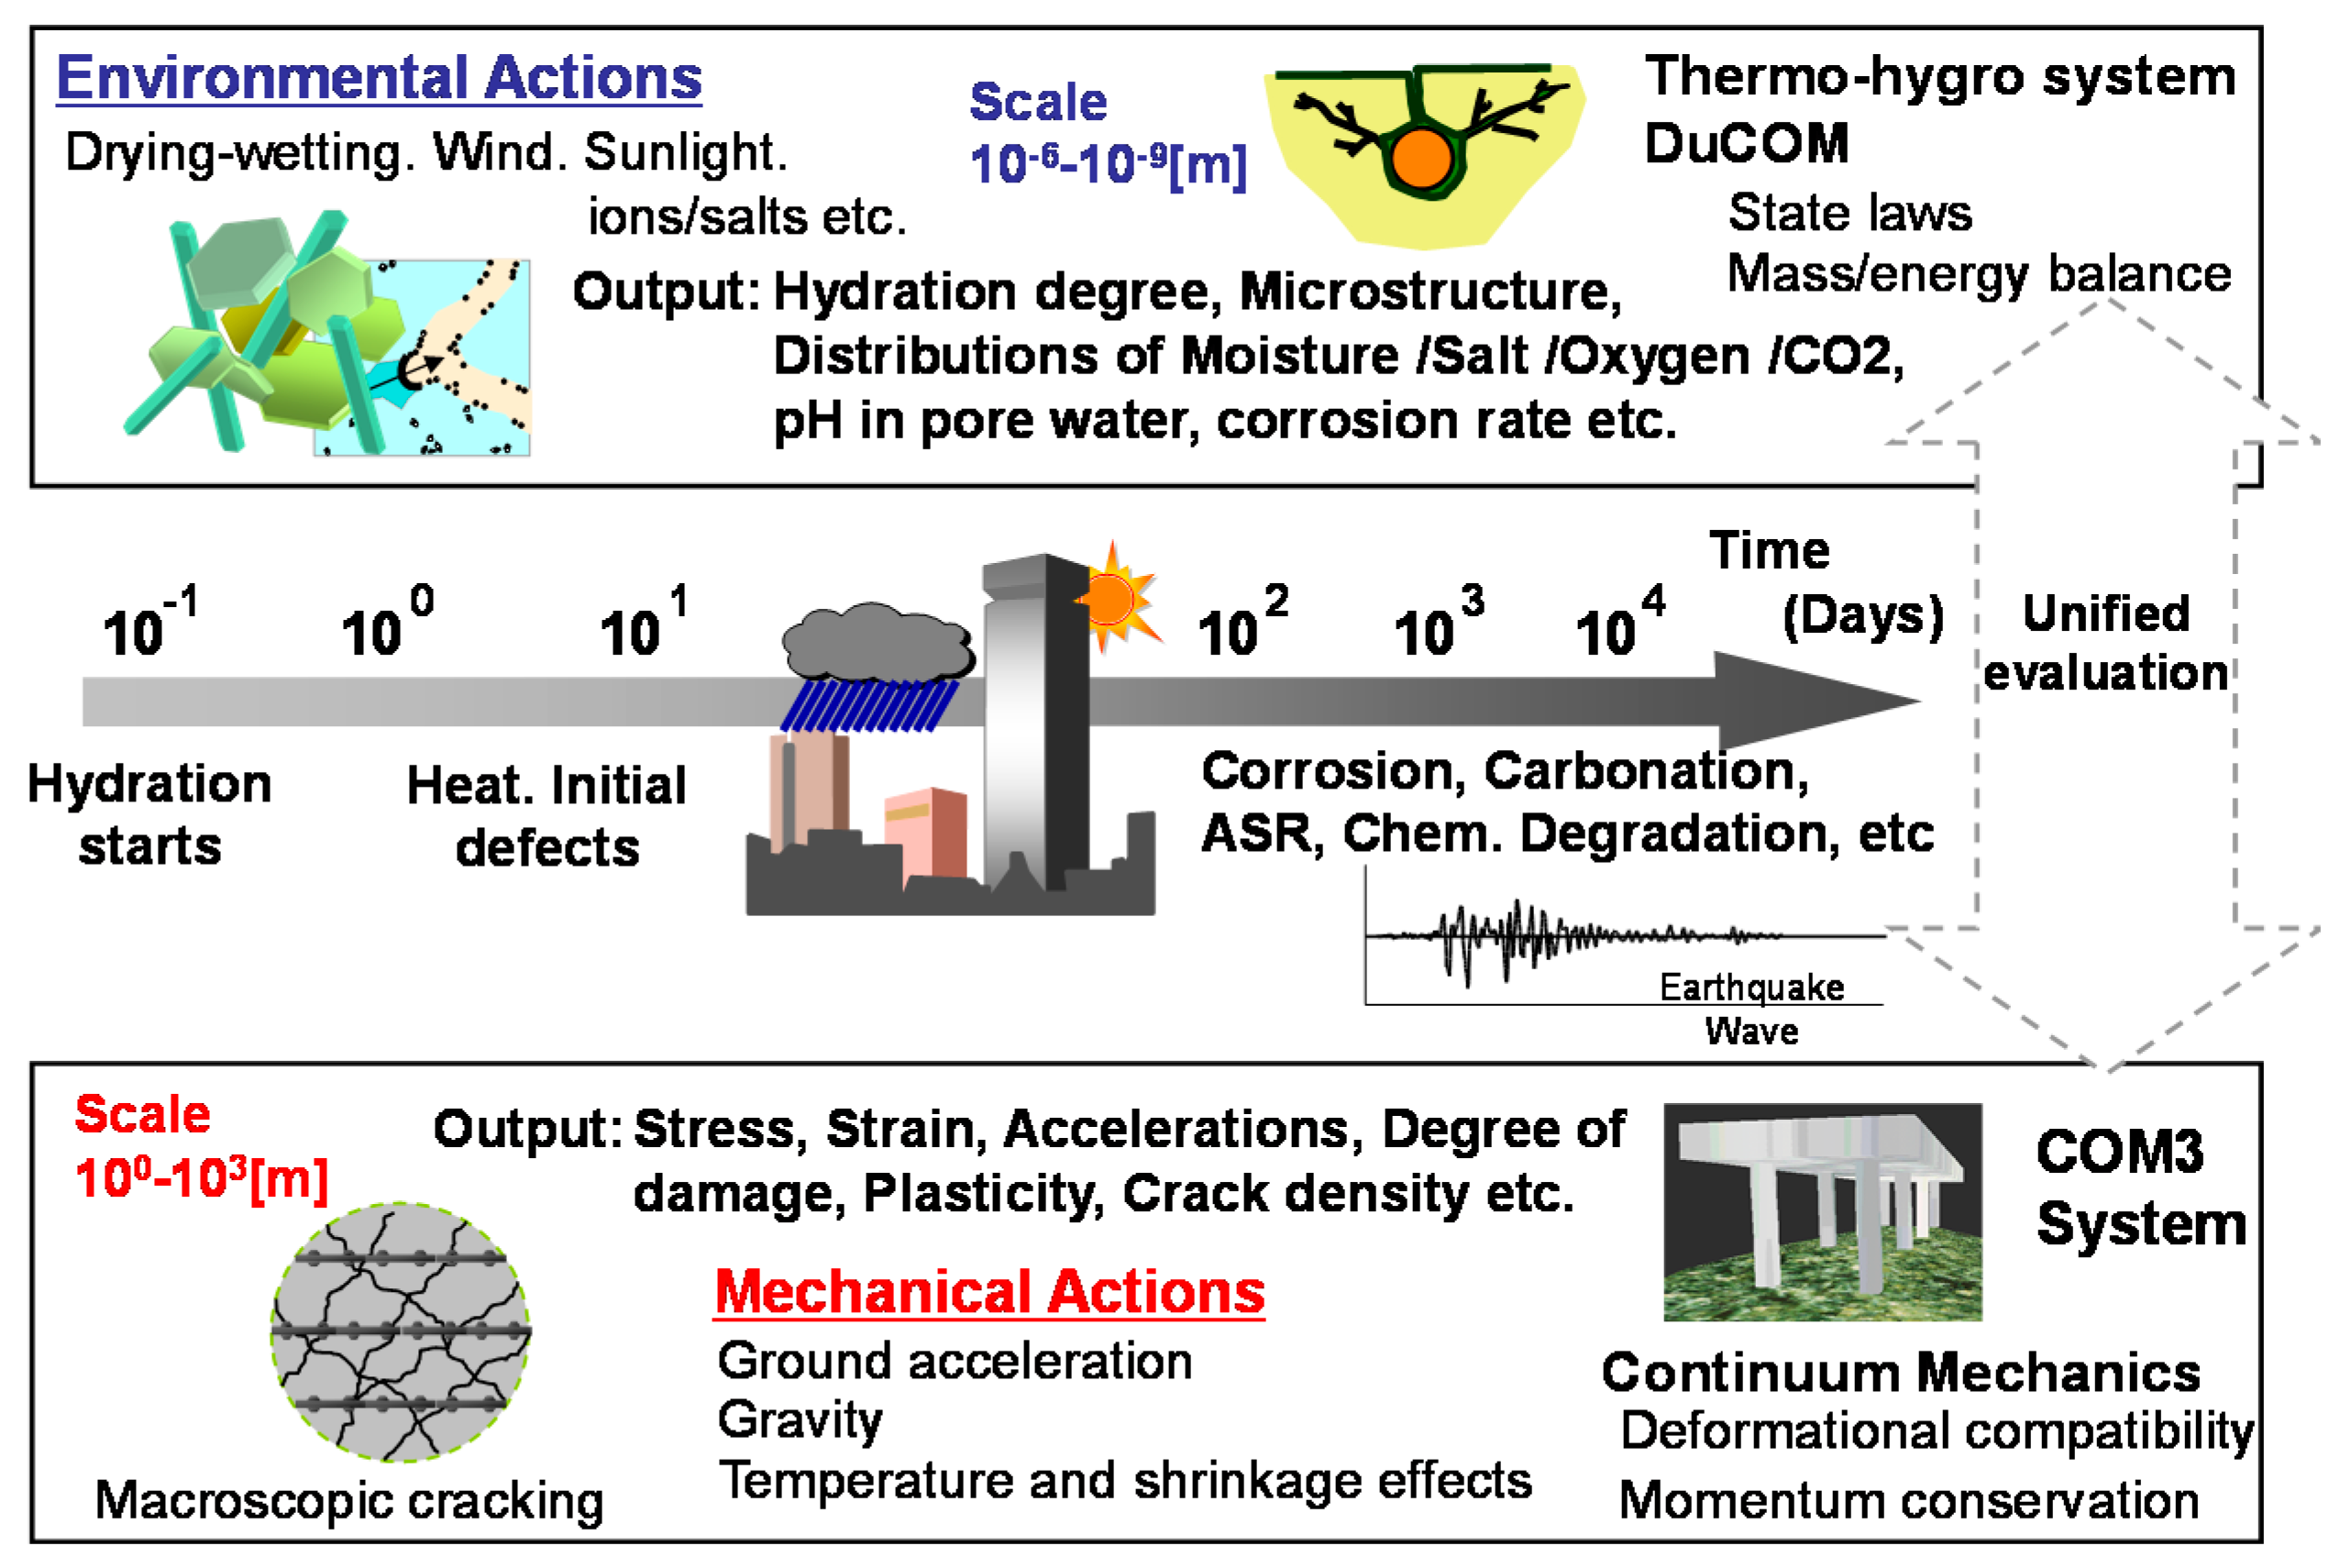
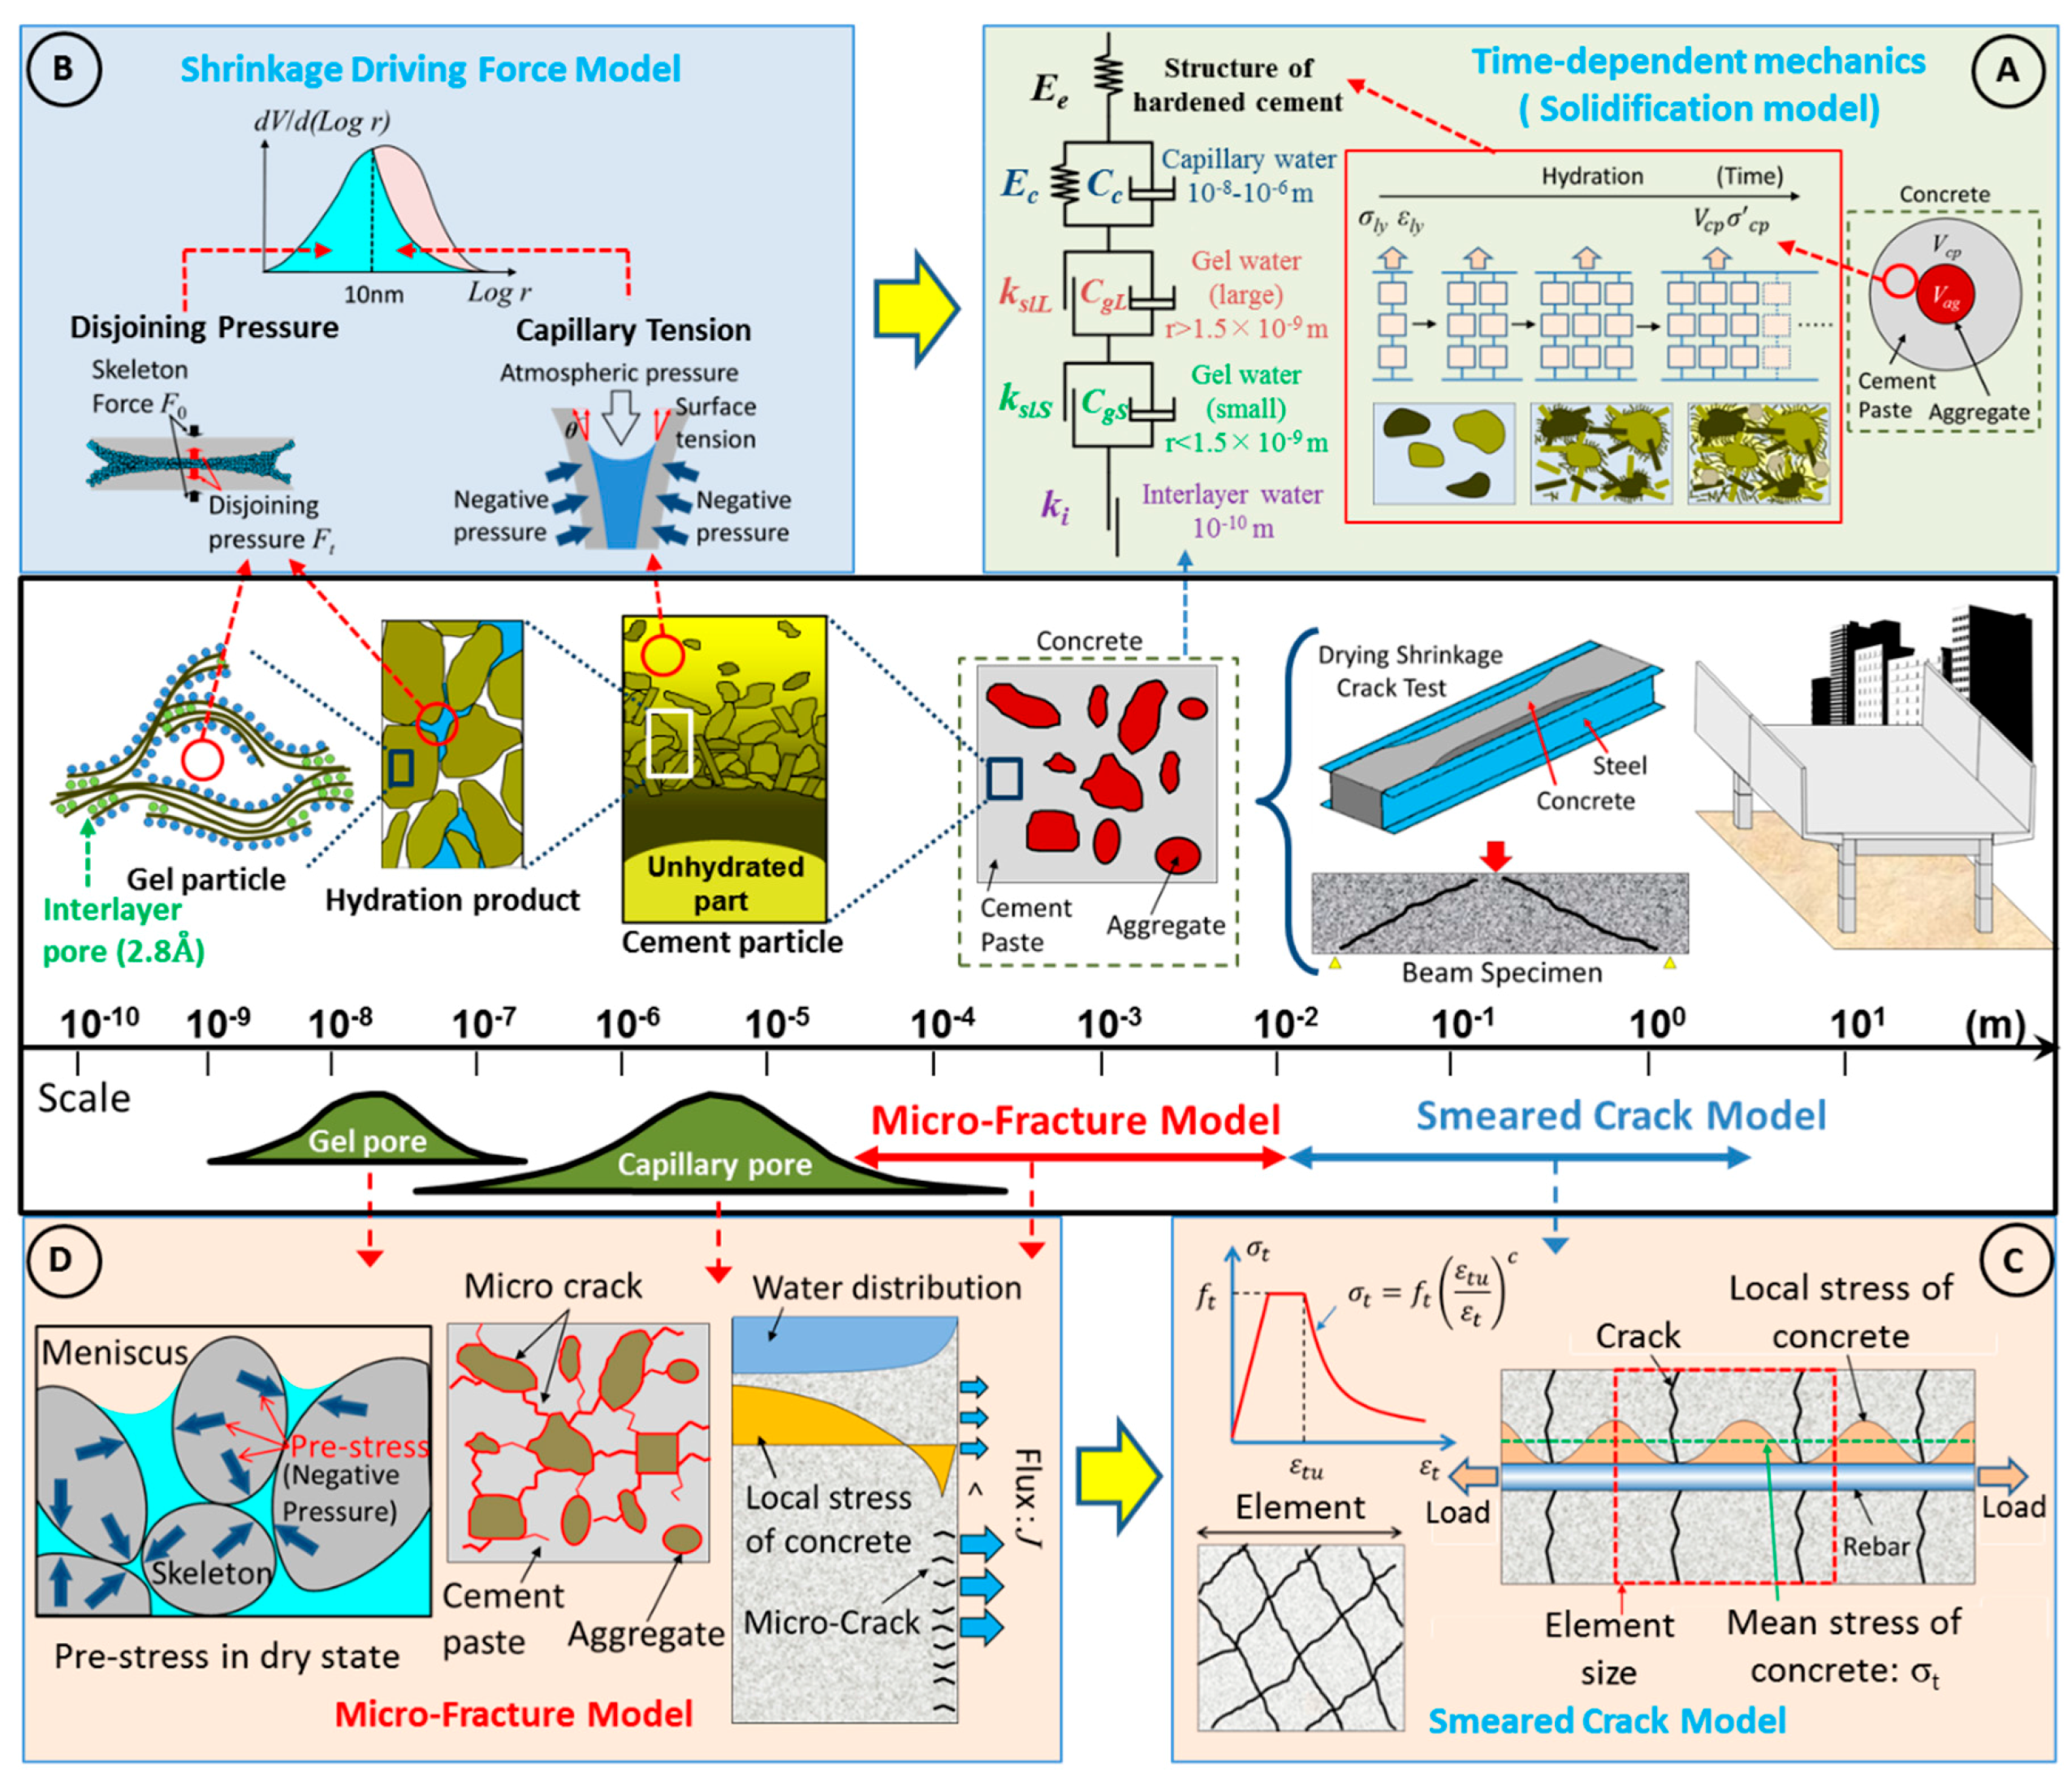
2. Overview of Multiscale and Multi-Physical Modelling

Figure 1 and Figure 2 gives an overview of the multiscale and multi-physical modelling to simulate time-dependent deformation and cracking of concrete structures. The system consists of thermodynamic multi-chemo-physical modelling with DuCOM and nonlinear structural analysis with COM3. The former includes various thermodynamic models, such as multicomponent hydration, micropore structure formation and moisture equilibrium/transport, whilst the latter is a 3D finite-element analysis that implements constitutive laws of uncracked/cracked and hardening/aging/matured concrete. By inputting the basic data, such as mix proportions, structural geometry and boundary conditions in terms of history of environmental exposure of the structure, over time-space domain, the kinematic chemo-physical and mechanical events of representative elementary volume (REV) from different scales would be individually solved in a certain timestep. All other time-dependent properties of concrete such as elastic modulus, temperature, pore pressure, creep, moisture status, total porosity of interlayer, gel and capillary pores are computed internally based on the micromodels of materials inside the DuCOM system [6]. In the multiscale constitutive model, concrete is idealised as a two-phase composite in which cement paste and elastic aggregate co-exist (Figure 2A) [4]. The aggregate is assumed to be rigid and to show elastic deformation, and the shrinkage caused by aggregates is also considered. The hardened cement paste matrix is considered to be an assembly of fictitious clusters, referring to the solidification theory. As cement hydration proceeds, the number of clusters increases. The overall capacity of a cement matrix is obtained by summing the capacities of all clusters, which show time-dependent deformation relevant to the history. Based on the water status in the micro-pores, the time-dependent deformation, which consists of elastic, viscoelastic, viscoplastic and plastic components, is numerically computed. During the drying process, the water in pores is gradually lost. Consequently, in microscale pores, a water meniscus forms, and some shrinkage stress is generated by capillary tension. In contrast, in nanoscale pores, shrinkage stress is generated by disjoining pressure. These shrinkage stresses are quantified in the multiscale model and integrated as the overall shrinkage stresses, as shown in Figure 2B, which are given to compute the volumetric stress of cement paste carried by both skeleton solid and pore pressure, referring to Biot’s theorem of a two-phase continuum [6,7]. The volumetric change generated by cement hydration and shrinkage is systematically included in the modelling of concrete mechanics, which deals with macroscopic structural responses based on the space-averaged constitutive laws on the fixed four-way cracked concrete model (Figure 2C). It is important to mention that the microfracture cracking criteria are determined based on the local tensile strength depending on the moisture state inside the concrete because drying has both negative and positive effects. Microcracks caused by drying reduce the tensile strength, while negative pore water pressure in a dry state works as pre-stress and enhances local resistance against the tensile load [8]. Thus, in the model, various local tensile strengths were considered according to the moisture status in the micropores and nanopores (Figure 2D).

3. Numerical Simulation of Early-Age Behaviour of Small Specimens to Actual Rc Deck Slabs

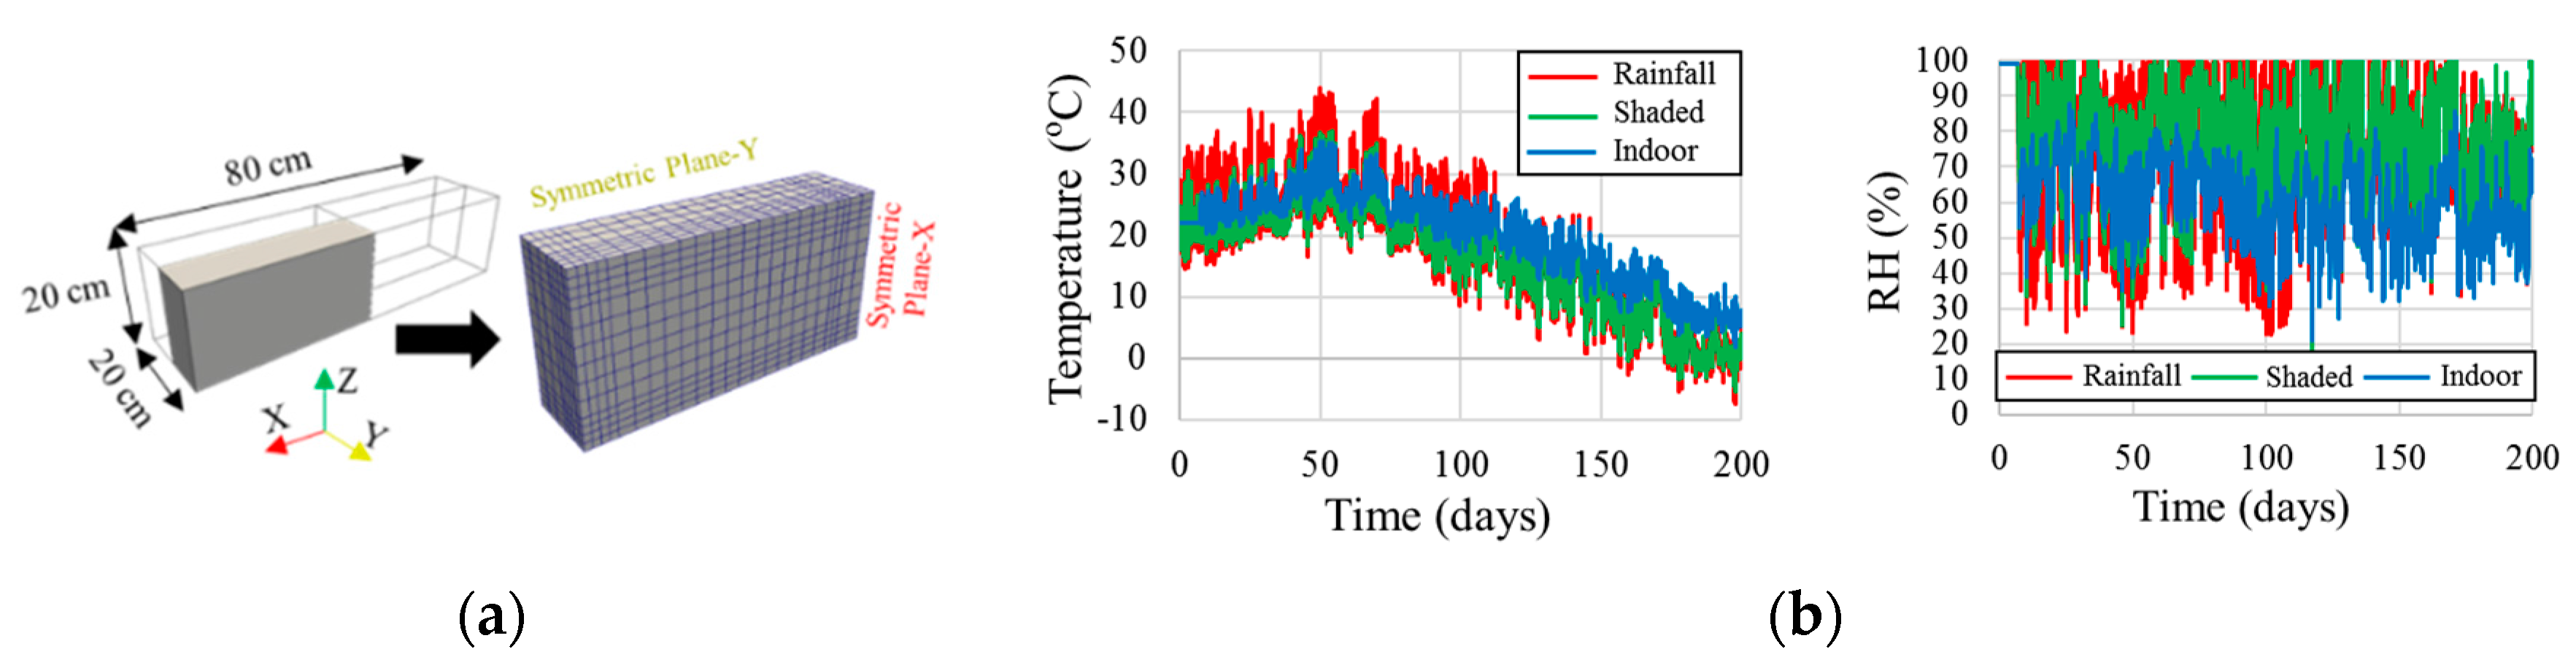
3.1. Target of Analysis

The subject of this analysis is Shinkesen Bridge in Rikuzentaka, Iwate prefecture, Tohoku region, Japan. This bridge is amongst the 250 bridges that are scheduled to be constructed to accelerate the infrastructural recovery from the Great East Japan Earthquake. Before the Shinkesen Bridge was constructed, substantial precedents existed for the use of fly ash as the cementitious material in mixture designs for the bridge deck [1]. However, some problems have arisen in terms of a limited supply of fly ash concrete from ready-mixed concrete manufacturing plants due to the insufficiency of separate silos for fly ash and the insufficiency in high-standard fly ash itself due to the minimal number of thermal power plants. These restrictions have been the motivating factor for the development of an alternative method that makes use of BFS to tackle the deterioration issues in the Tohoku region. BFS blended cement has been shown to possess greater frost resistance, chloride binding, a higher tolerance for ASR and a denser micropore structure than ordinary Portland cement (OPC) [9,10,11], which is practically ideal for the environmental conditions in the Tohoku region. The Shinkesen Bridge was selected as the primary entry for the introduction of BFS concrete for nationwide concrete durability design. With the use of a low water-to-binder ratio and BFS in the mix proportion, early-age cracking might be bound to occur due to low creep and high autogenous shrinkage properties. In addition, it is universally understood that cracking would permit deleterious ions such as chloride and carbonated ions to deteriorate the concrete body unrestrained. Therefore, to quantitatively and qualitatively assure the validity and performance of the mix design, an in-depth study comprising both experiments and multiscale thermodynamic integrated analysis was conducted from a laboratory scale on the order of decimetres up to a structural scale on the order of decametres, followed by assessment and evaluation of the bridge deck via analytical results.

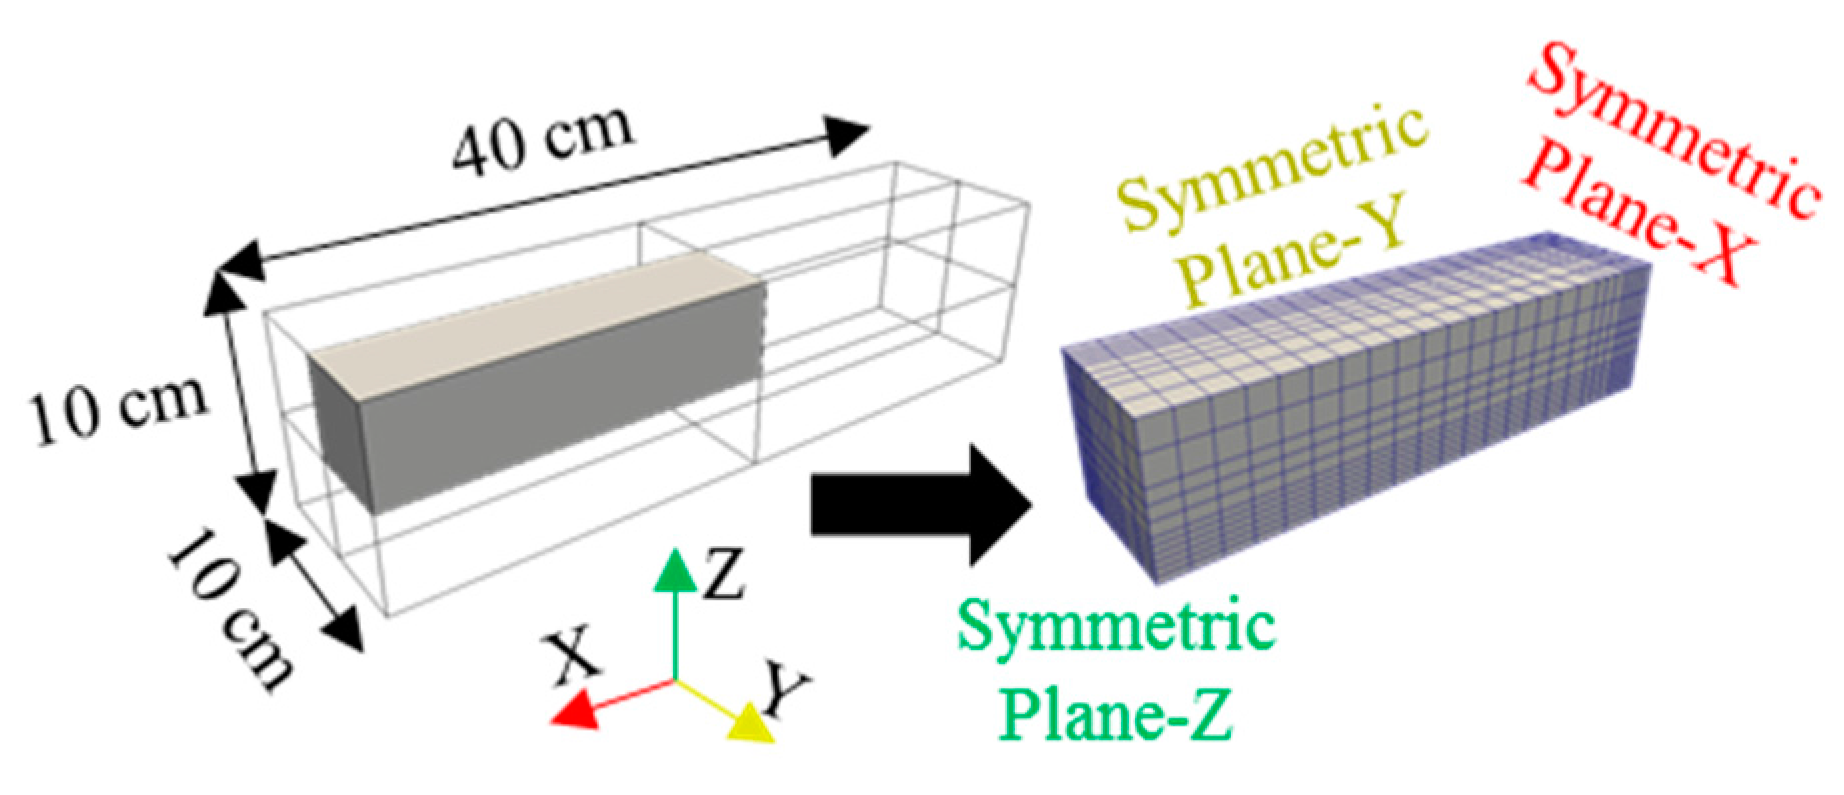
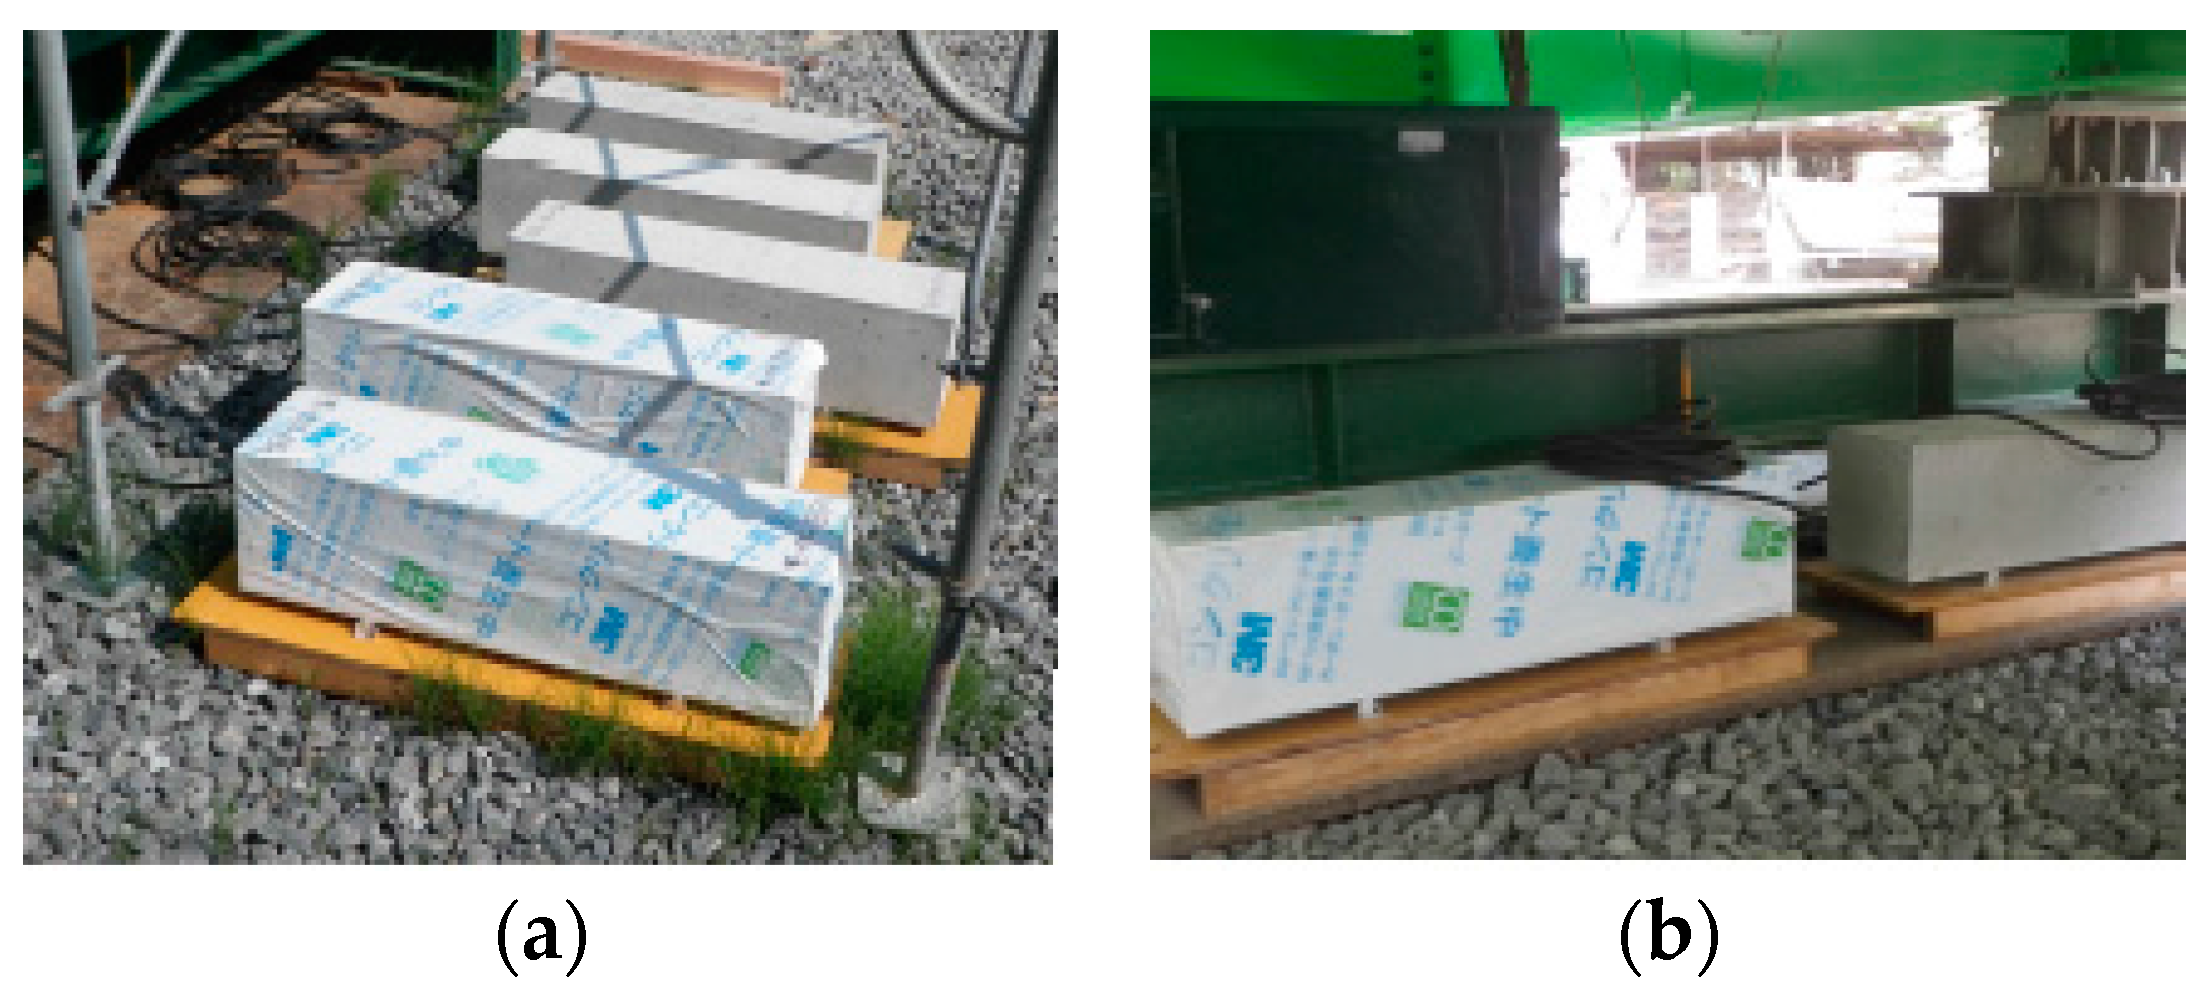
3.2. Experimental Outline and Model Validation via Small-Scale Specimens (Decimetres)

As mentioned above, the Shinkesen Bridge deck was implemented with BFS concrete. In accordance with small-scale specimens, OPC concretes were simultaneously used as a reference. To reflect on the properties of micropore structures and evaluate free volumetric change, deformation and cracks due to shrinkage, mass loss and shrinkage tests were conducted on 200 × 200 × 800 mm3 prismatic OPC specimens. Then, using the mixture designs proposed for the Shinkesen Bridge, compression tests were executed on cylindrical specimens with radius of 100 mm and height of 200 mm according to JIS A 1108 specification to determine the concrete with the most appropriate strength for application on the bridge. Because curing conditions adversely influence the properties of concrete with BFS, especially its early strength to resist thermal and shrinkage-induced cracks, shrinkage tests were then performed on 100 × 100 × 400 mm3 prismatic specimens by applying various prolonged seal-curing durations. It is important to mention that, in addition to prolonged curing, expansive additives were used to lessen the cracking tendency. Finally, to study the effects of restraints imposed by reinforcing bars, 400 × 400 × 200 mm3 prismatic specimens were used to trace the strain progress of all proposed mixture designs. Each test was designed for different environments, from a controlled chamber to ambient conditions, incorporating details such as temperature, humidity, solar radiation and rainfall. The details of each experiment and its corresponding validation will be explicitly displayed in the following sections.
The numerical models have been well-verified in environmental controlled condition. Yet, the fluctuation in environmental conditions necessitates further model validation because it significantly affects the microscopically thermodynamic phenomena of the whole concrete body and, consequently, the mechanical properties. Furthermore, since our current DuCOM-COM3 computational platform does not possess a sophisticated expansive agent model, the model validation process will also aim to ensure the capability in predicting the behavior under these complex actual considerations.

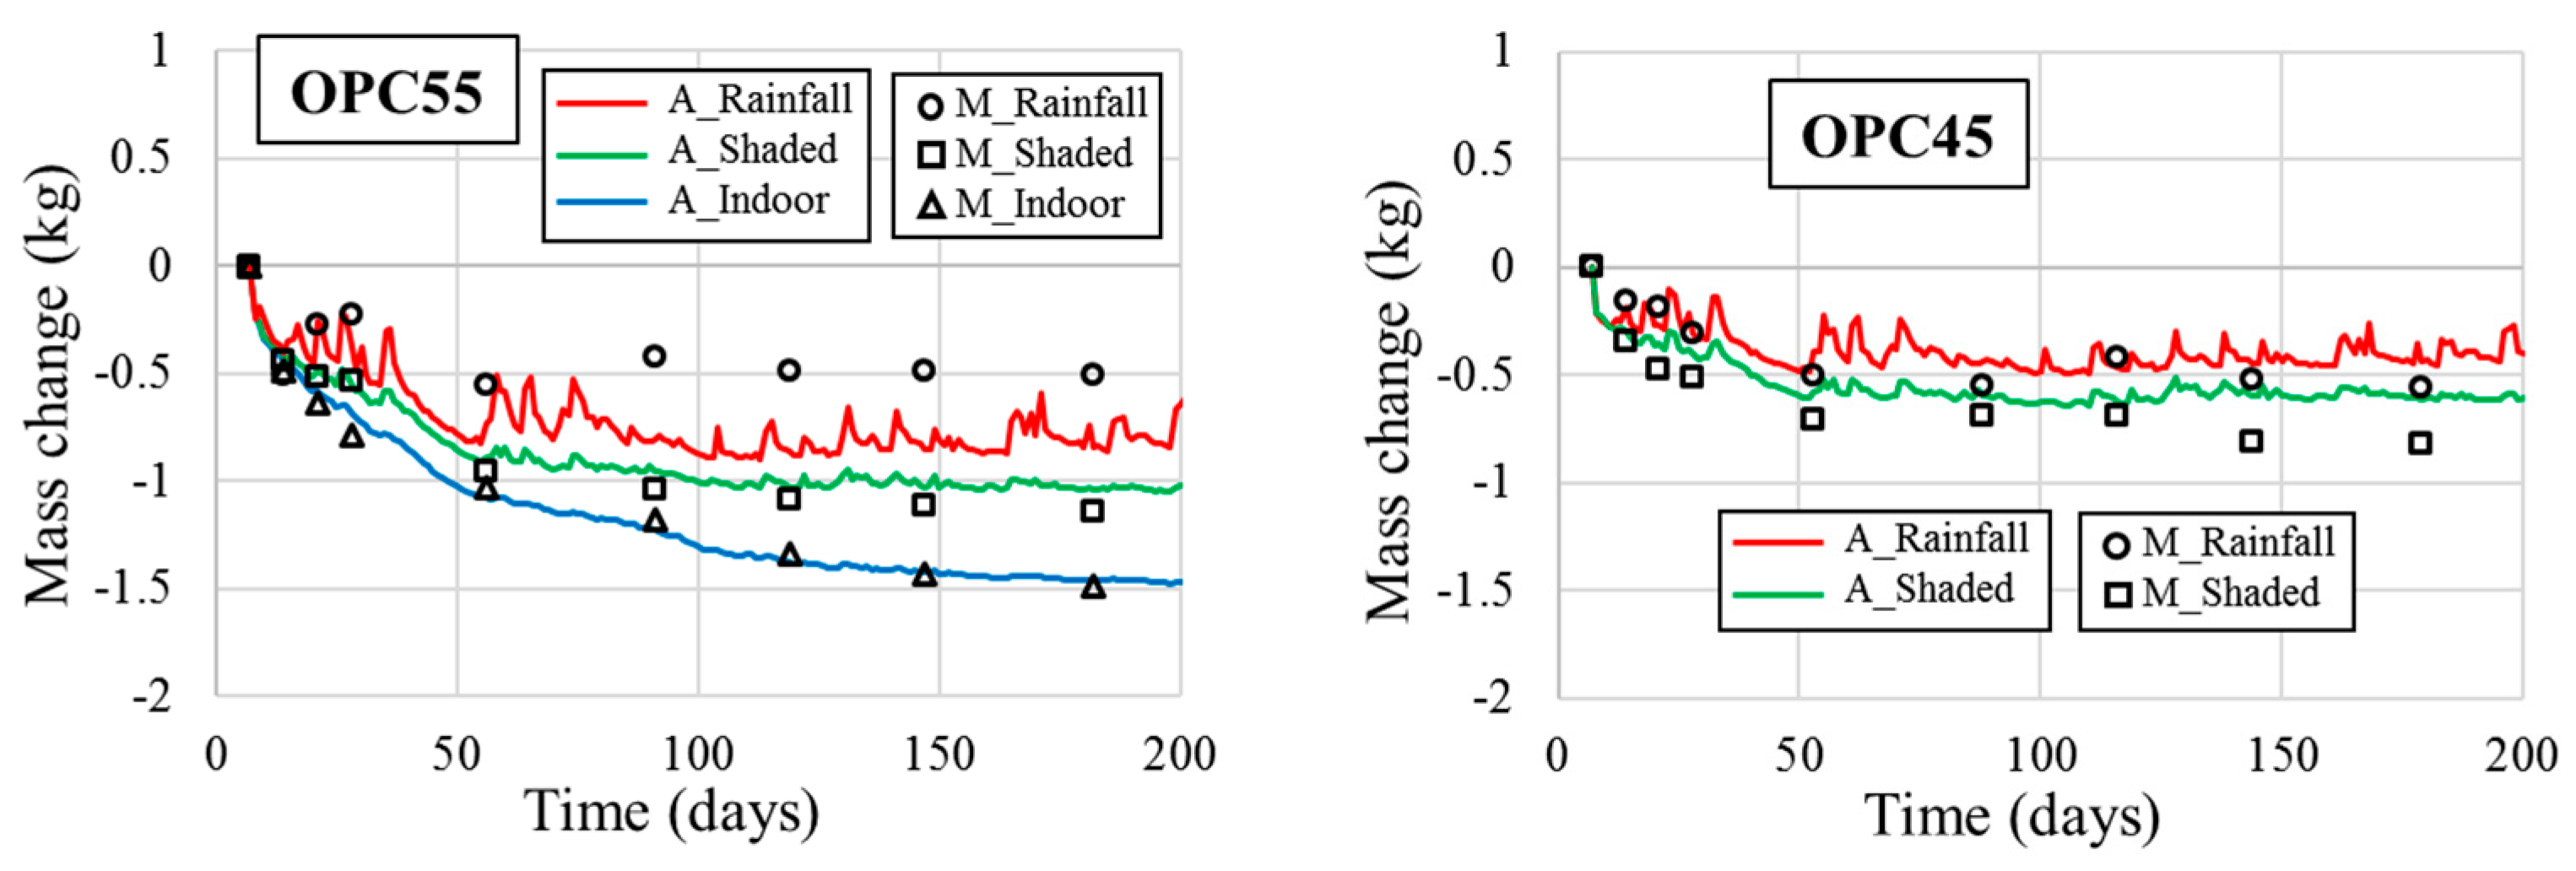
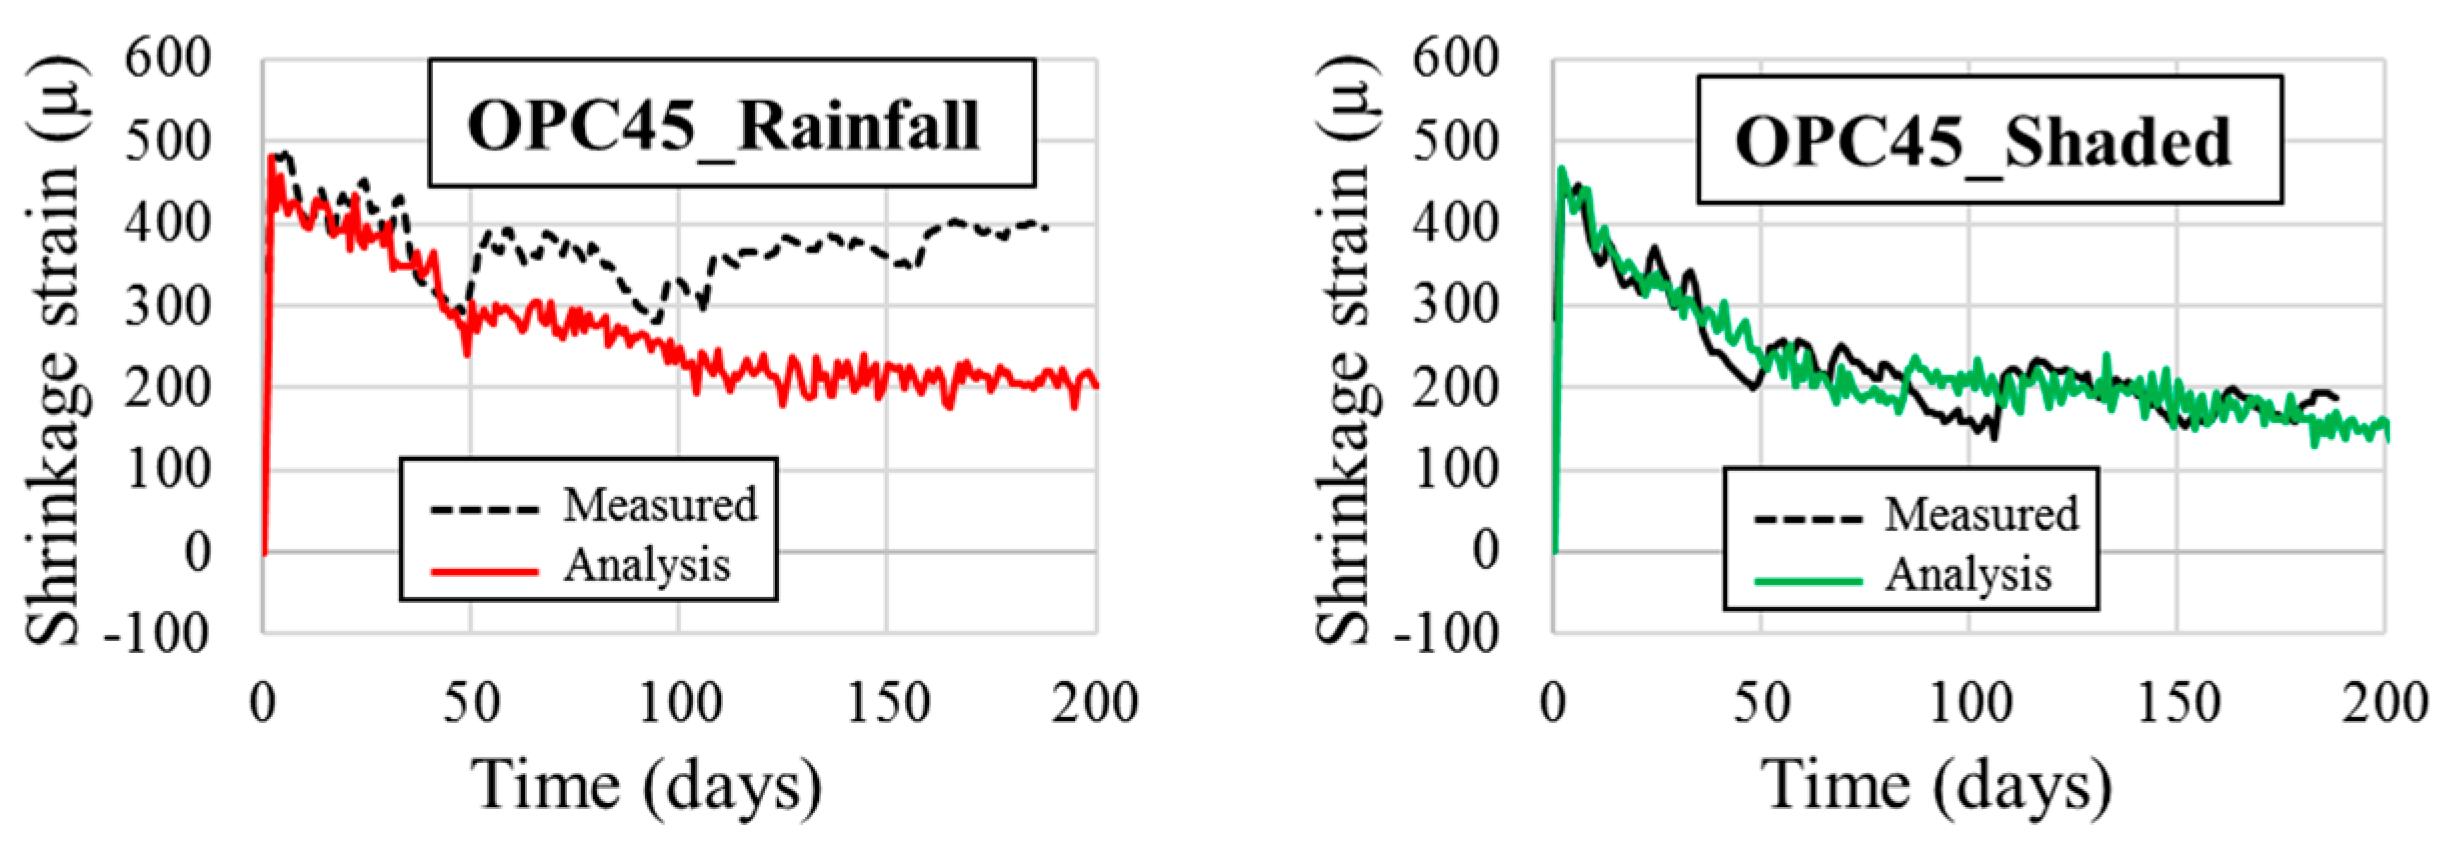
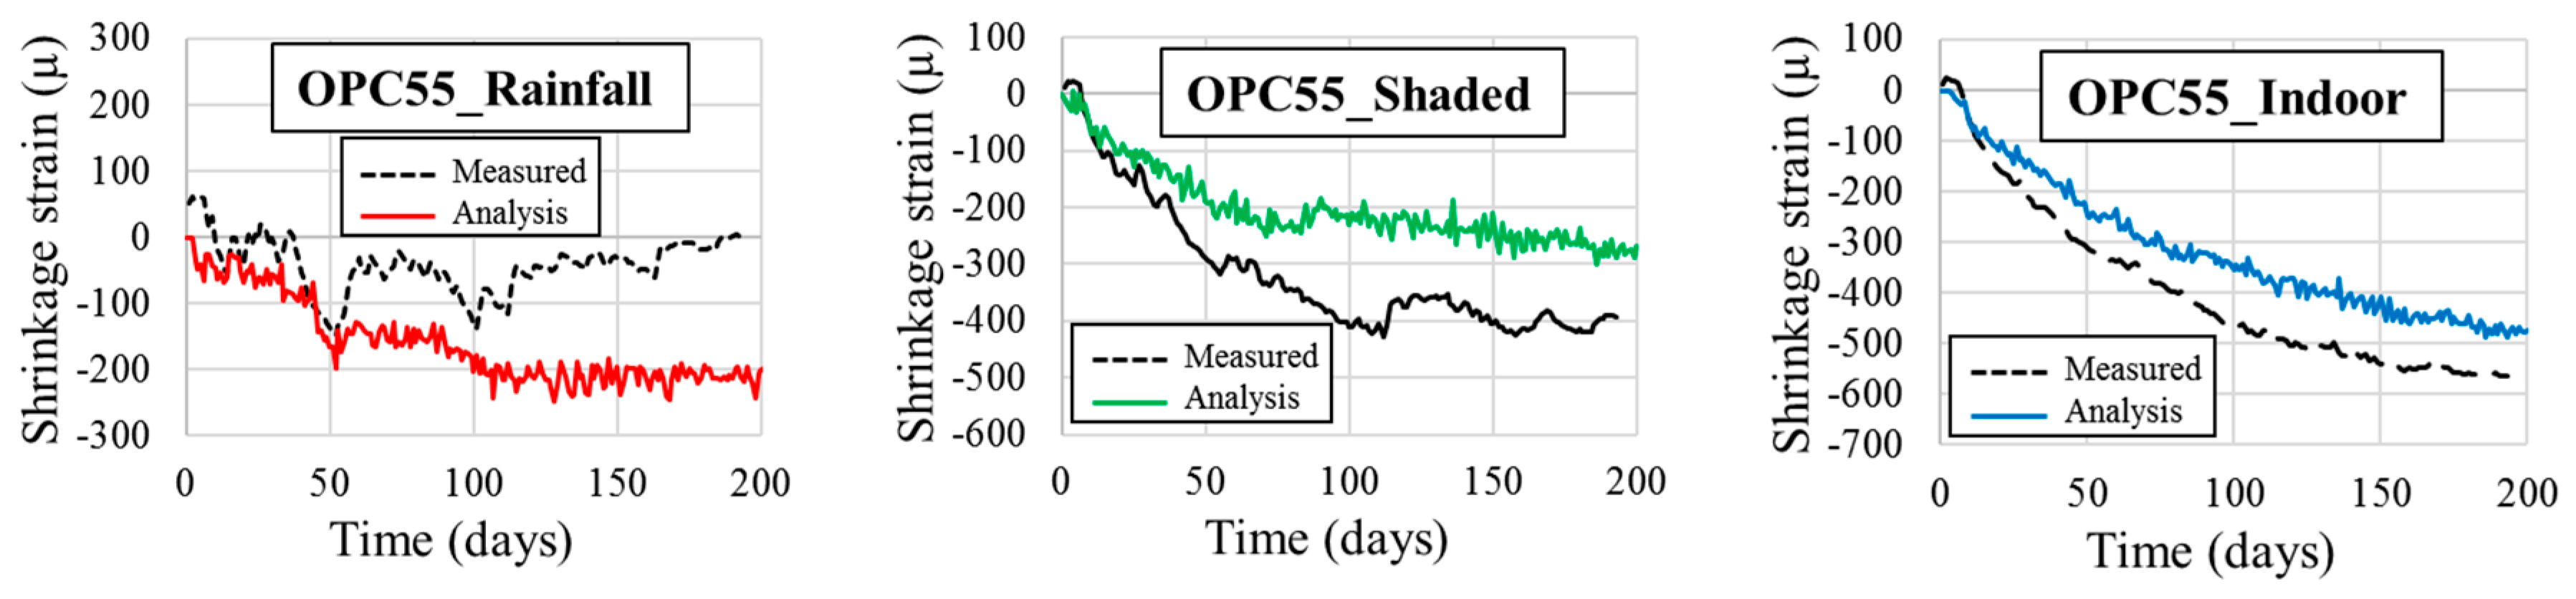
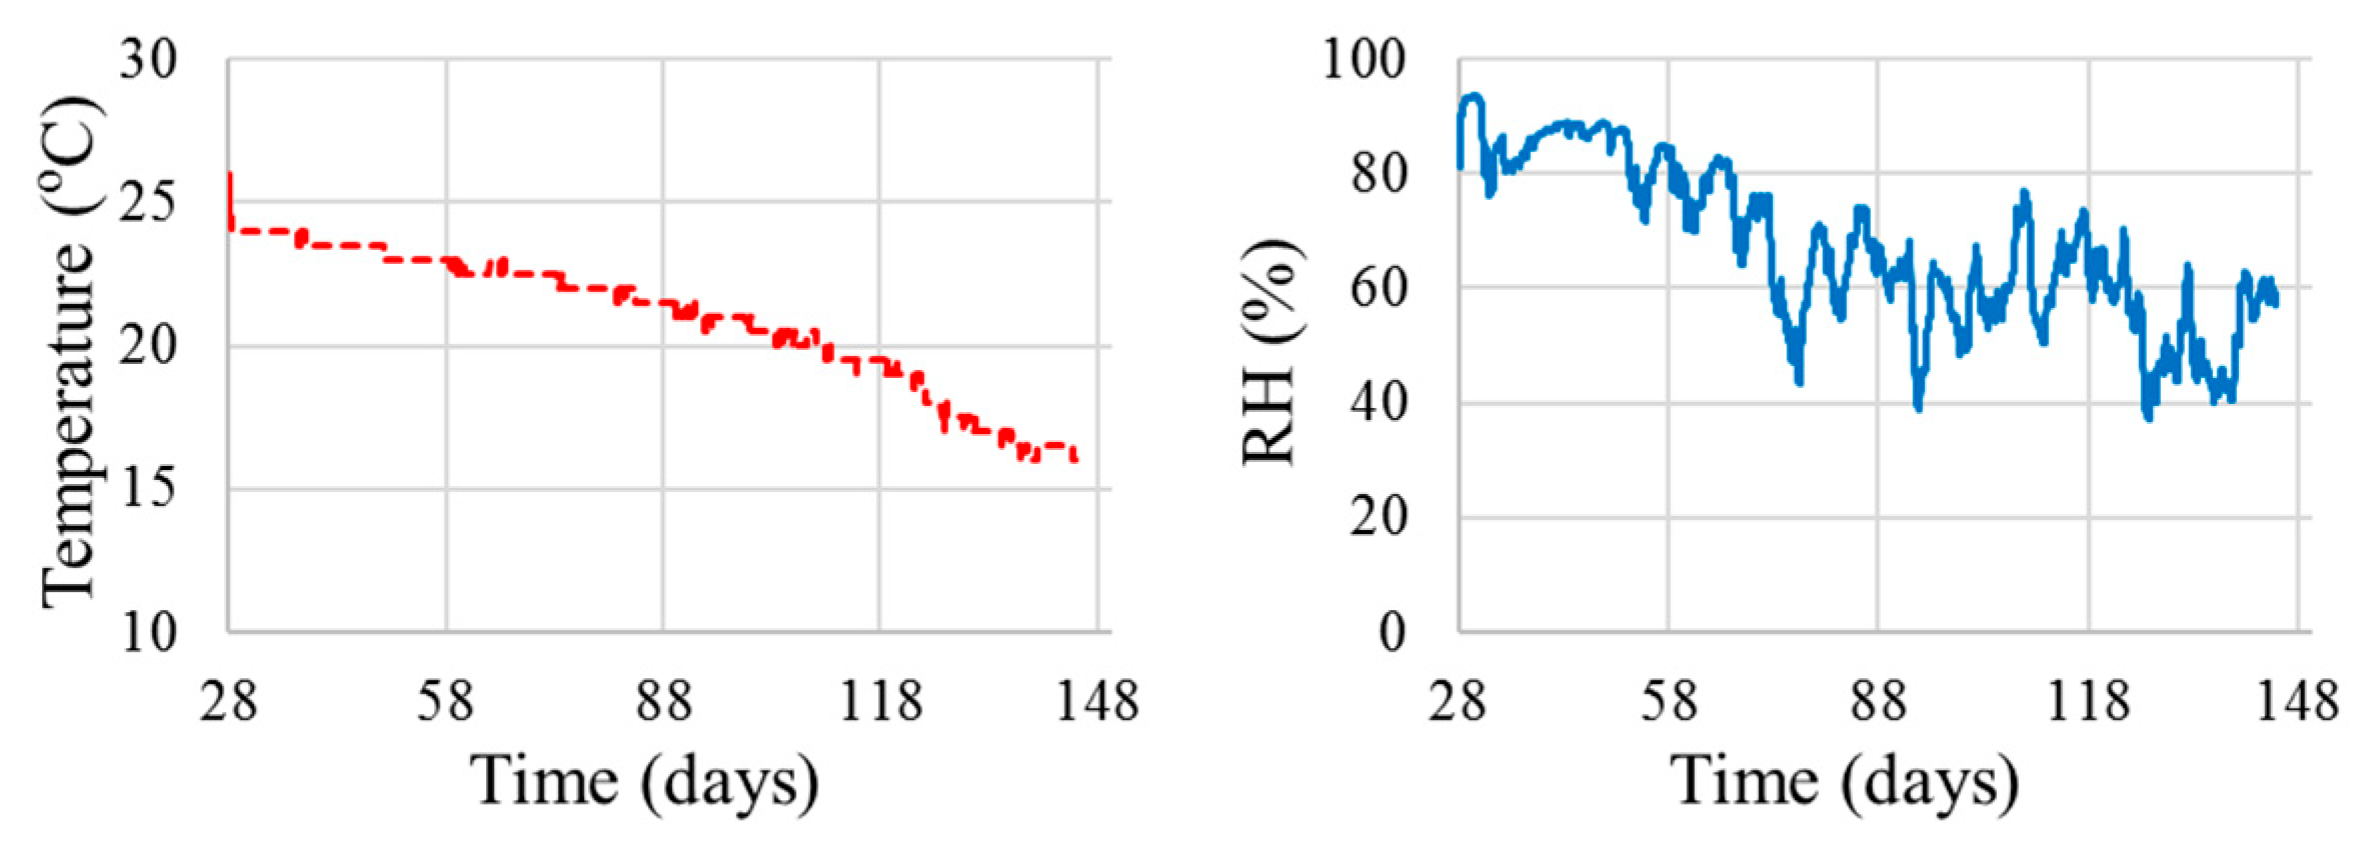
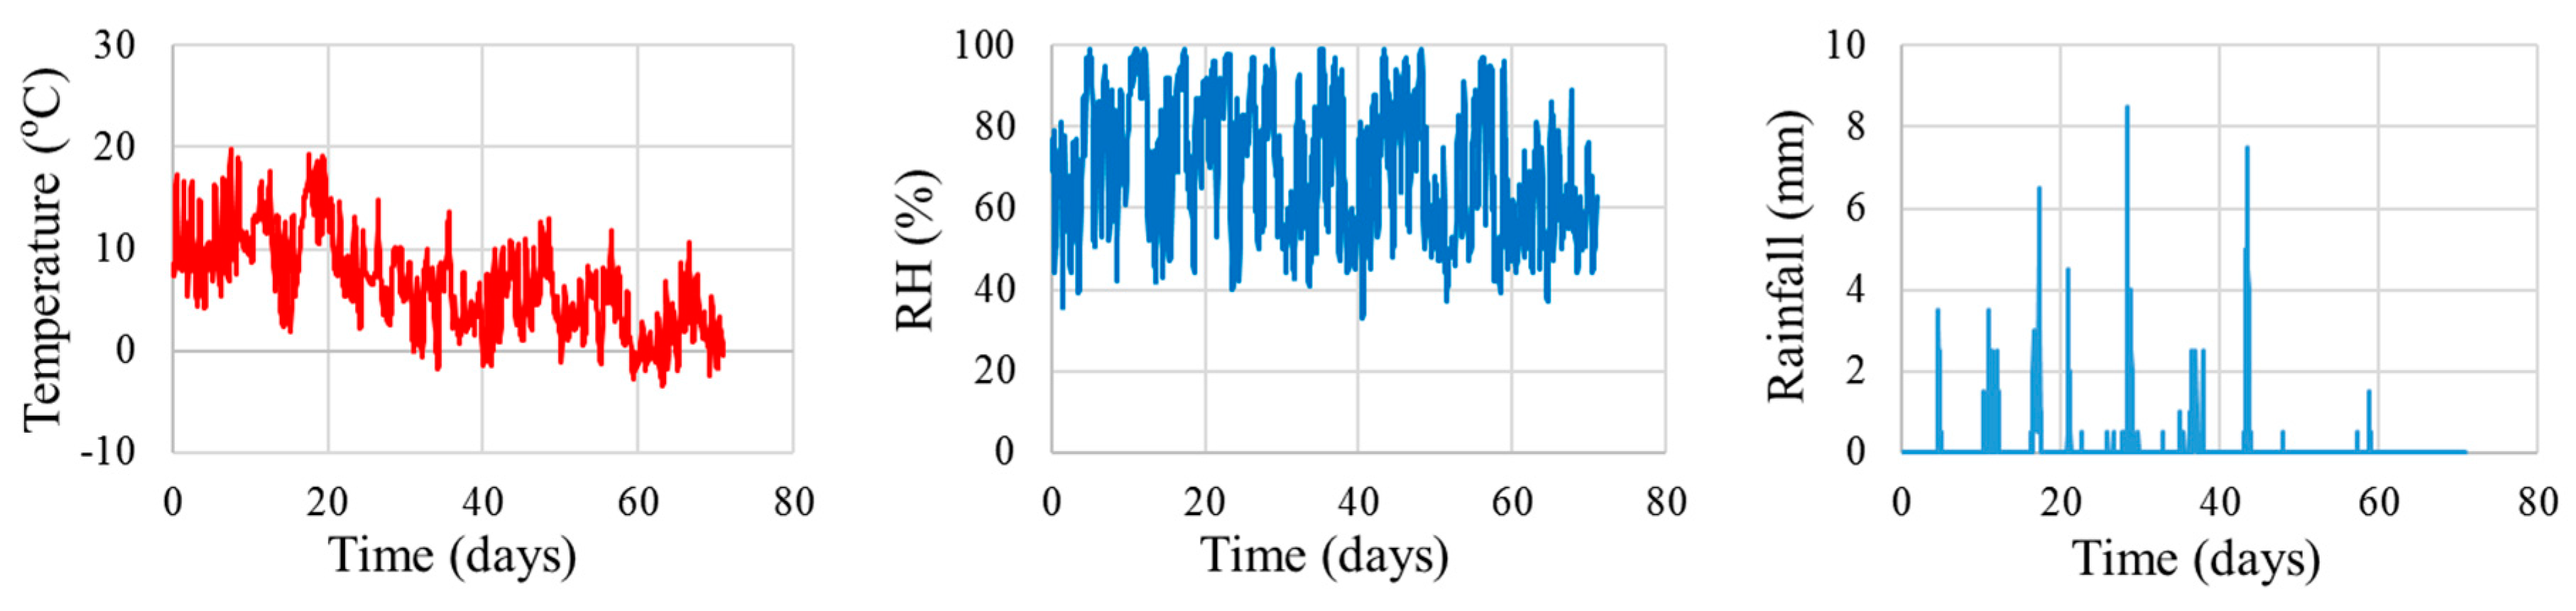
3.2.1. Influence of Environmental Conditions: Rainfall, Shade and Indoors

Figure 3a represents a one-fourth finite-element model of the 200 × 200 × 800 mm3 prismatic specimens that were used in the experiments on concrete shrinkage under direct rainfall, shade and indoor environment. Apart from the indoor case, for which numerical models have been verified, the fluctuation in environmental conditions necessitates further model validation because it significantly affects the microscopic thermodynamic phenomena of the whole concrete body and, consequently, the mechanical properties. The displacement restraints were applied based upon the symmetric condition and actual placement of the specimens. In other words, a vertical displacement restraint was applied at the bottom surface, whereas longitudinal and transverse displacement restraints were applied at the X-symmetric plane and the Y-symmetric plane, respectively. As necessitated by the computational platform, the mix proportion, casting temperature and curing conditions were identical to the experimental conditions. The implemented mixture designs for the specimens were OPC55 and OPC45 as indicated in Table 1. Figure 3b depicts the environmental condition. The environmental data, which consist of the temperature and relative humidity of rainfall, shade and indoor conditions, were obtained from data loggers at each corresponding location. The rainfall specimens were exposed to direct sunshine and rainfall, as shown in Figure 4a, whereas shaded specimens were sheltered from direct sunshine and rain (Figure 4b). The indoor specimens were kept in a storage room without direct exposure to the ambient environment. Rainfall is of paramount important in determining concrete shrinkage behaviour. To simply account for the water absorption of concrete via rainfall, the emissivity coefficient in the surface mass flux is assumed to increase one hundred times from its original value. However, the actual hydraulic pressure on the exposed surface could be acquired in the model [12]. The rainfall data of Koriyama in Fukushima prefecture was retrieved from the Japan Meteorological Agency and applied in the analysis.
Figure 5, Figure 6 and Figure 7 portray a comparison between the measured values from data loggers and the analytical results of the experimented specimens. Figure 5 shows that a change in the mass of the specimens could be simulated well for the shaded and indoor cases. The analytical results for the specimens with direct rainfall appear to have been underestimated. Figure 6 and Figure 7 illustrate the concrete strain in OPC55 and OPC45, respectively. If attention was given to the specimens with direct rainfall, similar to the behaviour in mass change, a minimal discrepancy was found in the trend between the measured and analytical strain. As extra water from rainfall was supplied to the concrete through the exposed surfaces, the measured strain reflected this phenomenon through concrete expansion. Hence, the authors have come to understand that the simplified method of reproducing the rainfall effect should be enhanced to increase the accuracy of numerical prediction, but this effect would be relatively minimal in the case of large-scale concrete structures. In the case of shaded specimens, it is believed that the deviation between the measured and analytical strain in OPC55 likely resulted from the influence of the wind, unlike the indoor specimens.

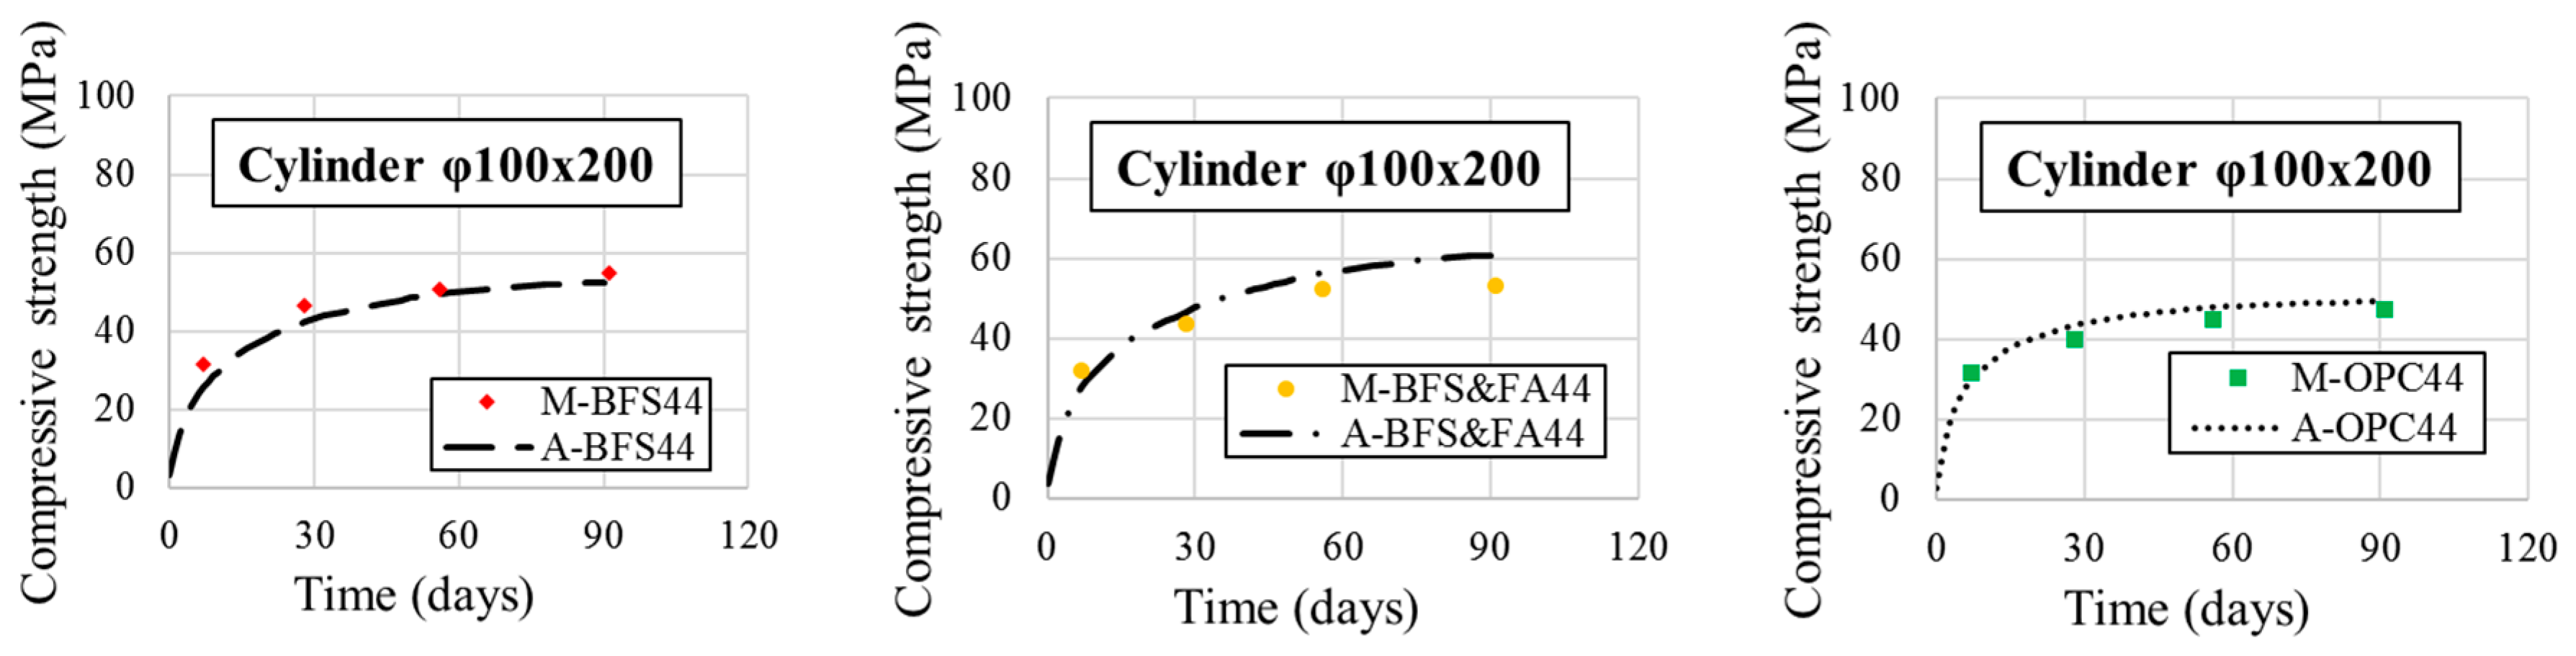
3.2.2. Compressive Strength

Referring to JIS A 1108 specification, compression tests on a φ100 × 200-cylinder specimen with radius of 100 mm and height of 200 mm, were also conducted for various mixture designs (Table 2). The specimens underwent seal-curing conditions for 28 days before exposure to the ambient environment in a storeroom (Figure 8). In the DuCOM system, the strength model assumes a close relationship with capillary porosity development, whereby the present and initial capillary porosity are considered based on their ratio. BFS concrete has a finer pore size distribution and lower porosity than OPC concrete, which affects the long-term strength [13]. To revalidate the model, Figure 9 shows the compressive strength of each mix design series. It can be observed that the compressive strength can be satisfactorily predicted.

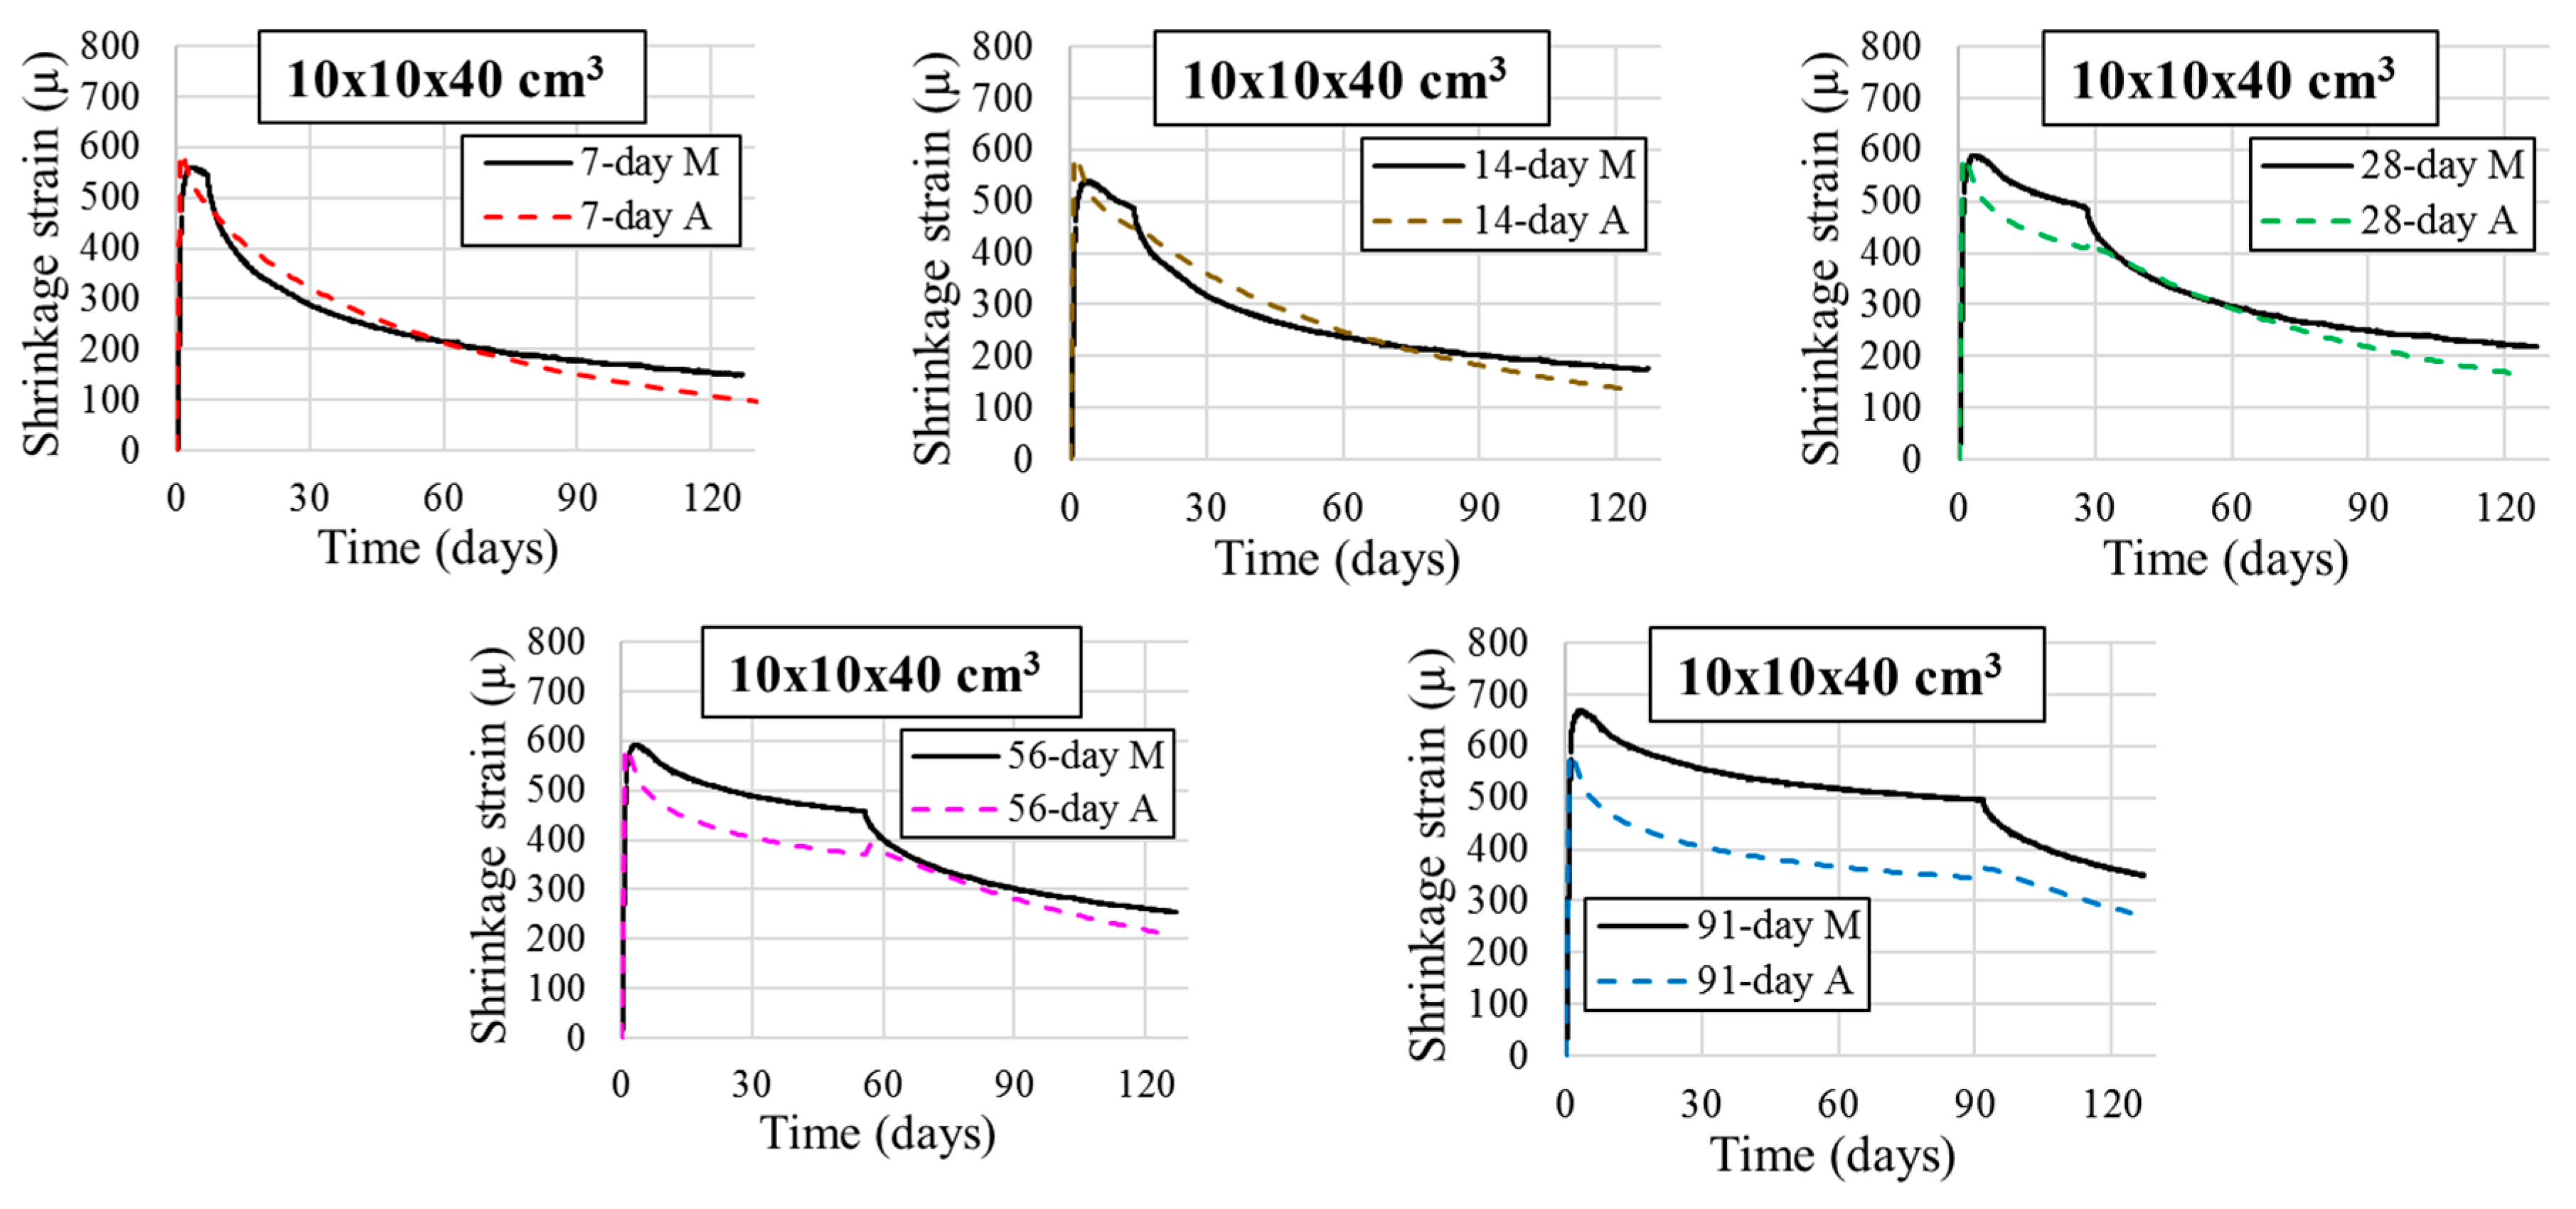
3.2.3. Influence of Curing Conditions on Concrete

The use of a high-performance mix design as such requires a study on the curing period to determine the optimum choice for execution without being vulnerable to cracking risk. Thus, referring to Figure 10, five 100 × 100 × 400 mm3 prismatic plain concrete specimens were prepared with five different curing periods (7, 14, 28, 56 and 91 days) before exposure to the environment of the control chamber (a constant 20 °C and 60% relative humidity). The mix design of these specimens was BFS44 (Table 2). Figure 11 shows the finite element of the prismatic specimens whereby the boundary conditions are applied in the same manner as that of previous cases. Unlike OPC concrete, the use of a low water-to-cement ratio as such in BFS concrete allows autogenous shrinkage to play a predominant role, on par with that of drying shrinkage, in determining the properties of the concrete. Thus, to properly capture the autogenous and drying shrinkage of BFS concrete, the driving force of shrinkage in the model is divided into two entities: capillary tension force and disjoining pressure. The former, which dominates the nanoscale pores, is of paramount significance under low relative humidity, but the latter, which governs the microscale pores, contributes significantly with a high relative humidity [6]. The applicability of the BFS model in actual specimens exposed to various curing durations would also be confirmed through this model validation.
The trend of the analytical results shown in Figure 11 could be acceptable in terms of strain prediction despite some discrepancies, especially during the sealing period. Our current expansive additive model would only apply instantaneous expansive strain to concrete without consideration of its long-term effect, whereby complete expansion could continue to at least a week [14]. Although, to provide better accuracy in predicting strain at an early stage for cases in which expansive additives are applied, the authors aim to investigate the issue and develop a more sophisticated model. Because the most prevalent forms of cracks, that is, thermal and shrinkage-induced cracks, are more likely to occur after the curing period, the minimal variation during the sealing condition could be reasonably disregarded. Therefore, it could be concluded that the overall trend and strain value of concrete under seal-curing conditions could be acceptably traced.

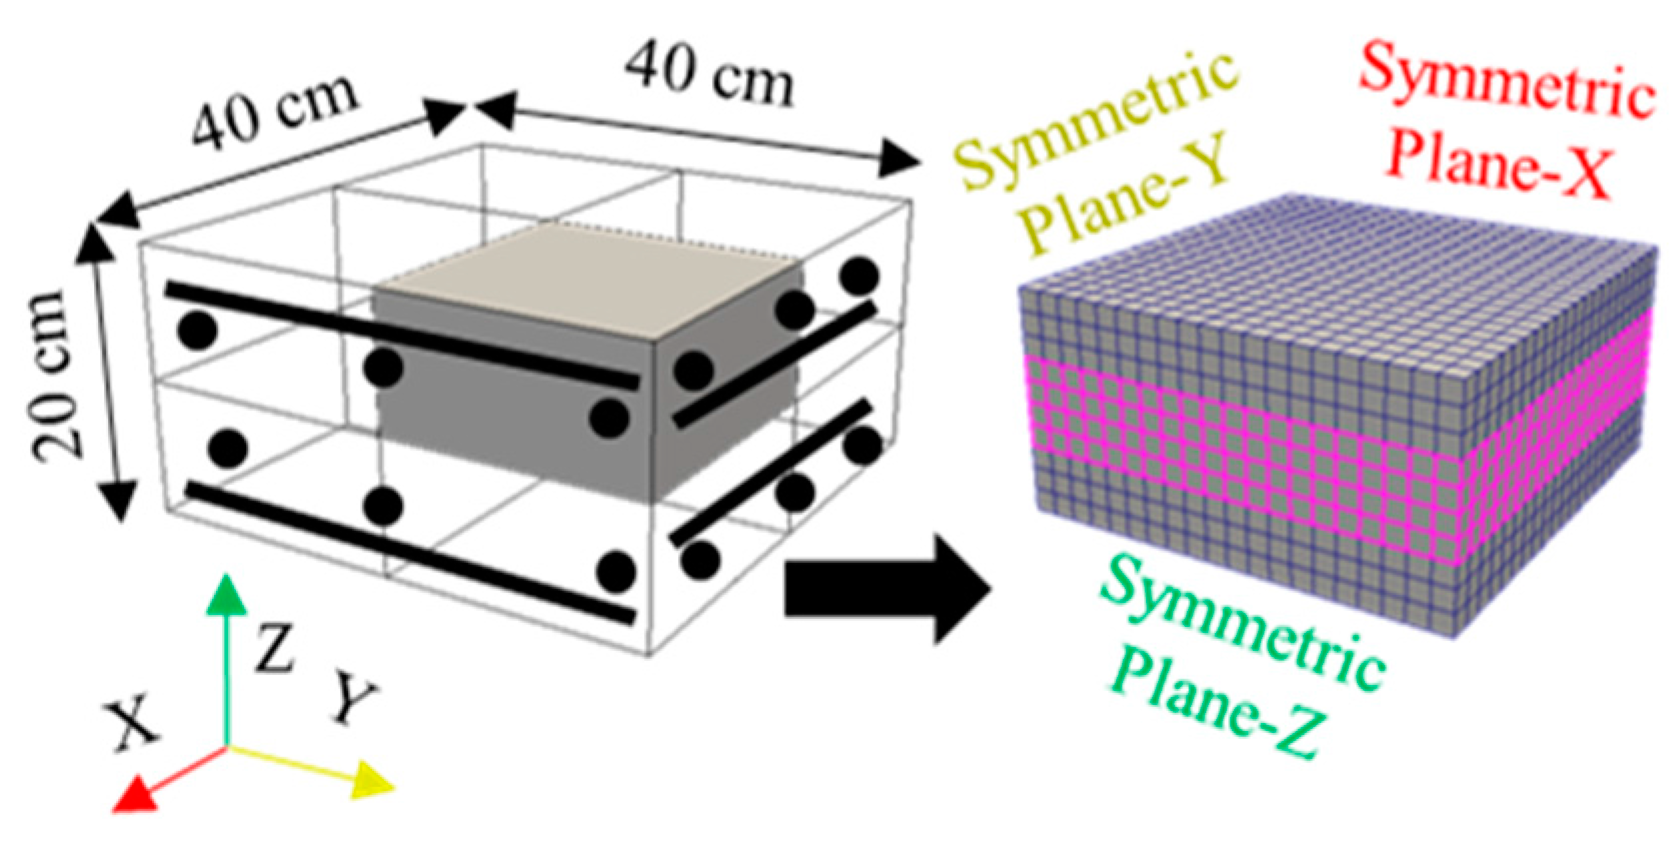
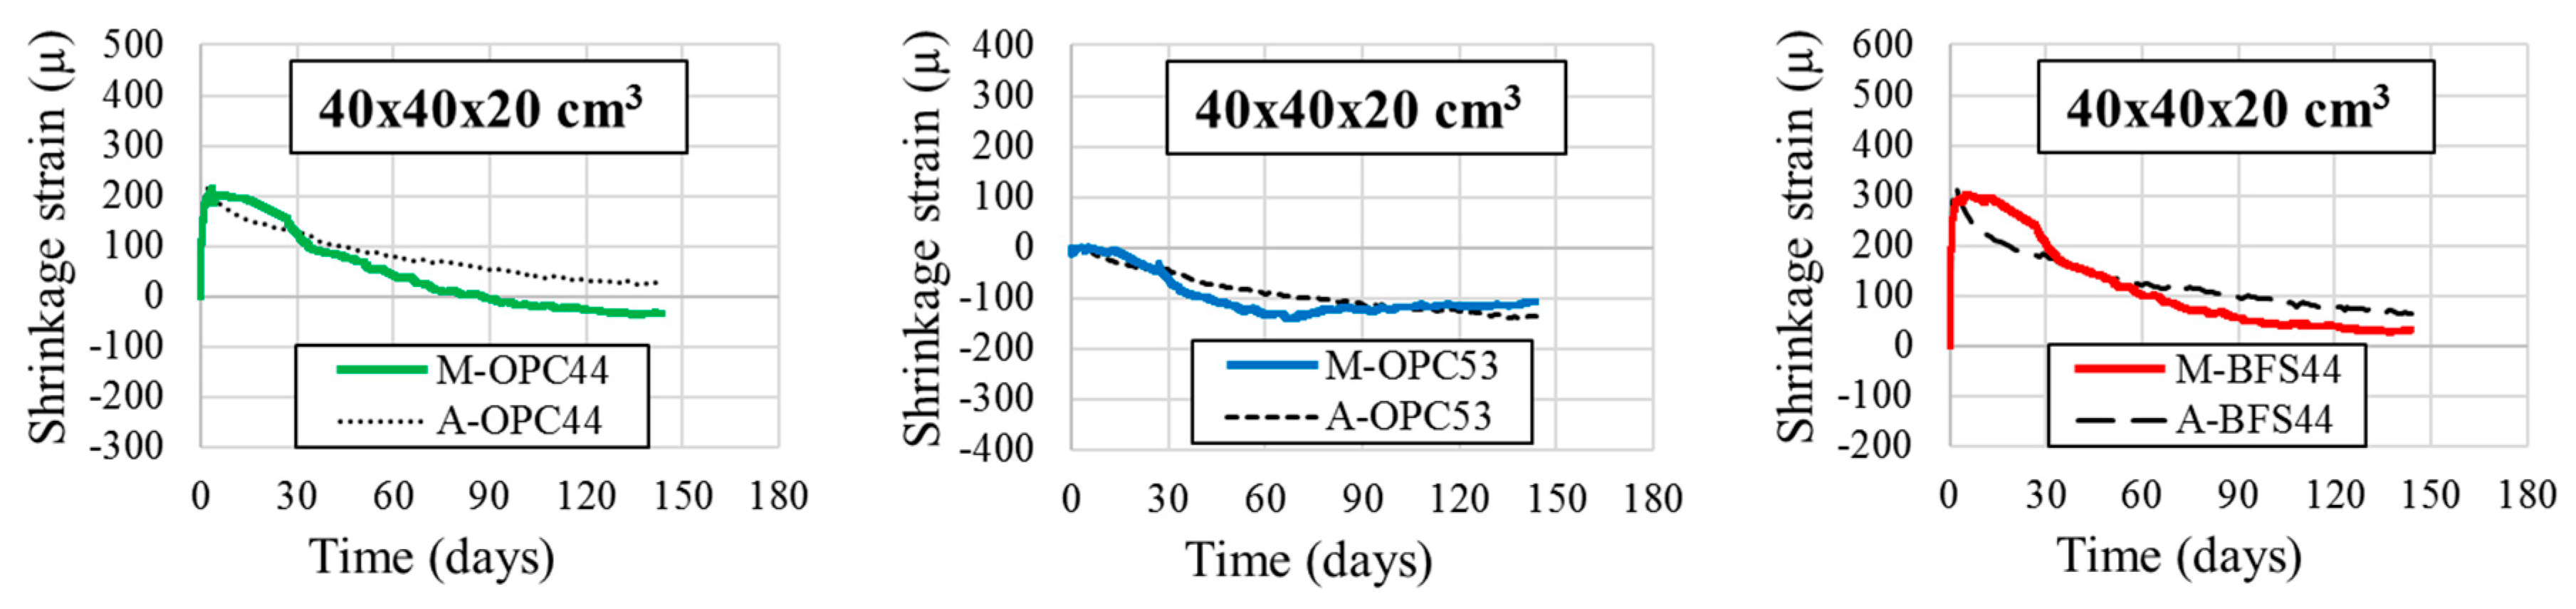
3.2.4. Influence of Reinforcing Bars on Concrete

It was understood that by observing the strain progress of small RC specimens, the shrinkage behaviour and cracking susceptibility of concrete using the mix proportions could be more revealing to a certain degree due to the restraints of the reinforcing bars. Hence, prismatic RC specimens of 400 × 400 × 200 mm3 with the aforementioned mixture designs in Table 2 were used for the experiment. Six reinforcing bars with a diameter of 19 mm were embedded transversely and longitudinally at both the top and bottom regions of the prismatic specimens. Figure 12 shows the finite-element model of one-eighth of the 400 × 400 × 200 mm3 prismatic specimen, in which the reinforcements were inserted into the elements marked by purple boxes according to their reinforcement ratios. The specimens were under seal-curing conditions for 28 days before they were relocated to a storage room with exposure to the ambient environment, as shown in Figure 8. To incorporate the effect of expansive additives in concrete, we used a simple model that imposes instantaneous expansive strain on the concrete depending on the degree of restraints, such as rebar and external boundaries.
Figure 13 shows that the analyses proved that the strain progress of the specimens could be predicted satisfactorily. Furthermore, based on this result, it could be proven that the simple model of an expansive agent could provide a reasonable output without affecting the strain behaviour of the concrete in the long run. Also, as concrete expands in the initial place, the risk of cracking in the early period is heavily reduced because of the expansion effect. Therefore, our main concern should not be with how well the model predicts the expansion of concrete, but with the progress of strain over time because it is much more relevant to the initialisation of cracks. Based on the results of all of the model validations, it can be confirmed that the computational models can trace the mechanistic behaviour of concrete reasonably well on a small scale.

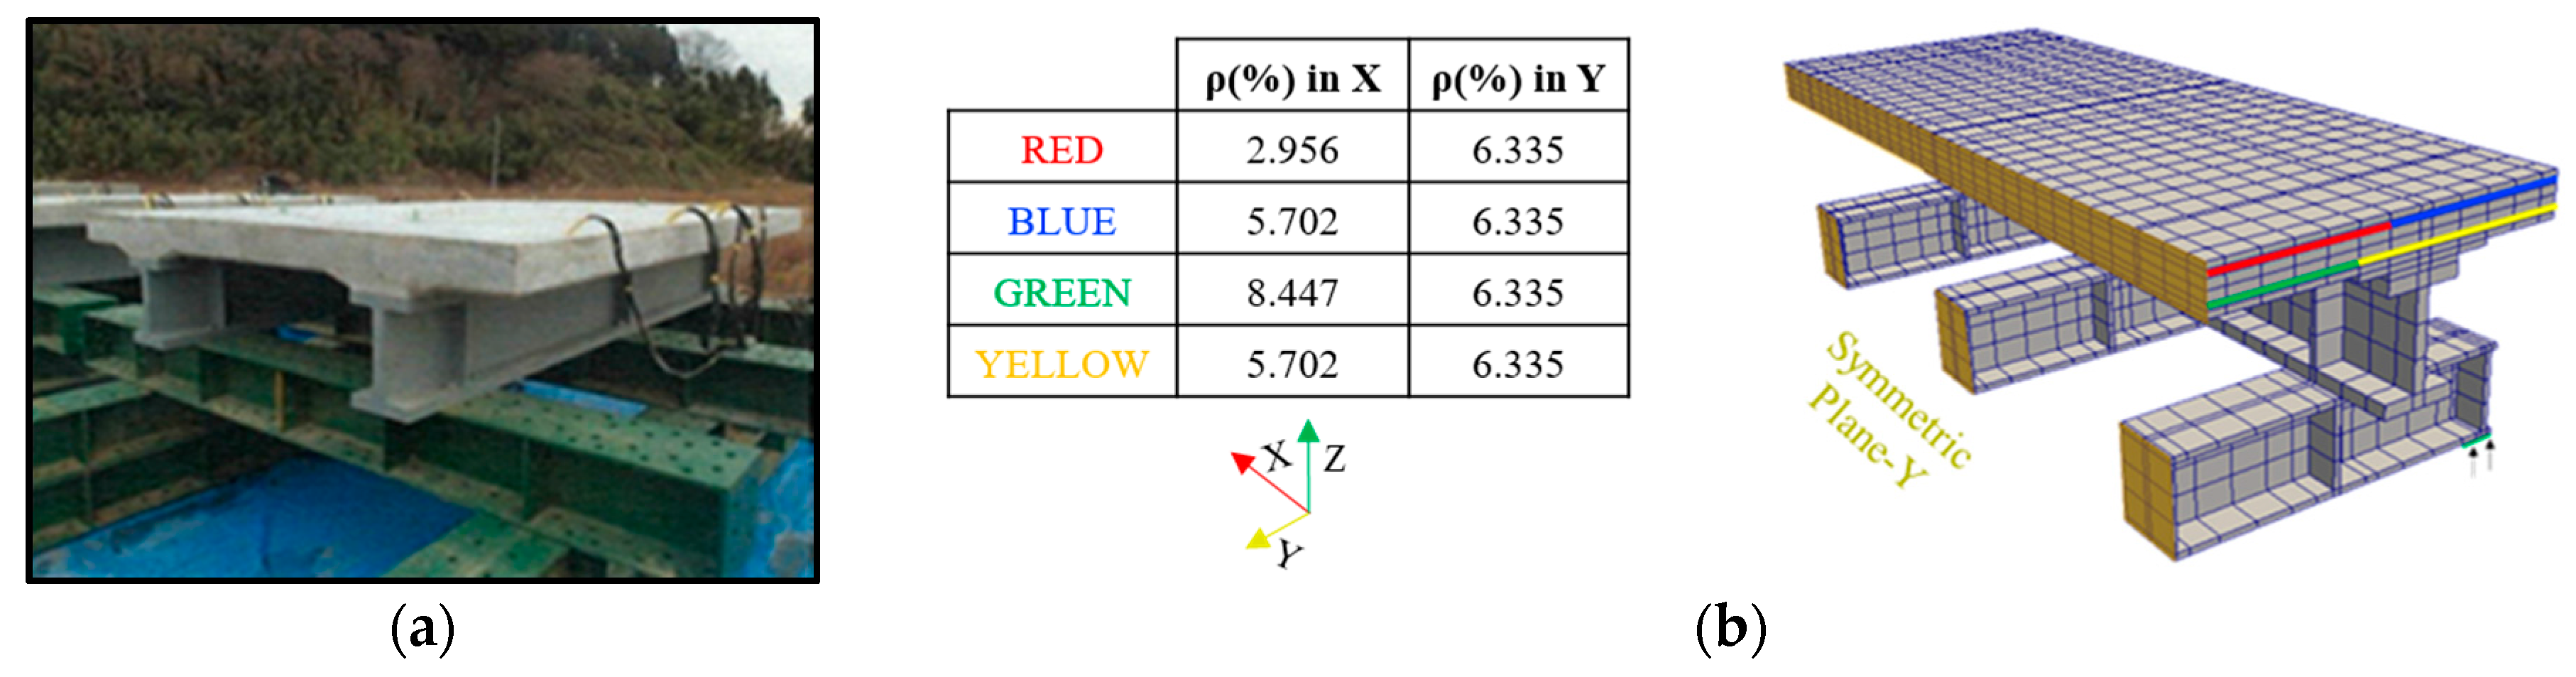
3.3. Application of the Analytical Model on a Mock-Up Slab Specimen

To represent a restraint condition as close to reality as possible, two I-section girders were placed at the concrete supports as they would be placed on the actual steel girders whereas half of the actual specimen were used for the finite element model as indicated in Figure 14. The replicated specimen was cast with ‘BFS44’ mix design and water-cured for 42 days on the top surface before exposure to the outside environment. For Figure 14b, the diameters of the reinforcing bars were 19 and 16 mm in both top and bottom sections as coloured and shown with the reinforcement ratio. The environmental data for Rikuzentaka in Iwate prefecture were obtained from the Japan Meteorological Agency and identically input to the analysis as shown in Figure 15. To trace the expansion and contraction behaviour of the deck in a quantitative manner, strain gauges were also embedded at the locations shown in Figure 16. These strain gauges perform measurements in transverse, longitudinal and vertical directions. As portrayed in Figure 16, four finite-element models of the mock-up specimen were established to conduct mesh sensitivity analysis to minimise the calculation efforts with acceptable accuracy in the following large-scale bridge model. This element discretisation process was necessary because the convergence in computation of thermodynamically microscopic aspects in DuCOM had to be ensured to provide reasonably accurate results for its counterpart, COM3, to analyse the macroscopic structural behaviour.
Due to issues with the embedded strain gauges after removal of the formwork, the measured data from the 42nd and 56th days were lost. Nonetheless, the whole trend of the strain could still be captured, whereby the rearrangement of the strain gauges might have affected the strain progress and resulted in a slightly greater shrinkage strain value. Two main conclusions could be drawn from the result of this analysis. First, the computational model can capture the strain progress with only minimal differences. Good agreement was also achieved between the measured and analytical values for the concrete temperature. Second, the differences between the computed strains of the four finite-element models with distinctive aspect ratios and element sizes were also negligible. Thus, it can be confirmed that the element with a length of around 300 mm could reasonably be implemented in the large-scale analysis.

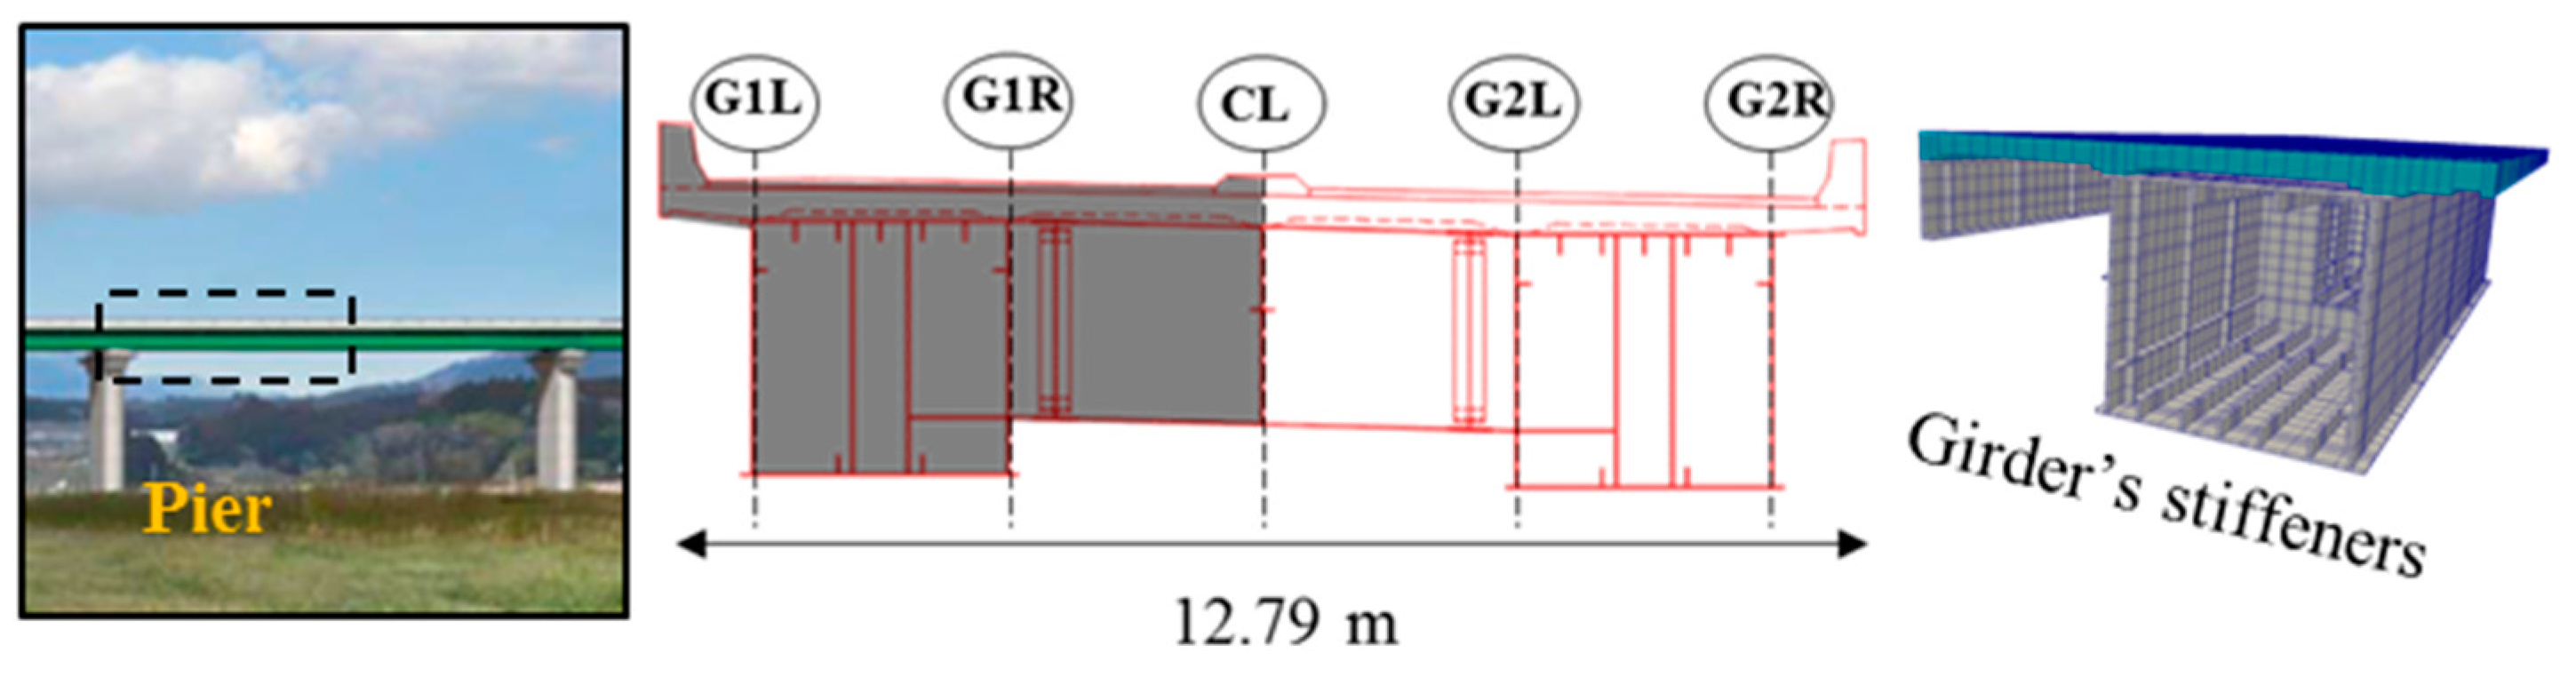
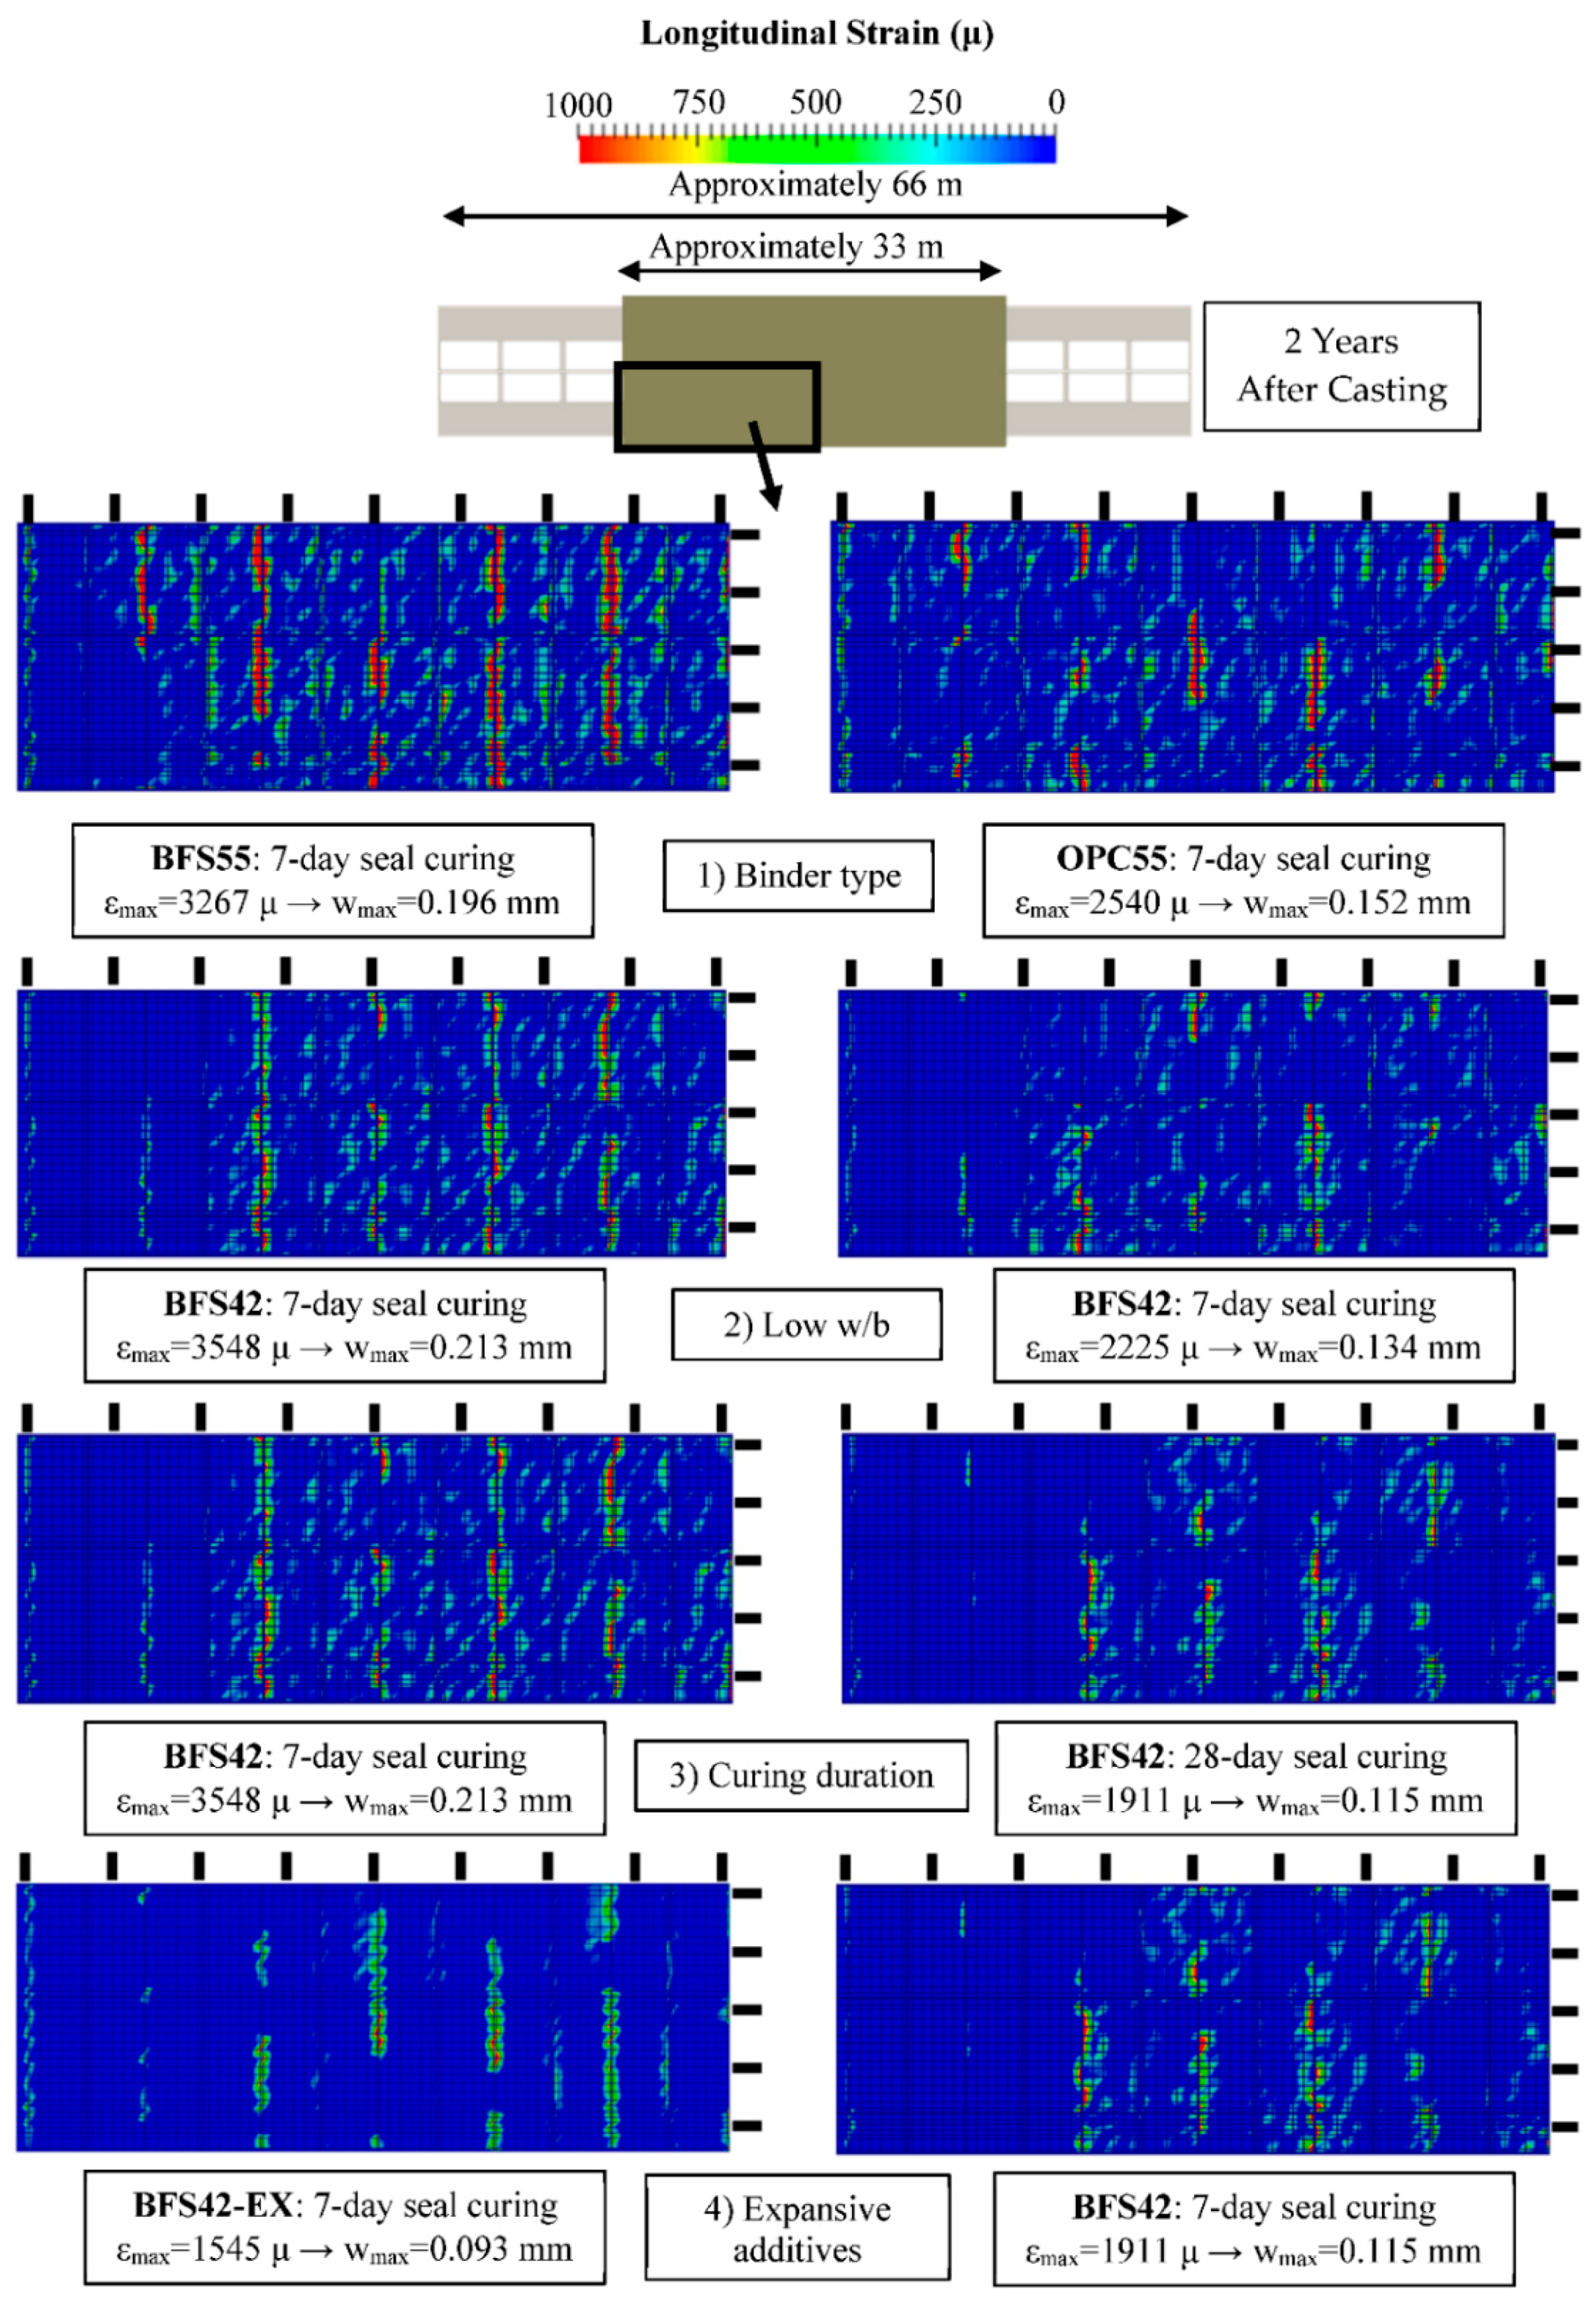
3.4. Preliminary Analysis on Concrete Deck Slab of Shinkesen Bridge to Evaluate the Occurrence of Cracks

To combat the complex degradation processes from the cold environment, frost damage, chloride attack from de-icing salt, alkali–silica reaction and fatigue, a holistic countermeasure approach was undertaken to enhance the durability performance of the RC deck slab. The multiple protection strategy incorporates a low water-to-binder ratio (w/b), the use of mineral admixture, epoxy-coated reinforcing bars and 6% entrained air [1]. Because the early-age cracks such as shrinkage cracks allow more migration of deleterious ions into the body of concrete under such severe conditions, it is of great significance to control and delay its occurrence [10]. Therefore, before the Shinkesen Bridge was constructed, a cracking assessment was performed for various mixture designs.
Figure 17 outlines the layout of the finite-element model of the Shinkesen Bridge for preliminary analysis of crack propagation. Considering the symmetric condition and actual construction procedure that would be adopted, the RC deck slab was modelled in combination with the girders and their stiffeners to achieve structural resemblances that have an effect on the restraint condition. To capture the temperature and moisture gradients inside the RC deck slab properly, and based on the mesh sensitivity analysis conducted on the mock-up slab specimen, the maximum length of the element was taken to be 250 mm. To shorten the computational time, and as a conservative measure, the ambient environment was set to dry conditions with a constant 15 °C temperature and 70% relative humidity on the concrete surface throughout the calculation, whereas the asphalt layer would exist on the top surface in reality. The environmental conditions were decided based on the average value in accordance with the local meteorological data. The effects of concrete mixture designs on crack generation and propagation were investigated in the analysis. In Japan, the typical w/b should not exceed 65%. In most cases, a w/b of 55% was endorsed, whereby the upper limit of water content is recommended as 175 kg/m3 and lower limit of the cement content is recommended as 300 kg/m3 [15]. As seen in Table 3, the mixture designs consist of five series: BFS42, OPC42, BFS55, OPC55 and BFS42-EX whereby ‘EX’ represents the use of expansive additives.
Figure 18 portrays the computed longitudinal strain after 2 years, which is the strain along the bridge axis, on the top surface of the RC deck slab. The strain contours were extracted from the portion of deck slab highlighted with the black rectangle. Due to the restraints from the steel girders, high tensile strains were seen to be localised around the elements with a longitudinal length of 60 mm, which would resemble that of cracks. Because these high tensile strains are mostly observed around the 60-mm elements, the transverse maximum crack width was calculated by multiplying the maximum strain with the element length of 60 mm. According to the JSCE standard, the limit value of crack width for concrete in a severely corrosive environment is 0.0035c, where c refers to the concrete cover [16]. Therefore, in the case of the Shinkesen Bridge, the allowable crack width would be equivalent to 0.14 mm. Four main aspects, focusing on BFS concrete, would be pinpointed from the parametric study, including the influence of the (1) binder type, (2) w/b, (3) prolonged curing, and (4) expansive additives. First, after 7 days of seal curing, a higher tensile strain is observed in the case of BFS55 than with OPC55. Furthermore, at 55% w/b, neither BFS55 nor OPC55 satisfy the JSCE cracking criteria. If attention is paid to the case of 42% w/b, a reduction in maximum tensile strain could be seen in the OPC42 case, whereas higher maximum tensile strain was seen in BFS42 because of the synergistic effect of high autogenous shrinkage and self-desiccation from a low w/b. Although OPC42 seems to satisfy the JSCE cracking criteria, its low resistance against durability issues such as ASR and chloride ingression mean that it might not be a good candidate for areas with severe environments, such as Tohoku. Then, consistent with the universal understanding that prolonged seal curing would reduce the moisture loss through the concrete’s surface, seal curing BFS42 up to 28 days significantly helped to reduce the maximum tensile strain. Finally, after incorporating expansive additives inside BFS42, further improvement in reducing the generation of tensile strain was illustrated. In addition to the lower intensity in the maximum crack width, based on the strain contour, the amount of nodal strain that reached a longitudinal strain of 1000 μ is also minimal, which infers that less crack propagation would occur than in the case without expansive additives. Hence, as a conservative measure in cases in which prolonged curing could not be properly conducted or maintained, the recommendation to use expansive additives in the multiple protection strategy is quite reasonable.

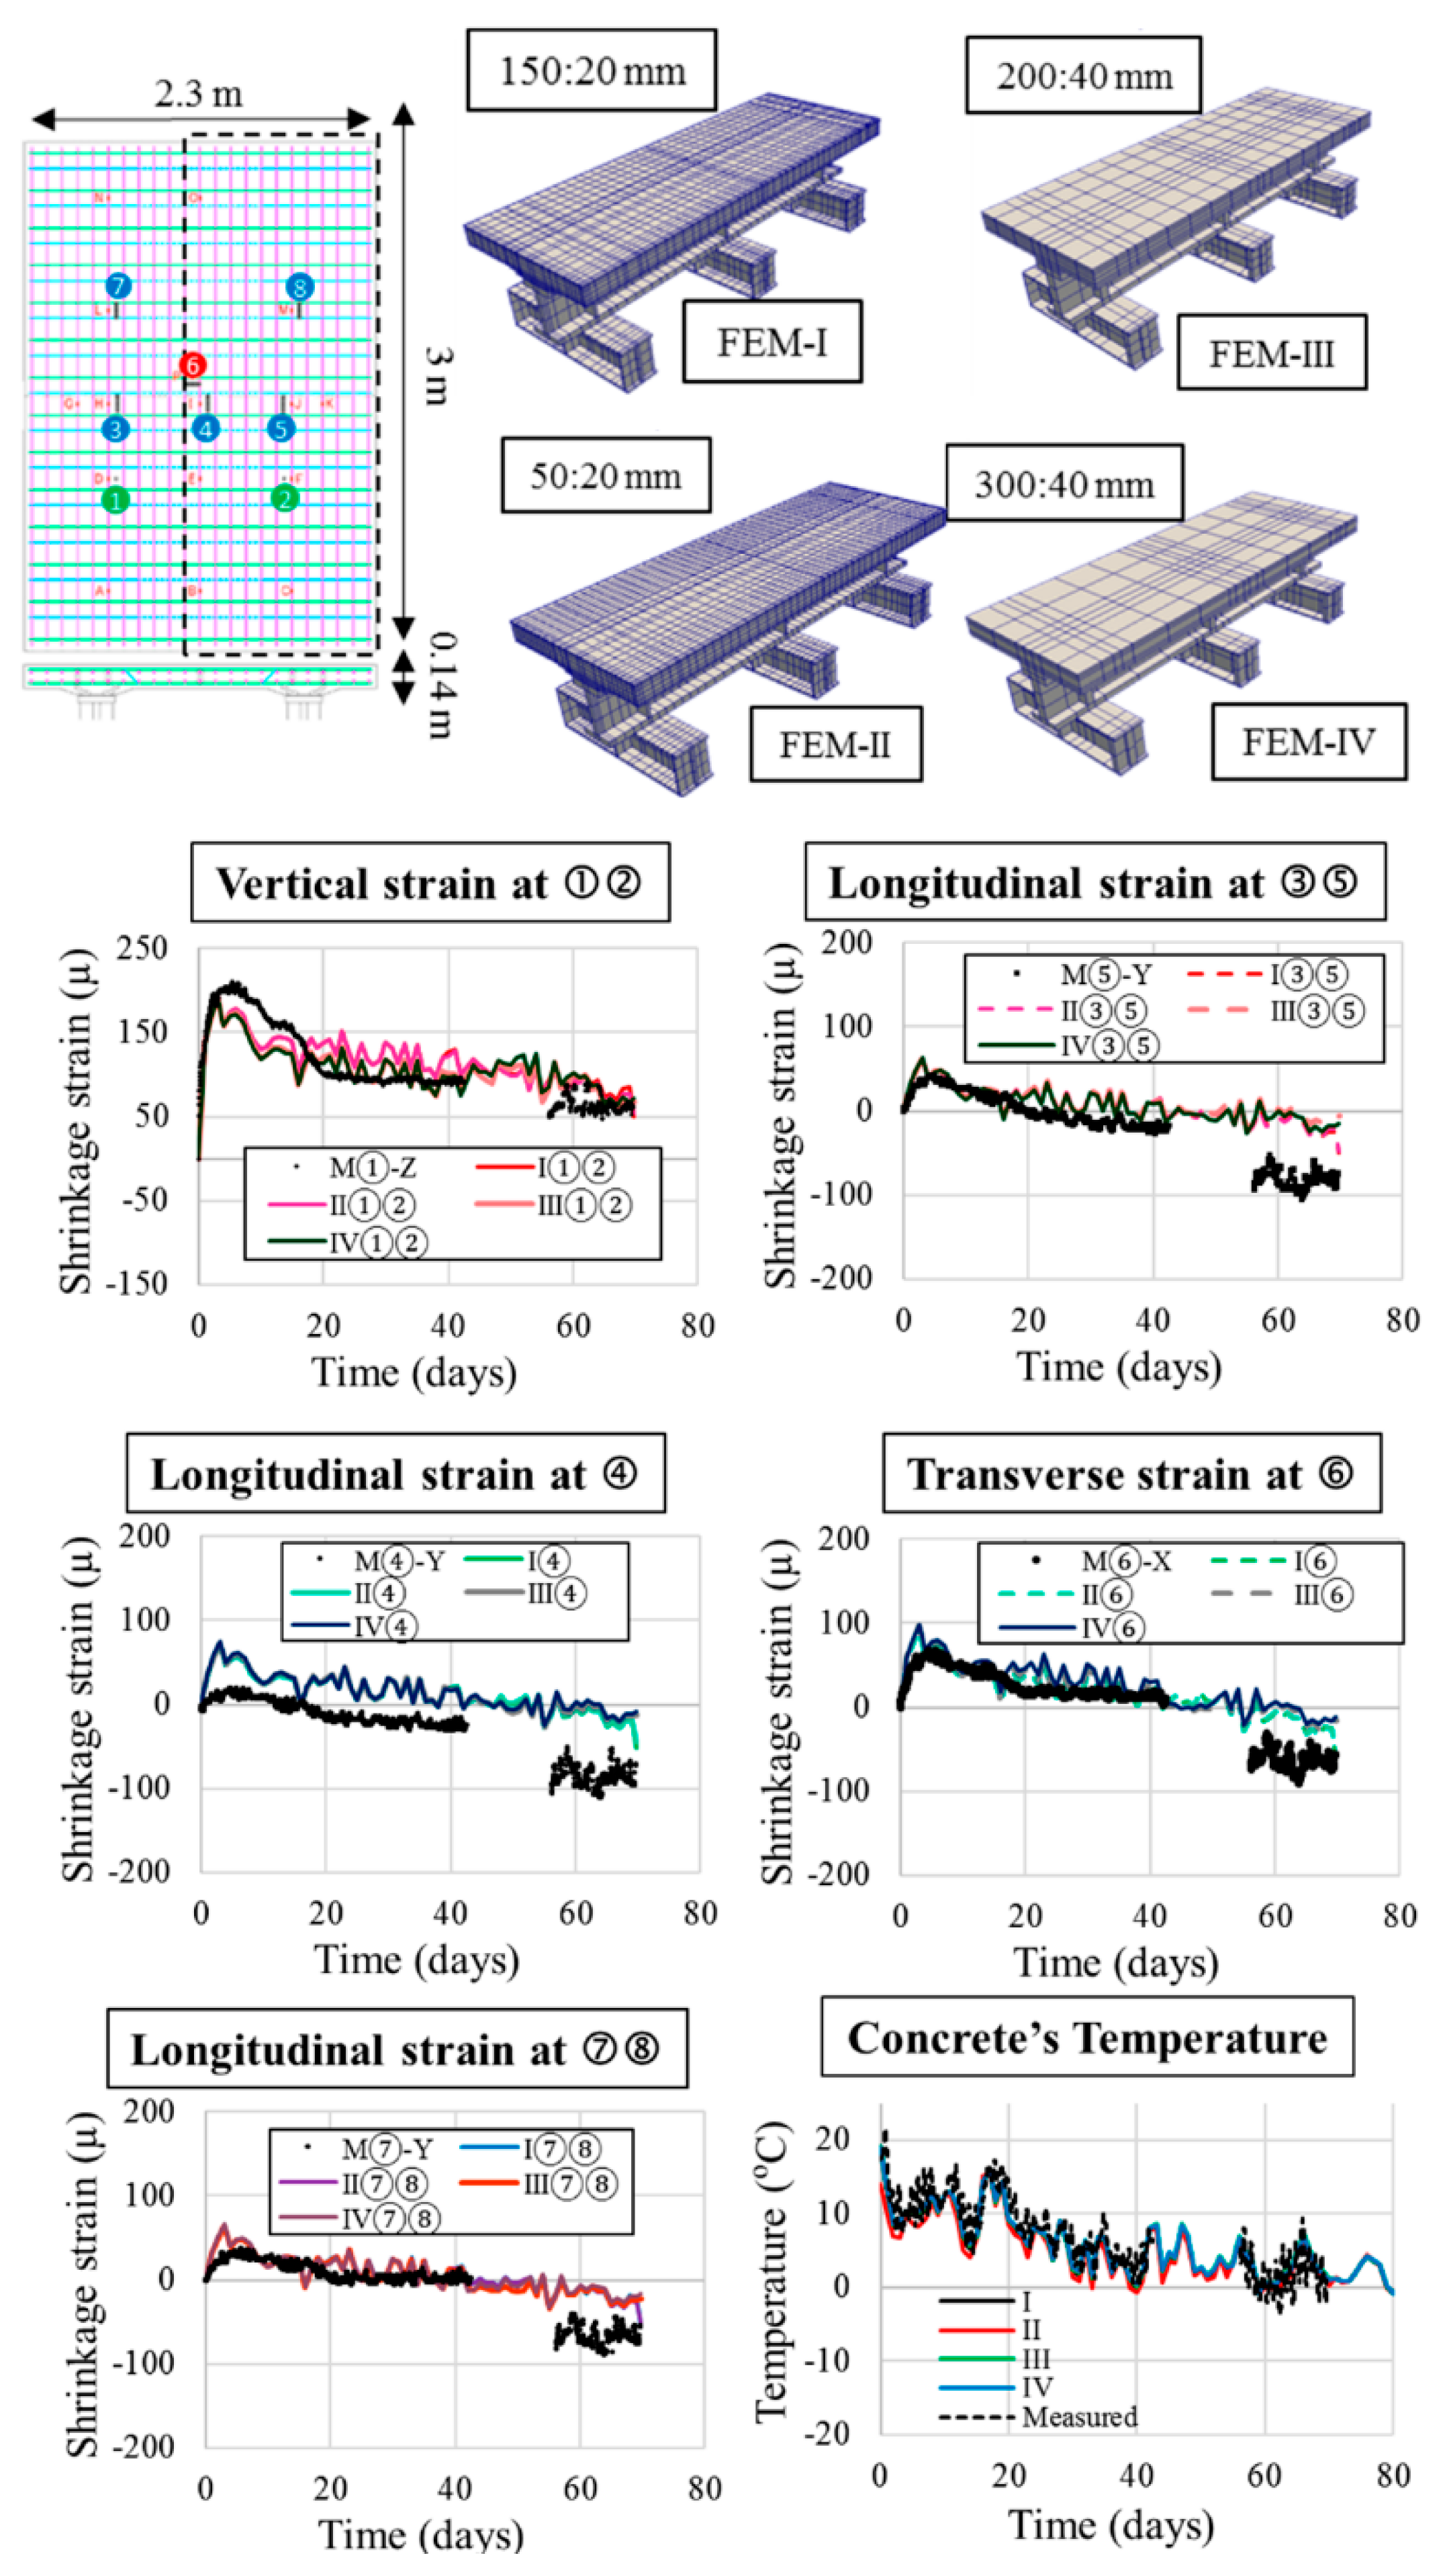
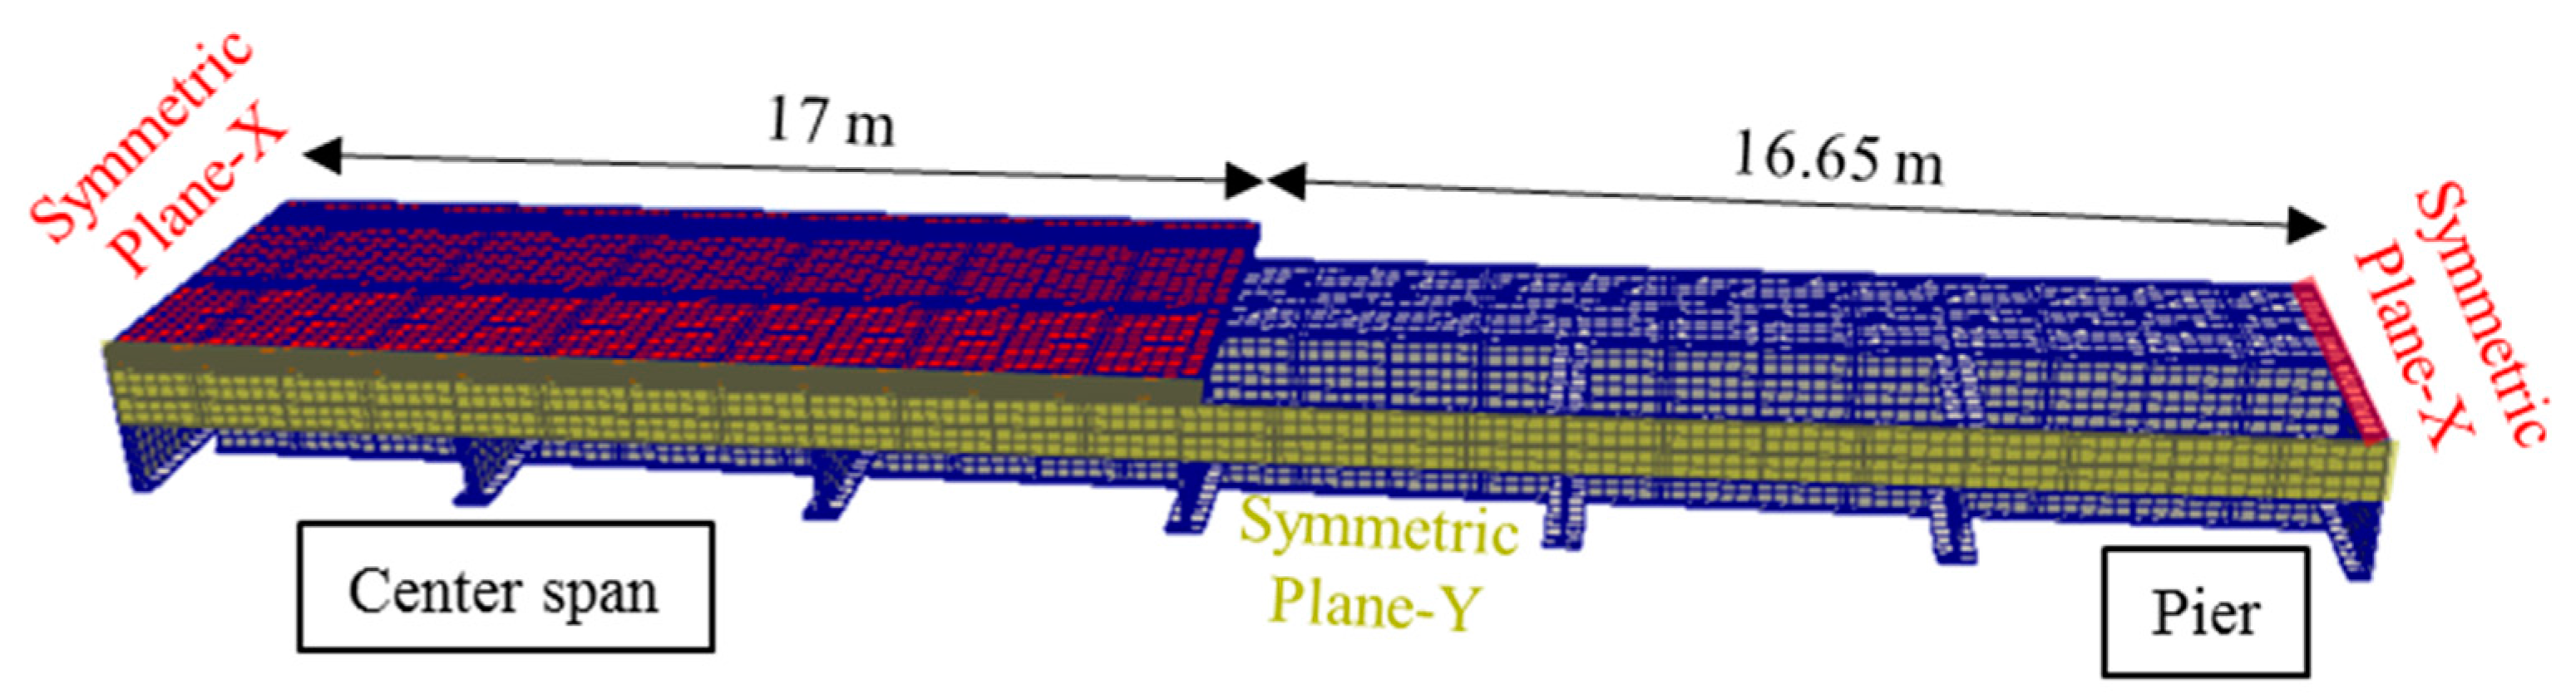
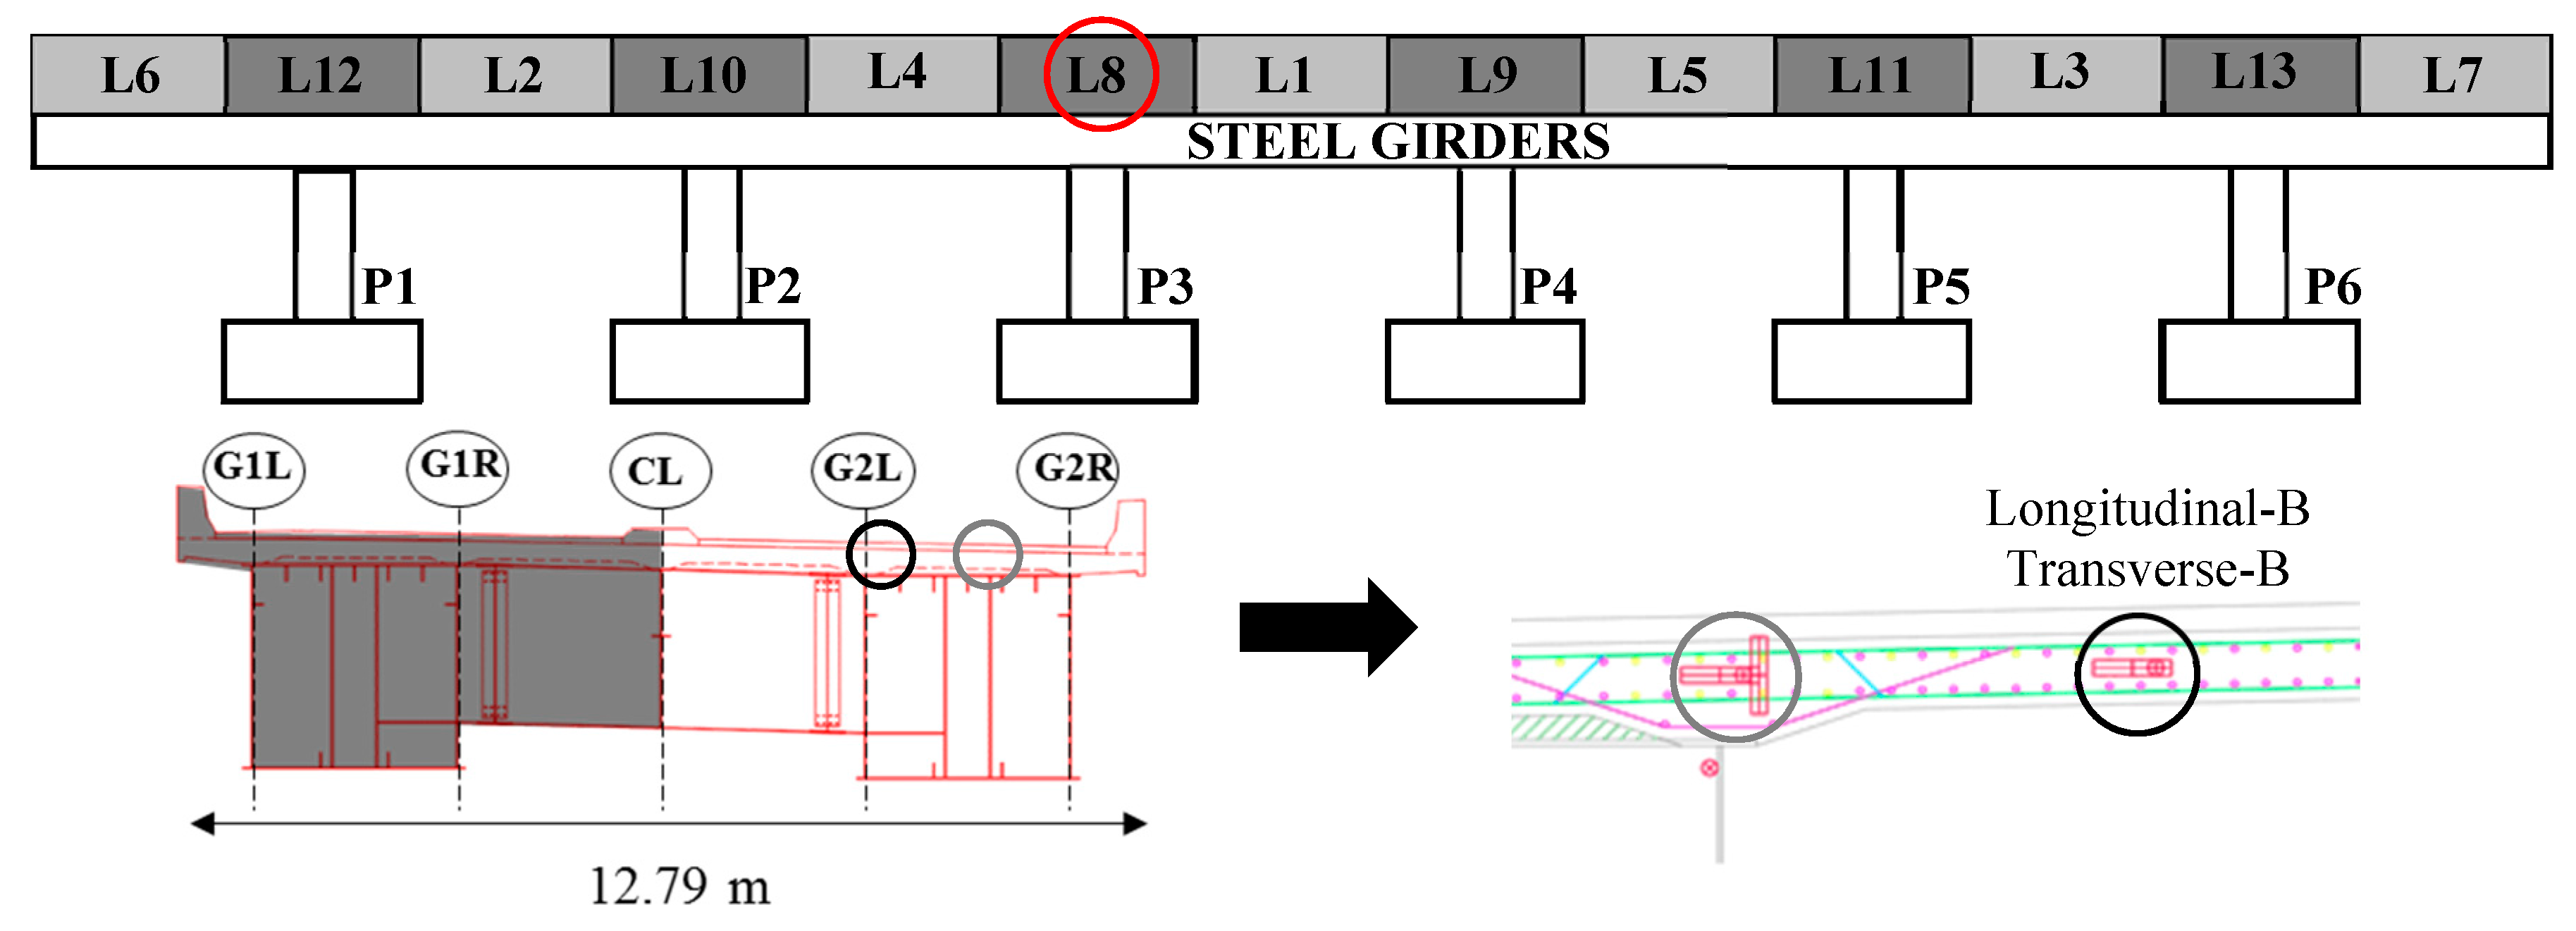
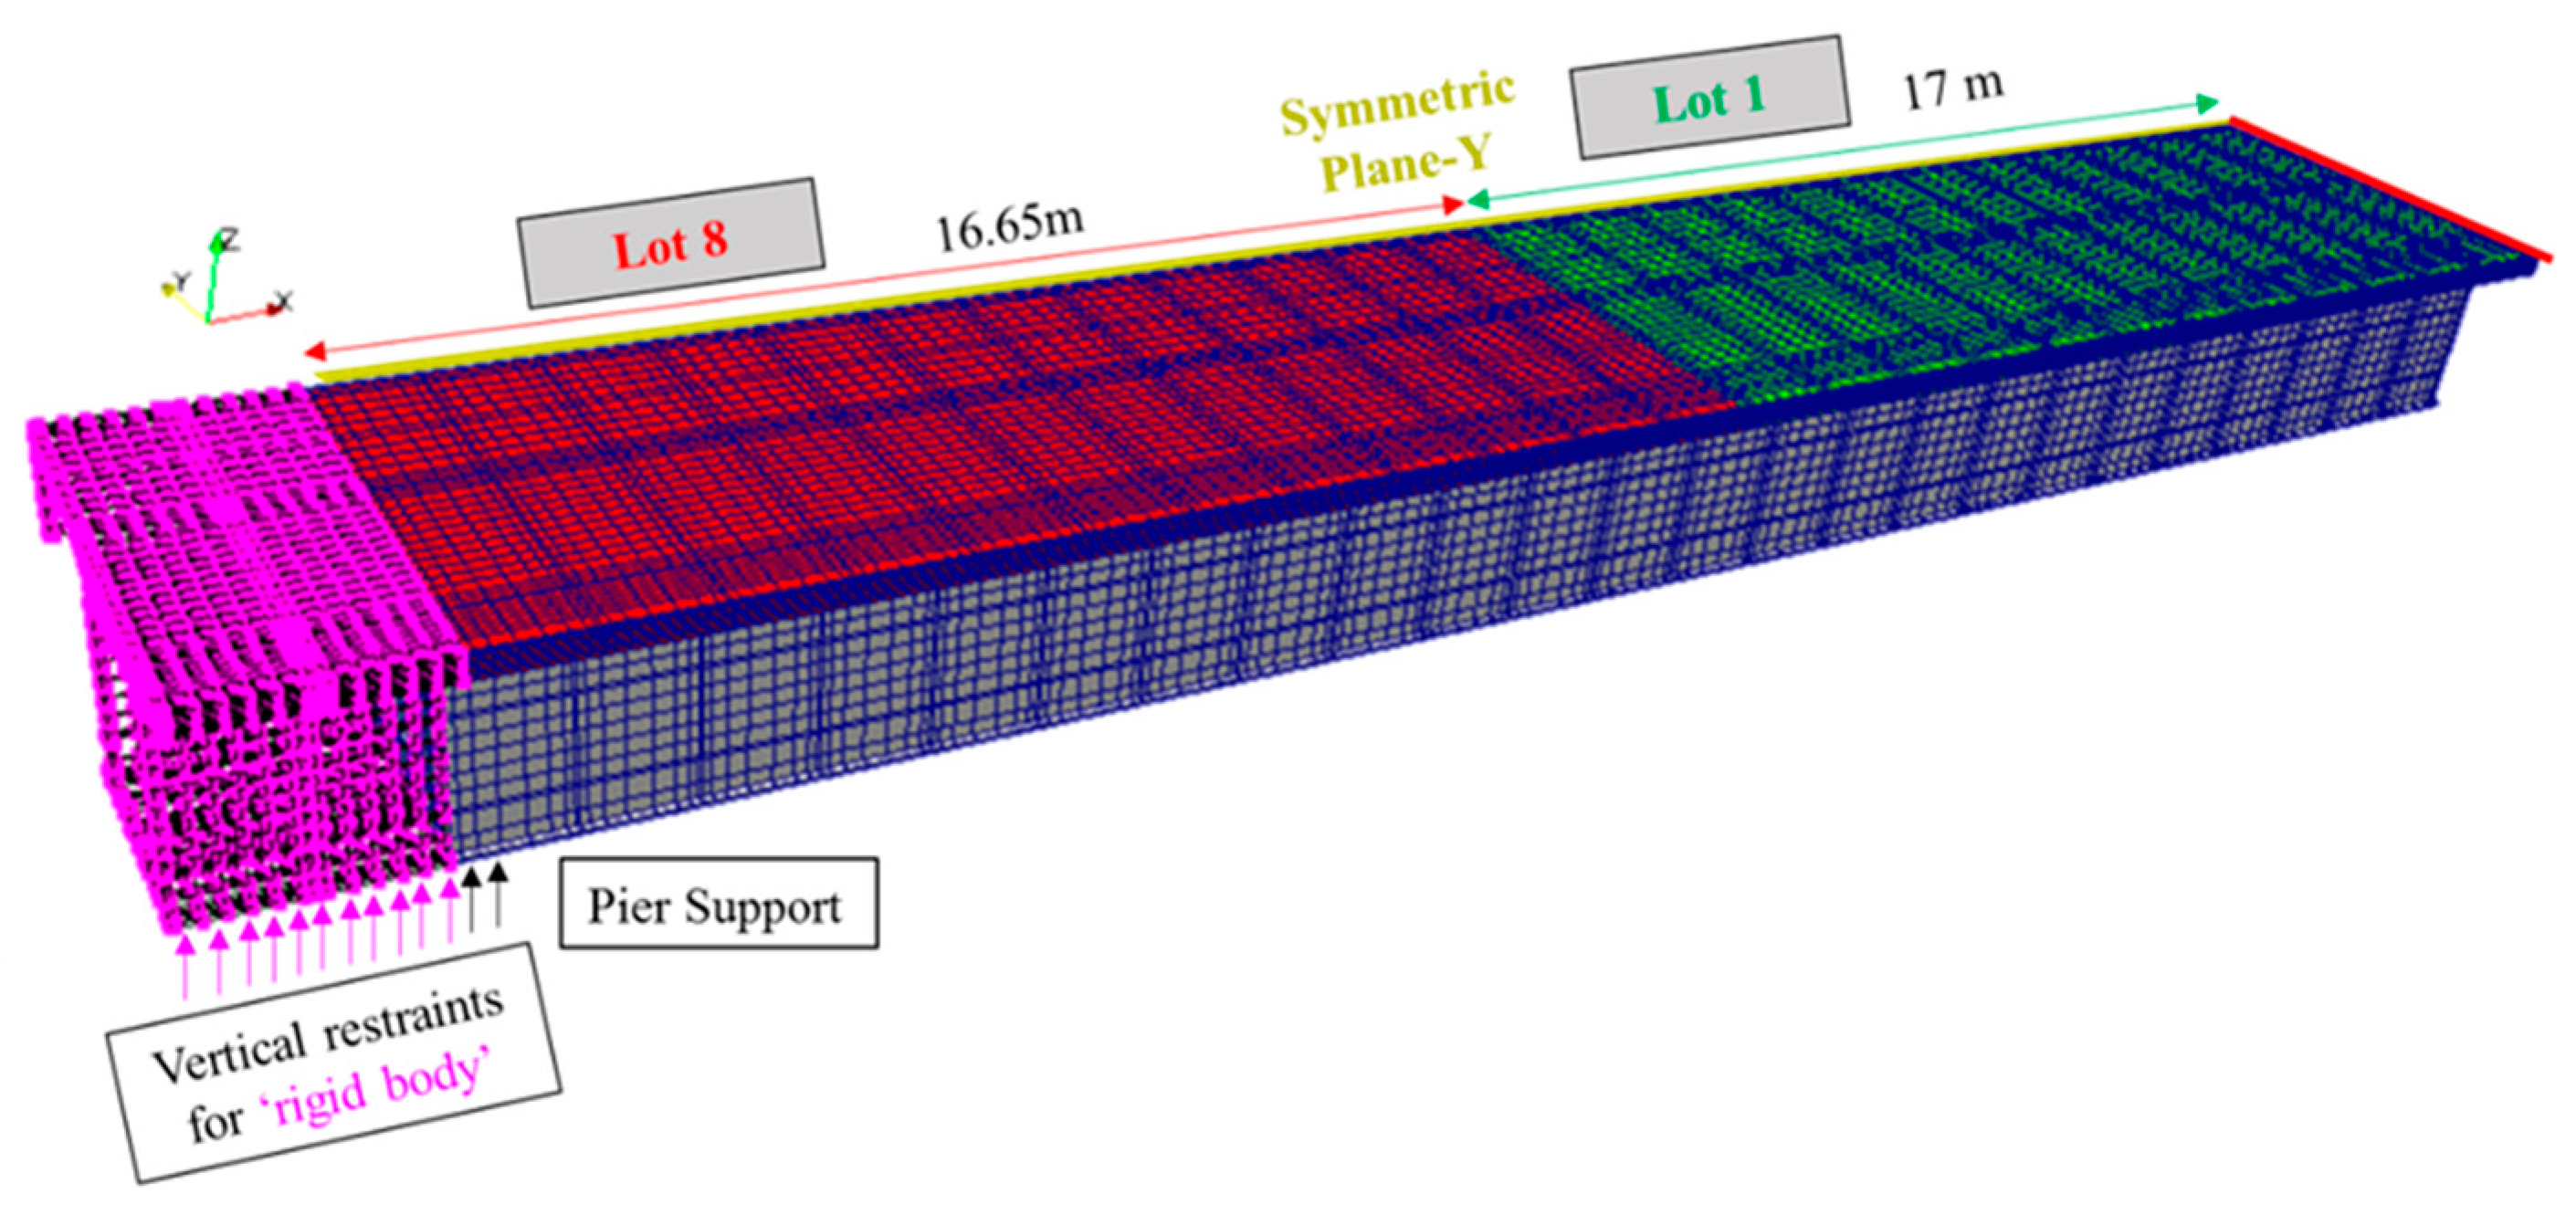
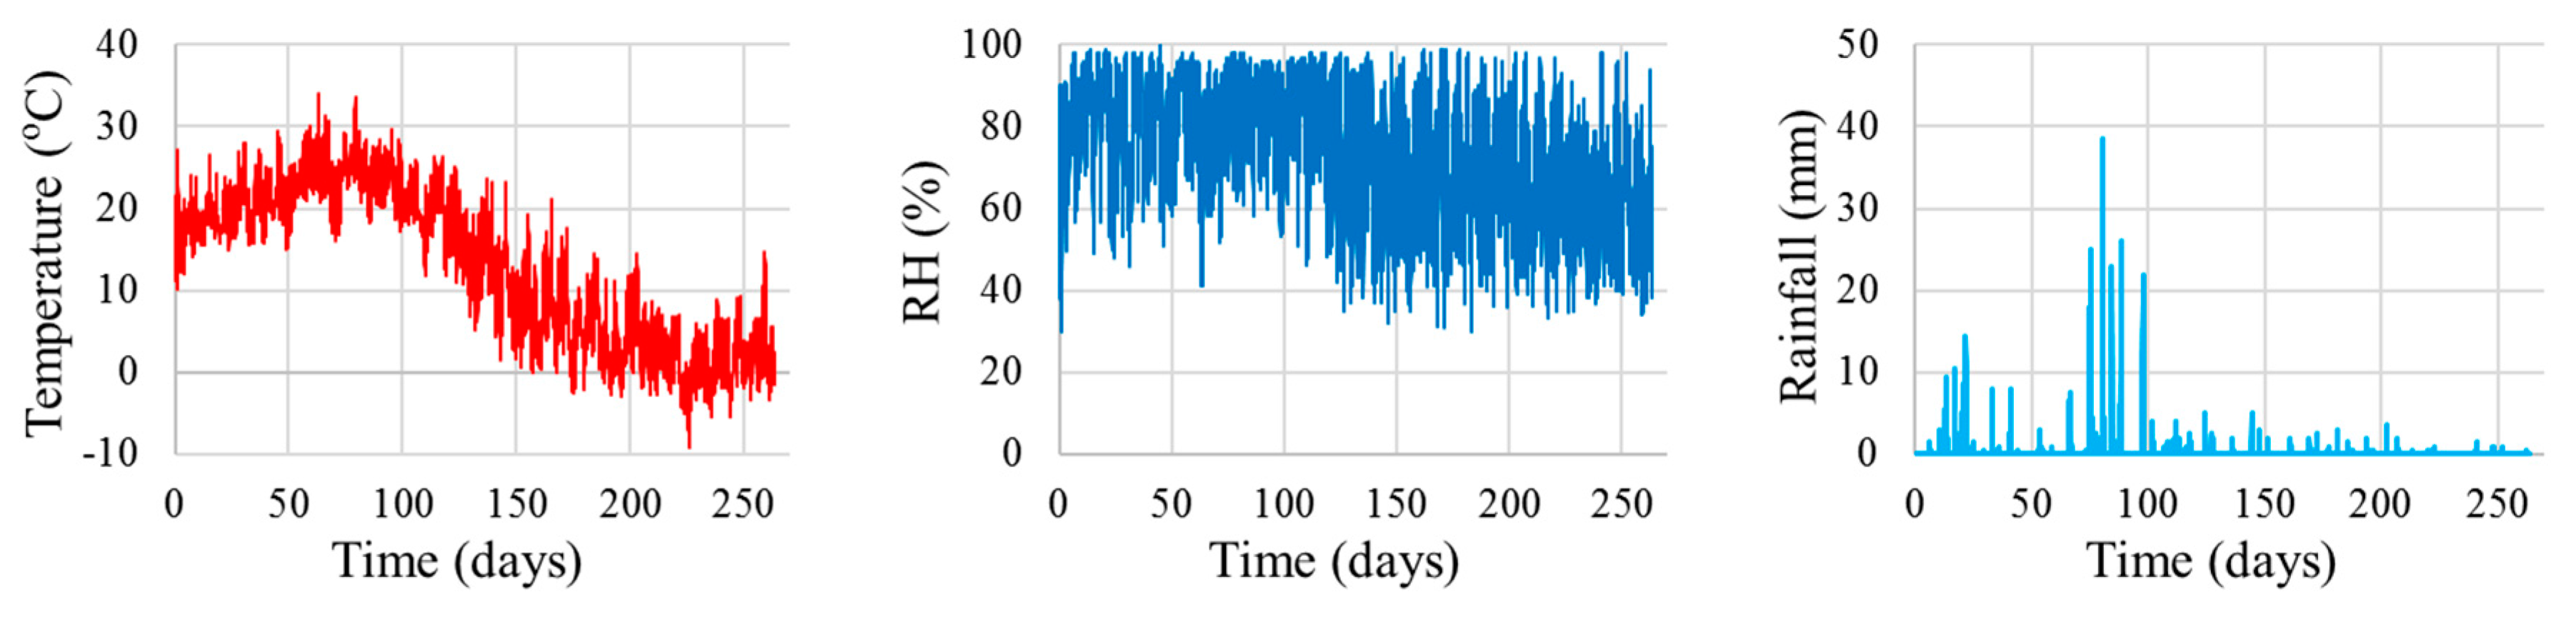
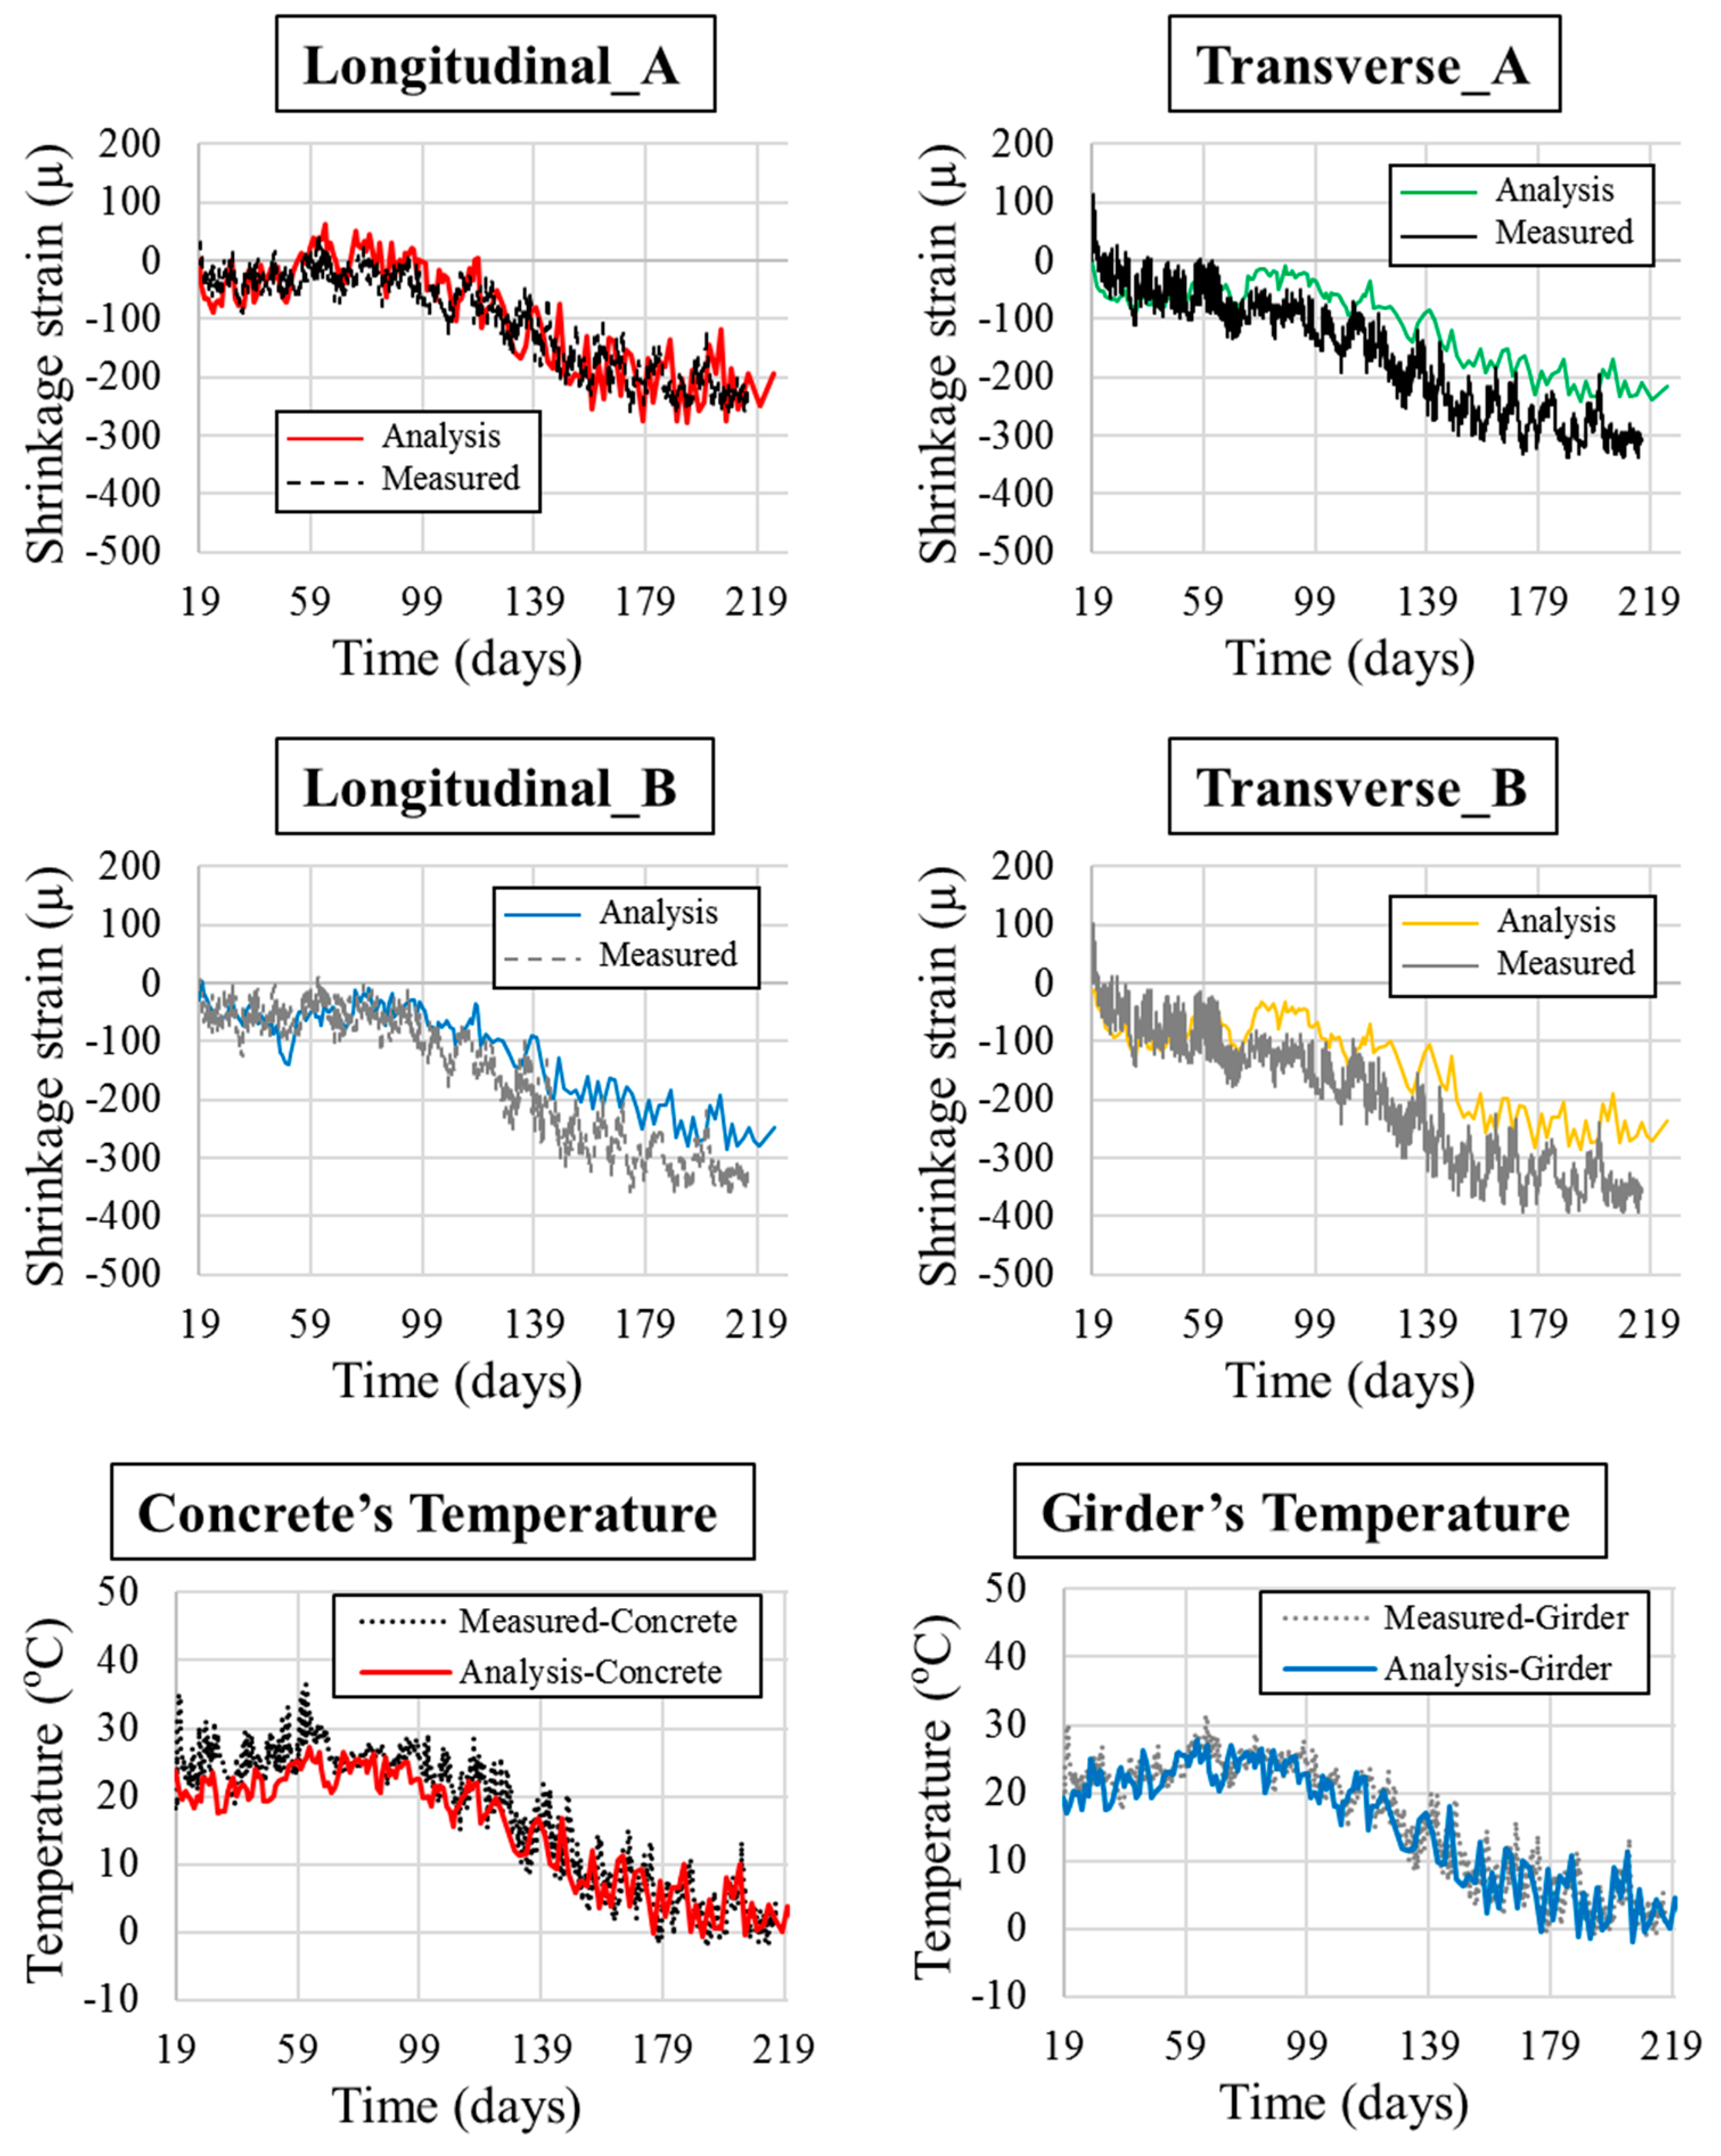
3.5. Post-Construction Analysis on Concrete Deck of Shinkesen Bridge: Verification with on-Site Measured Data

Figure 19 represents the entire overview of the 438-m seven-spanned steel girder–supported bridge. The casting sequence was carried out according to the numbers shown after considering the influence of moment distribution. For long-term monitoring, the strain and temperature gauges were embedded on casting lot 8 over the top of Pier 3 support. The top surface of the concrete underwent wet-curing for approximately 22 days, following by seal-curing for another 7 days before the RC deck was exposed to the ambient environment. Figure 20 illustrates the finite-element model of one-fourth of the Shinkesen Bridge span, which imposes additional elements to consider over the finite-element model mentioned in Section 3.5. To precisely consider the real conditions of the concrete bridge deck, a time delay between Lots 1 and 8 due to the casting sequence was also included in the analysis. To account for the effect of the expansion joint in the finite-element model, the longitudinal restraint at Lot 8 is replaced with a rigid body whose sole aim is to allow slight translational movement, as seen in Figure 20. The nodes on the rigid body were restrained from moving vertically. Insertion of the rigid body was performed at the end of Lot 8 to maintain the symmetric conditions in the bridge span. The reinforcement ratio was cautiously applied as calculated from the structural detail drawings, whereby lot 8 possesses more reinforcing bars in the top section. The environmental data from the beginning of Lot 1 casting were also obtained from the Japan Meteorological agency as portrayed in Figure 21.
Figure 22 shows a comparison between the analytical strain and the measured strain. The definition of initial zero strain in data loggers was approximately 3 h after the casting on Lot 8 at the 19th day. The analytical strain was therefore taken from the start of the 19th day for verification process. It can be observed that the strain progress can be well-traced for both longitudinal and transverse directions inside the concrete. Furthermore, for the concrete temperature, in addition to the good agreement in the overall trend, an underestimation seems to occur during the seal-curing period, whereby the concrete is entirely sealed and cover with formwork. Hence, it is logically reasonable that the measured value is greater than the analytical results because the simulation considers the surface of the concrete to virtually touch the ambient environment. In addition, if attention is given to the girders’ temperature, the computational platform almost exactly matches the data from the temperature gauge. However, the minimal deviation in temperature is of little concern as long as the longitudinal strain, which accounts for the infamous transverse deck cracking observed in most geographical conditions, is considered.

4. Conclusions

To provide a durable concrete infrastructure in severe environmental conditions, a comprehensive experimental and analytical study was conducted on a bridge in the Tohoku region, Shinkesen Bridge. This study focused mainly on the bridge’s early-age performance (i.e., thermal and shrinkage-induced cracks), and extension to long-term durability will be addressed in a future study. First and foremost, on a small scale (decimetres), validation of the multiscale integrated computational system was satisfactory and agreed well with the experimental results. Verification with a medium-scale experimental mock-up slab specimen was then carried out to further confirm the capability of the numerical model, which also presented consistency with the experimental results. In addition, to reduce the calculation effort for large-scale analysis, an element discretisation process was performed in the mock-up slab specimen to determine the appropriate element size. Preliminary parametric studies on different mixture designs suggested the validity of the proposed mix design for Shinkesen Bridge. Finally, after bridge construction was complete, the computational model was again verified with acceptable agreement with data from strain gauges embedded in the concrete deck slab. The conclusions achieved are summarised as follows.
  • The multiscale thermodynamic integrated analysis was verified and validated from the laboratory scale on the order of decimetres up to the structural scale on the order of decametres, which adequately confirms its ability to assess the behaviour of actual structures.
  • By conducting the preliminary analyses before bridge construction, the superiority and inferiority of each mix proportion could be displayed to a great extent, which helped the engineers to be more decisive and confident when designing their mix proportions.
  • Through the success of the study, the multi-scale thermodynamic computational platform would be implemented for long-term performance study by tracing the behavior of concrete through the course of time to propose maintenance plan abiding with preventive maintenance strategy currently endorsed in Japanese civil engineering situation.

Acknowledgments

This study was financially supported by the Council for Science, Technology and Innovation, “Cross-ministerial Strategic Innovation Promotion Program (SIP), Infrastructure Maintenance, Renovation and Management” through a grant by Japan Science and Technology Agency (JST).

Author Contributions

Tetsuya Ishida and Yasushi Tanaka conceived and designed the analytical and experimental scheme; Tetsuya Ishida and Yasushi Tanaka supervised over the analytical process, Kosuke Kashimura and Ichiro Iwaki performed the experiments; Kolneath Pen analyzed the data; Tetsuya Ishida and Kolneath Pen wrote the paper.

Conflicts of Interest

The authors declare no conflict of interest.

References

  1. Tanaka, Y.; Ishida, T.; Iwaki, I.; Sato, K. Multiple protection design for durable concrete bridge deck in cold regions. JSCE 2017, 5, 68–77. [Google Scholar] [CrossRef]
  2. Faria, R.; Azenha, M.; Figueiras, J.A. Modelling of concrete at early ages: Application to an externally restrained slab. Cem. Concr. Compos. 2006, 28, 572–585. [Google Scholar] [CrossRef]
  3. Jendele, L.; Smilauer, V.; Cervenka, J. Multiscale hydro-thermo-mechanical model for early-age and mature concrete structures. Adv. Eng. Softw. 2014, 72, 134–146. [Google Scholar] [CrossRef]
  4. Maekawa, K.; Ishida, T.; Kishi, T. Multi-Scale Modeling of Structural Concrete, 1st ed.; Taylor & Francis: New York, NY, USA, 2009; ISBN 978-0-415-46554-0. [Google Scholar]
  5. Maekawa, K.; Okamura, H.; Pimanmas, A. Non-Linear Mechanics of Reinforced Concrete; Spon Press: London, UK, 2003; ISBN 978-0-415-27126-4. [Google Scholar]
  6. Maekawa, K.; Ishida, T.; Kishi, T. Multi-scale Modeling of Concrete Performance—Integrated Material and Structural Mechanics. J. Adv. Concr. Technol. 2003, 1, 91–126. [Google Scholar] [CrossRef]
  7. Luan, Y.; Ishida, T. Enhanced shrinkage model based on early age hydration and moisture status in pore structure. J. Adv. Concr. Technol. 2013, 11, 360–373. [Google Scholar] [CrossRef]
  8. Biot, M.A. General Theory of three-dimensional consolidation. J. Appl. Phys. 1941, 12, 155–164. [Google Scholar] [CrossRef]
  9. Gebreyouhannes, E.; Yoneda, T.; Ishida, T.; Maekawa, K. Multi-scale based simulation of shear critical reinforced concrete beams subjected to drying. J. Adv. Concr. Technol. 2014, 12, 363–377. [Google Scholar] [CrossRef]
  10. Hussain, S.E. Effect of microsilica and blast furnace slag on pore solution composition and alkali-silica reaction. Cem. Concr. Compos. 1991, 13, 219–225. [Google Scholar] [CrossRef]
  11. Dhir, R.K.; El-Mohr, M.A.K.; Dyer, T.D. Chloride binding in GGBS concrete. Cem. Concr. Res. 1996, 26, 1767–1773. [Google Scholar] [CrossRef]
  12. Mehta, P.K.; Monteiro, P.J.M. Concrete: Microstructure, Properties, and Materials, 3rd ed.; McGraw-Hill: New York, NY, USA, 2006; ISBN 978-0-07-158919-2. [Google Scholar]
  13. Iqbal, P.O.; Ishida, T. Modeling of chloride transport coupled with enhanced moisture conductivity in concrete exposed to marine environment. Cem. Concr. Res. 2009, 39, 329–339. [Google Scholar] [CrossRef]
  14. Ishida, T.; Luan, Y.; Sagawa, T.; Nawa, T. Modeling of early age behavior of blast furnace slag concrete based on micro-physical properties. Cem. Concr. Res. 2009, 41, 1357–1367. [Google Scholar] [CrossRef]
  15. Collepardi, M.; Borsoi, A.; Collepardi, S.; Olagot, J.J.O.; Troli, R. Effects of shrinkage reducing admixture in shrinkage compensating concrete under non-wet curing conditions. Cem. Concr. Res. 2005, 27, 704–708. [Google Scholar] [CrossRef]
  16. JSCE. Standard Specification for Concrete Structures—2007; JSCE: Tokyo, Japan, 2010; ISBN 978-4-8106-0752-9. [Google Scholar]
Figure 1. Multiscale and multi-physical modelling to simulate time-dependent concrete performance.
Applsci 08 00394 g001
Figure 2. Multiscale and multi-physical modelling to simulate time-dependent deformation and cracking.
Applsci 08 00394 g002
Figure 3. (a) Finite-element (FE) model of one fourth of the specimen; (b) environmental condition.
Applsci 08 00394 g003
Figure 4. (a) Specimens with direct rainfall exposure; (b) shaded specimens.
Applsci 08 00394 g004
Figure 5. Mass change of each series (M-Measured & A-Analytical).
Applsci 08 00394 g005
Figure 6. Concrete shrinkage strain of OPC45.
Applsci 08 00394 g006
Figure 7. Concrete shrinkage strain of OPC55.
Applsci 08 00394 g007
Figure 8. Environmental condition after 28 days of seal-curing.
Applsci 08 00394 g008
Figure 9. Compressive strength of concrete (M-Measured and A-Analytical).
Applsci 08 00394 g009
Figure 10. FE model of one-eighth of the 400 × 400 × 200 mm3 prismatic specimen.
Applsci 08 00394 g010
Figure 11. Concrete shrinkage strain in 100 × 100 × 400 mm3 specimens (M-Measured and A-Analytical).
Applsci 08 00394 g011
Figure 12. FE model of one fourth of the specimen.
Applsci 08 00394 g012
Figure 13. Concrete shrinkage strain in 400 × 400 × 200 mm3 RC specimens (M-Measured and A-Analytical).
Applsci 08 00394 g013
Figure 14. (a) Overview of mock-up slab specimen; (b) FE model of half of the mock-up specimen.
Applsci 08 00394 g014
Figure 15. Environmental conditions.
Applsci 08 00394 g015
Figure 16. Concrete shrinkage strain at corresponding gauges and concrete temperatures. * ① to ⑧ represent different locations of strain gages; I, II, III, IV represent the four finite element analytical models.
Applsci 08 00394 g016
Figure 17. FE model of one-fourth of a bridge span.
Applsci 08 00394 g017aApplsci 08 00394 g017b
Figure 18. Parametric study focusing on four different aspects. * εmax = maximum longitudinal strain; wmax = maximum crack width.
Applsci 08 00394 g018
Figure 19. Overview of Shinkesen Bridge and the casting sequence (Red circle = Gauge location).
Applsci 08 00394 g019
Figure 20. FE model of one-fourth of the span of Shinkesen Bridge.
Applsci 08 00394 g020
Figure 21. Environmental condition of Shinkesen Bridge after Lot 1 casted up to 250 days.
Applsci 08 00394 g021
Figure 22. Concrete shrinkage strain at corresponding gauges and temperature of Shinkesen Bridge.
Applsci 08 00394 g022
Table 1. Mix proportion of 200 × 200 × 800 mm3 prismatic specimens and curing condition.
Seriesw/b (%)Air (%)Unit Content (kg/m3)Seal-Cured
WCExSG
OPC55554.5172313-8349977 days
OPC45456164338207919927 days
Note: w/b = water-to-binder ratio; W = Water; C = Cement; Ex = Expansive additives; S = Sand; G = Gravels.
Table 2. Trial mixture designs of potential concrete to be used for Shinkesen Bridge deck.
Seriesw/b (%)Air (%)Unit Proportion (kg/m3)
WCExSGAd
OPC5352.94.5166314-80210443.14
OPC444461643532065311122.24
BFS444461603442066211122.18
Table 3. Mixture designs used for parametric study.
Seriesw/b (%)Air (%)Unit Proportion (kg/m3)
WCExSGAd
OPC55554.5170310-80210443.14
BFS55554.5170310-80210443.14
OPC42426153364-65311122.24
BFS42426153364-66211122.18
BFS42-EX4261533642066211122.18

