A Study on the Influence of Stage Load on Health Monitoring of Axial Concrete Members Using Piezoelectric Based Smart Aggregate


Shenzhen Graduate School, Harbin Institute of Technology, Shenzhen 518055, China
*
Author to whom correspondence should be addressed.
Appl. Sci. 2018, 8(3), 423; https://doi.org/10.3390/app8030423
Submission received: 7 February 2018
/
Revised: 4 March 2018
/
Accepted: 9 March 2018
/
Published: 12 March 2018
(This article belongs to the Section Mechanical Engineering)
Abstract
:Featured Application
Piezoelectric based smart aggregate can be widely used in structural health monitoring.
Abstract
Piezoceramic based smart aggregate (SA) has been employed to monitor the strength development of early age concrete. The validity of SA-based active sensing method was tested and verified with loading and unloading conditions. However, the early age concrete in buildings is subjected to many load increments during the construction process. The influence of incremental load on the properties of the propagating waves is still unclear. This study aims to investigate the effects of axial stage loads on the signal response of the SA. The concrete specimens that are embedded with SA’s were loaded step by step, and the amplitude and wave velocity of the sensing signals were measured at each stress state. The experimental results indicated that the amplitude of the received signal decrease with the increase of the stress level. As for the velocity of the propagated stress wave, however, the velocity shows an increasing trend before a sharp decline at high stress level.
1. Introduction
Nowadays, the use of experimental techniques for monitoring the development of microstructure, durability, and mechanical properties of cement-based materials, such as impedance spectroscopy [1,2,3] and electrical resistivity [4,5], has become very popular. In that way, structural health monitoring (SHM) technology based on piezoelectric materials has been widely applied to concrete structures [6,7]. Among them, piezoceramic based smart aggregate has been developed rapidly since being proposed and introduced by Song [8]. Some researchers investigated on the potential usage of smart aggregate (SA’s) in SHM through laboratory tests. Some adopted SA based monitoring system to monitor early-age concrete strength by recording and analyzing the amplitude development of the response signals [9,10,11,12]. Liu et al. [13] and Zou et al. [14,15] studied the utilization of SA in water seepage monitoring in concrete. Gu et al. [16] and Moslehy et al. [17] conducted research on the situation of real-time damage detection of a circular reinforced concrete column under seismic and cyclic load, respectively. The results demonstrated that the piezoelectric based SA transducer is capable of monitoring the damage induced by different kinds of loads.
The researches mentioned above emphasized on the monitoring of the change in concrete materials caused by cement hydration, water content, or damage, and discussions on the influence of stress state and history experienced in monitoring process on the sensing signals are rare. According to Lillamand et al. [18], the existence of compressive stress lead to the change of ultrasonic velocity, which resulted in a change of 1.96 percent under compressive stress with magnitude of 16 MPa. It can be reasonably deduced that, even though there are no obvious damage for concrete at elastic phase, the velocities and amplitudes of monitoring signals under different stress states are not the same, and it affects the accuracy and effectiveness of evaluation indexes of the monitoring system. Some researchers noted that there exist a great deal of influencing factors in in-situ monitoring, like temperature and loading conditions, which may result in considerable impacts during the monitoring stage [19,20,21,22,23,24,25,26]. Specifically, the construction load has not been taken into consideration during early age concrete monitoring process. Especially, for the important columns downstairs, there are a lot of load increments in the construction process of a high-rise building [27]. The question whether the construction load brings in negligible impact on the monitoring results of SA’s is not fully discussed.
This paper aims to investigate the effects of staged stress on the monitoring signals. The test results demonstrate that the amplitude of sensing signal varies obviously under incremental stress, even in elastic stage. Besides, the wave velocity propagating in concrete is highly stress-dependent, which can be potentially employed as an index to evaluate the stress state in concrete structures.
2. The Principle of Active Monitoring
Figure 1a shows the smart aggregate employed in the proposed monitoring system, which was innovatively introduced by Song [8]. SA’s are generally utilized in pairs in SHM practice. According to the direct and inverse piezoelectric effect of inner piezoelectric patch, one SA works as a sensor and the other works as an actuator among the pair of SA’s, which constitute a representative function unit.
As shown in Figure 1b, the monitoring system consists of a signal generator, a power amplifier, an oscilloscope, and the function unit in concrete. Harmonic voltage and plus voltage signals generated by signal generator are applied to the actuator after magnified by the power amplifier. Then, electric signals are transformed into vibration signals in the SA actuator with the inverse piezoelectric effect. Subsequently, the vibration signals propagate in the concrete in the form of stress wave until they are captured by the other SA. As a result of direct piezoelectric effect, vibration signals are transferred into electric signals by the sensor, and finally, the electric signals are displayed and recorded by the oscilloscope. The monitoring method relies on wave propagation theory [28]. By analyzing the response signals, the condition of the material along the propagation path can be diagnosed.
3. Experimental Investigation
3.1. Concrete Mix Design and Specimens
The concrete compositions are shown in Table 1. Commercial concrete supplied by Shenzhen Antuoshan Concrete Co. Ltd. (Shenzhen, China) is employed to fabricate the testing specimens, i.e., two concrete columns (C1 and C2), with the dimension of 100 mm × 100 mm × 400 mm. A pair of SA’s was embedded in designed locations of the concrete specimen when being fabricated (Figure 2). Besides, 15 cubic specimens with dimension of 100 mm × 100 mm × 100 mm were cast to measure the concrete compressive strength development versus time (Table 2).
3.2. Test Method
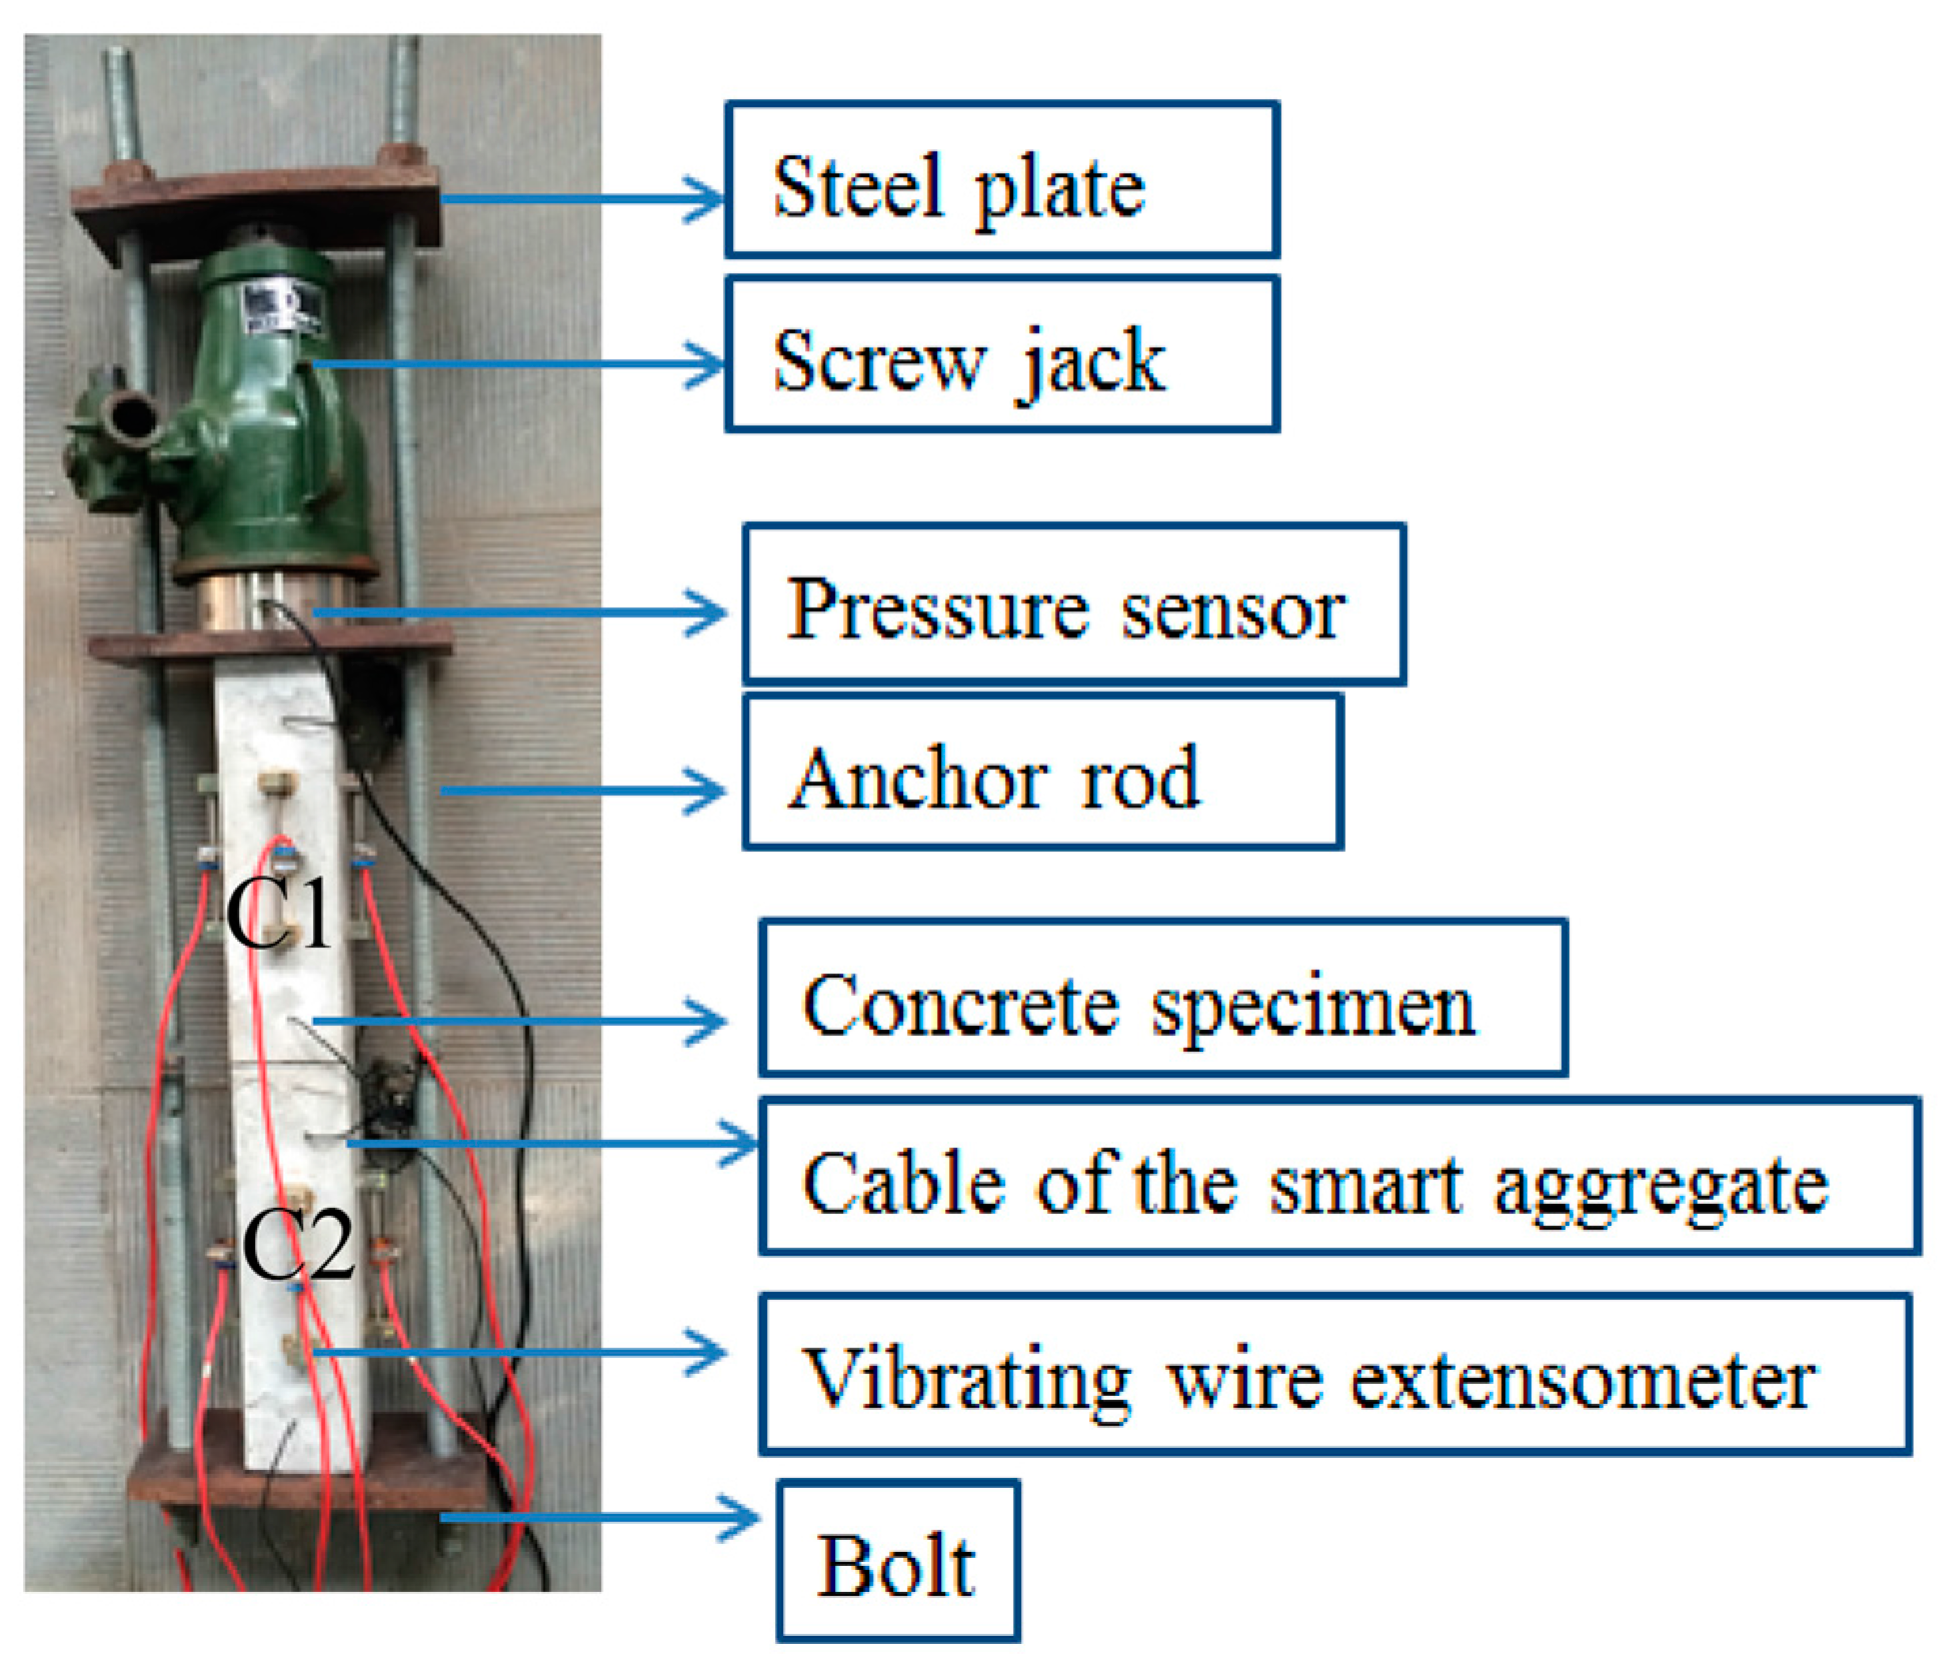
Figure 3 illustrates the loading devices. A screw jack with a maximum capacity of 500 kN was used to load the testing objects. A pressure sensor was employed to monitor the value of the applied load. C1 and C2 were superposed and subjected to stage loads. The ultimate strength of the prism (σmax) is approximately 0.78 times of the cubic compressive strength, i.e., 45.24 MPa [29,30]. The step load (6 kN) was first applied on the sixth day and applied at an interval of five days afterwards until the stress reaching 27 MPa, which equals to around 0.6σmax (Figure 4). That is to say, the load at each step was kept constant for five days. The baseline of the signal was collected before loading (zero stress state). Then, the aforementioned active monitoring procedures were performed state and at the day after loaded (ensuring mechanical state of the system kept steady) for each step load case. 60 kHz and 100 kHz harmonic voltage signals with amplitude of 10 V were used to activate the SA to obtain the amplitude information, and pulse drive signals with 5 μs plus width and voltage amplitude of 10 V were used to capture the velocity of stress wave.
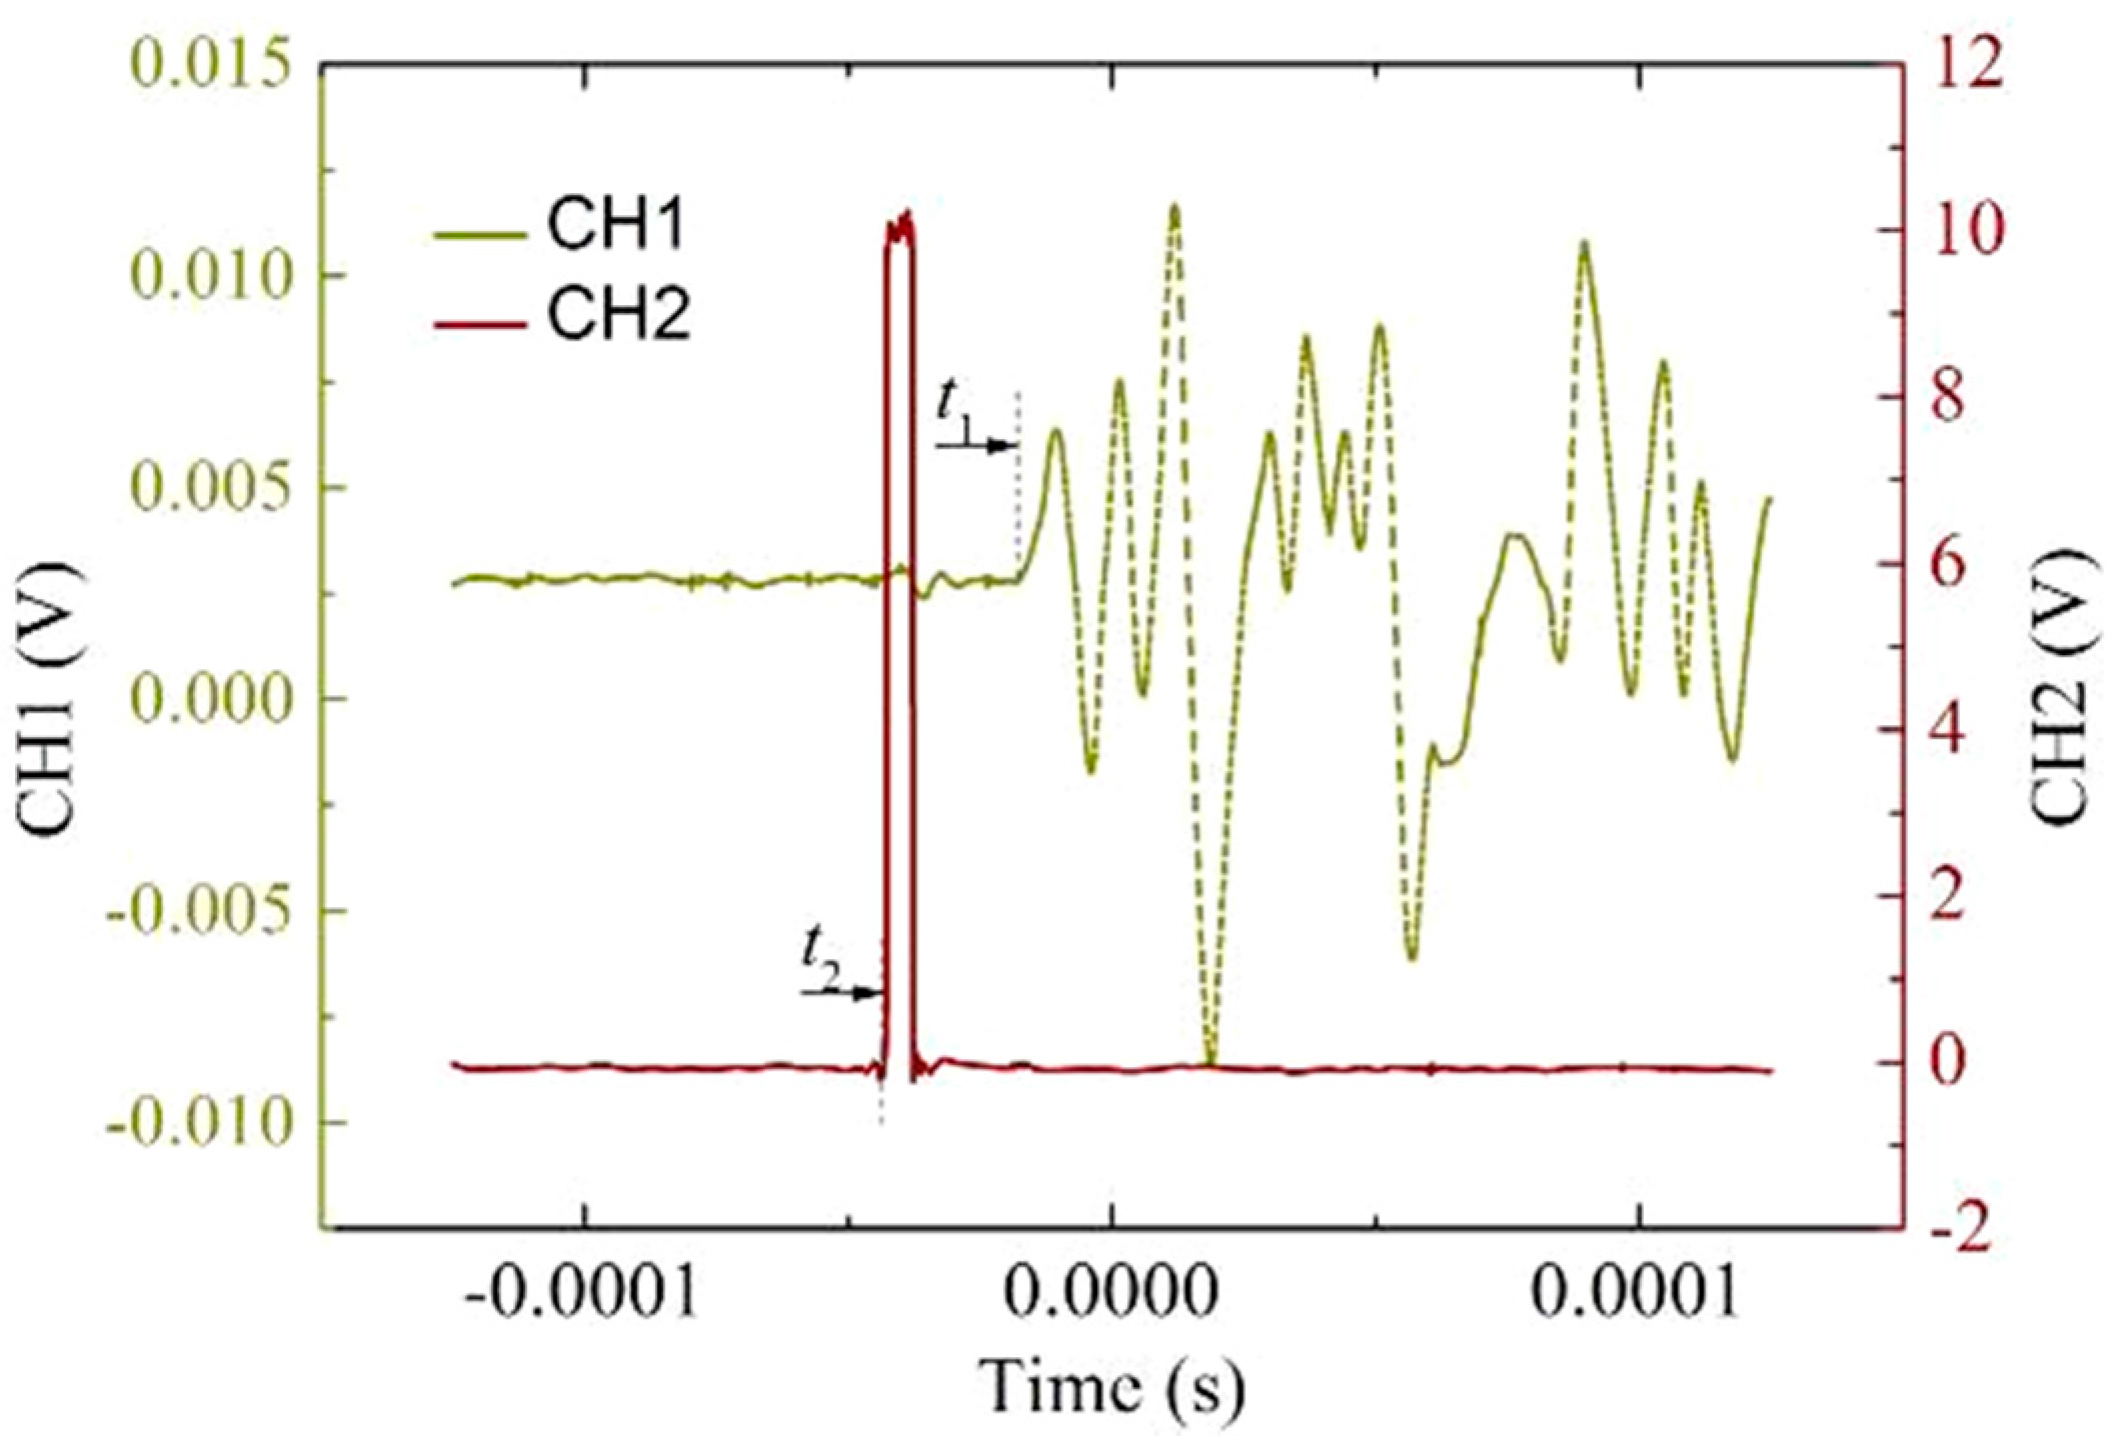
The selection of the frequency bandwidth was determined through test, which was consistent with that of previous research by Song on damage detection and concrete strength development monitoring [31]. It should be noted that the recorded signals (Figure 5) were dealt with adaptive threshold method in MATLAB to get rid of environmental noise [32]. Then the treated signal is further fitted as a sine function (see Equation (1)), and the parameter A is the amplitude of the signal. For velocity, the first arrival time method was used to determine the velocity of stress wave (Figure 6) [22] (see Equation (2)). Additionally, it is worth to mention that this test was carried out in HYHW-12A type walk-in chamber, in which the temperature and relative humidity was kept constant, with 20 °C and 60%, respectively.
4. Results and Discussion
4.1. Amplitude Analysis
Figure 7 illustrates the amplitudes of received signals with different frequencies (60 kHz and 100 kHz). It is noticeable that the stage stress has a considerable influence on the amplitude of sensing signals for both frequencies. The amplitudes change non-monotonically with incremental stress. The amplitudes of response signals first decrease sharply for early steps of load, and then vary irregularly. It can be seen that a critical point occurred at a stress level of about 0.3σmax, where a sudden drop occurs to the amplitudes. An explanation is that apparent damage occurs after 0.3σmax. On the whole, the development of amplitudes of the stress wave versus incremental load showed a downward trend. According to previous research of Gu [9] and Equation (3) [9], provided that concrete is homogeneous material; the amplitude would decrease monotonously with the development of concrete strength and elastic modulus in unloaded state. This can be verified by Figure 8, which illustrates the elastic modulus development versus stress. It should be noted that elastic modulus after 18 MPa was not obtainable, since that plastic characteristic started to appear. Further, the elastic modulus values are only approximate values, which was obtained by non-standard test method. Noteworthy is the fact that concrete is a kind of heterogeneous material, especially in the hydration process. From the monitoring results, it can be seen that the effect of load on micro-crack propagation is quite evident in the early age of concrete. The amplitude of the harmonic stress wave can be expressed as
where A, E, ρ, w, and I are the harmonic amplitude of stress waves, elastic modulus, density of concrete, the average power of the harmonic response over a period, and angular frequency, respectively.
The intrinsic characteristics of concrete can account for this phenomenon. From the microcosmic view, concrete is a kind of nonhomogeneous material, normally comprised of mortar, aggregate, and interfacial transition zone (ITZ). While with the increase of the stress, the micro-cracks in ITZ began to develop, leading to the drop of the amplitude. It should be pointed out that concrete is a heterogeneous material, and there exist initial defects in different concrete specimens, which also bringing in some development difference among wave amplitudes. Additionally, it is difficult to make sure the specimens completely axially compressed. As concrete is a brittle material, if some part of the specimen is in tension, the test results may deviate. Last but not least, when the measurement was performed, it can happen that a random noise signal interferes with the target signals. To conclude, although the amplitude results fluctuate locally, the general trend is consistent. For instance, with regard to C1, the deviation of the amplitude in 100 kHz can happen. Furthermore, for the health monitoring of practical engineering structures, the variation of amplitudes may result from change of the bearing load rather than damage in concrete.
4.2. Velocity Analysis
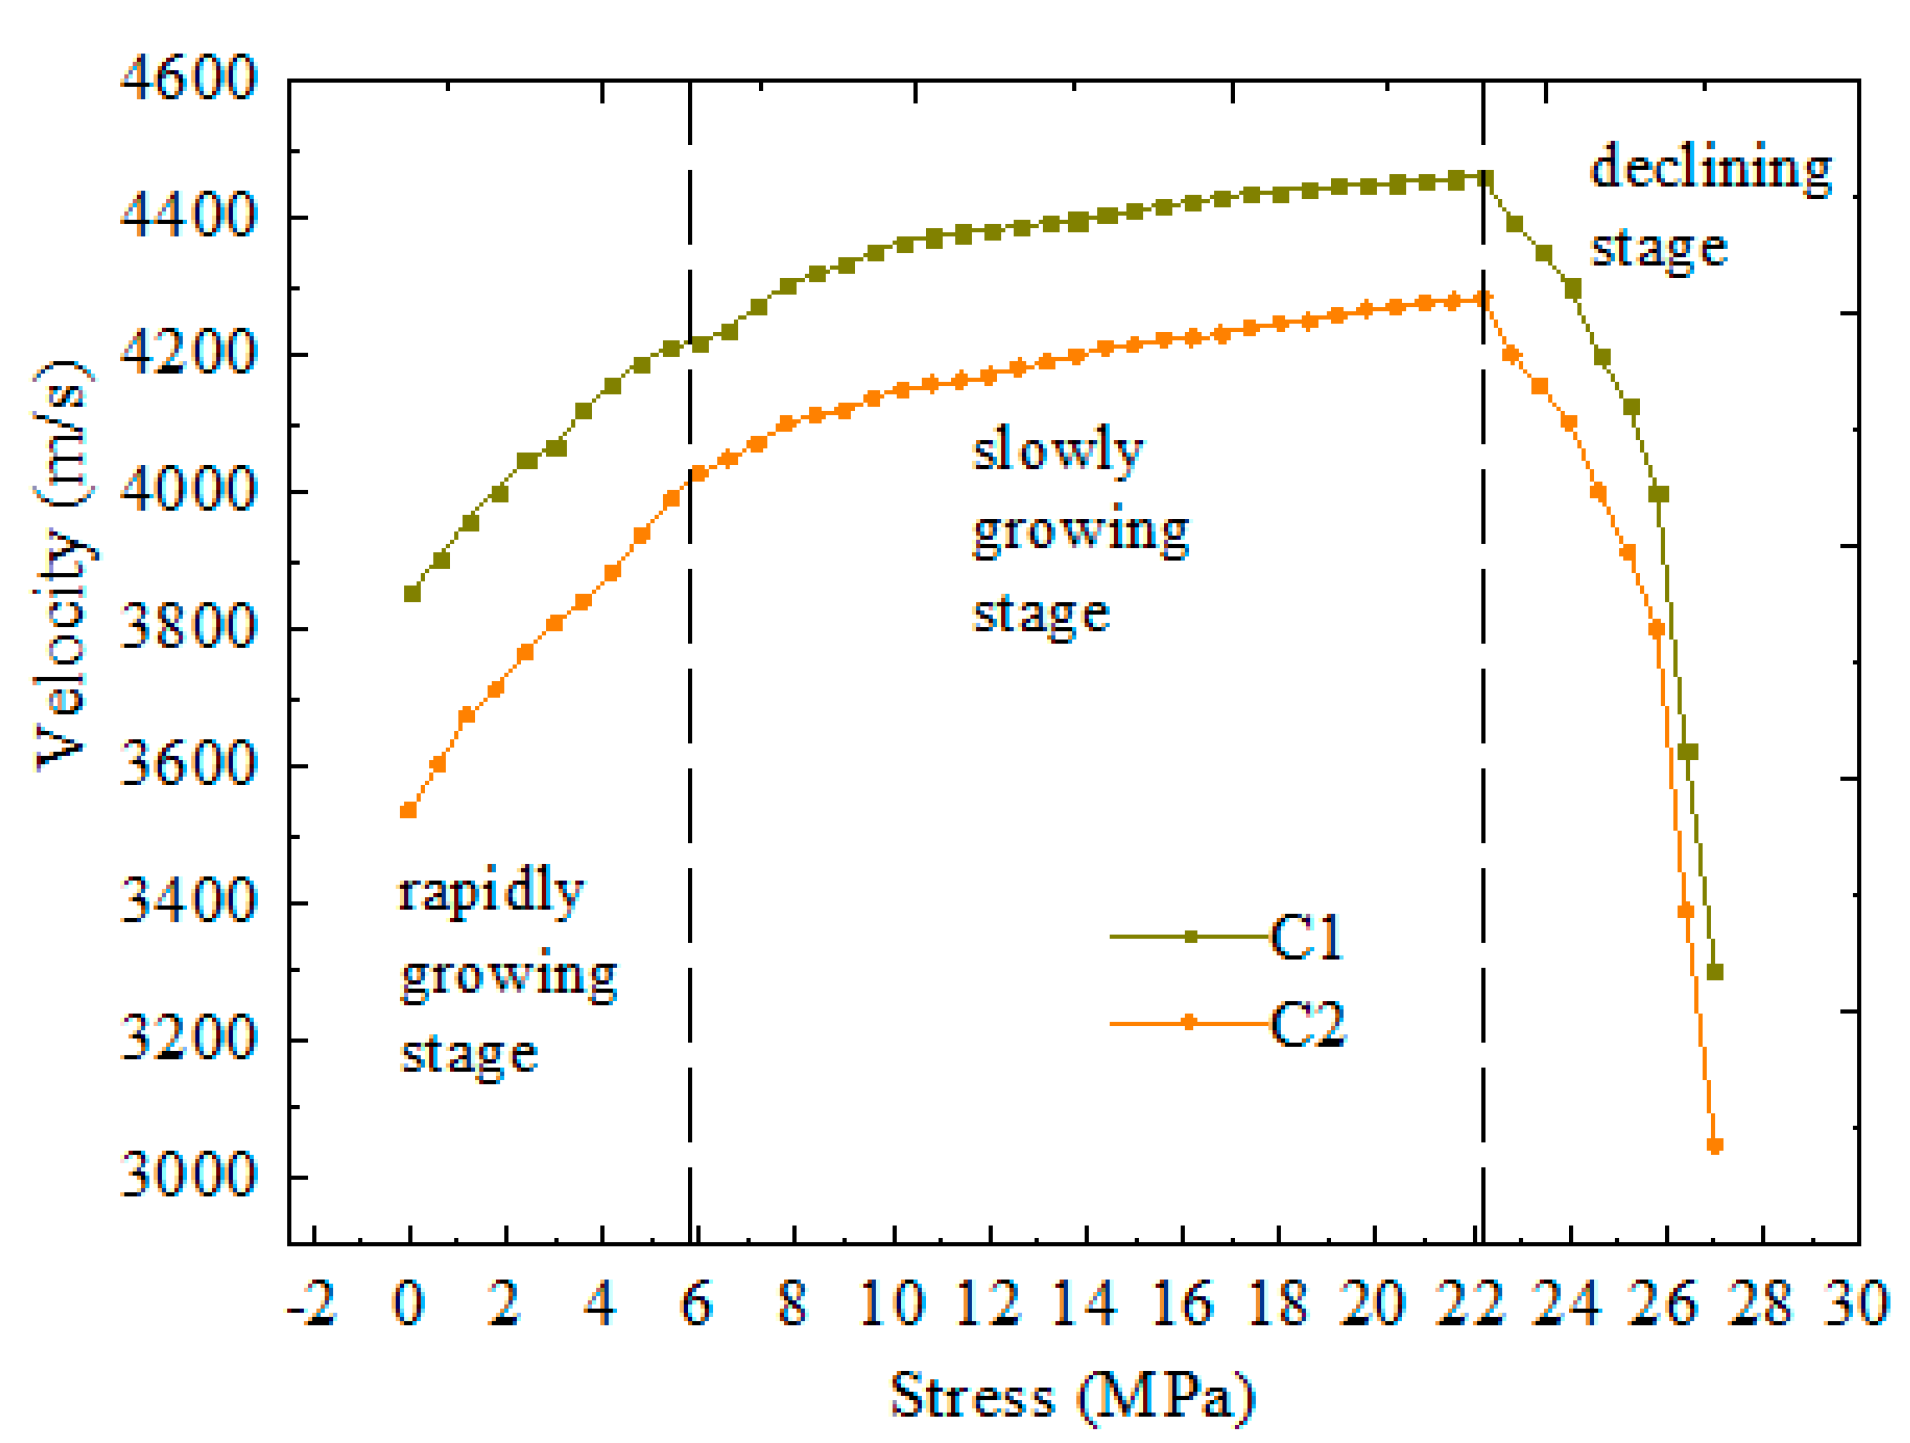
Figure 9 shows the wave velocities obtained at each stress state, which is another parameter reflecting the mechanical state of concrete between two SA’s. It is evident that the entire curve can be divided into three stages.
The first stage is rapidly growing stage (concrete age is before 36 days), in which the velocities rise from 3854 m/s (C1) and 3535 m/s (C2) sharply at early loading steps below 6 MPa stress state. In this stage, concrete is in its early age, when the cement hydration reaction takes place severely. It is obvious that the elastic modulus of concrete develops rapidly in the early-age and this leads to an increase in the velocity with the growth of elastic modulus, according to Equation (4) [33]. On the other hand, when the concrete is subjected to a step load, it undergoes elastic shortening and the subsequent creep strain. In this process, some of the pores or micro cracks perpendicular to step load are close, and the concrete becomes more compact, which is equivalent to the increase of modulus elasticity of concrete [18]. It can be concluded that both cement hydration and applied step load result in an increase in wave velocity, and this explains the reason of why the growth rate of velocity in first stage is larger than that of in second stage. The velocity is a function of elastic modulus, density, and Possion’s ratio in the following form
where Vp, E, ρ, and v are the velocity of stress waves, elastic modulus, density, and Possion’s ratio of concrete, respectively.
The second stage is called slowly growing stage (concrete age is among 36 and 180 days), in which the elastic modulus approaches to near stability and the wave velocities are almost linearly proportional to the stress values with a relative small gradient until peaking at 4462 m/s (C1) and 4285 m/s (C2) with approximate half of the peak stress value. At this stage, the influence of cement hydration on monitoring signals is negligible, and linearly increment in wave velocity mainly dependents on load variation. It demonstrates that, for mature concrete, wave velocity can be employed as an index to evaluate the compressive stress level of concrete, which undergoes monotonic incremental uniaxial loads in elastic phase.
Followed by the third stage, i.e., declining stage (concrete age is after 180 days), in which the wave velocities drop sharply to 3305 m/s (C1) and 3046 m/s (C2), which are smaller than the initial values. In this phase, the micro cracks in ITZ develop rapidly and some obvious damage occurs, which causes a sharp decrease of velocity for the wave transferring in concrete.
5. Conclusions
This paper presents a study on the performance of smart aggregate under step by step stress. The proposed monitoring system was performed under stress increments and the sensing results of amplitude and wave velocity development with incremental stress were discussed. The conclusions can be summarized as follows:
- Wave velocity shows an increasing trend before a sharp decline at high stress level. It is possible to use wave velocity for stress evaluation of concrete structures that are subjected to monotonic axial compressive load in elastic phase.
- The influence of step load on amplitudes of sensing signals is not monotonous. Although previous study recommend that the amplitude of signals can be taken as an index to describe the strength development of early age concrete, this method may be invalid in in-situ monitoring strength development of early age concrete in columns of lower floors during construction stage.
- For further research, tests with more concrete mixtures and larger amounts and scales of specimens need to be conducted.
Acknowledgments
This work was supported in part by the National Science Foundation of China (NO. 51678200 and NO. 51678205), and in part by Guangdong Provincial Natural Science Foundation of China (No. 2017A030313259), National Nature Science Foundation of China (No. 51308322), Shenzhen Overseas Talents Innovation and Entrepreneurship Special Fund (No. KQCX20150324094653260) and Program of Shenzhen Science and Technology Plan (No. JCYJ20170307150200952).
Author Contributions
Tiejun Liu and Dujian Zou conceived and designed the experiments; Chengcheng Du performed the experiments, analyzed the data and wrote the paper; Dujian Zou and Weijie Li revised the paper.
Conflicts of Interest
The authors declare no conflict of interest.
References
- Cabeza, M.; Merino, P.; Nóvoa, X.R.; Sánchez, I. Electrical effects generated by mechanical loading of hardened Portland cement paste. Cem. Concr. Compos. 2003, 25, 351–356. [Google Scholar] [CrossRef]
- Díaz, B.; Nóvoa, X.R.; Pérez, M.C. Study of the chloride diffusion in mortar: A new method of determining diffusion coefficients based on impedance measurements. Cem. Concr. Compos. 2006, 28, 237–245. [Google Scholar] [CrossRef]
- Sánchez, I.; Antón, C.; de Vera, G.; Ortega, J.M.; Climent, M.A. Moisture Distribution in Partially Saturated Concrete Studied by Impedance Spectroscopy. J. Nondestruct. Eval. 2013, 32, 362–371. [Google Scholar] [CrossRef] [Green Version]
- International Union of Laboratories and Experts in Construction Materials, Systems and Structures (RILEM). RILEM Report 40 Non-Destructive Evaluation of the Penetrability and Thickness of the Concrete Cover; RILEM: Bagneux, France, 2007. [Google Scholar]
- Williams, M.; Ortega, J.M.; Sánchez, I.; Cabeza, M.; Climent, M.Á. Non-Destructive Study of the Microstructural Effects of Sodium and Magnesium Sulfate Attack on Mortars Containing Silica Fume Using Impedance Spectroscopy. Appl. Sci. 2017, 7, 648. [Google Scholar] [CrossRef]
- Ou, J.; Li, H. Structural health monitoring in mainland China: Review and future trends. Struct. Health Monit. 2010, 9, 219–231. [Google Scholar] [CrossRef]
- Sohn, H.; Farrar, C.R.; Hemez, F.M.; Shunk, D.D.; Stinemates, D.W.; Nadler, B.R.; Czarnecki, J.J. A review of structural health monitoring literature: 1996–2001. In Los Alamos National Laboratory Report; LA-13976-MS; Los Alamos National Laboratory: Los Alamos, NM, USA, 2004. [Google Scholar]
- Song, G.; Olmi, C.; Gu, H. An overheight vehicle–bridge collision monitoring system using piezoelectric transducers. Smart Mater. Struct. 2007, 16, 462–468. [Google Scholar] [CrossRef]
- Gu, H.; Song, G.; Dhonde, H.; Mo, Y.L.; Yan, S. Concrete early-age strength monitoring using embedded piezoelectric transducers. Smart Mater. Struct. 2006, 15, 1837–1845. [Google Scholar] [CrossRef]
- Kim, J.; Kim, J.; Park, S.; Oh, T. Integrating embedded piezoelectric sensors with continuous wavelet transforms for real-time concrete curing strength monitoring. Struct. Infrastruct. Eng. 2015, 11, 897–903. [Google Scholar] [CrossRef]
- Kim, J.; Lee, C.; Park, S.; Koh, K. Real-time strength development monitoring for concrete structures using wired and wireless electro-mechanical impedance techniques. KSCE J. Civ. Eng. 2013, 17, 1432–1436. [Google Scholar] [CrossRef]
- Choi, S.; Tareen, N.; Kim, J.; Park, S.; Park, I. Real-Time Strength Monitoring for Concrete Structures Using EMI Technique Incorporating with Fuzzy Logic. Appl. Sci. 2018, 8, 75. [Google Scholar] [CrossRef]
- Liu, T.; Huang, Y.; Zou, D.; Teng, J.; Li, B. Exploratory study on water seepage monitoring of concrete structures using piezoceramic based smart aggregates. Smart Mater. Struct. 2013, 22, 065002. [Google Scholar] [CrossRef]
- Zou, D.; Liu, T.; Huang, Y.; Zhang, F.; Du, C.; Li, B. Feasibility of water seepage monitoring in concrete with embedded smart aggregates by P-wave travel time measurement. Smart Mater. Struct. 2014, 23, 067003. [Google Scholar] [CrossRef]
- Zou, D.; Liu, T.; Qiao, G.; Huang, Y.; Li, B. A Experimental Study on the Performance of Piezoceramic Based Smart Aggregate in Water Environment. IEEE Sens. J. 2014, 4, 943–944. [Google Scholar] [CrossRef]
- Gu, H.; Moslehy, Y.; Sanders, D.; Song, G.; Mo, Y.L. Multi-functional smart aggregate-based structural health monitoring of circular reinforced concrete columns subjected to seismic excitations. Smart Mater. Struct. 2010, 19, 322–328. [Google Scholar] [CrossRef]
- Moslehy, Y.; Gu, H.; Belarbi, A.; Mo, Y.L.; Song, G. Smart aggregate-based damage detection of circular RC columns under cyclic combined loading. Smart Mater. Struct. 2010, 19, 065021. [Google Scholar] [CrossRef]
- Lillamand, I.; Chaix, J.; Ploix, M.A.; Garnier, V. Acoustoelastic Effect in concrete material under uni-axial compressive loading. Ndt E Int. 2010, 43, 655–660. [Google Scholar] [CrossRef]
- Sohn, H. Effects of environmental and operational variability on structural health monitoring. Philosophical Transactions of the Royal Society. Math. Phys. Eng. Sci. 2007, 365, 539–560. [Google Scholar] [CrossRef] [PubMed]
- Peeters, B.; Maeck, J.; de Roeck, G. Vibration-based damage detection in civil engineering: Excitation sources and temperature effects. Smart Mater. Struct. 2001, 10, 518–527. [Google Scholar] [CrossRef]
- Zou, D.; Liu, T.; Liang, C.; Huang, Y. An experimental investigation on the health monitoring of concrete structures using piezoelectric transducers at various environmental temperatures. J. Intell. Mater. Syst. Struct. 2015, 26, 1028–1034. [Google Scholar] [CrossRef]
- Liu, T.; Zou, D.; Du, C.; Wang, Y. Influence of Axial Loads on the Health Monitoring of Concrete Structures Using Embedded Piezoelectric Tranducers. Struct. Health Monit. 2017, 2, 202–214. [Google Scholar] [CrossRef]
- Zou, D.; Liu, T.; Yang, A.; Zhao, Y.; Du, C. A primary study on the performance of piezoceramic based smart aggregate under various compressive stresses. Smart Mater. Struct. 2017, 10, 107003. [Google Scholar] [CrossRef]
- Du, C.; Zou, D.; Liu, T.; Lv, H. An exploratory experimental and 3D numerical investigation on the effect of porosity on wave propagation in cement paste. Measurement 2017. [Google Scholar] [CrossRef]
- Rizzo, P.; Deng, W.; Vandenbossche, J. Detecting the presence of high water-to-cement ratio in concrete surfaces using highly nonlinear solitary waves. Appl. Sci. 2016, 6, 104. [Google Scholar] [CrossRef]
- Nasrollahi, A.; Deng, W.; Rizzo, P.; Vuotto, A.; Vandenbossche, J. Nondestructive testing of concrete using highly nonlinear solitary waves. Nondestruct. Test. Eval. 2017, 32, 381–399. [Google Scholar] [CrossRef]
- Du, C.; Liu, T.; Zou, D.; Teng, J. Time-dependent strain development of early age concrete under step by step load history. Construct. Build. Mater. 2015, 8, 133–139. [Google Scholar] [CrossRef]
- Tsangouri, E.; Karaiskos, G.; Aggelis, D.G.; Deraemaeker, A.; Van Hemelrijck, D. Crack sealing and damage recovery monitoring of a concrete healing system using embedded piezoelectric transducers. Struct. Health Monit. 2015, 9, 462–474. [Google Scholar] [CrossRef]
- Comité Euro-International du Béton (CEB). CEB-FIP Model Code for Concrete Structures; CEB: Lausanne, Switzerland, 1990. [Google Scholar]
- GB/50010-2010. Code for Design of Concrete Structures; Ministry of Housing and Urban-Rural Development of China: Beijing, China, 2010.
- Song, G.; Gu, H.; Mo, Y. Smart aggregates: Multi-functional sensors for concrete structures—A tutorial and a review. Smart Mater. Struct. 2008, 17, 033001. [Google Scholar] [CrossRef]
- Kumar, J.; Madhusudhan, B.N. A note on the measurement of travel times using bender and extender elements. Soil Dyn. Earthq. Eng. 2010, 30, 630–634. [Google Scholar] [CrossRef]
- Wang, L. Foundation of Stress Waves; National Defense Industry Press: Beijing, China, 2010; pp. 178–186. [Google Scholar]
Figure 1.
Monitoring system. (a) Smart aggregate with cable; and, (b) Test scheme.
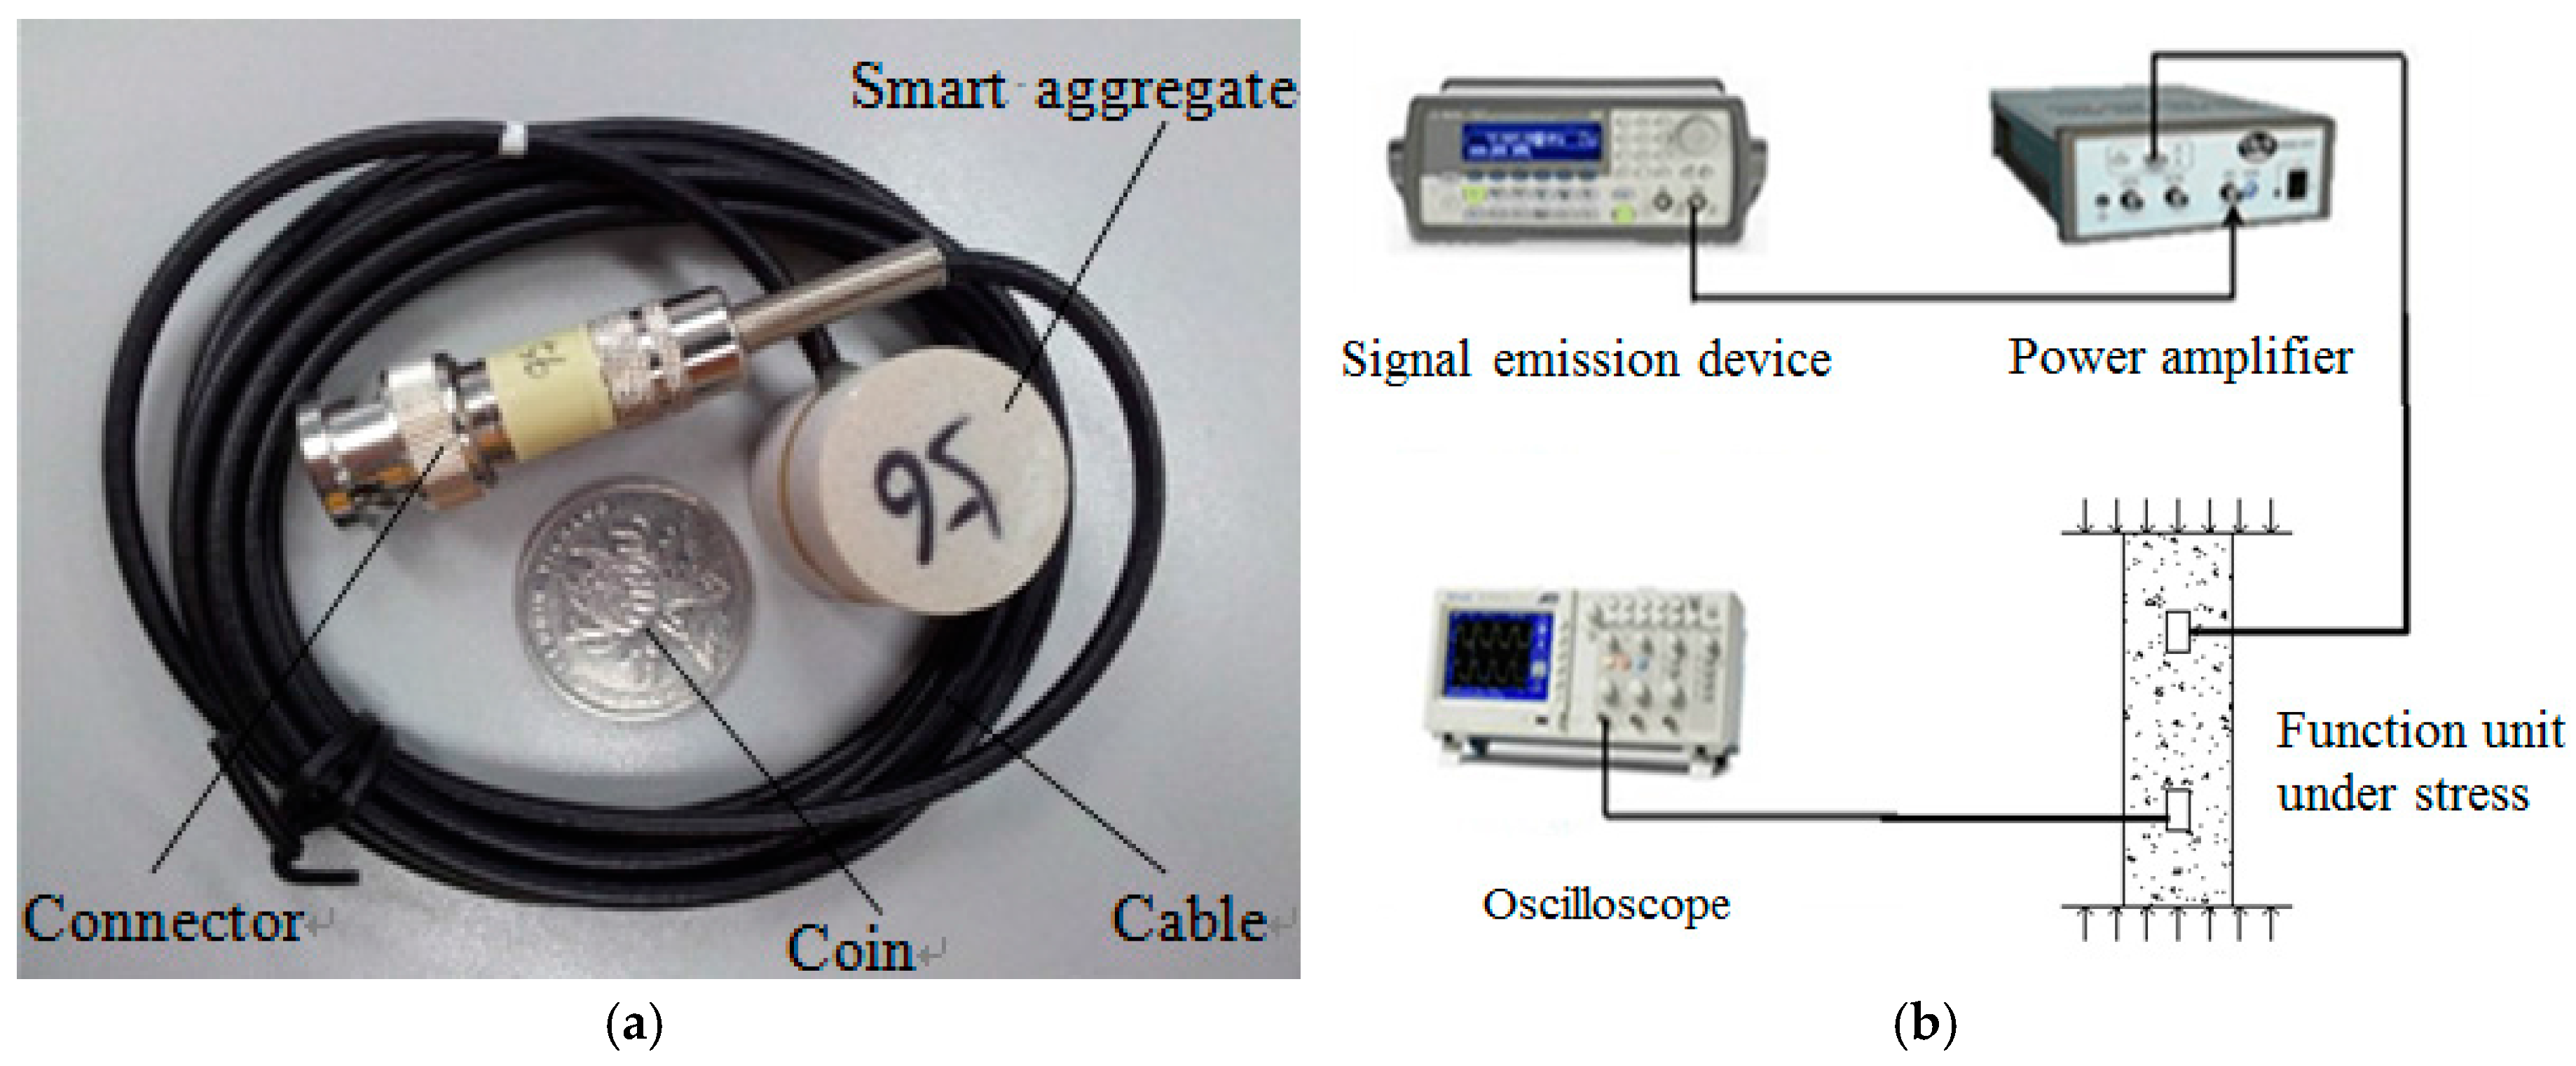
Figure 2.
Locations of SA’s (mm).
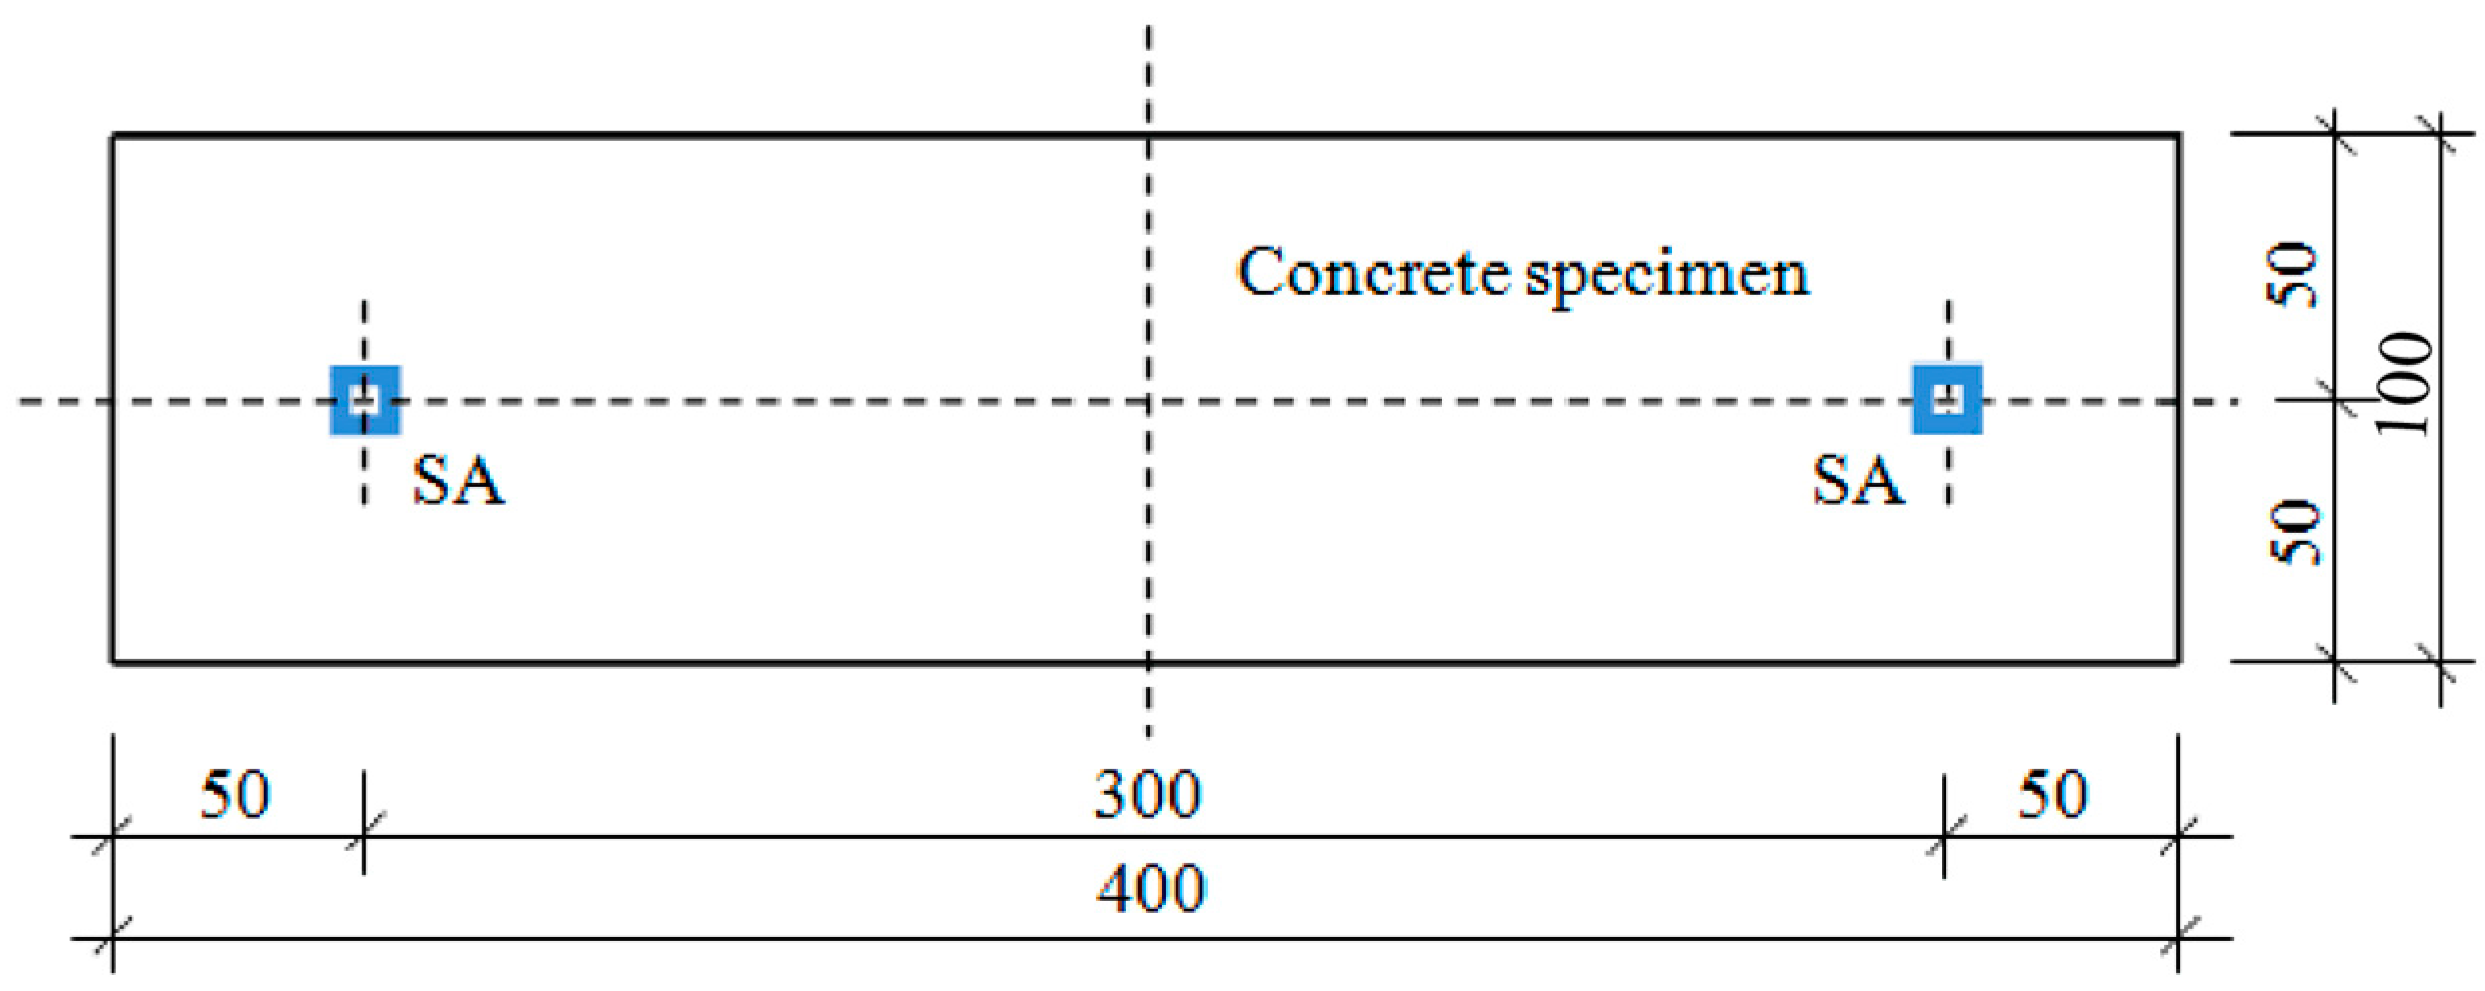
Figure 3.
Loading device.

Figure 4.
Loading history.
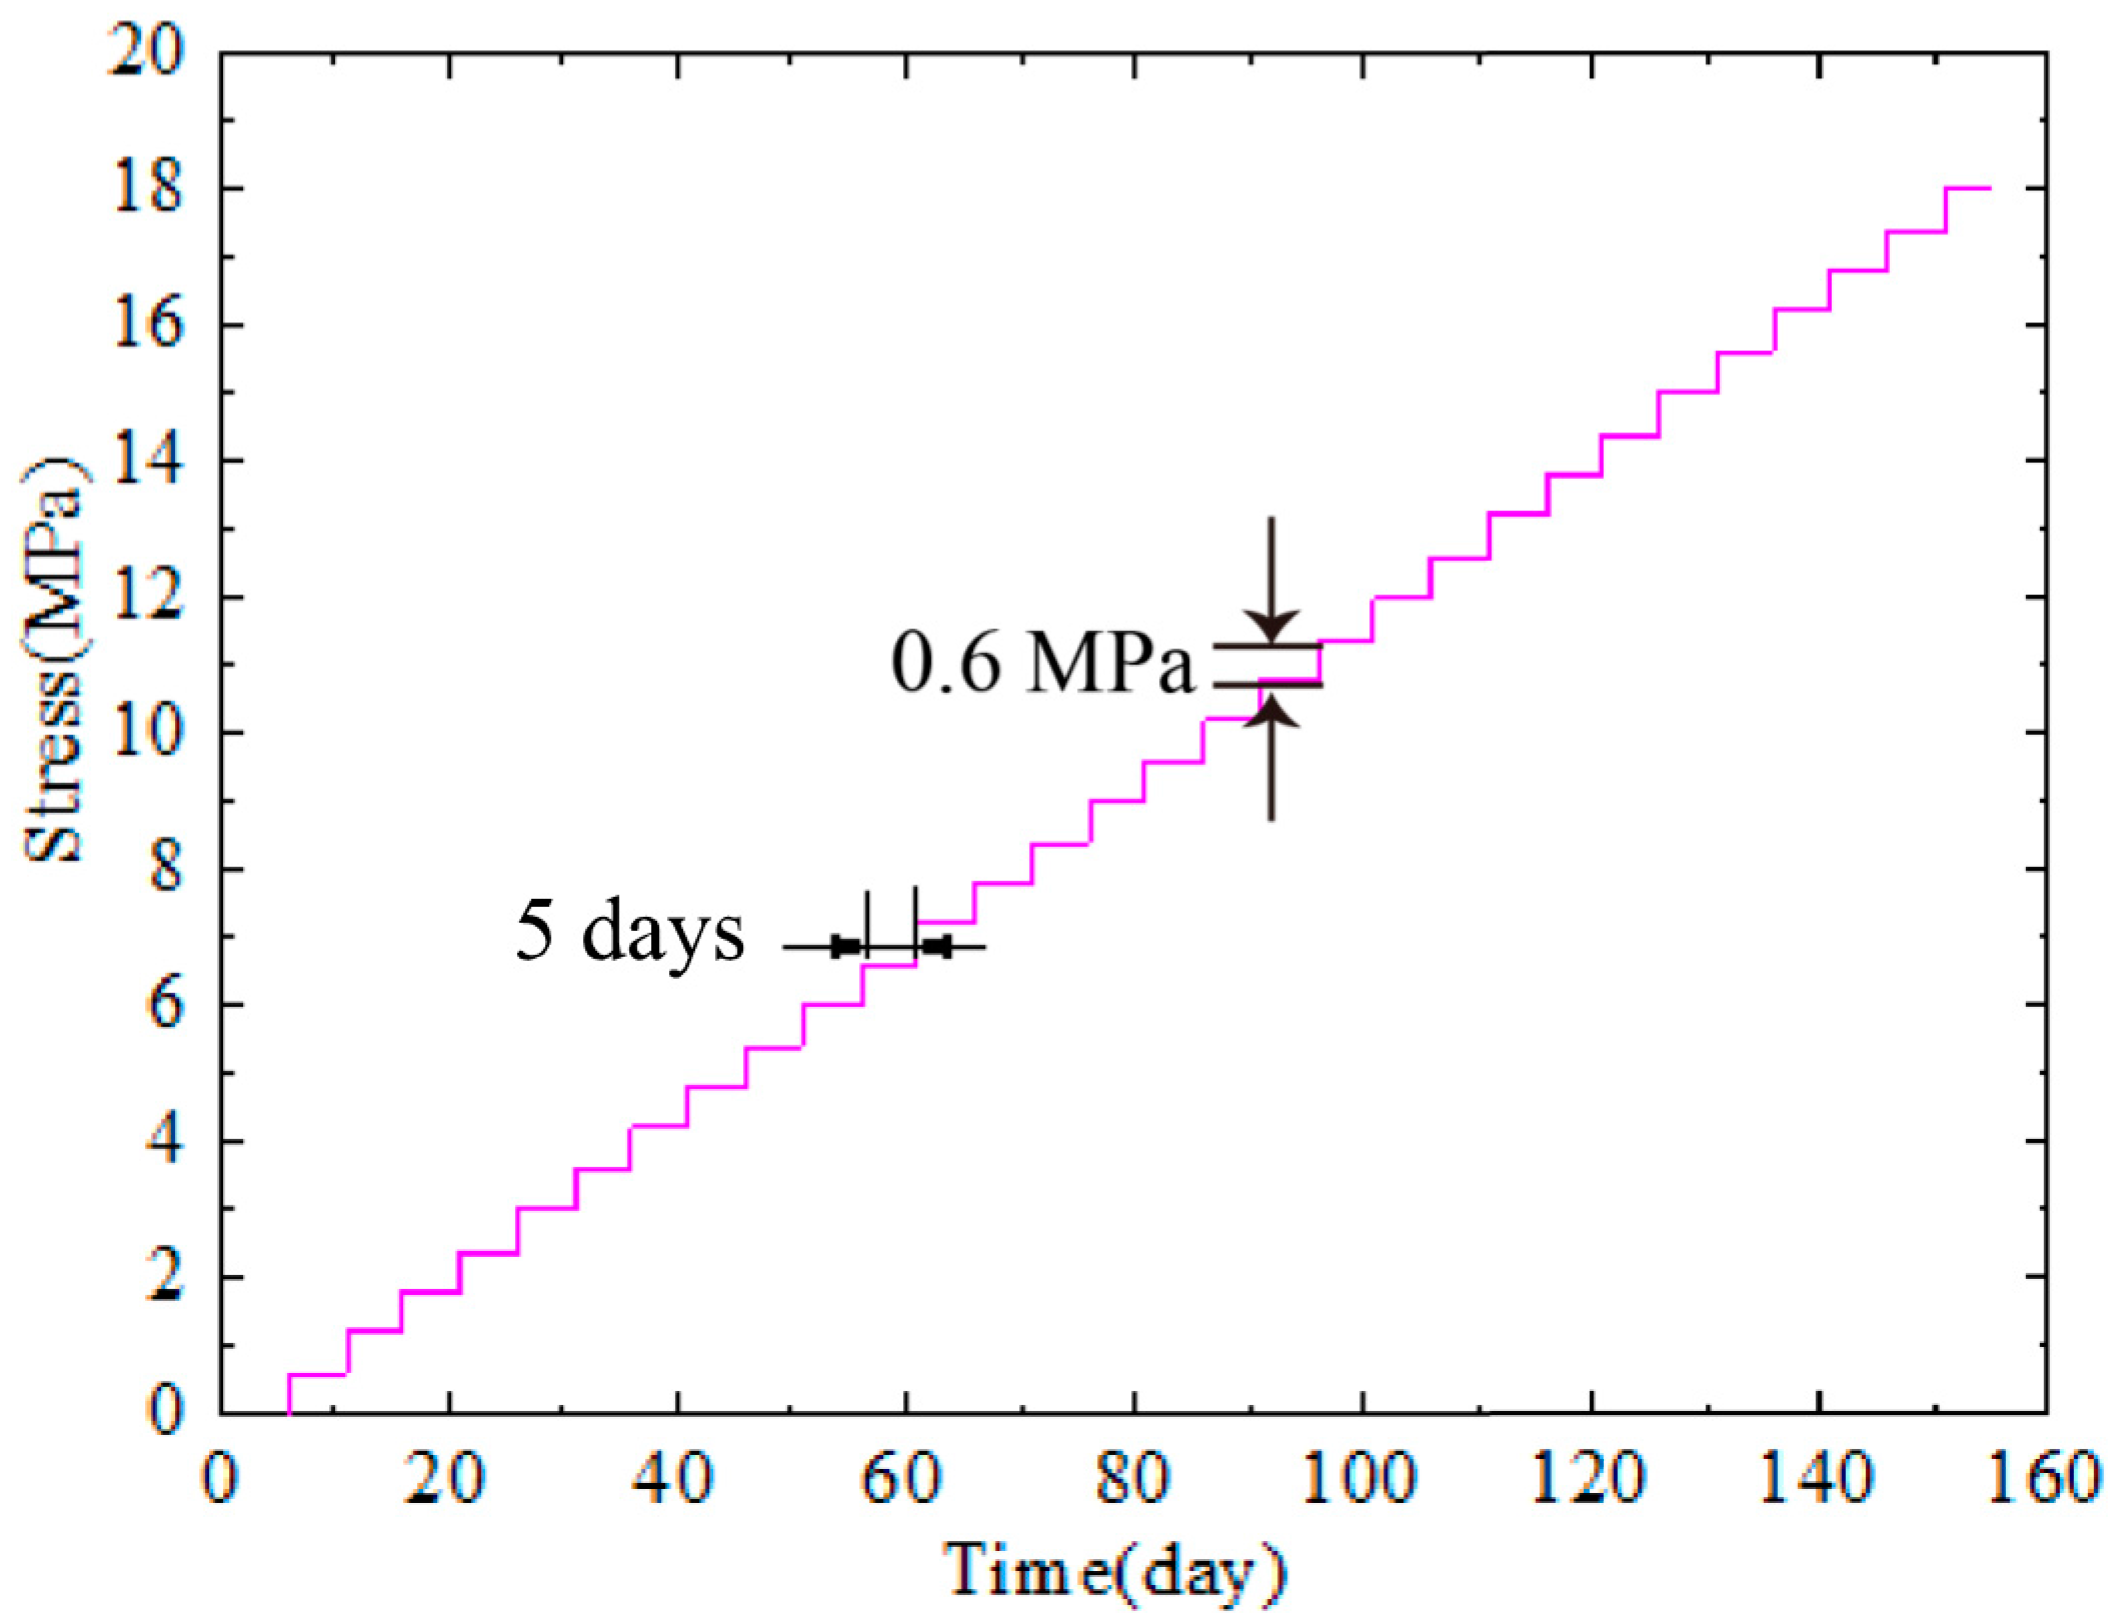
Figure 5.
Response signal.
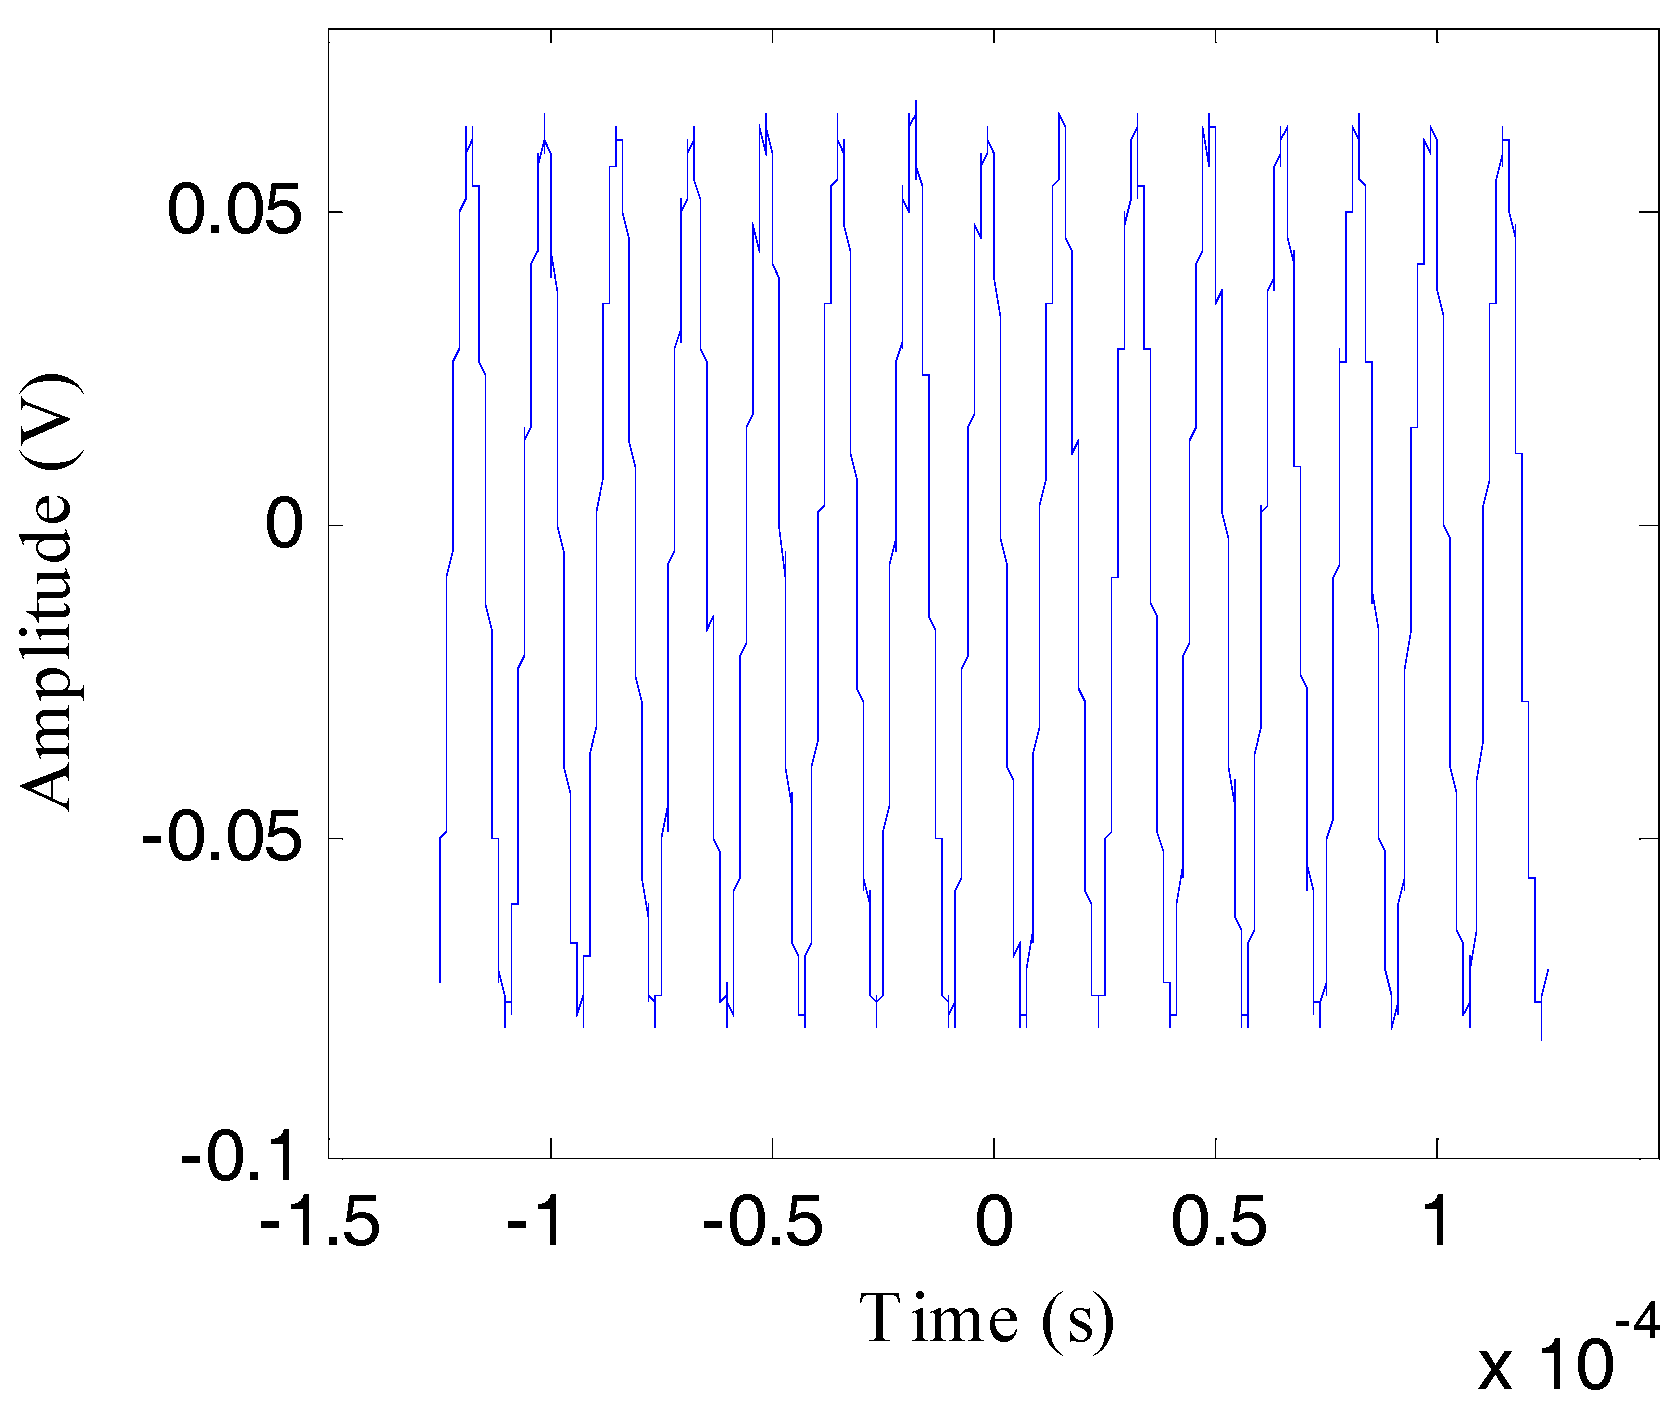
Figure 6.
Typical pulse drive (CH2) and sensing (CH1) signals [22].
Figure 6.
Typical pulse drive (CH2) and sensing (CH1) signals [22].

Figure 7.
Amplitude development with different stress. (a) C1; (b) C2.
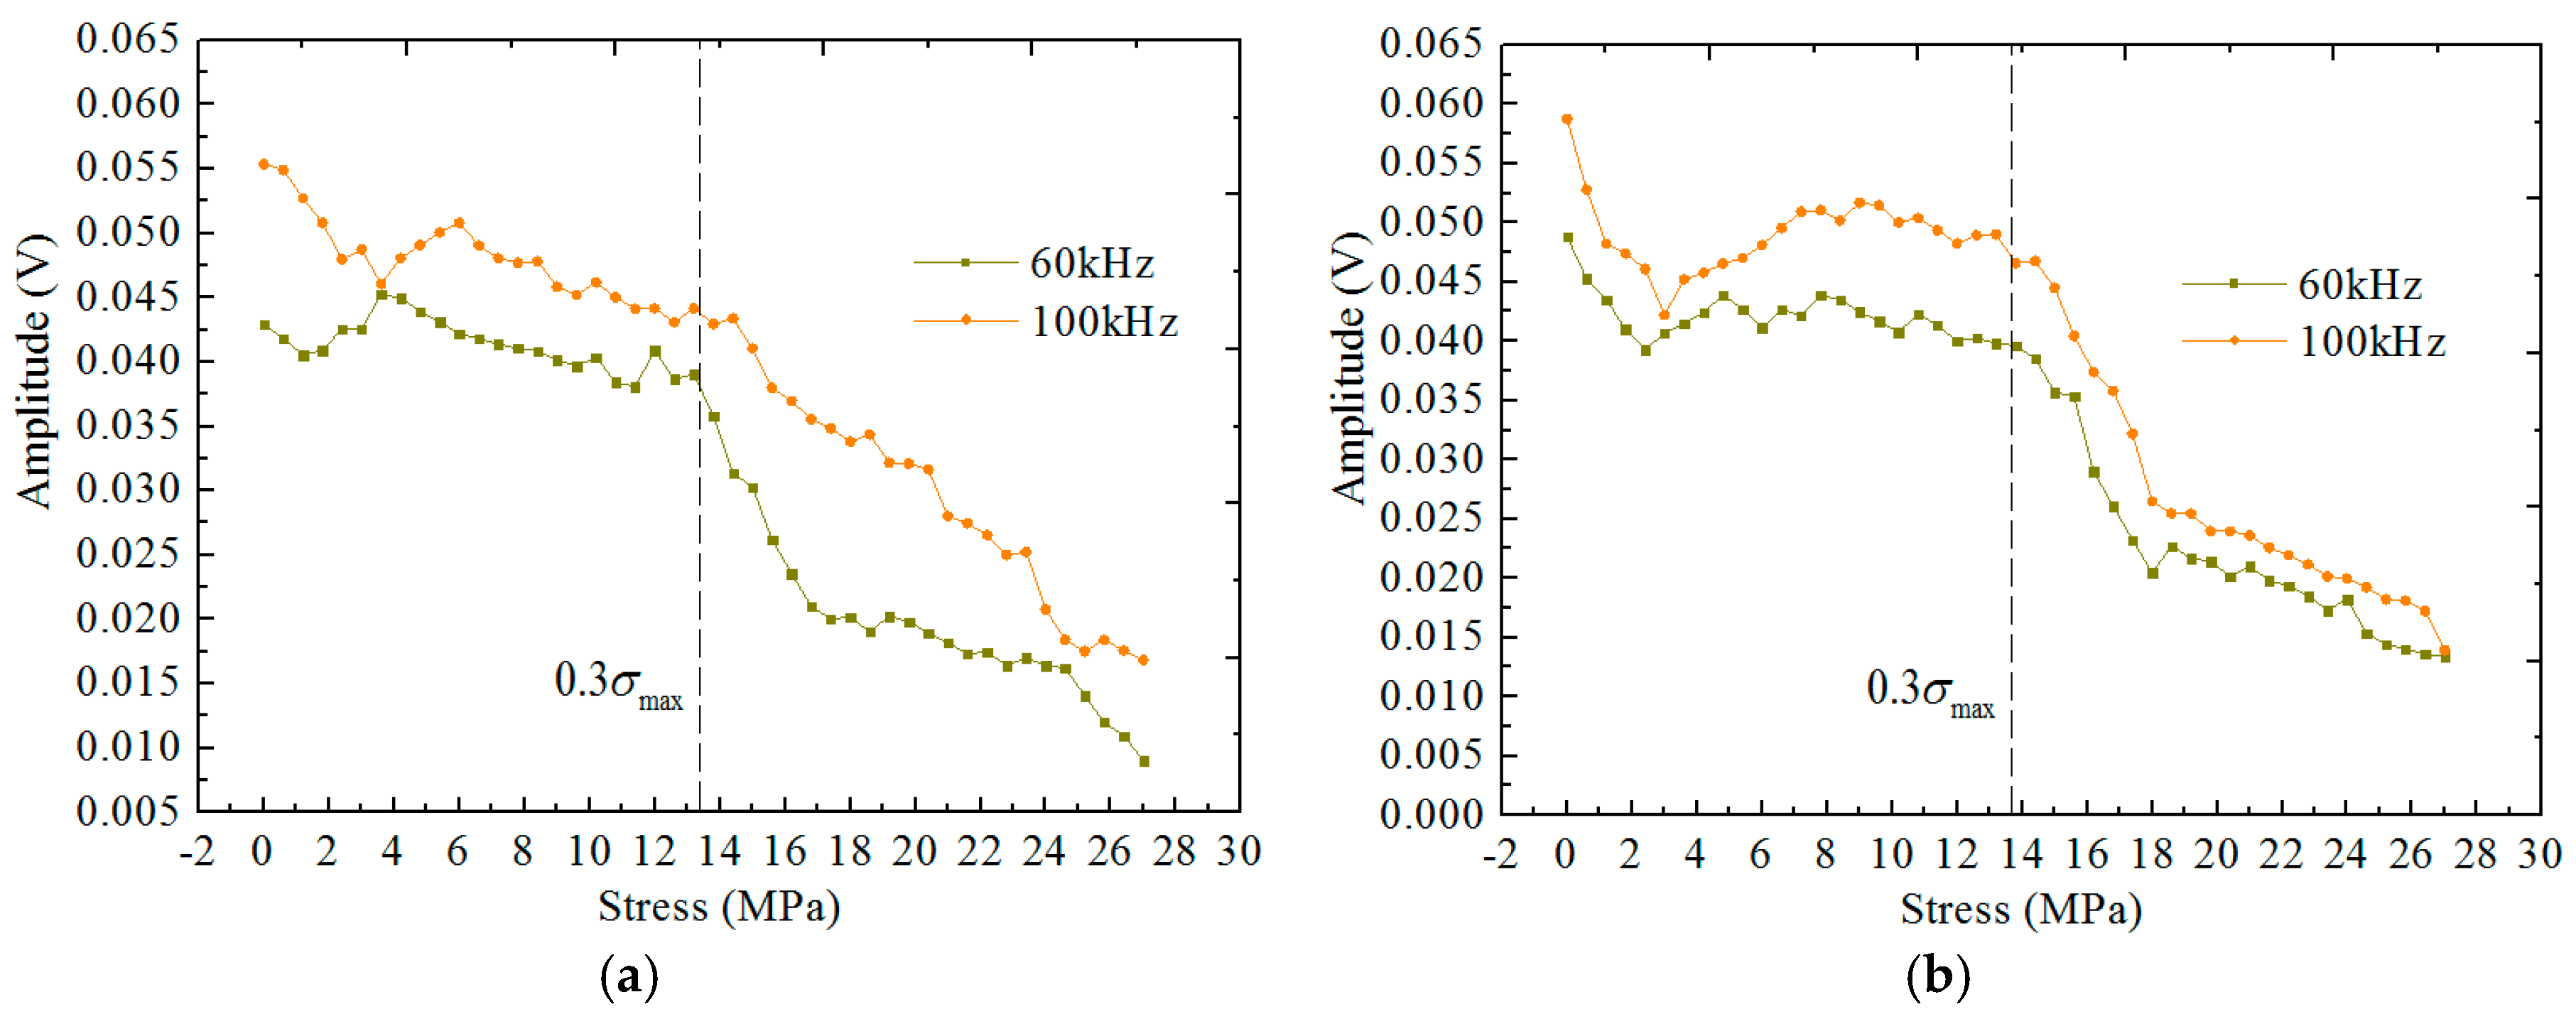
Figure 8.
Elastic modulus development versus applied stress.
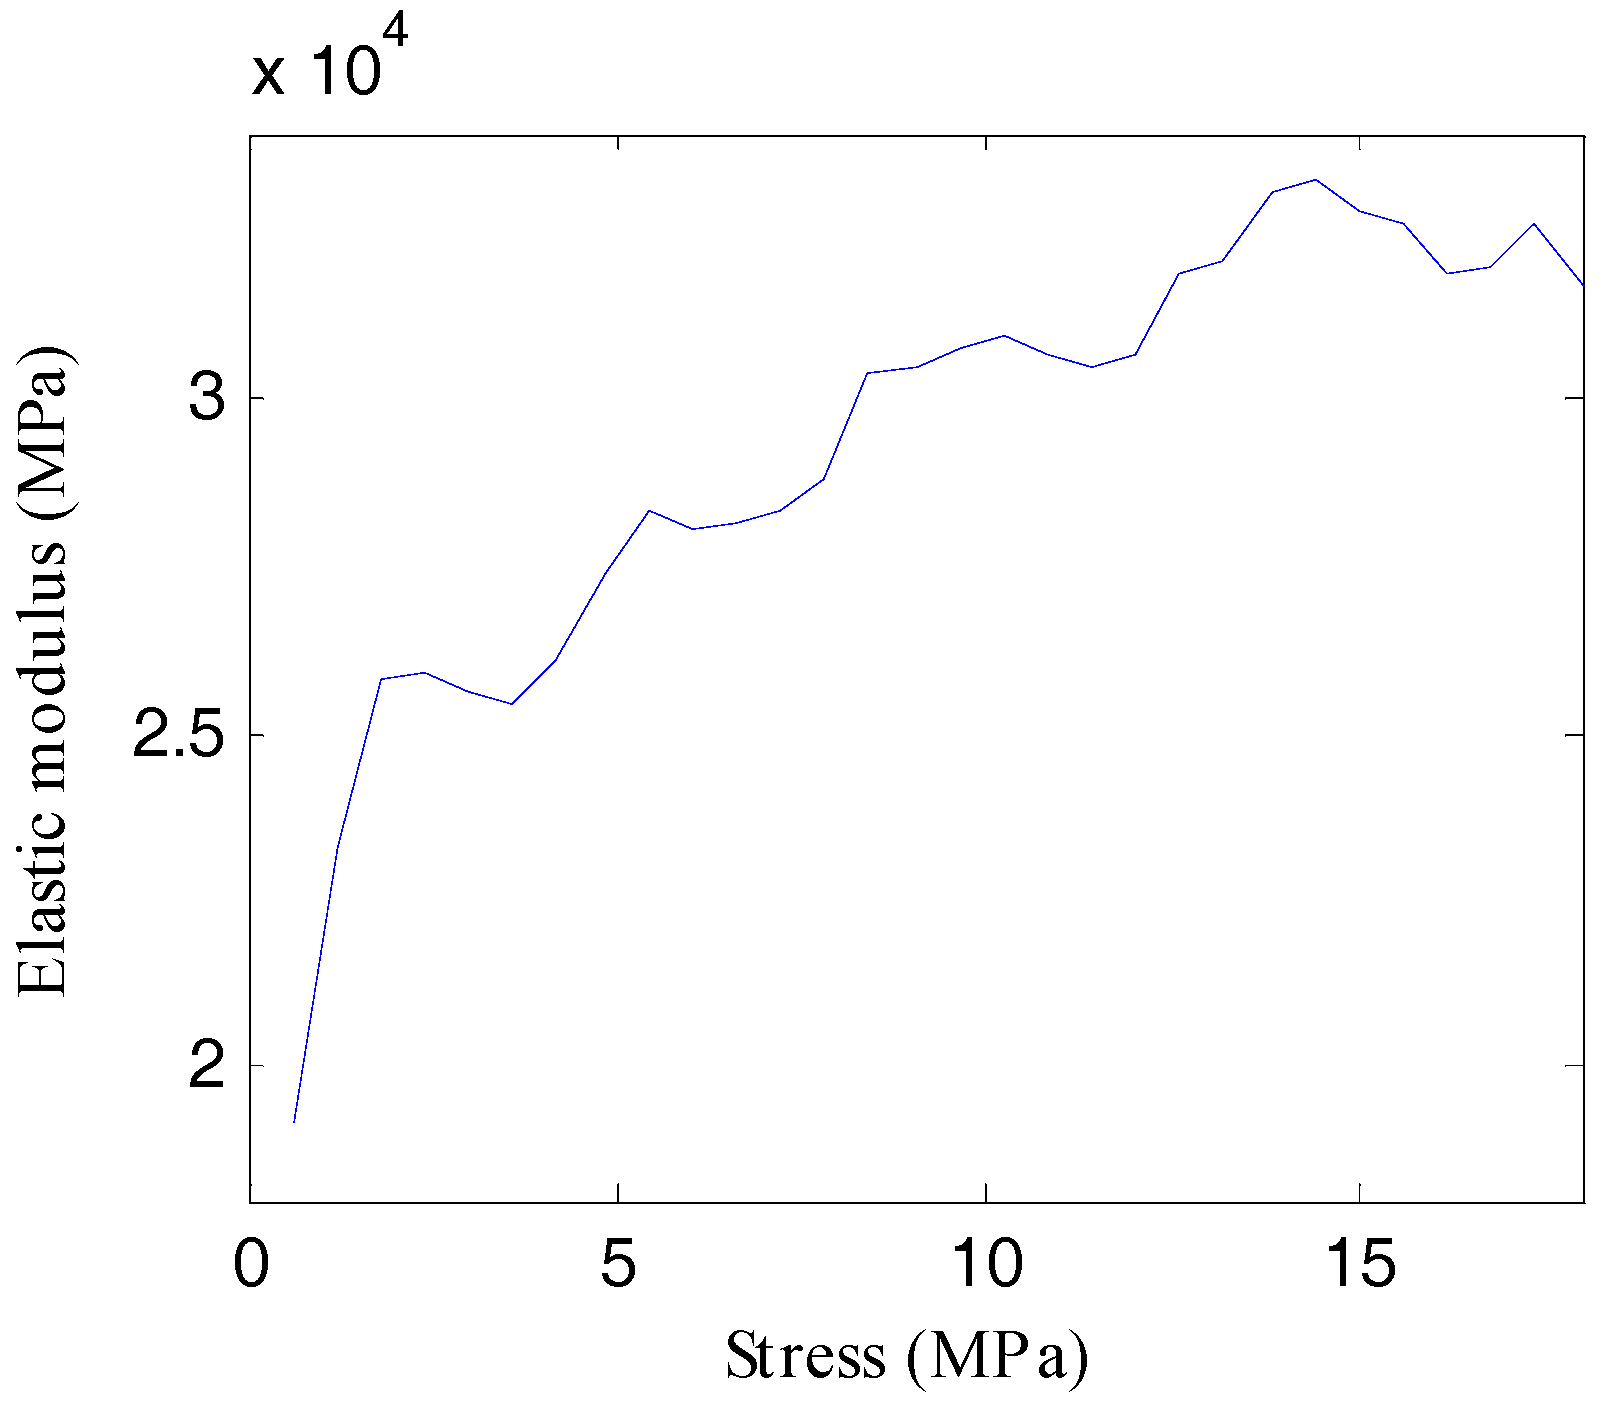
Figure 9.
Velocity development with different stress.

Table 1.
Compositional details of the concrete.
| Component | Weight (kg/m3) | Mix Proportion |
|---|---|---|
| Cement | 300 | 1.00 |
| Water | 160 | 0.53 |
| Sand | 875 | 2.92 |
| Stone | 860 | 2.87 |
| Fly ash | 110 | 0.3667 |
| Slag powder | 80 | 0.2667 |
| Admixture | 4.90 | 1.63% |
| Total | 2390 | -- |
Table 2.
Cubic compressive strength of concrete versus age.
| Specimens | Cubic Compressive Strength (MPa) | ||||
|---|---|---|---|---|---|
| 1 Day | 3 Days | 7 Days | 14 Days | 28 Days | |
| Specimen-1 | 26 | 39.2 | 44.1 | 51.2 | 57.5 |
| Specimen-2 | 27 | 38.1 | 44 | 49.6 | 57.7 |
| Specimen-3 | 25.9 | 39.1 | 45.1 | 49.8 | 58.8 |
| Average | 26.3 | 38.8 | 44.4 | 50.2 | 58 |
© 2018 by the authors. Licensee MDPI, Basel, Switzerland. This article is an open access article distributed under the terms and conditions of the Creative Commons Attribution (CC BY) license (http://creativecommons.org/licenses/by/4.0/).
Share and Cite
MDPI and ACS Style
Du, C.; Zou, D.; Liu, T.; Li, W. A Study on the Influence of Stage Load on Health Monitoring of Axial Concrete Members Using Piezoelectric Based Smart Aggregate. Appl. Sci. 2018, 8, 423. https://doi.org/10.3390/app8030423
AMA Style
Du C, Zou D, Liu T, Li W. A Study on the Influence of Stage Load on Health Monitoring of Axial Concrete Members Using Piezoelectric Based Smart Aggregate. Applied Sciences. 2018; 8(3):423. https://doi.org/10.3390/app8030423
Chicago/Turabian StyleDu, Chengcheng, Dujian Zou, Tiejun Liu, and Weijie Li. 2018. "A Study on the Influence of Stage Load on Health Monitoring of Axial Concrete Members Using Piezoelectric Based Smart Aggregate" Applied Sciences 8, no. 3: 423. https://doi.org/10.3390/app8030423
Note that from the first issue of 2016, this journal uses article numbers instead of page numbers. See further details here.