Application of Aesthetic Principles to the Study of Consumer Preference Models for Vase Forms


Department of Industrial Design, Tunghai University, Taichung 40704, Taiwan
Appl. Sci. 2018, 8(7), 1199; https://doi.org/10.3390/app8071199
Submission received: 7 May 2018
/
Revised: 13 July 2018
/
Accepted: 13 July 2018
/
Published: 22 July 2018
(This article belongs to the Special Issue Selected Papers from IEEE ICASI 2018)
Abstract
:The factors that affect a consumer when making a purchase decision include product function, quality, and price. Different products might feature similar functional performance although they are designed and manufactured by different vendors. The most decisive factor for a consumer in buying a product is no longer its physical functions. Nowadays, consumers care more about the aesthetics that a product can deliver. Designers should make any extra effort to improve the aesthetic design of their products. Therefore, it is critical for a designer to know the aesthetic tastes of his/her target consumer group in order to create products with the preferred style. Furthermore, the idea of design differentiation needs to be incorporated so that a product can present different aesthetic perceptions to consumers of different tastes. The objective of this study is to investigate consumers’ preference models from their preferred product forms. The aesthetic principles of Symmetry, Minimalism, and Cohesion are applied to the case study of the design of various vase forms. A quantitative approach of evaluating vase forms by the aesthetic principles is proposed. A conjoint analysis of the vase features and attributes was carried out in order to determine their correlation with consumer preferences. Consumers are classified into 6 groups of different aesthetic conceptions by cluster analysis. The consumers’ preference model can be determined by indices including Pearson’s R and Kendall’s tau. This approach provides designers with an effective way of determining the right direction for new form designs and renovation.
1. Introduction
The study by Maslow [1] indicated a hierarchy of needs for humans. After people reached the essential physiological, safety, and social needs, they will pursue self-demands and the ambit of self-actualization of the higher hierarchical level. When applying this hierarchy theory to products, consumers will not choose a product simply based on its functional presentation if various products can deliver the essential functions. Instead, they will pursue a higher level such as to present unique tastes or aesthetic styles.
Under the globalized competitions in the 21st century, most of the products that are available on the market present stable developments from a technical perspective. Companies need to keep enhancing the value that is added to their products. Consumers are no longer satisfied with product functions only. Instead, they are pursuing psychological satisfaction [2,3]. As a result, the trend in the last couple of years has indicated the emphasis of product designs on the aesthetic perception that a product can deliver. In addition to providing essential physiological needs, a product needs to satisfy a diversified range of psychological needs since consumers are pursuing individual autonomy of personalized culture. In other words, a successful product needs to comply with consumer preferences, while the true value of a product is not justified only by its proper functions or attractive appearance [4]. In addition to satisfying consumers’ physiological and psychological needs, a product needs to also highlight a consumer’s individual characteristics. To keep its competitive edge on the market, a product at its mature stage is required to highlight its difference from other products [5]. It has become a modern design trend to create the difference between product designs [6,7].
During the process of socialization, consumers acquire the sense of uniqueness and difference and obtain a profundity of awareness of self-assimilation and dissimilation via the personalized items they choose. Therefore, it is critical for companies to satisfy consumers’ individual needs by creating differences for products at the mature stage. It is also important to respond accordingly to the preference of “demassified” people [8]. By bringing this consumer trend into the product design aspect, a company can respond rapidly to customers’ psychological needs. Moreover, product developments, positioning, and designs can be conducted within a very short time and with a maximum efficiency. This will be the key for enterprises to raise the competitiveness of a company [2].
As to how to investigate the preference relationships between products and consumers, earlier studies were mostly conducted using the method of Kansei vocabularies as a way of delimiting peoples’ perception of products, and then to analyze people’s preference for products. However, it has been verified that through the intervention of the Kansei vocabularies, there is possibly a problem of perception difference [9,10,11]. Hsiao and Lo [12] indicated that an adequate design can enhance a product’s difference from the other similar products. A product’s value that is perceived by customers can also be enhanced by proper shape designs. The value perceived by customers is significantly correlated with the customers’ intention of repurchase. The equations and principles of product-shape aesthetics that are derived by Lo and Ko [13] and Lo and Hsiao [14] are used for the product shape evaluation in this study. The equations are used to determine the aesthetic measures for balance, equilibrium, and symmetry of product shapes.
Valencia-Romero and Lugo [15] proposed a methodology to quantify Gestalt principles by part-worth utilities for the evaluation of product aesthetics. They also realized the quantification of symmetry, parallelism, and continuity as continuous design variables for 3D product representations [16]. Tovares et al. [17] proposed a new approach of modelling consumer preference models by an experiential conjoint analysis which captures preference for a product through experience-based preference judgments. Backhaus et al. [18] proposed a virtual reality based conjoint analysis for early customer integration in product development so that the efficiency of the product development process can be enhanced. Orsborn et al. [19] proposed the quantification of aesthetic preference for estimation by utility functions. Chen et al. [20] proposed a new approach of identifying key attributes and analytical techniques of consumer choice modelling to forecast the impact of engineering decisions. Kelly et al. [21] proposed an approach of incorporating user shape preference in engineering design optimization. Lugo et al. [22,23] proposed an approach of modeling product form preference by Gestalt principles, semantic space, and Kansei engineering approaches. They also determined the relationship between subjects’ aesthetic preference for automobile wheel rims and quantified Gestalt principles. Lo et al. [24] proposed the application of aesthetic theory and genetic algorithms to product form optimization.
This approach can carry out an investigation of product shapes in a more objective way which is independent of personal judgment. Even if different people have inconsistent impressions toward a product, this approach can still provide identical criteria for investigation based on the objective calculation of the evaluation model.
This study is based on a hypothesis that a particular rule exists in the form principles of the product form that is preferred by a consumer. Due to the differing consumer preferences, consumers can be classified into different groups depending on their aesthetic tastes. Based on this hypothesis, different types of vase forms are investigated in this study with an attempt to build a rational and objective model for the evaluation of form aesthetics. The elements of the aesthetics of a vase form are analyzed. Furthermore, the correlation between vase form constructions and consumer preferences is investigated by a conjoint analysis.
2. Theoretical Background
The theories which are employed in this research include three types:
- The evaluation model of aesthetic measure for analyzing the vase forms.
- Conjoint analysis for analyzing the relationship between the form constructions and consumer preferences.
- Cluster analysis for classifying subjects with different aesthetic tastes into different groups.
Three research methods are described separately as follows:
2.1. Aesthetic Measure
There are eight aesthetic principles in Lo’s theory, and we chose three of them that are more applicable for vases. These three principles include Symmetry, Minimalism and Cohesion. The meanings and measurement of them are explained below:
2.1.1. Symmetry
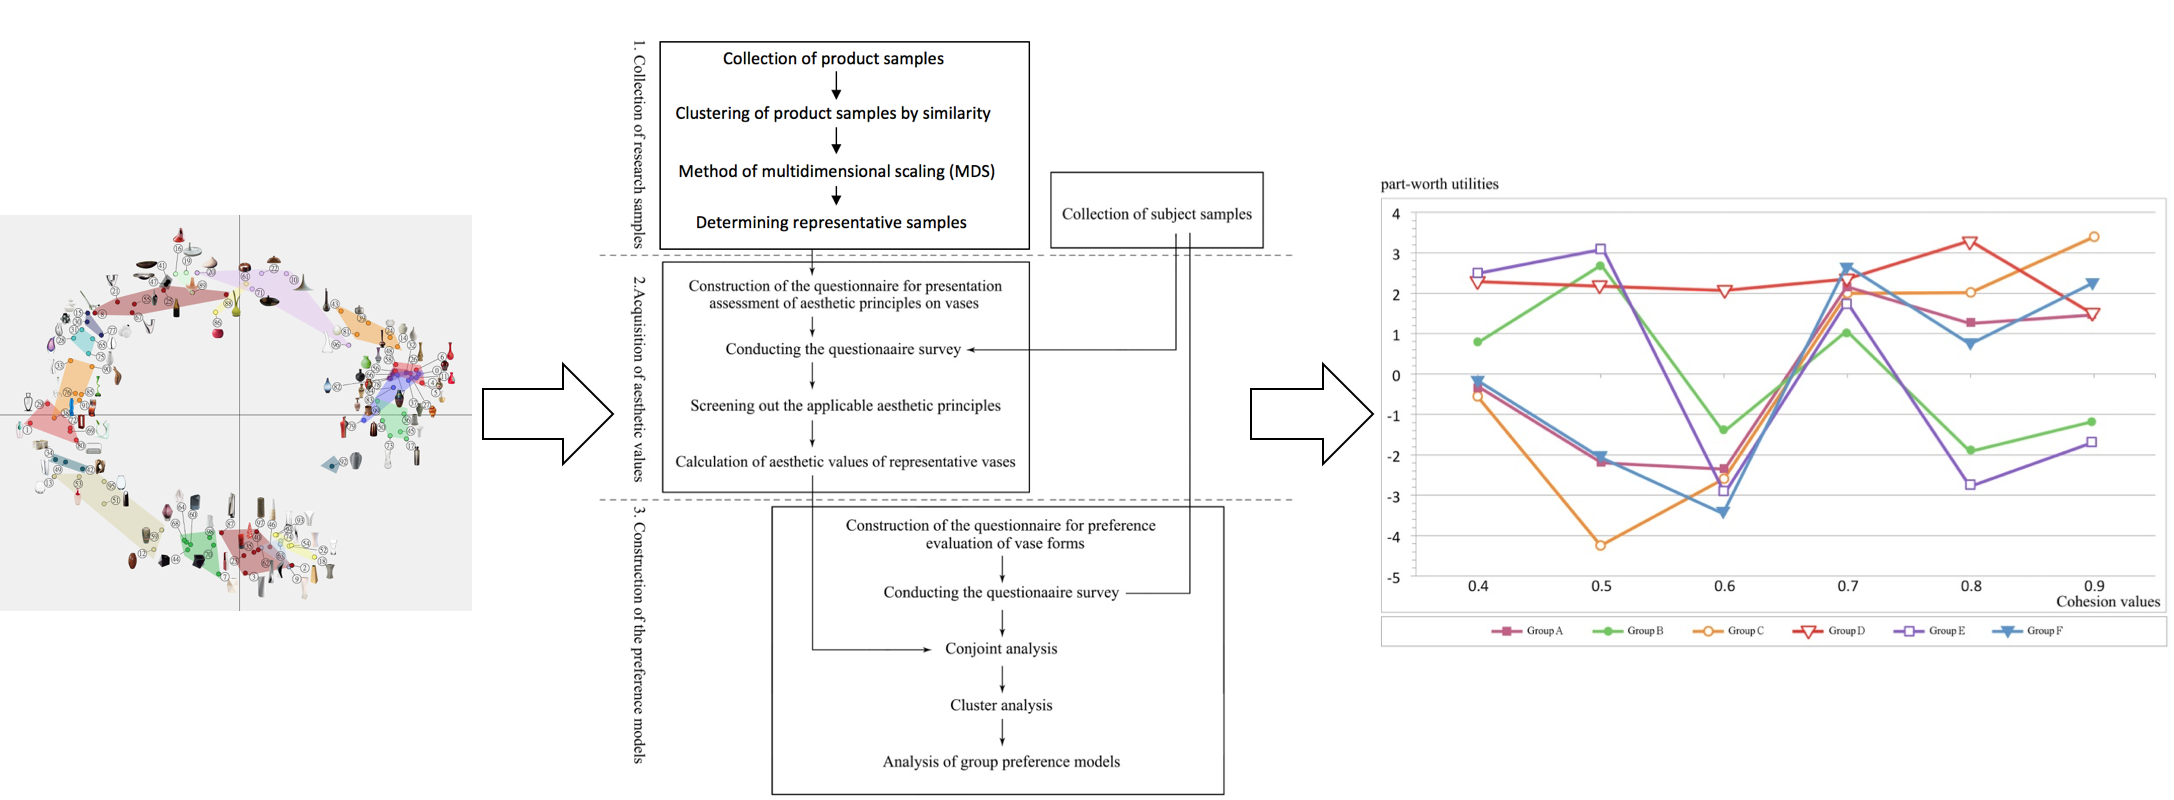
Symmetry is primarily used for testing of any duplication of elements along the axes, i.e., whether unit elements on one side of the centerline are exactly duplicated to the other side. Symmetry could be differentiated into three kinds, including vertical, horizontal, and diagonal symmetries, as shown in Figure 1. Thus, when analyzing the symmetry of an object, it needs to be cut into four portions: upper left, upper right, lower left and lower right. The symmetry of the object can be defined as Equation (1).
Among which is the overall symmetry, is the horizontal symmetry of front-view direction; is the vertical symmetry of front-view direction; is the diagonal symmetry of front-view direction. is the vertical symmetry of right-view direction; is the horizontal symmetry of right-view direction; is the diagonal symmetry of right-view. is the horizontal symmetry of top-view; is the vertical symmetry of top-view; is the diagonal symmetry of top-view. When the obtained value approaches 1, the form has a higher level of symmetry.
In calculating symmetrical aesthetic-perception equations, it is necessary to proceed with nondimensionalization in the calculation of equations to prevent a large difference in the numbers of object shape sizes, which results in error in the process of calculating numbers. The factors of symmetry which have to be checked in each portion include: the centroid coordinates, the size of the overall frame, the centroid angle and the centroid distance.
The plane is the plane of front view to be investigated. Equations (2)–(4) are used to evaluate these three types of symmetry.
The plane is the plane of the right side view to be investigated. Three types of symmetry can be evaluated by Equations (5)–(7).
The plane is the plane of the top view to be investigated. Three types of symmetry can be evaluated by Equations (8)–(10).
Among which are defined respectively as follows:
While UL- represents upper left; UR- represents upper right; LL- represents lower left; LR- represents lower right. are the coordinates of object i on position j of a quarter circle; are the coordinates of the center of overall shape; is the width of object i on position j; is then the height of object i on position j; is then the depth of object i on position j; is the overall quantity of objects in the quadrant. The values of angles in the four quadrants of quarter circles are in the front view, in the right view, and in the top view. The distances (in mm) from the each object center to the overall object center in each quadrant are in the front view, in the right view, and in the top view figure.
2.1.2. Minimalism
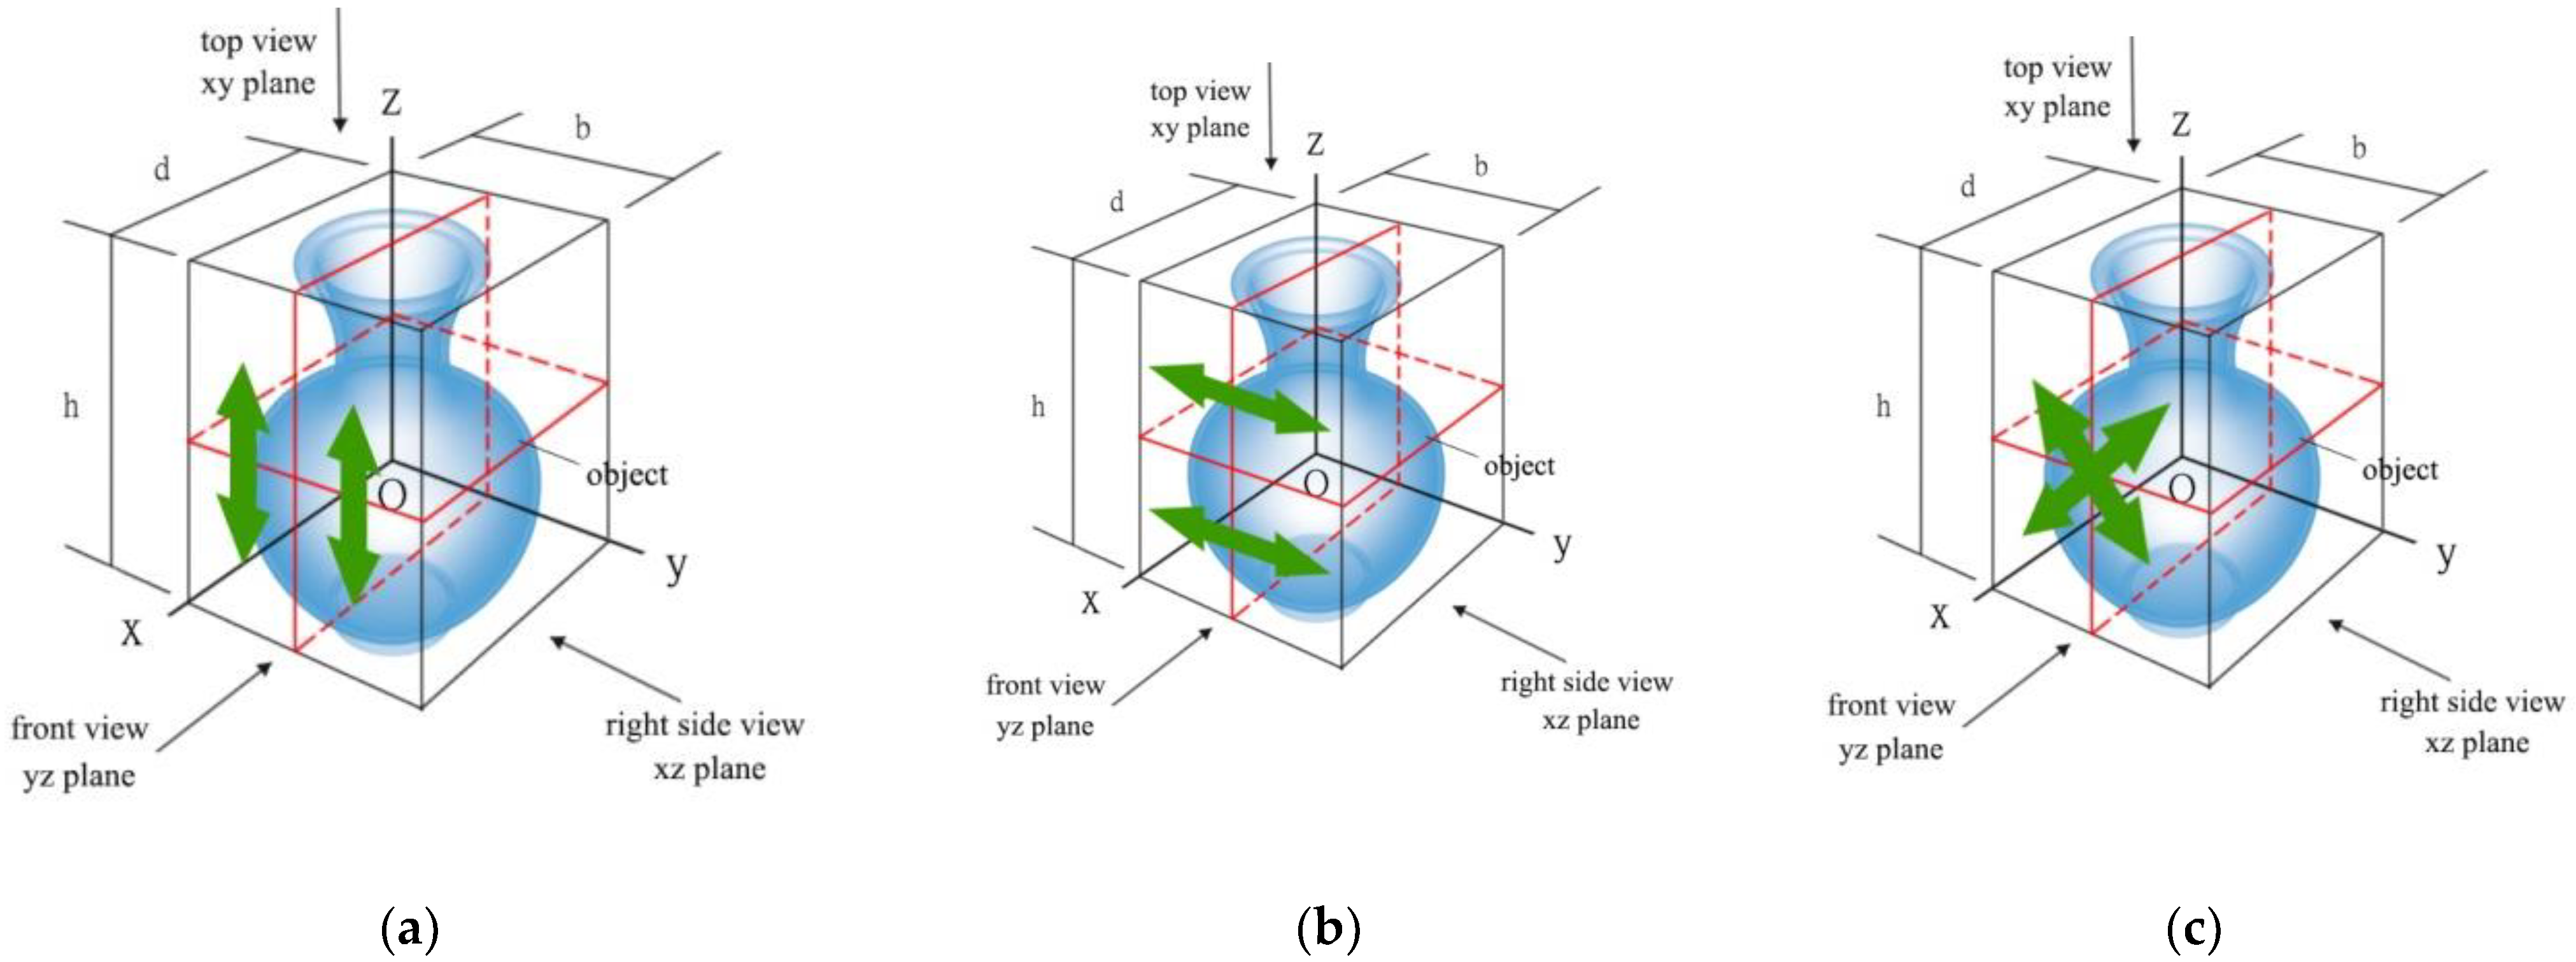
The value of minimalism () is used for the inspection of simple messages of object forms. If an object complies with the principle of minimalism, all essential factors are visually more simplified. When the minimalism is equal to 1, this means the constructed elements are completely identical. As a result, the assembly of each element will have the feeling of wholeness and feeling of order. A concrete example for this is demonstrated by the comparison between Figure 2a,b. The difference between these two vases is whether they have a handle or not. This causes a difference of element class and quantity, and therefore is different. Equation (11) is a quantitative method that is used for the evaluation of minimalism.
Among which is the minimalism of the overall shape and is the quantity of element classes; is the quantity of elements. In this context, an element is the basic unit that constitute the structure of an object.
2.1.3. Cohesion
When the size proportion, form direction and outline of form of each element and object are similar, this will result in the feeling of cohesion.
From the view of product form design, similar proportions of length, width, and height facilitate the value of cohesion (). To analyze the cohesion of products, the information that has to be known includes two portions: the proportions of the object frame from three views and the proportional relationship between object and elements. Equation (12) depicts a quantitative method which could be used for the evaluation of cohesion.
The values of CMf are the overall framework relative proportions of object form, which are respectively defined as follows:
Among which hframe is the height of overall form framework; bframe is the width of overall form framework; dframe is the depth of overall form framework; means the relative proportion of height to width of overall form framework; means the relative proportion of height to depth of overall form framework; means the relative proportion of width to depth of overall form framework.
are the relative proportions of the framework of each element to the framework overall form, which are respectively defined as follows:
is the relative proportion of height to width of each of the elements and the overall form framework; is the relative proportion of height to depth of each of the elements and the overall form framework; is the relative proportion of width to depth of each of the elements and the overall form framework; is the height of the overall form framework; is the width of the overall form framework; is the depth of the overall form framework; is the height of the element form; is the width of the element form; is the depth of the element form; n is the element quantity in the overall form.
2.2. Conjoint Analysis
Conjoint analysis was developed by Luce and Tukey in 1964. It was then introduced by Green and Rao in 1971 into the marketing field, and became one of the important methods in the marketing studies to measure consumer preferences. The basic assumption to operate the conjoint analysis is: consumers undertake the determination of perception preferences based on a plurality of attributes and their levels, which compose the product. In other words, consumer preferences for a certain product can be decomposed as the part-worth utilities which form the attribute and levels of the product.
The way to conduct the conjoint analysis is to use the decompositional approach to estimate the subject’s preference structure under the condition that the overall assessment results of subjects for a set of samples are already known [25]. In other words, the estimated independent variables and dependent variables can be obtained via consumers’ assessed values of a set of dependent variables. In addition, it is expected to minimize the difference between the original assessed values and the predicted values of the dependent variables. Therefore, the conjoint analysis is extremely effective when it is applied to the investigation of multi-attribute decision-making problems. It is only required to understand overall assessed values of the subjects on a set of samples aggregation and will be able to decompose the part-worth utilities of each attribute level. Then the relative importance weight of each attribute level can be calculated.
When applying the conjoint analysis, the strategic purposes listed below can be developed after the part-worth utilities of each attribute level has been determined:
- Understand the relative importance of each attribute level during consumers’ decision-making process.
- Find products’ best attribute combination for a group or an individual.
- Market segmentation can be conducted based on the difference of attribute levels that are emphasized.
- Discover the attribute combinations of products which do not exist on the market but are preferred by consumers.
- Under the assumption that other conditions remain unchanged, the market share of products which are composed of different attribute levels can be estimated based on the judgment of consumer preferences.
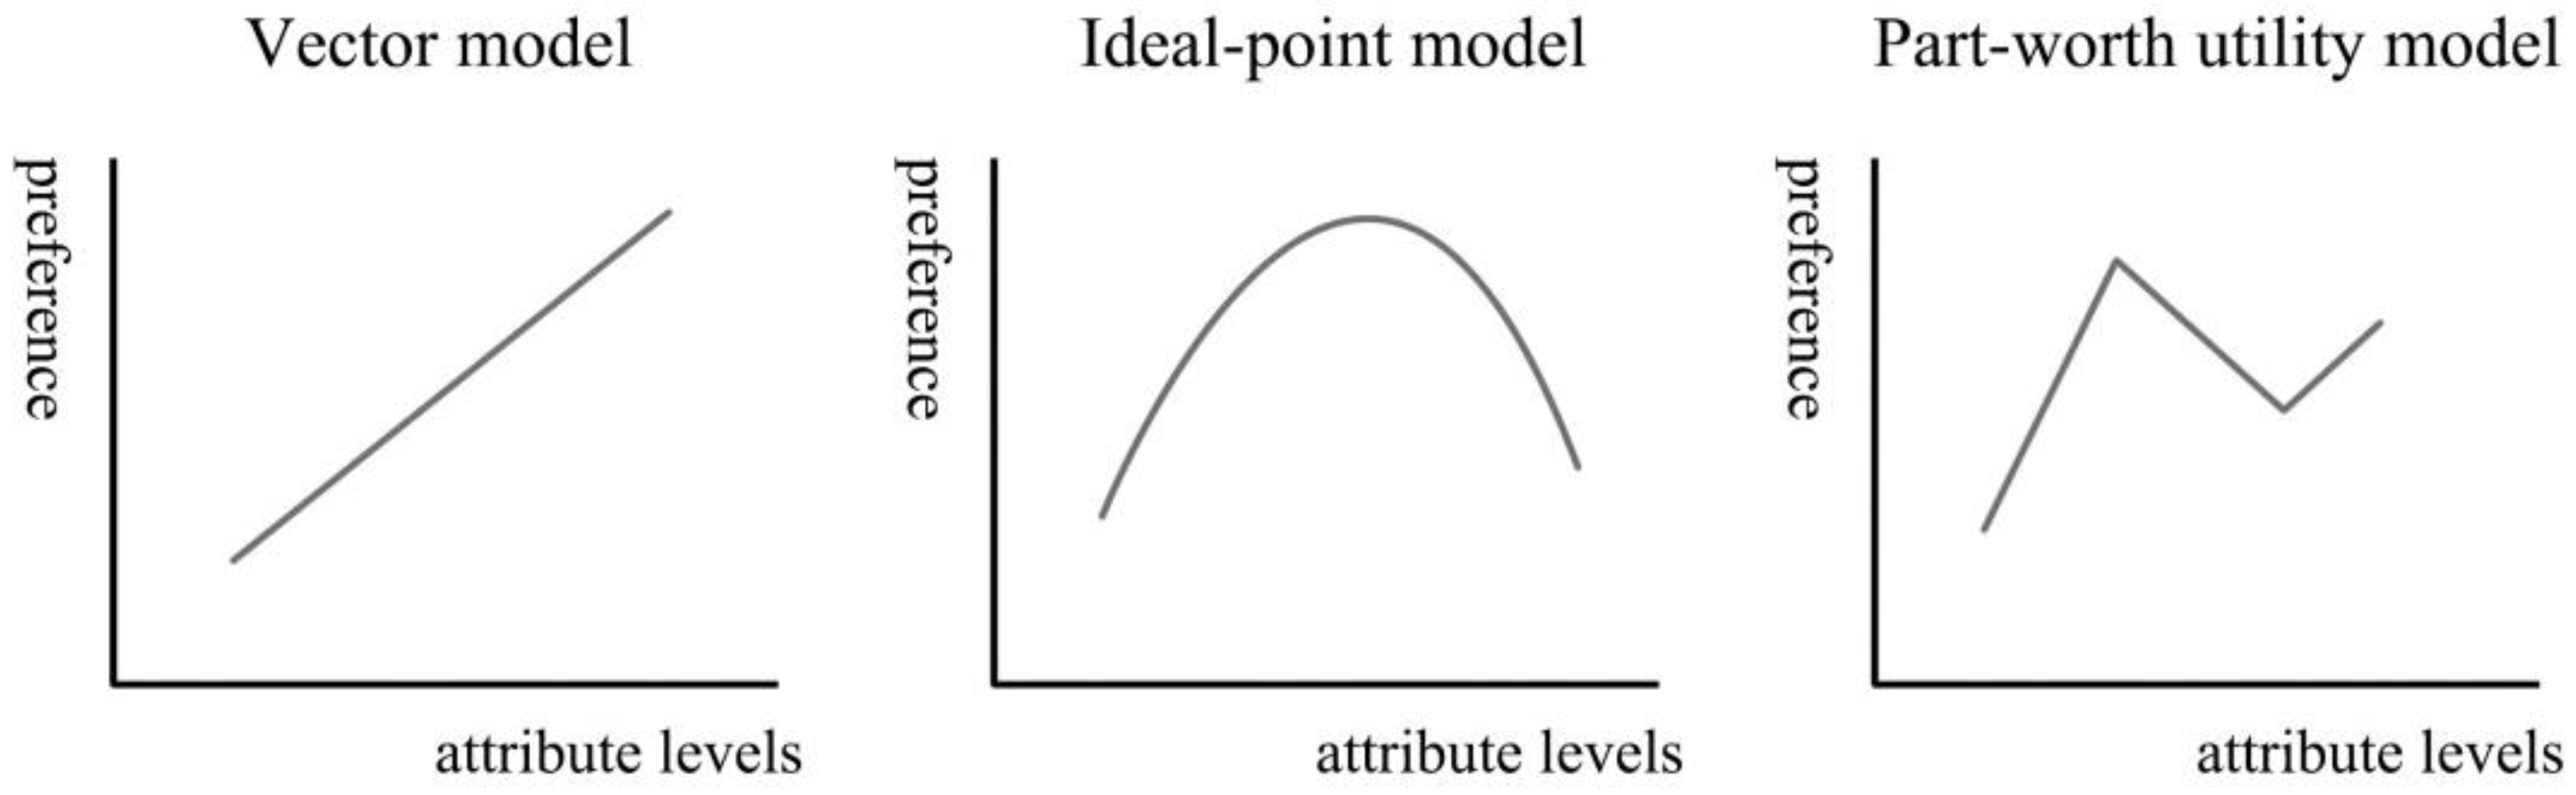
Based on the relationship between levels of different attributes, the preference model can also be divided into the vector model, ideal-point model, and part-worth utility model as shown in Figure 3. To determine whether the constructed preference models have the prediction capability, typically Pearson’s R and Kendall’s tau are used as the indices, whereby both indicate that the prediction is more precise if these two values are closer to 1 [26].
In this research, it is assumed that consumers’ judgment of the forms is constructed by various types of aesthetic principles, and therefore the required attributes in the conjoint analysis are namely various types of aesthetic principle. The levels are namely aesthetic measures which are values between 0–1. The combinations of attributes and levels will form different independent variables. In addition, the dependent variables are namely the subject’s preferences. For the selection of the preference models, since the trend of subjects’ view of the aesthetic principles and their values are not known previously, each aesthetic principle value will be viewed as a class variable. Therefore, the conjoint analysis will be conducted by the selection of part-worth utility models.
To determine whether the subjects possess the contemplated preference models for the preferred forms, the two indices of Pearson’s R and Kendall’s tau can be utilized as the assessment basis. If these two values are provided with a certain degree of levels, it not only indicates that the preference models are accurate in terms of the predictions, but also confirms that the subjects indeed have a certain degree of tendency for their preferences.
2.3. Cluster Analysis
Cluster Analysis is a way to categorize the observed samples or the variables of the data into each cluster. That is, objects which have not been categorized are gathered in the same group according to their degrees of similarity. This approach means that those which are in the same cluster possess a high degree of homogeneity, and samples in different clusters possess a high degree of heterogeneity. A large portion of the applications of cluster analysis belong to the category of exploratory research, which can be utilized for data simplification or for generating the segmentation of research targets.
There are two major types of segmentation by the cluster analysis: hierarchical and non-hierarchical approaches. There is also the two-step approach, which combines these two types of methods. The hierarchical approach connects the individuals according to a specific distance that has been measured or the similarity of individuals, but the segmentation count is not known beforehand. In addition, the non-hierarchical approach determines the segmentation count of the samples beforehand based on the results of previous studies or the researchers’ subjective cognition.
There are many different ways for the cluster analysis to measure the similarity of research samples, including the methods of nearest neighbor, furthest neighbor, average linkage, centroid clustering, median clustering, and Ward’s method. In addition, the measurements between clusters can also be divided into distance measures and association measures. The approach of distance measures is to present the similarity of research samples quantitatively, while the input of the association measures is qualitative data.
In this research, the part-worth utilities sequence for each subject on different aesthetic principles, which was obtained by conjoint analysis, will be viewed as the quantitative distance data input to conduct the cluster analysis. Since the count of aesthetic tastes groups will be divided into is still unknown, hierarchical cluster analysis has been adopted. In addition, the measurement of within-groups linkage, which is less impacted by extreme values, has been adopted in this research.
3. Design Execution and Result
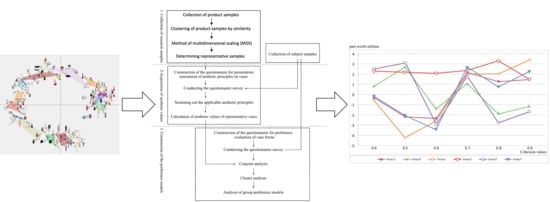
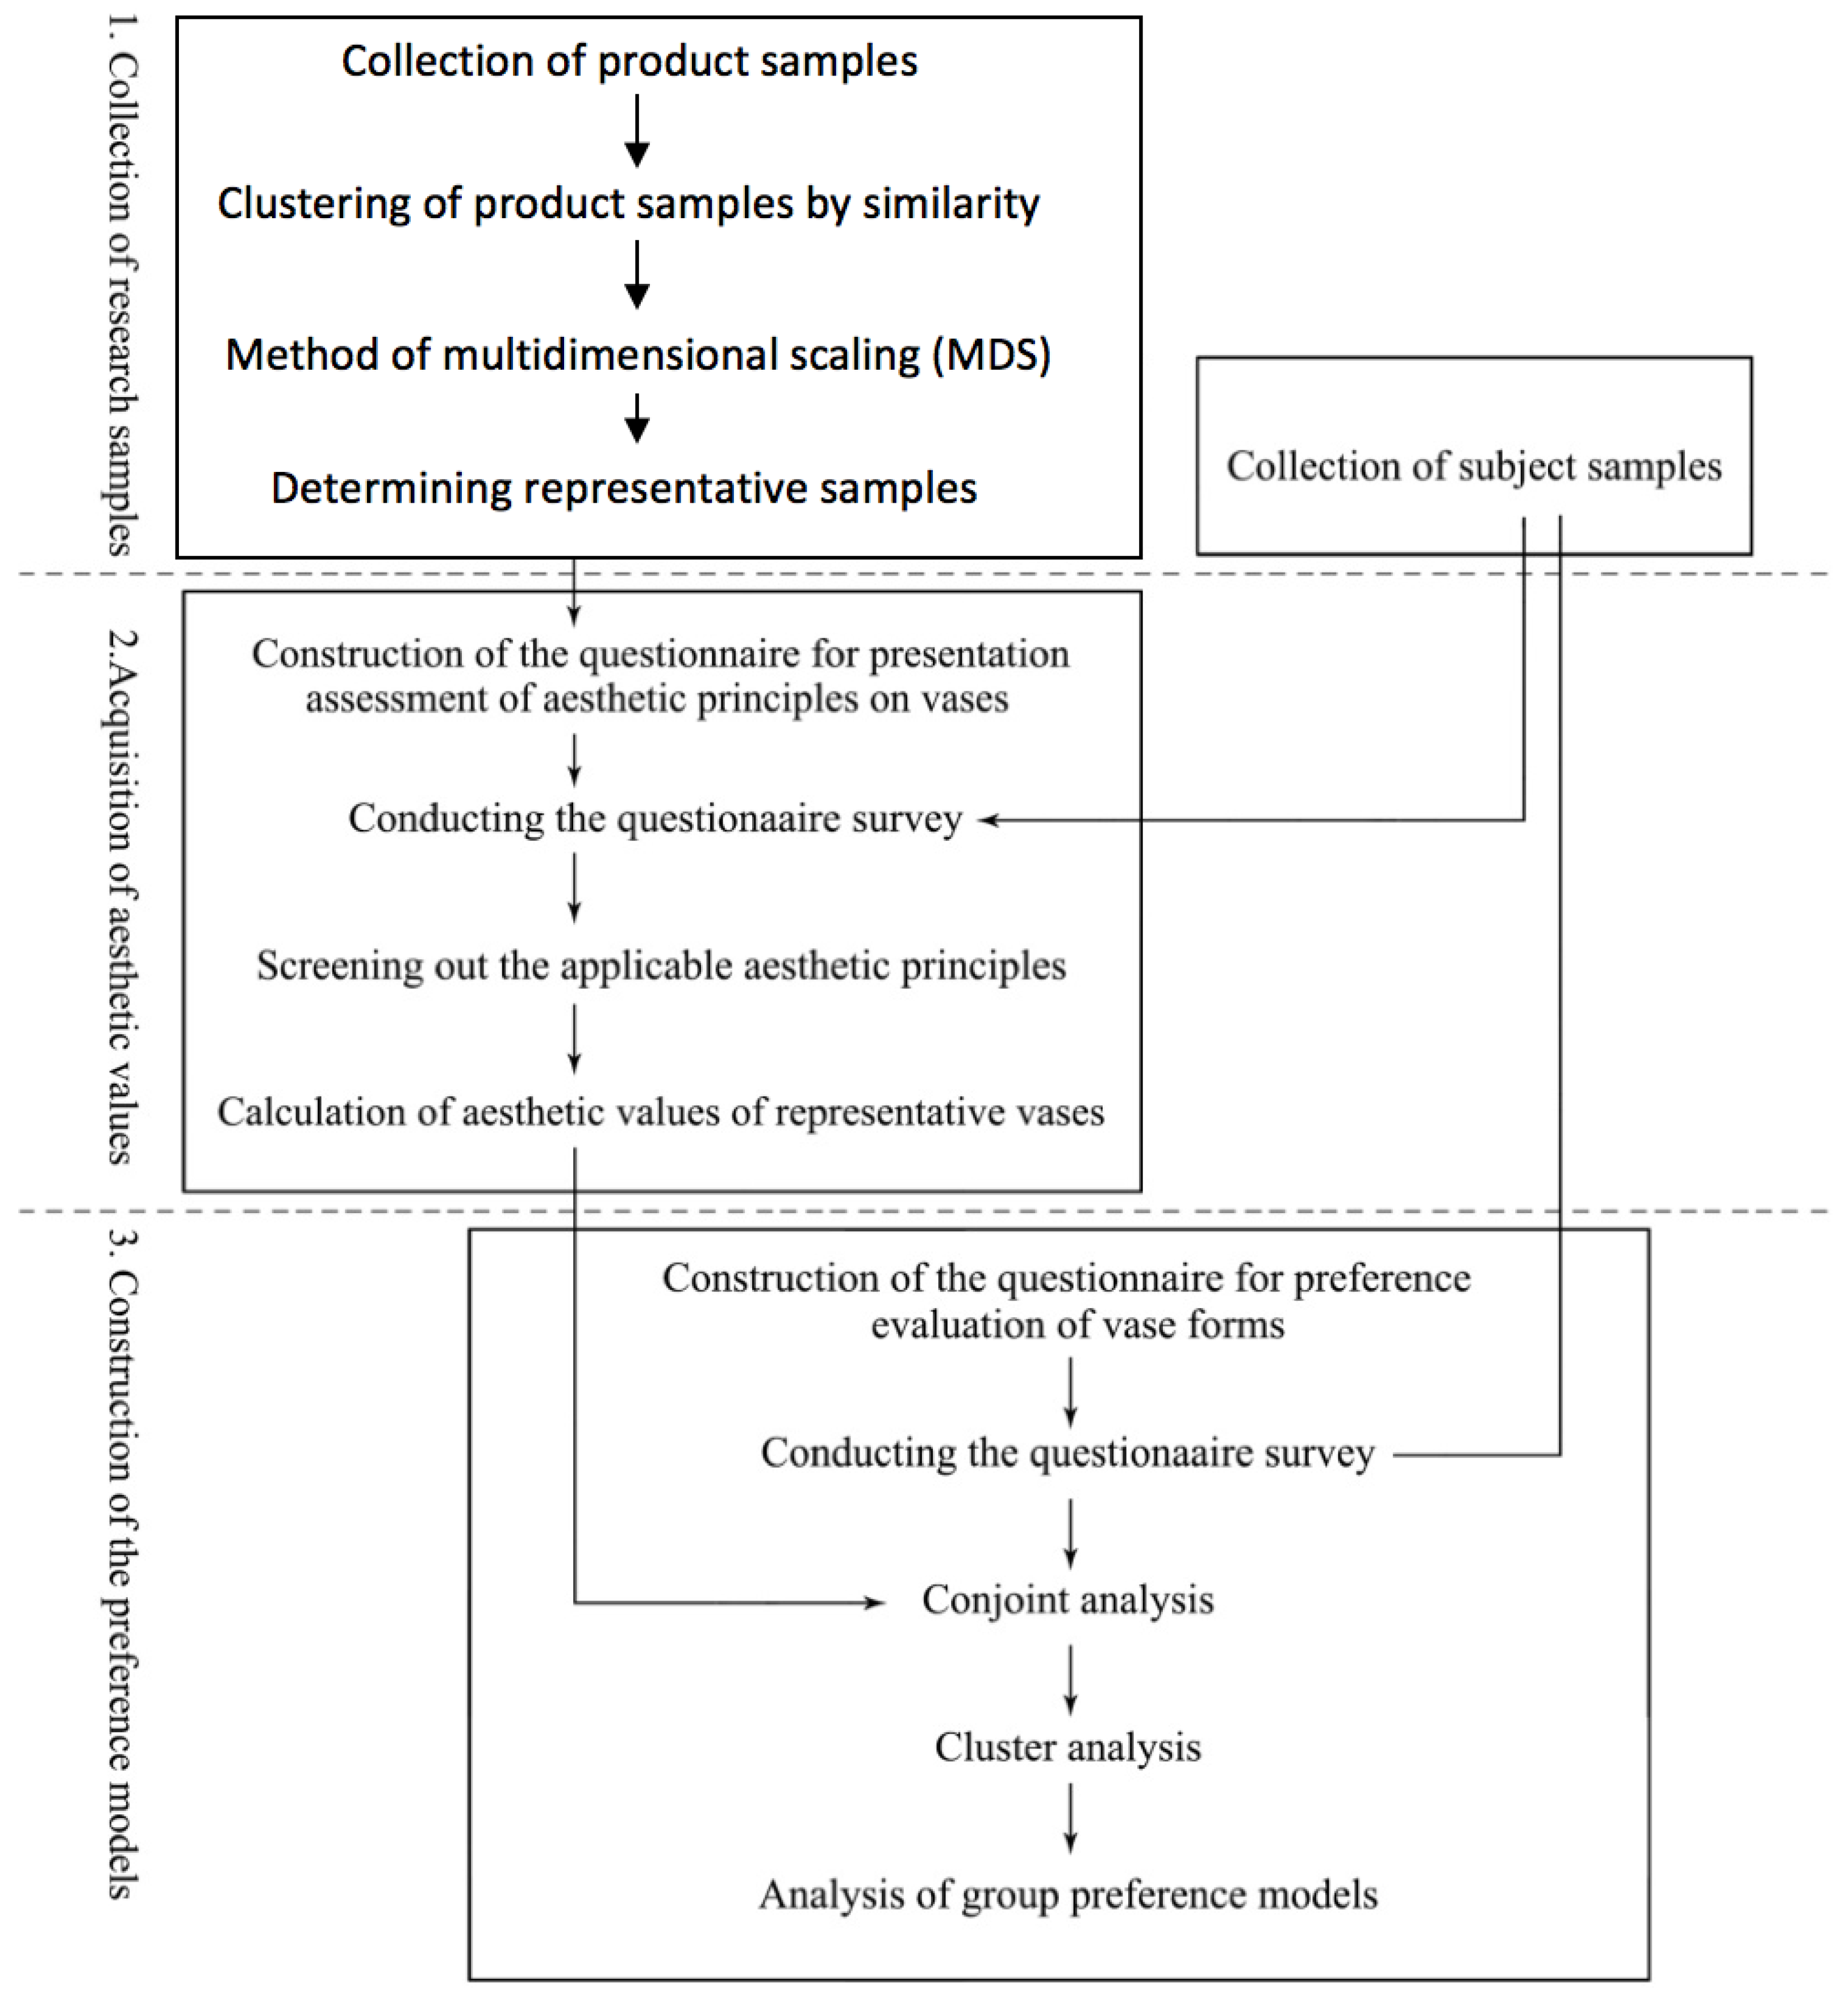
The complete process planning of this research includes three major stages, which are shown in Figure 4.
3.1. Stage 1-Collection of Research Samples
The selection of product sample has to get rid of the functional factors which might influence consumers when evaluating products. Such a way for selecting the sample will make the results of this research even more persuasive. Thus, the product sample will be selected that meets the requirements below:
- The product functions have already been well-developed. In addition, the functions will not differ much when the samples are different.
- For consumers to make a real decision of buying that product, they choose and buy it based on their form preference.
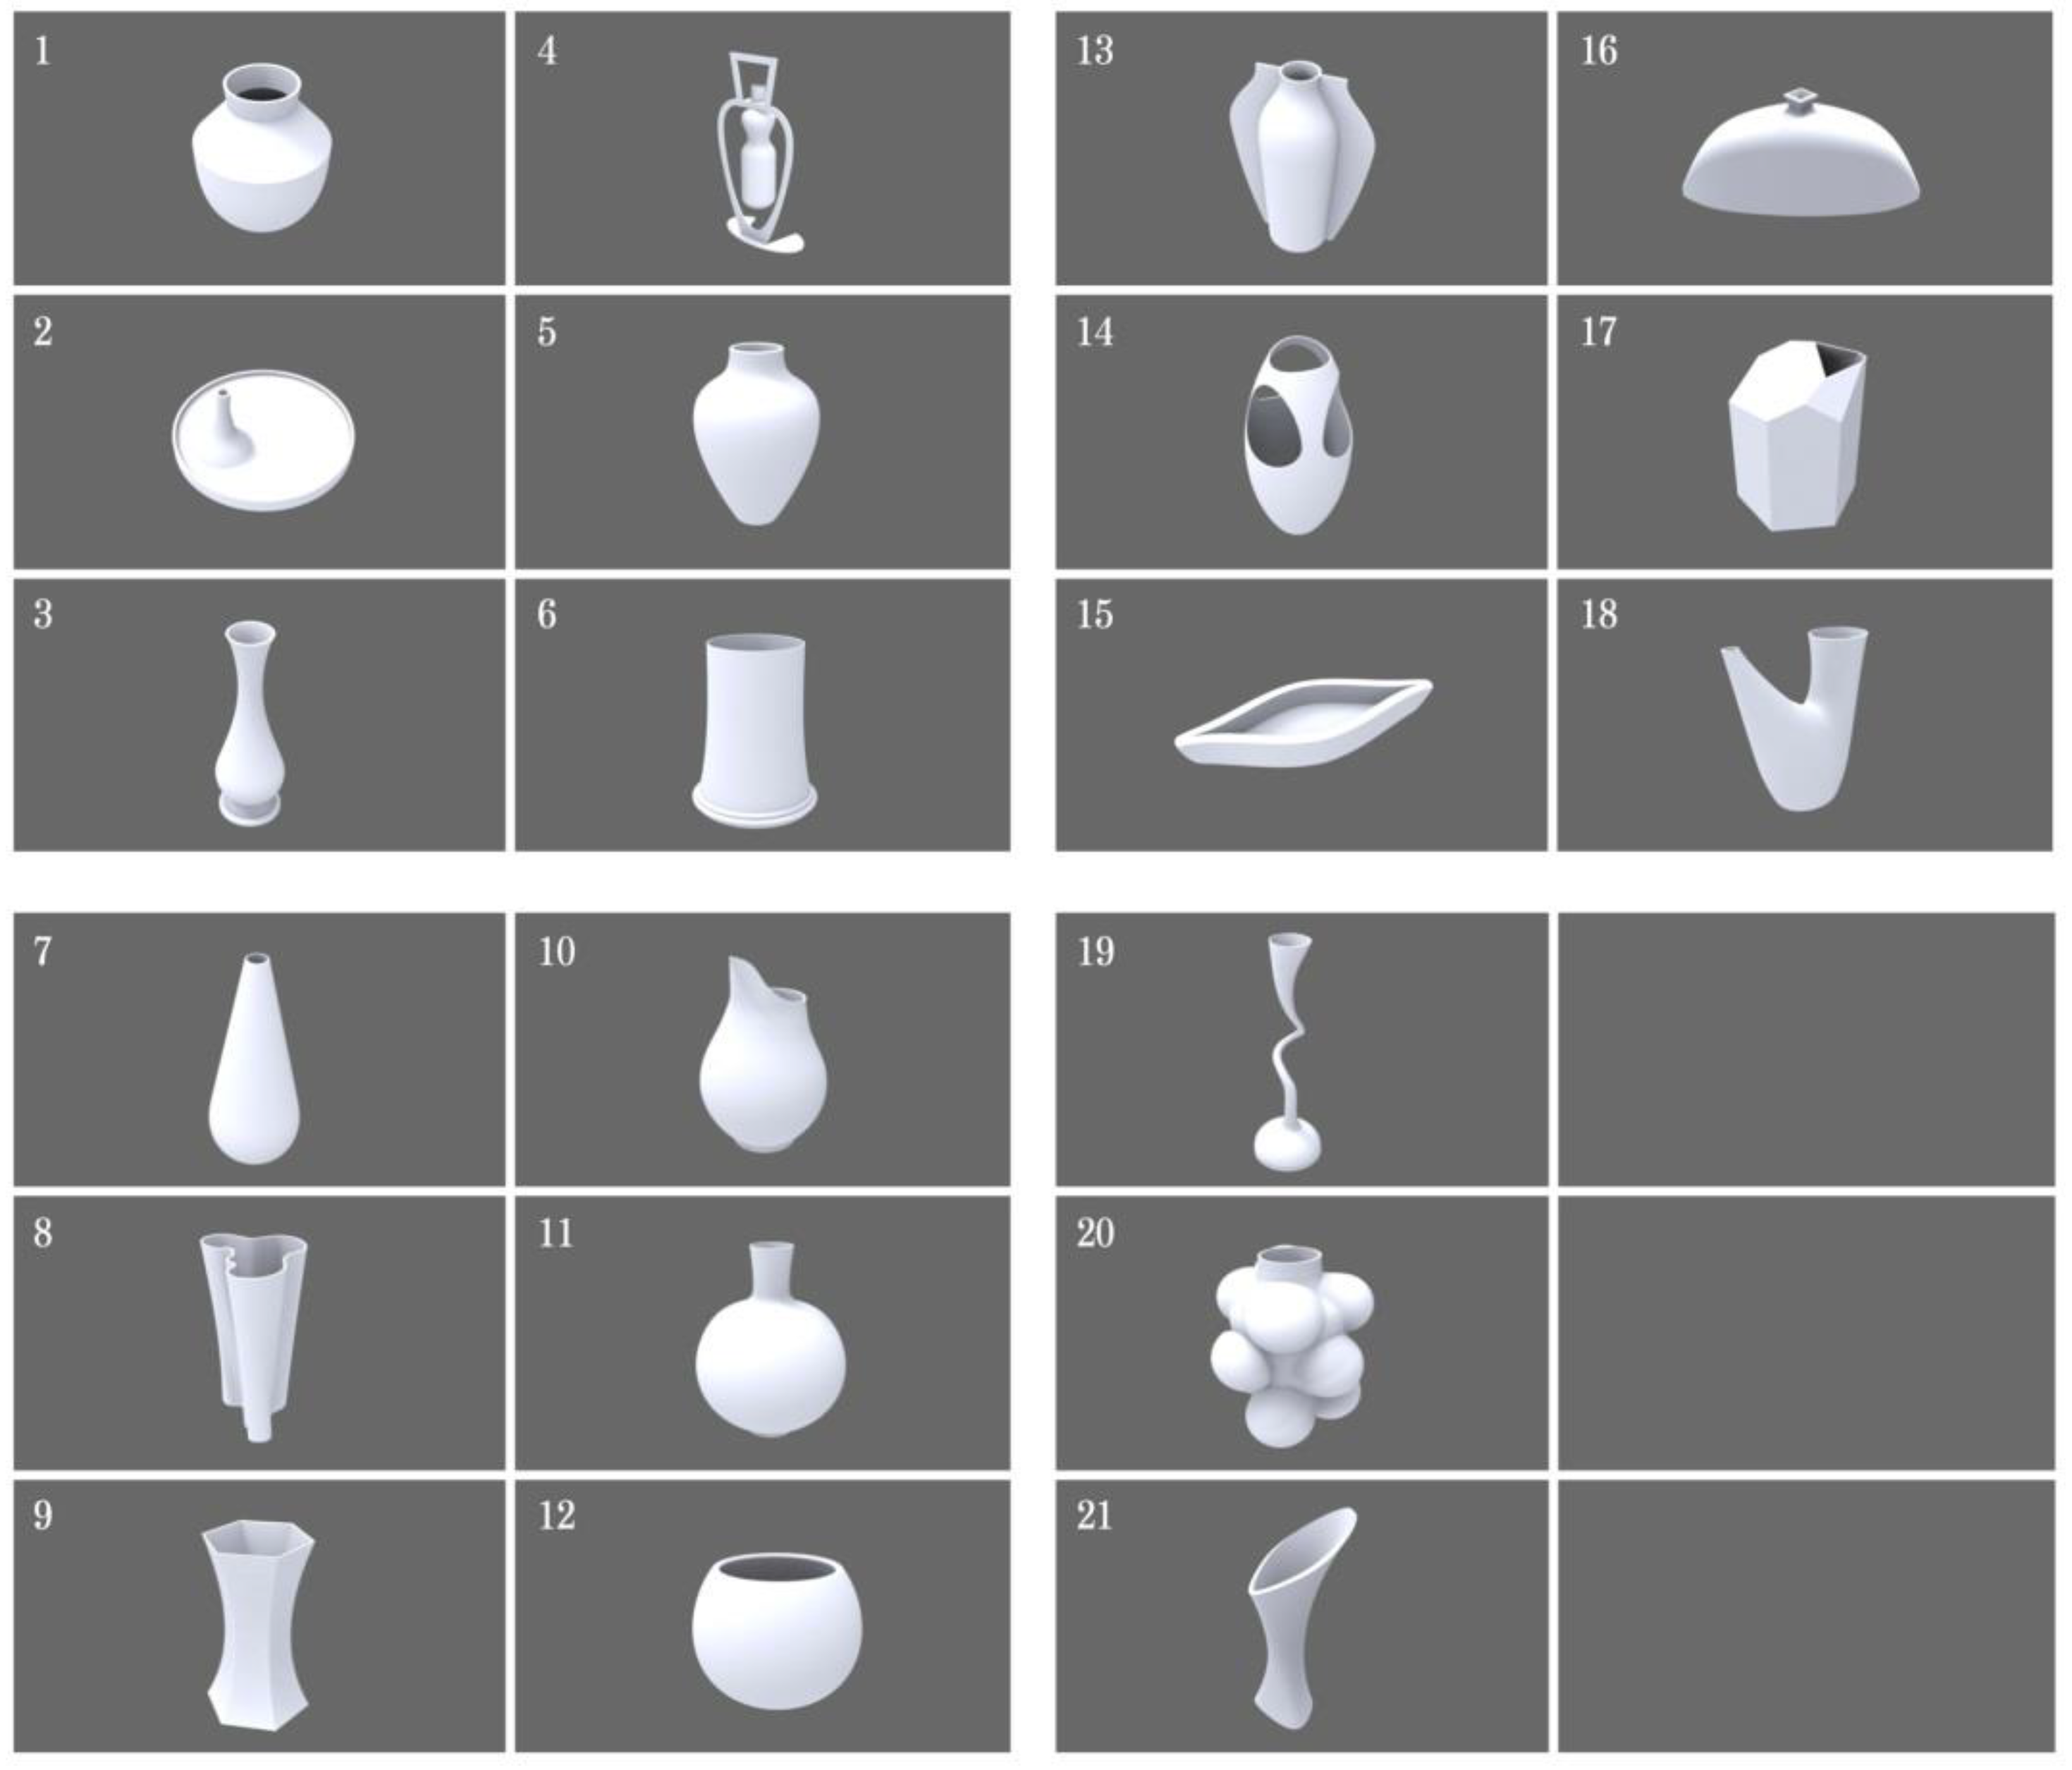
According to the requirements, “Vases” were selected as the product sample in this research for the investigation of preference models. 21 vases were collected via the Internet, books, etc. All these 21 vases were constructed by SolidWorks or Rhino for the 3D models and rendered by KeyshotVR under the same conditions. After that, all the 3D files were hyperlinked in PowerPoint to create the questionnaire attachment for subjects’ preference evaluation, as shown in Figure 5.
Except for the product samples, we also looked for and numbered the subject samples in advance in order to conduct the follow-up stages. For a pre-specified range of age and occupation, we focused on students in junior colleges and graduate schools. In addition, they were classified by two class variables-their genders, and whether they had any design background-to establish the diversity of subjects. A total number of 107 subjects was collected, and the subject composition is shown in Table 1.
3.2. Stage 2-Acquisition of Aesthetic Values
After the collection of product samples, we need to use the evaluation model of aesthetic measure to analyze the vase forms. The physical parameters of vase samples for the calculation of each aesthetic principle can be obtained by the functions of “Mass Properties” and “Measure Tool” in SolidWorks. These parameters can be substituted into the equations of aesthetic principles in the evaluation model of aesthetic measures, and the objective measures of Symmetry, Minimalism, and Cohesion can be obtained. The physical parameters required by each aesthetic principle are described in Section 2 and the measures of aesthetic principles can be obtained accordingly.
The perception of human beings is usually not capable of precisely determining the aesthetic presentation of forms as compared to the measures calculated by the aesthetic equations. As long as the differences between aesthetic measures are not large, the perceptions are generally similar to people. Therefore, the numbers of the fractional part of the aesthetic values that are too far behind the decimal point are meaningless. Additionally, it is not an easy task to create precise forms that completely comply with the exactly aesthetic values during the design stage. Thus, the aesthetic values can be directly rounded off to one decimal place.
The aesthetic measures of 21 vase samples in the principles of Symmetry, Minimalism, and Cohesion are shown in Table 2.
The values contained under the principle of Symmetry are one of the seven values 0.3, 0.4, 0.5, 0.7, 0.8, 0.9, and 1.0; the values for Minimalism can be any of the five values 0.1, 0.2, 0.3, 0.5, and 1.0; the values for Cohesion can be any of the six values 0.4, 0.5, 0.6, 0.7, 0.8, and 0.9. The missing data, which includes 0.6 for Symmetry and 0.4 for Minimalism, will be estimated and obtained by Linear Interpolation when the preference model is established.
3.3. Stage 3-Construction of the Preference Models
After the acquisition of aesthetic values of vase forms, the subjects’ preferences for them need to be known as well to construct the preference models. The investigation survey of preferences has been conducted in the way of questionnaire, and is assisted by the 3D vase model attachment. Before the questionnaire was started, the operator especially emphasized that the subjects should exclude extra factors such as the functions of vases, matching with flowers, etc. They should carry out the preference considerations just based on the form of vases.
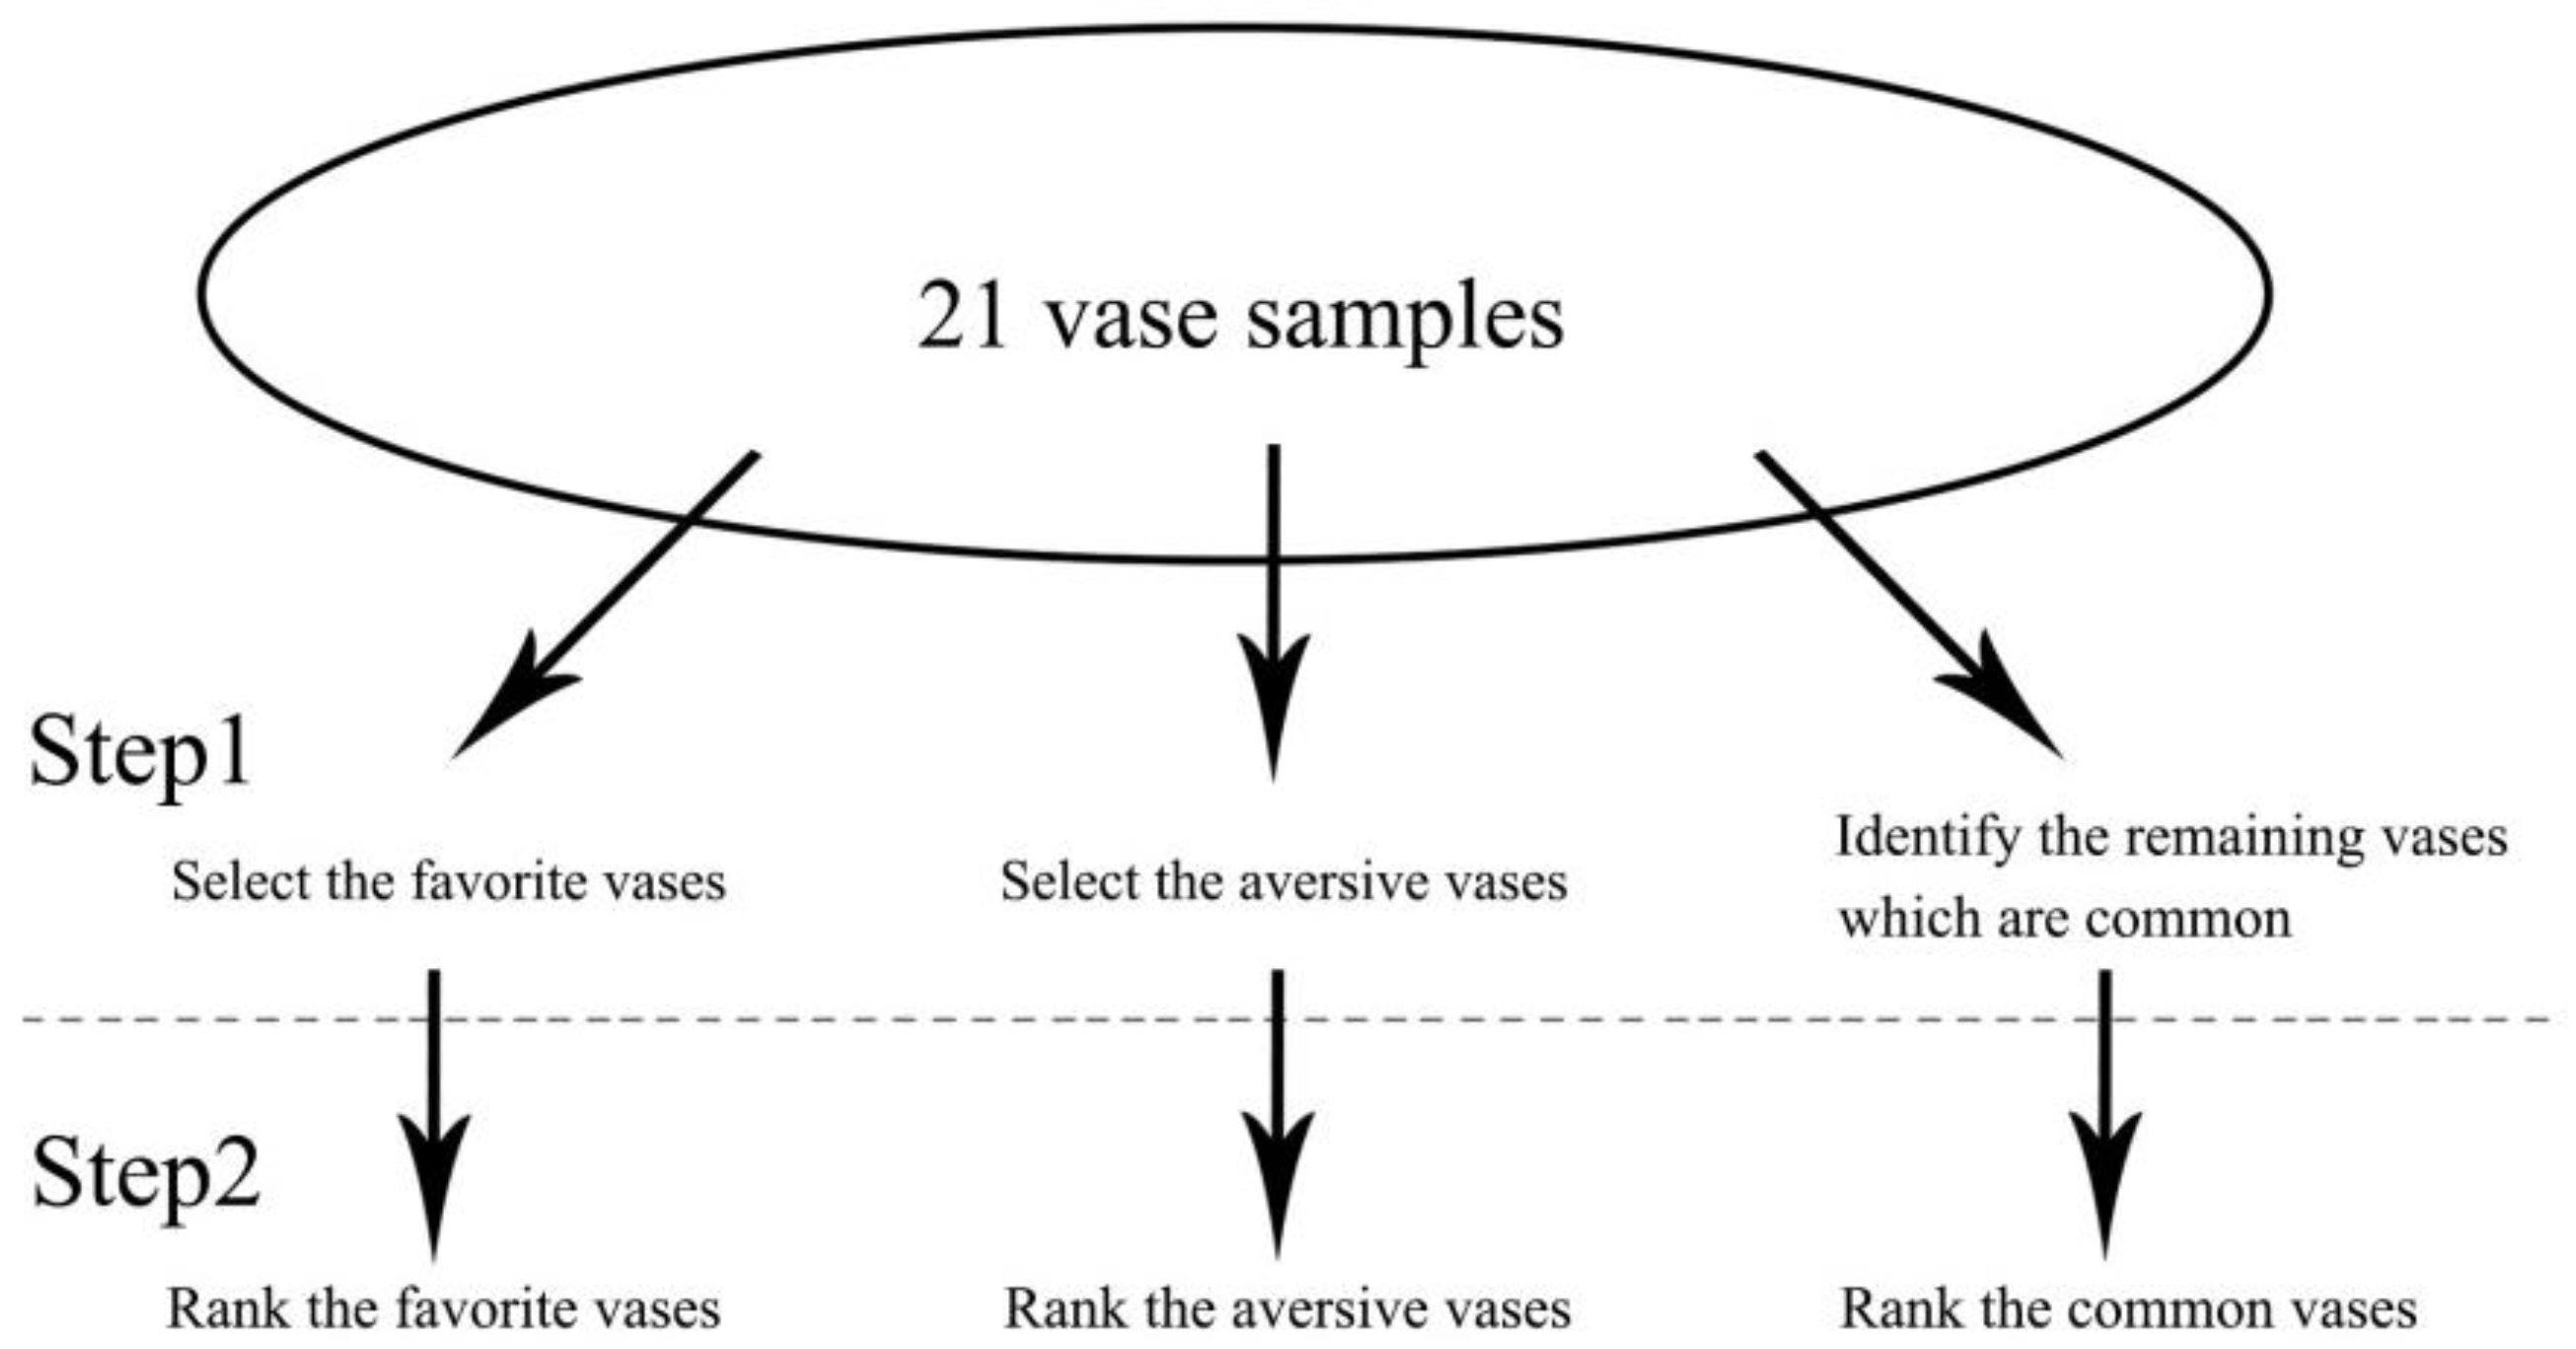
Firstly, subjects were asked to roughly pick their favorite vases from all of the samples, and it was especially defined what the so-called “favorite” means: that they are attracted to such a vase at the first view, and want to own it. After that, they were asked to pick the vases from those remaining which are aversive, where “aversive” means those vases the subjects do not want to own. Finally, subjects were asked to identify those vases which were not selected during the two steps of “favorite” and “aversive”, i.e., the subjects feel these vases are “common” vases based on their feeling. That is, the subjects do not especially like nor dislike these vases, but if there were no better vases, the subjects would still select to own them. The reason for the structure of the selection process is that subjects have a more definite feeling toward extreme values, which are the group of “favorite” and “aversive”. Such a selection method is to ensure the accuracy of the preference classifications.
After the rough selections, subjects were then further asked to rank a definite sequence for each segmentation group, which is from relatively like to relatively dislike. This way the ranking of each subject for the preference of all vases can be determined. The reason for firstly carrying out rough preference classifications is to expect a prior compression of the assessment amount for subjects, which makes the final result even more precise. A schematic of this process is shown in Figure 6.
The preferences of 107 subjects were recorded. The subjects’ ranking of these 21 vase samples are respectively recorded as P21~P1, which start from the most liked to the most disliked.
Therefore, the relationships between preferences and forms can be understood by means of conjoint analysis. The aesthetic values of Symmetry, Minimalism, and Cohesion of vases and subjects’ preference ranking were input into the SPSS syntax of conjoint analysis.
The first row of DATA LIST is the definition of data meaning, and it includes the numbers of 1~107, which represent the indices of subjects in the first row. The numbers in the rest of the columns represent the corresponding vase sequences from P21 to P1, which were ranked by each subject; the portions of BEGIN DATA to END DATA are namely the data input, which is the questionnaire result; row 111 is the data of product samples, which contains the aesthetic values of vase forms. This data was saved in advance as a SPSS file format. The data of DISCRETE in row 112 represents the selection of preference models. Since subjects’ preference trends in aesthetic principles is still unknown, there is no presumption in this research; thus, each attribute and level will be viewed as a class variable for the implementation; the output storage syntax is in row 118, and the part-worth utilities of result can be obtained.
Each subject’s part-worth utilities for each aesthetic principle value are known from the results. When the part-worth utility is larger, the degree of influence of theses aesthetic values on subjects’ preference ranking (the ranking for a larger P) is higher. That is, the subjects place more emphasis on these aesthetic values.
The two values of Pearson’s R and Kendall’s tau can also be obtained from the conjoint analysis. These values can function as the indices of the effectiveness of prediction. Better prediction also indicates that an apparent preferences trend exists for each subject toward various types of attributes and levels. Both of these two indexes are better when they are closer to 1. It is known that most of the subject’s Pearson’s R and Kendall’s tau values are above 0.8, which are both quite good. This result proves that every person does have the certain preference models for the forms.
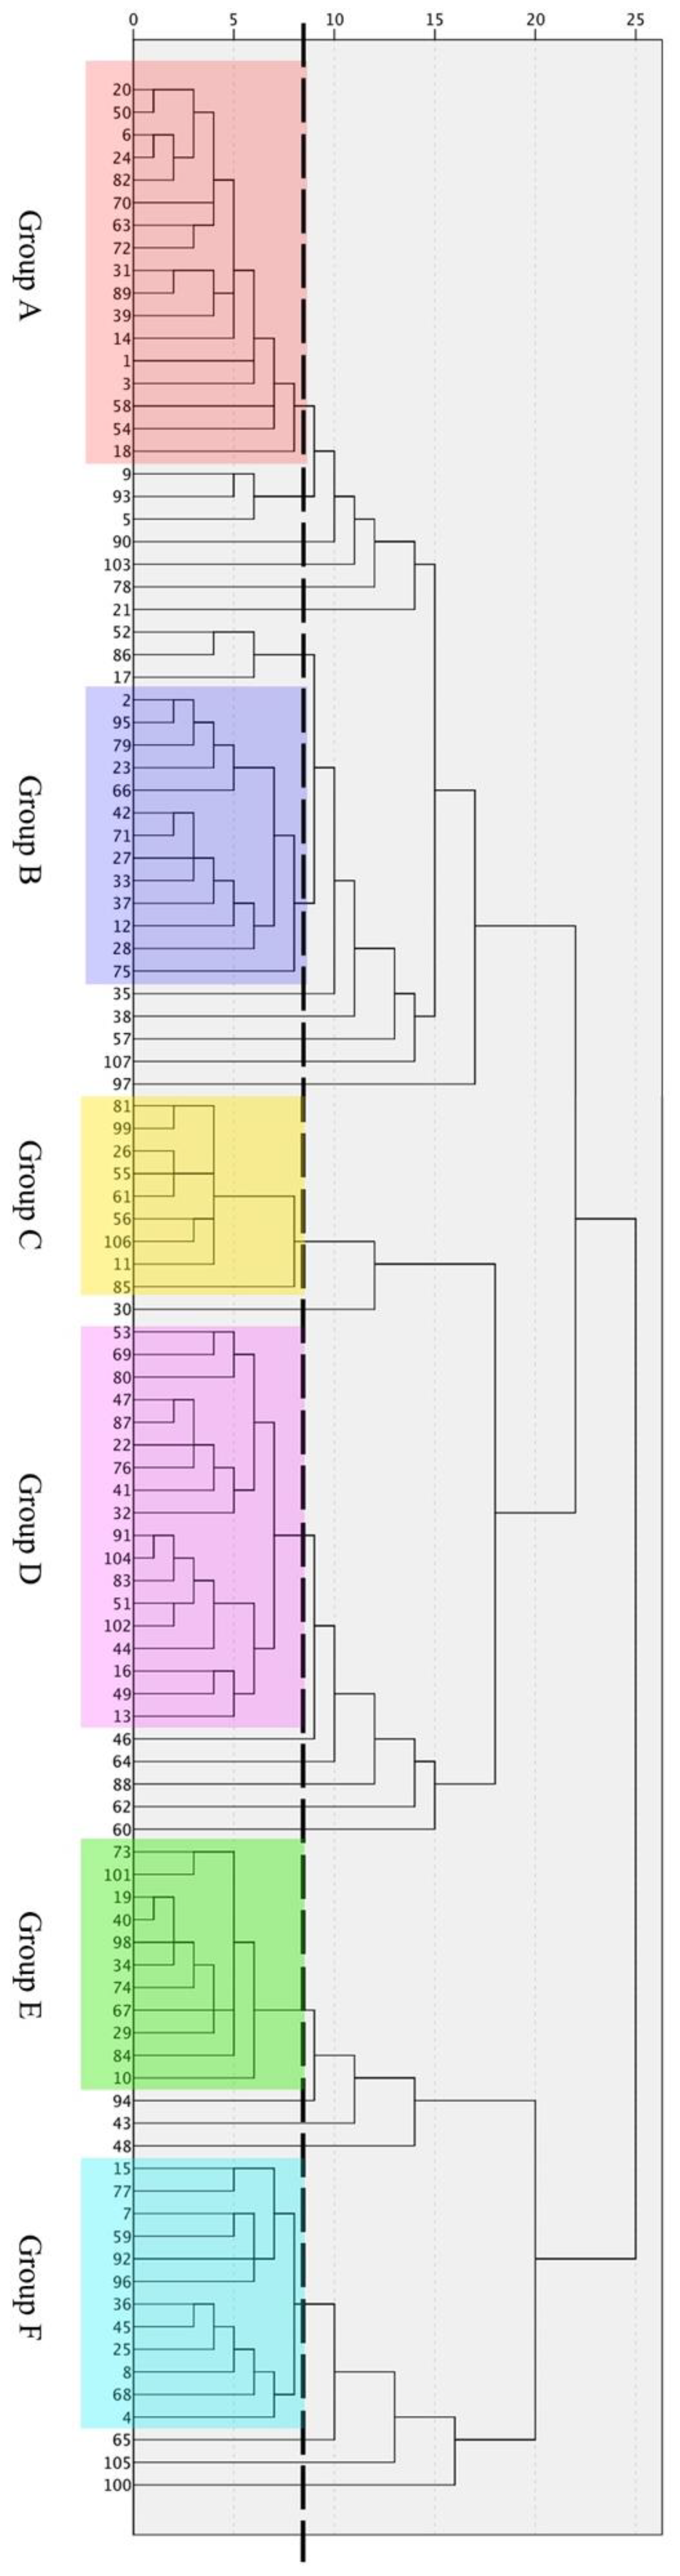
Furthermore, the part-worth utilities of 107 subjects toward the aesthetic values, which were obtained by the conjoint analysis, are segmented by the hierarchical cluster analysis according to the sequence similarity, which means those who have similar aesthetic tastes. The cluster method that was utilized is Within-groups linkage, and the method of measurement is Euclidean distance. The output tree diagram is shown in Figure 7. To ensure that the construction of preference models can make the prediction results even more precise, the subjects are divided into the same group only if their homogeneity reaches the criteria in the cluster analysis. The criteria are shown as dashed lines of Figure 7. In addition, the obtained clusters are marked in color blocks, forming 6 groups with number A, B, C, D, E, and F. The other subjects, who are not included in these 6 groups, may possibly have more unique aesthetic tastes, and are not considered in the following analysis of group preference models.
Based on the cluster results, arithmetic averages of subjects’ part-worth utilities of each aesthetic value in each group were calculated to obtain the representative part-worth utilities of each group, and they were rounded off to the second decimal place. The aesthetic values are, respectively, 0.3, 0.4, 0.5, 0.7, 0.8, 0.9, and 1.0 for Symmetry, 0.1, 0.2, 0.3, 0.5, and 1.0 for Minimalism, and 0.4, 0.5, 0.6, 0.7, 0.8, and 0.9 for Cohesion. At the same time, the missing data: the part-worth utilities of Symmetry 0.6 and Minimalism 0.4 for each group was estimated by the Linear Interpolation, as recorded in Table 3.
4. Discussion
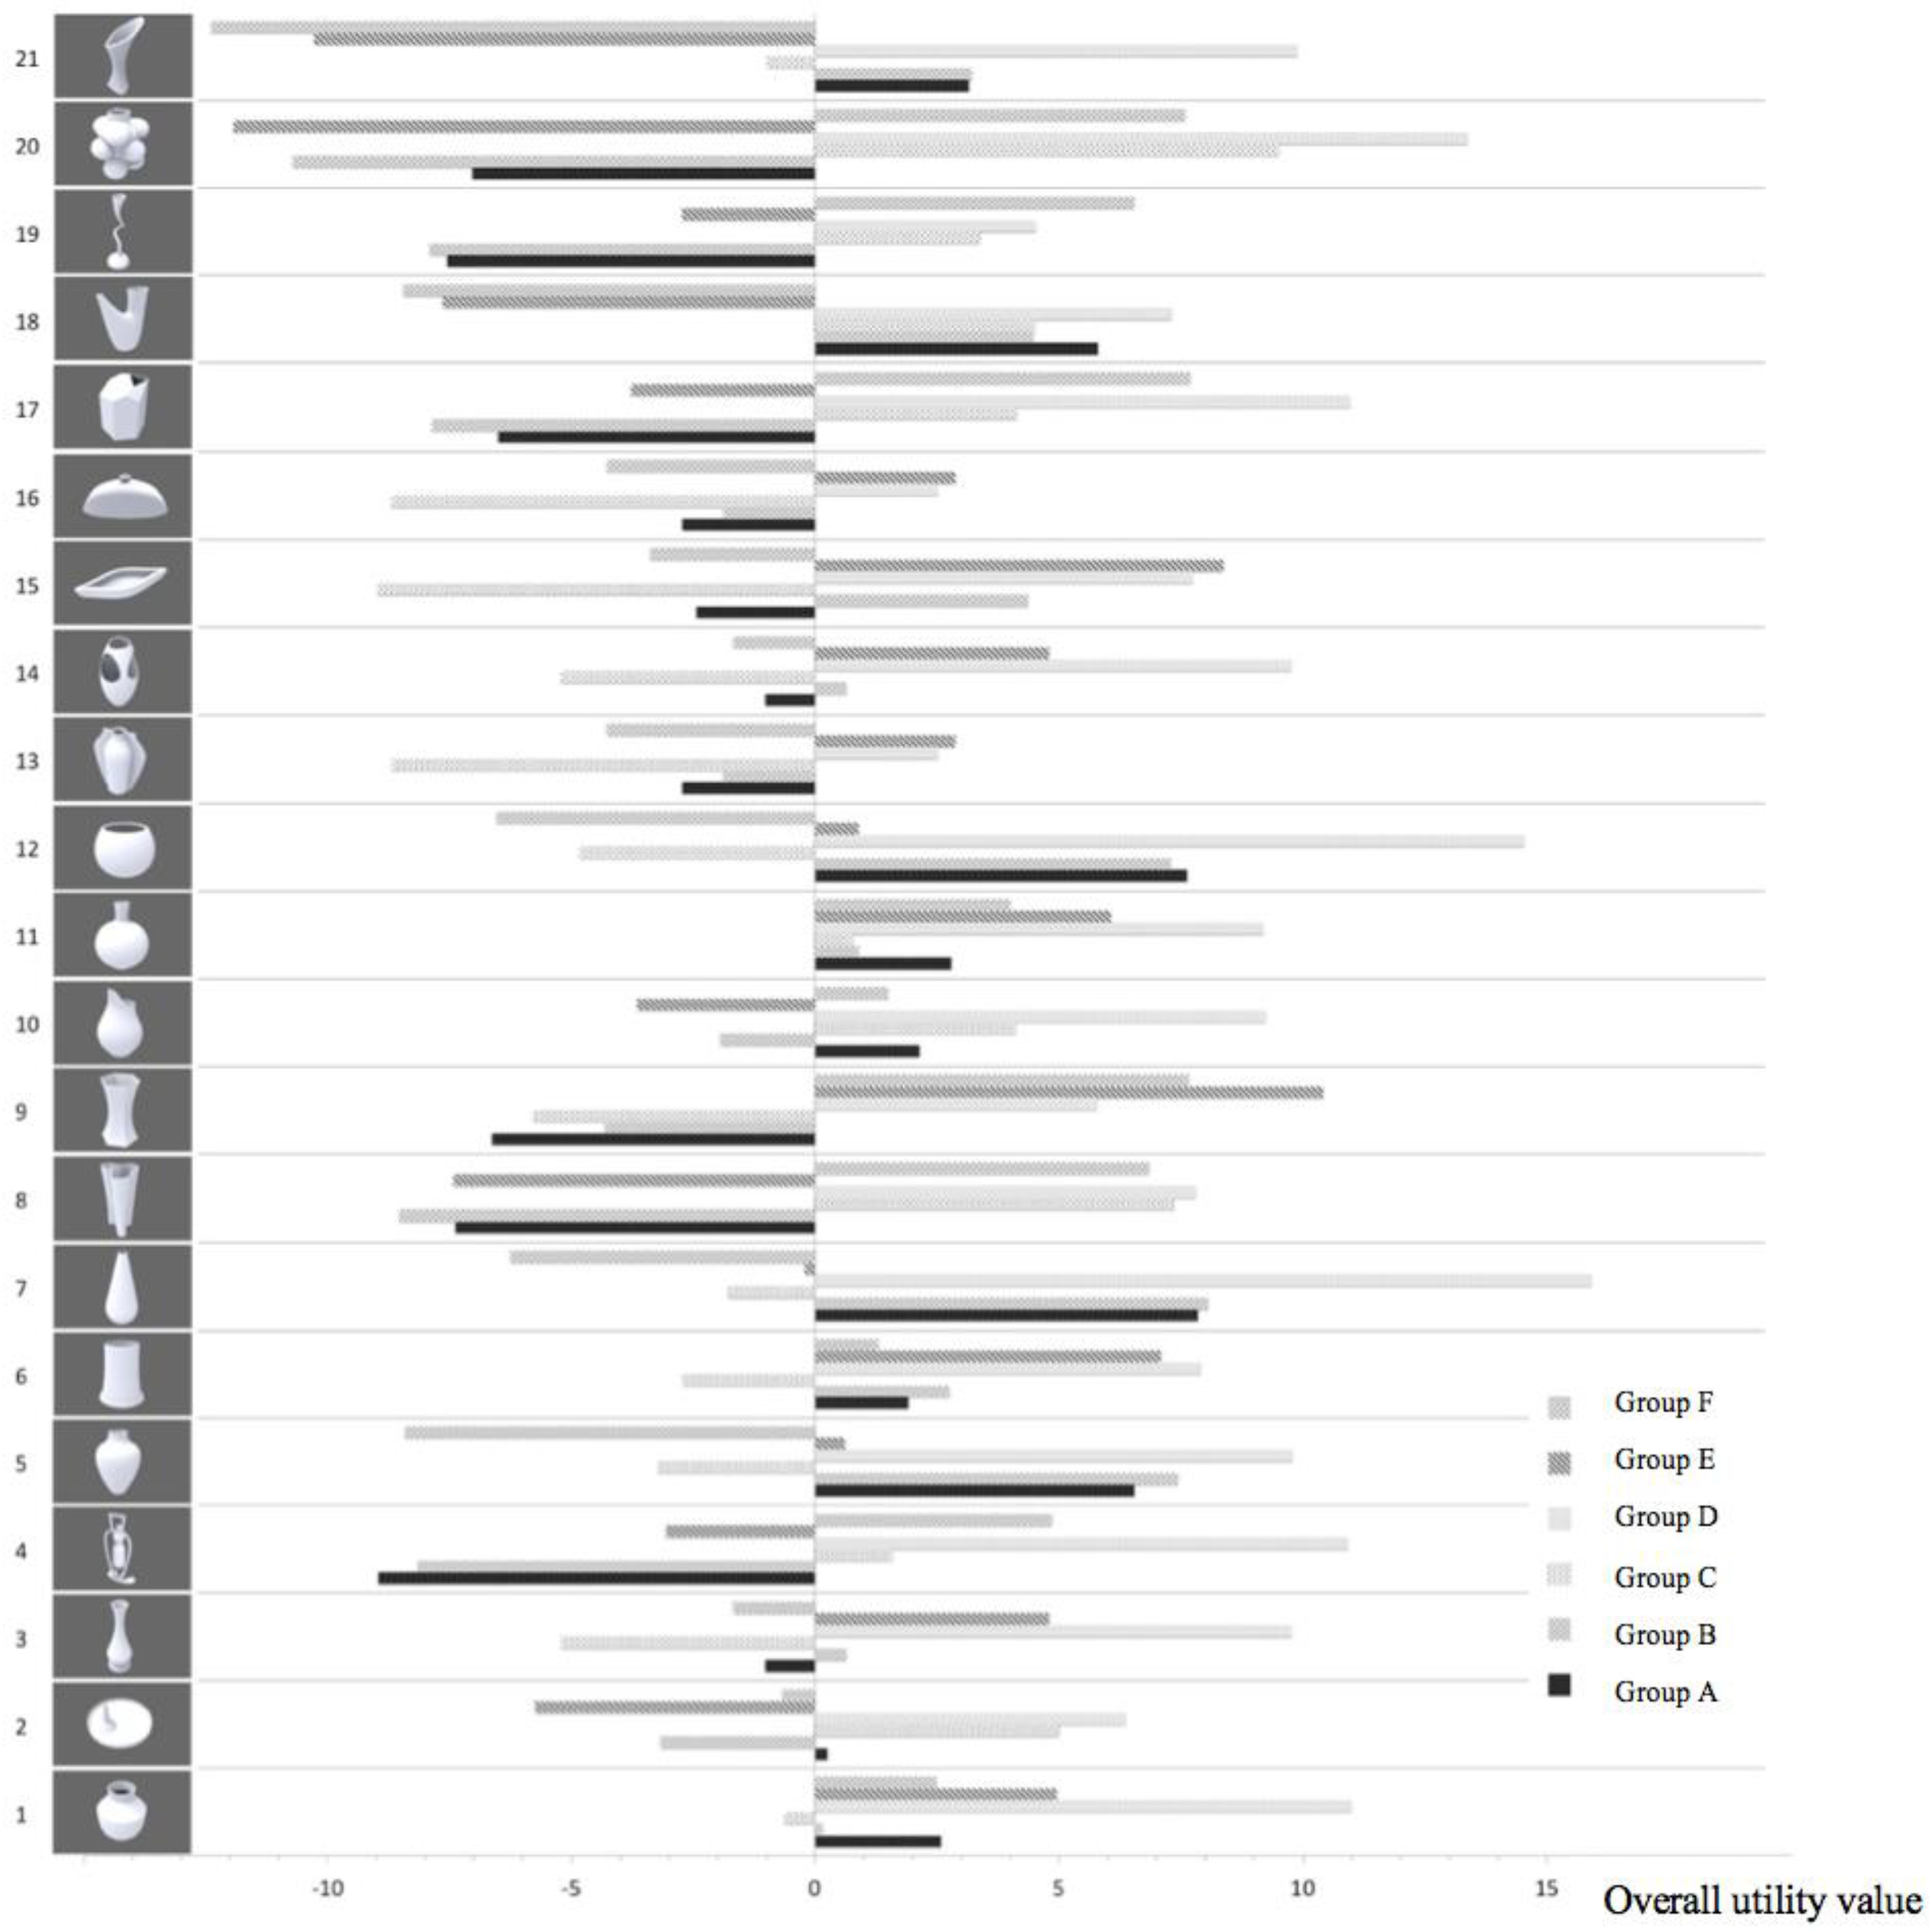
The results of the conjoint analysis of the participants’ preferences indicated 6 groups of different preferences for vase forms. The figure of preference models can by analyzed by the improved Kano model. The overall utility value can be obtained by summing up the part-worth utility values in order to determine the ranking of each group’s preference of vase forms.
4.1. Group A
No apparent trend exists for Group A’s preference of vase symmetry. Its figure of preference model contains 6 line segments, which are respectively the one-dimensional quality between 0.3~0.4, reverse quality between 0.4~0.5, reverse must-be quality between 0.5~0.7, one-dimensional quality between 0.7~0.8, reverse quality between 0.8~0.9, and one-dimensional quality between 0.9~1.0. The correlation between the part-worth utility values and the values of Symmetry resonates to a larger extent. It is known from the curve that the part-worth utility value is much larger when the value of Symmetry 0.4.
The correction for the Minimalism preference is positively proportional. That means the part-worth value increases with a higher value of Minimalism. It behaves toward one-dimensional quality but drops a bit when approaching the extreme Minimalism of 1.
The curve of the Cohesion preference model includes 4 line segments, which are respectively the inverse must-be quality between 0.4~0.6, one-dimensional quality between 0.6~0.7, reverse attractive quality between 0.7~0.8, and positive attractive quality between 0.8~0.9. In general, the part-worth utility values are positive for high Cohesion (above 0.7) and negative for low cohesion (below 0.6). It is known that the participants prefer vase forms of higher level of cohesion. However, the highest part-worth utility value occurs at the cohesion value of 0.7.
4.2. Group B
Group B’s preference for Symmetry has a peak at 0.7 and it increases in the range of 0~0.7 and decreases beyond 0.7. The part-worth utility value increases in both segments, but has two peaks at 0.8 and 0.4, respectively. Therefore, the figure of preference models is composed of 4 line segments which are the positive must-be quality between 0.3~0.4, reverse must-be quality between 0.4~0.7, one-dimensional quality between 0.7~0.8, and reverse attractive quality between 0.8~1.0. It is known that Group B presents a trend of preference for higher values of Symmetry (above 0.8), since the part-worth utility values are positive.
Group B’s preference for Minimalism is similar to Group A, which indicates a positively proportional correlation. However, the extent of the increasing trend drops dramatically when approaching the extreme Minimalism value of 1.
There is no apparent pattern for Group B’s Cohesion. The figure of preference model comprises 5 line segments, which are the positive attractive quality between 0.4~0.5, reverse quality between 0.5~0.6, one-dimensional quality between 0.6~0.7, reverse quality between 0.7~0.8, and positive must-be quality between 0.8~0.9. It is known that the part-worth utility value for the Cohesion value of 0.5 is much larger than other ranges.
4.3. Group C
The pattern of Group C’s preference for the three aesthetic principles is obvious. For the principle of Symmetry, the preference model presents a reverse quality, despite minor changes in the slopes in the segments of 0.3~0.4 and 0.7~0.8, which present a positive attractive quality and reverse attractive quality, respectively. However, this does not affect Group C’s general reverse quality pattern for Symmetry. They prefer a lower level of Symmetry between (0.3, 0.4) and the part-worth utility value decreases with larger values of Symmetry.
Group C’s preference model for Minimalism includes two line segments that have a one-dimensional quality between 0.1~0.2 and a reverse quality between 0.2~1.0. It is known that they prefer a Minimalism value of 0.2 and the difference form the part-worth utility values of the other values of Minimalism is apparent.
Group C’s preference model of Cohesion includes two line segments, which are the reverse must-be quality between 0.4~0.5 and one-dimensional quality between 0.5~0.9. The Cohesion value of 0.5 forms a trough, with enhanced preference with both increasing and decreasing values of cohesion. Group C’s preference is enhanced, apparently, with increasing values of cohesion. The overall utility values of these 21 vase forms are summed up from the part-worth utility values in order to determine the ranking of Group C’s preference.
4.4. Group D
There is no apparent pattern of Group D’s preference for Symmetry. The figure of preference models contains 6 line segments, which are, respectively, reverse attractive quality between 0.3~0.4, attractive quality between 0.4~0.5, reverse attractive quality between 0.5~0.7, attractive quality between 0.7~0.8, reverse attractive quality between 0.8~0.9, and attractive quality between 0.9~1.0. The turning point of the curve is at the Symmetry value of 0.7, with a symmetrical pattern of the part-worth utility values on both sides. It is known that Group D presents an apparent preference trend at the extreme values of Symmetry at (0.3, 1.0).
Group D’s preference model of Minimalism contains two line segments which are respectively the reverse quality between 0.1~0.2 and between 0.2~1.0. It is known that the preference for Minimalism is apparent at extreme values with positive part-worth utility values except for 0.2.
Group D’s preference model of Cohesion contains three line segments despite of the fact that the overall part-worth utility values are positive. These line segments include the reverse attractive quality between 0.4~0.6, attractive quality between 0.6~0.8, and a reverse attractive quality between 0.8~0.9. Despite of some changes in the slope, the difference is minor in the range of 0.4~0.7. The part-worth utility values are generally the same. However, an apparent enhancement of their preference occurs at 0.8, while the preference decreases beyond 0.9.
4.5. Group E
Group E presents one-dimensional quality toward the overall Symmetry. Their preference is enhanced with a higher degree of Symmetry. However, the part-worth utility values slightly decreases between 0.4~0.5 and 0.8~0.9, which indicates a reverse must-be quality and reverse attractive quality. However, the trend for higher preference at a higher degree of Symmetry still holds.
The figure of preference models for Minimalism can be divided into two segments, which include the positive attractive quality between 0.1~0.2 and the reverse quality between 0.2~1.0. This indicates that Group E’s preference shows a similar trend as Group C’s. The peak occurs at 0.2, as well, and their preference decreases with both increasing and decreasing values of Minimalism.
Group E’s preference model for Cohesion comprises five line segments which are, respectively, the attractive quality between 0.4~0.5, reverse quality between 0.5~0.6, one-dimensional quality between 0.6~0.7, reverse quality between 0.7~0.8, and must-be quality between 0.8~0.9. The trend is similar to that of Group B, while no apparent pattern exists. However, as compared to other values of Cohesion, a clear preference still exists between 0.4~0.5.
4.6. Group F
No apparent trend exists for Group F’s preference model for Symmetry. Variations in the slope of the trend line are apparent. There are six line segments, which include the one-dimensional quality between 0.3~0.4, reverse quality between 0.4~0.5, reverse must-be quality between 0.5~0.7, one-dimensional quality between 0.7~0.8, reverse quality between 0.8~0.9, and one-dimensional quality between 0.9~1.0. It is known that the part-worth utility values are higher at 0.4 and 0.8, while the part-worth utility values are negative in other ranges.
Group F’s preference for Minimalism has a peak at 0.2 and the part-worth utility value decreases when the value of Minimalism is larger or smaller than 0.2. The trend indicates positive attractive quality between 0.1~0.2 and reverse quality between 0.2~1.0. Although Group F’s degree of preference at 0.1 is smaller than that at 0.2, the part-worth utility value is still positive. This indicates that Group F prefers vase forms of lower degree of Minimalism.
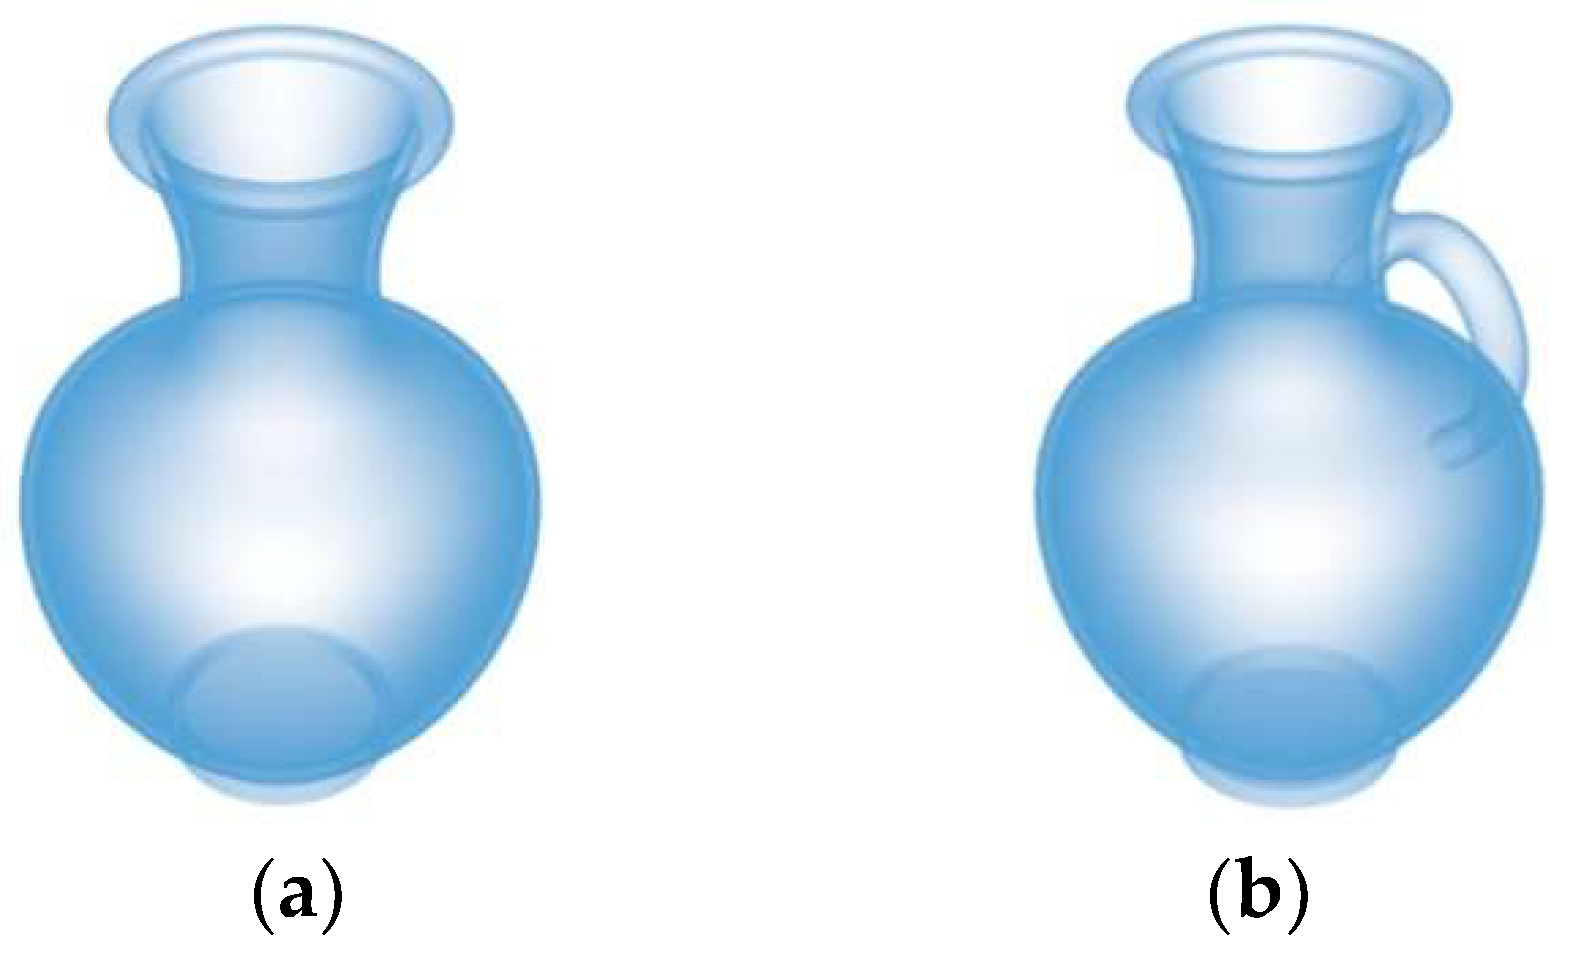
Group F’s preference for Cohesion comprises four line segments, which are, respectively, the reverse must-be quality between 0.4~0.6, one-dimensional quality between 0.6~0.7, reverse attractive quality between 0.7~0.8, and positive attractive quality between 0.8~0.9. This trend indicates a trough at the Cohesion value of 0.6, with enhanced degree of preference for both increasing or decreasing values of cohesion. The part-worth utility value indicates a higher degree of preference at higher values of Cohesion. However, the increase is not proportional, and the peak occurs at the Cohesion value of 0.7.
The overall utility values of these six groups toward 21 vase forms are shown in Figure 11 in the form of a bar chart, which reveals the difference in the preferences of these six groups.
5. Conclusions
The investigation in this study is based on a hypothesis that a particular rule exists in the form principles of the product form that is preferred by a consumer. Due to the difference in consumer preferences, consumers can be classified into various groups of different aesthetic tastes. The implementation of designs can be conducted based on each group’s preference differences in aesthetic principles. Product styles which are thus created can better comply with the preference model of the target group. This approach embodies the design differentiation of product styling. Moreover, during the very beginning of the design phase, the concept of reverse engineering can be applied to a preliminary design that has not entered the phase of mass production in order to determine whether a shape design meets the preference of the target group. This approach provides designers with a basis of improving shape designs.
The hypothesis of this study is verified by the investigation of vase forms that are selected in the case study. A rational and objective model of evaluating the elements of vase forms by aesthetic measures is applied to the investigation. The results can be combined with consumer preferences by the conjoint analysis for further investigations. The correlation between vase form constructions and consumer preferences is investigated by a conjoint analysis.
Based on the results, the applicable aesthetic principles of vases include Symmetry, Minimalism, and Cohesion. Moreover, the resulting values of the two indices Pearson’s R and Kendall’s tau in the conjoint analysis indicated that the subjects exhibited certain preference models when choosing the preferred form of vases. Subsequent to this finding, the concept of market segmentation was utilized by the cluster analysis to divide the subjects into 6 groups with different aesthetic perceptions based on the differences in the part-worth utilities perceived by the subjects on the 3 types of aesthetic principles. Each group’s figure of form preference models was built in order to determine the aesthetic preferences of the subjects. Based on the preference models, the design of vase forms can be further improved by focusing on the aesthetic measures that are preferred by the target group in order to meet their aesthetic tastes.
The conventional thinking of one-dimensional quality in some existing aesthetic studies can be overcome with the proposed approach. Various aesthetic principles and measures can be viewed as the criteria of assessing vase forms by integrating them into the investigation of consumer preferences. Each subject’s preference model on the form construction of vases can be determined by the conjoint analysis. The figure of preference models can be built based on the part-worth utilities of each aesthetic measure perceived by each subject. The segmentation of subjects is directly conducted according to their aesthetic tastes and preference perceptions. The concept of reverse engineering is also introduced into this approach for the earlier prediction of the preference measures of each group on the vase forms according to the figure of each group’s preference models. The design of vase forms is guided into the right direction based on the preference models that are determined by this approach. More new vase forms that are preferred by the target group can be created by adjusting the influencing physical parameters from the aspect of each aesthetic principle.
Funding
This work was supported by the Ministry of Science and Technology of the Republic of China under grant MOST 106-2221-E-029-010 and MOST 107-2221-E-029-021.
Acknowledgments
The authors would like to express their sincere gratitude to Mr. Zhang-Chen Tian for his assistance in collecting the data for this study.
Conflicts of Interest
The author declares no conflicts of interest.
References
- Maslow, A.H. Toward a Psychology of Being; Van Nostrand Reinhold: New York, NY, USA, 1968. [Google Scholar]
- Huang, T.S. The form element system design for portable multimedia digital products. J. Des. 2007, 12, 59–77. [Google Scholar]
- Demirbilek, O.; Sener, B. Product design, semantics and emotional response. Ergonomics 2003, 46, 1346–1360. [Google Scholar] [CrossRef] [PubMed] [Green Version]
- Lo, C.H.; Hsiao, S.W. Construction of product aesthetic measures’ evaluation models by aesthetic principles of equilibrium. In Proceedings of the 2013 Chinese Institute of Design Symposium (B-03); Chinese Institute of Design: Kaohsiung, Taiwan, 2013. [Google Scholar]
- Nathan, C. The roles that artefacts play: Technical, social and aesthetic functions. Des. Stud. 2010, 31, 311–344. [Google Scholar]
- Oscar, P.; Jan, S.; Dirk, S. Should new products look similar or different? The influence of the market environment on strategic product styling. Des. Stud. 2008, 29, 30–48. [Google Scholar]
- Tseng, M.M.; Jiao, R.J.; Wang, C. Design for mass personalization. CIRP Ann. Manuf. Technol. 2010, 59, 175–178. [Google Scholar] [CrossRef]
- Best, R.J. Market-Based Management: Strategies for Growing Customer Value and Profitability, 5th ed.; Prentice Hall: Upper Saddle River, NJ, USA, 2009. [Google Scholar]
- Chiu, S.J. Cross-Culture Consumers’ Kansei Research-A Case Study of Mobile Phone; Cheng Kung University: Tainan, Taiwan, 2007. [Google Scholar]
- Hung, W.K.; Chan, L.L. How to Measure Product’s Contradictory Semantics. J. Des. 2010, 15, 41–58. [Google Scholar]
- Lian, Z.W. A Research on Reasoning Model for Identifying the Consumer’s Preference to the Form; Cheng Kung University: Tainan, Taiwan, 2003. [Google Scholar]
- Hsiao, S.W.; Lo, C.H. Effects of product-shape design on customer repurchase intention. Actual Probl. Econ. 2013, 142, 487–497. [Google Scholar]
- Lo, C.H.; Ko, Y.C. An Evaluation Model for Product Aesthetic Measures Constructed by Aesthetic Principles of Balance. In Proceedings of the 2014 International Conference of Organizational Innovation (2014 ICOI), De La Salle University, Manila, Philippine, 12–14 August 2014. [Google Scholar]
- Lo, C.H.; Hsiao, S.W. An Evaluation Model for Product Aesthetic Measures Constructed by Aesthetics Principles of Symmetry. J. Art Des. 2014, 4, 23–41. [Google Scholar]
- Valencia-Romero, A.; Lugo, J.E. Part-Worth Utilities of Gestalt Principles for Product Esthetics: A Case Study of a Bottle Silhouette. ASME J. Mech. Des. 2016, 138, 081102. [Google Scholar] [CrossRef]
- Valencia-Romero, A.; Lugo, J.E. Quantification of Symmetry, Parallelism, and Continuity as Continuous Design Variables for Three-Dimensional Product Representations. In Proceedings of the ASME International Design Engineering Technical Conferences and Computers and Information in Engineering Conference, Volume 7: 28th International Conference on Design Theory and Methodology, Charlotte, NC, USA, 21–24 August 2016; p. V007T06A044. [Google Scholar] [CrossRef]
- Tovares, N.; Boatwright, P.; Cagan, J. Experiential conjoint analysis: An experience-based method for eliciting, capturing, and modeling consumer preference. ASME J. Mech. Des. 2014, 136, 101404. [Google Scholar] [CrossRef]
- Backhaus, K.; Jasper, J.; Westhoff, K.; Gausemeier, J.; Grafe, M.; Stcklein, J. Virtual reality based conjoint analysis for early customer integration in industrial product development. Procedia CIRP 2014, 25, 61–68. [Google Scholar] [CrossRef]
- Orsborn, S.; Cagan, J.; Boatwright, P. Quantifying aesthetic form preference in a utility function. ASME J. Mech. Des. 2009, 131, 061001. [Google Scholar] [CrossRef]
- Chen, W.; Hoyle, C.; Wassenaar, H.J. Decision-Based Design: Integrating Consumer Preferences into Engineering Design; Springer: London, UK, 2013; pp. 1–357. [Google Scholar]
- Kelly, J.C.; Maheut, P.; Petiot, J.-F.; Papalambros, P.Y. Incorporating user shape preference in engineering design optimisation. J. Eng. Des. 2011, 22, 627–650. [Google Scholar] [CrossRef]
- Lugo, J.E.; Batill, S.M.; Carlson, L. Modeling Product Form Preference Using Gestalt Principles, Semantic Space, and Kansei. In Proceedings of the ASME International Design Engineering Technical Conferences and Computers and Information in Engineering Conference, Volume 7: 9th International Conference on Design Education; 24th International Conference on Design Theory and Methodology, Chicago, IL, USA, 12–15 August 2012; pp. 529–539. [Google Scholar] [CrossRef]
- Lugo, J.E.; Schmiedeler, J.P.; Batill, S.M.; Carlson, L. Relationship between product aesthetic subject preference and quantified Gestalt principles in automobile wheel rims. ASME J. Mech. Des. 2016, 138, 051101. [Google Scholar] [CrossRef]
- Lo, C.-H.; Ko, Y.-C.; Hsiao, S.-W. A study that applies aesthetic theory and genetic algorithms to product form optimization. Adv. Eng. Inform. 2015, 29, 662–679. [Google Scholar] [CrossRef]
- Chou, W.C.; Zhang, Q.F. Conjoint Analysis in the Use of the Product Design; Hwa Tai Publisher: Taipei, Taiwan, 2000. [Google Scholar]
- Sanagi, T. Conjoint Analysis by SPSS; Ting Mao Publisher: Taipei, Taiwan, 1989. [Google Scholar]
Figure 1.
Symmetry of an object in (a) vertical, (b) horizontal, and (c) diagonal directions.

Figure 2.
Vertical symmetry of an object; (a) Higher minimalism; (b) Lower minimalism.

Figure 3.
Types of preferences model.

Figure 4.
Flowchart of research process.

Figure 5.
Questionnaire attachment of product samples.

Figure 6.
Structure of preferences questionnaire.

Figure 7.
Tree diagram of cluster Analysis.

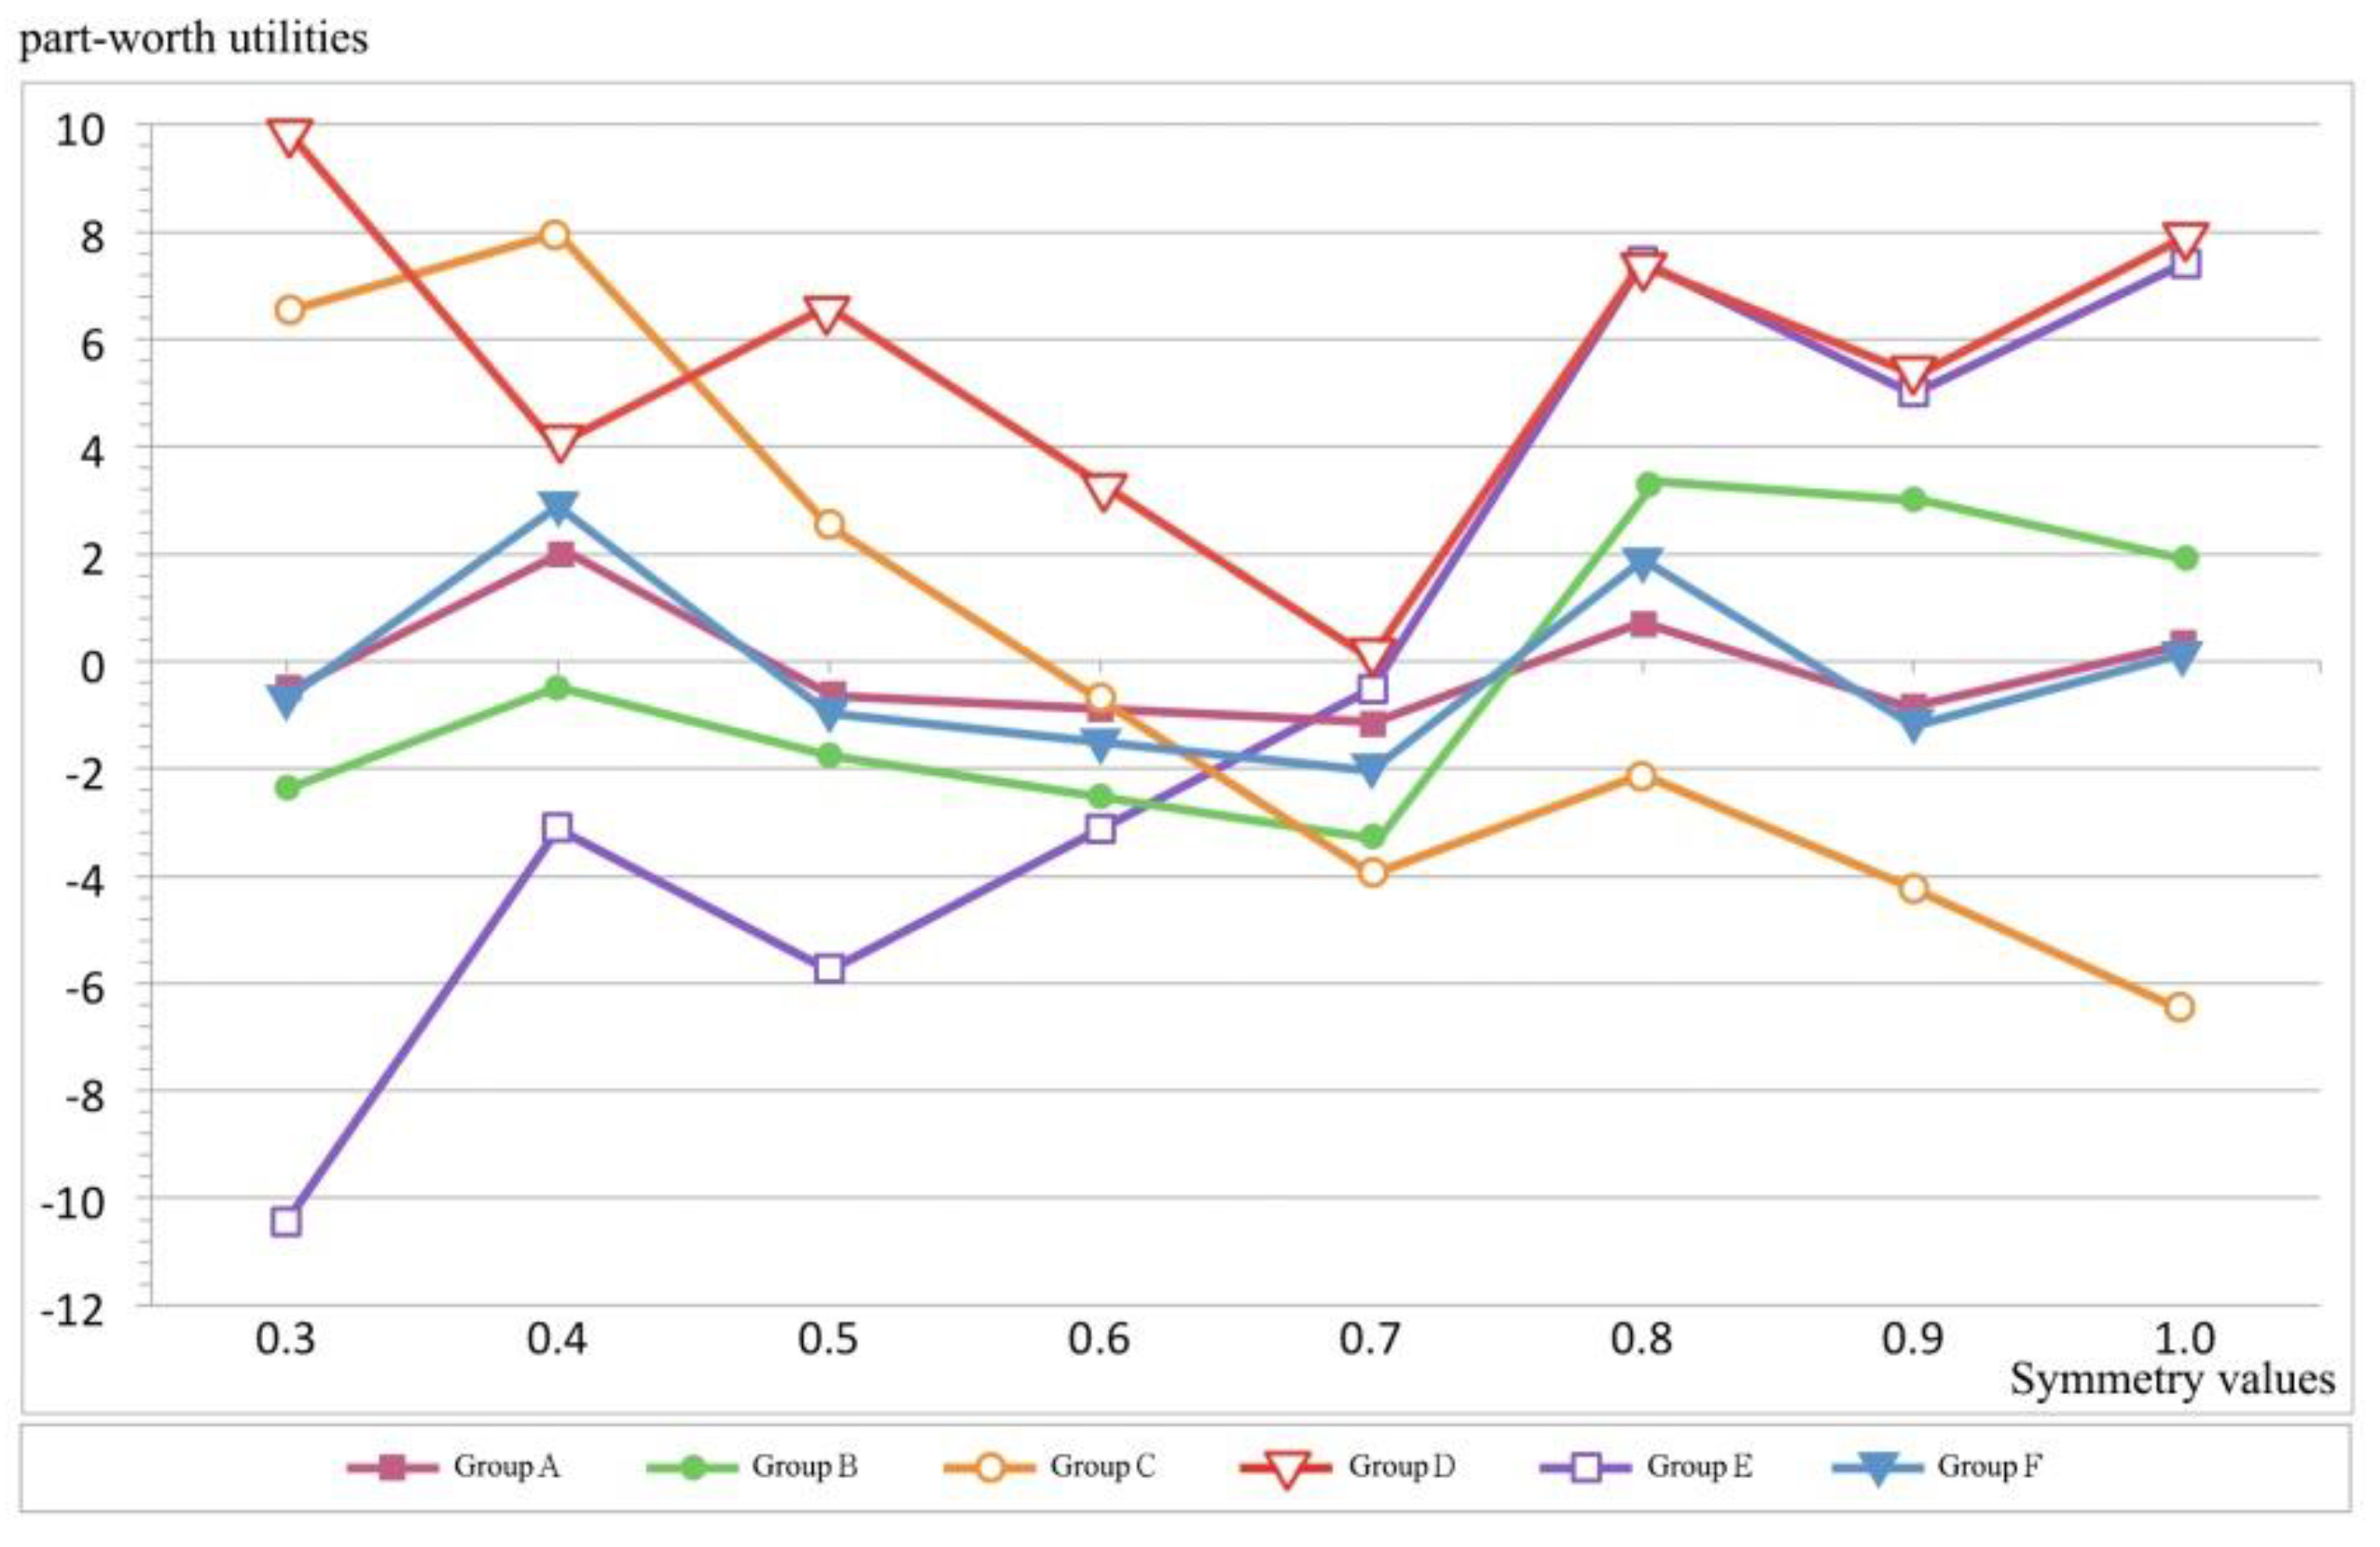
Figure 8.
Part−worth utilities of different Symmetry values for the six groups.

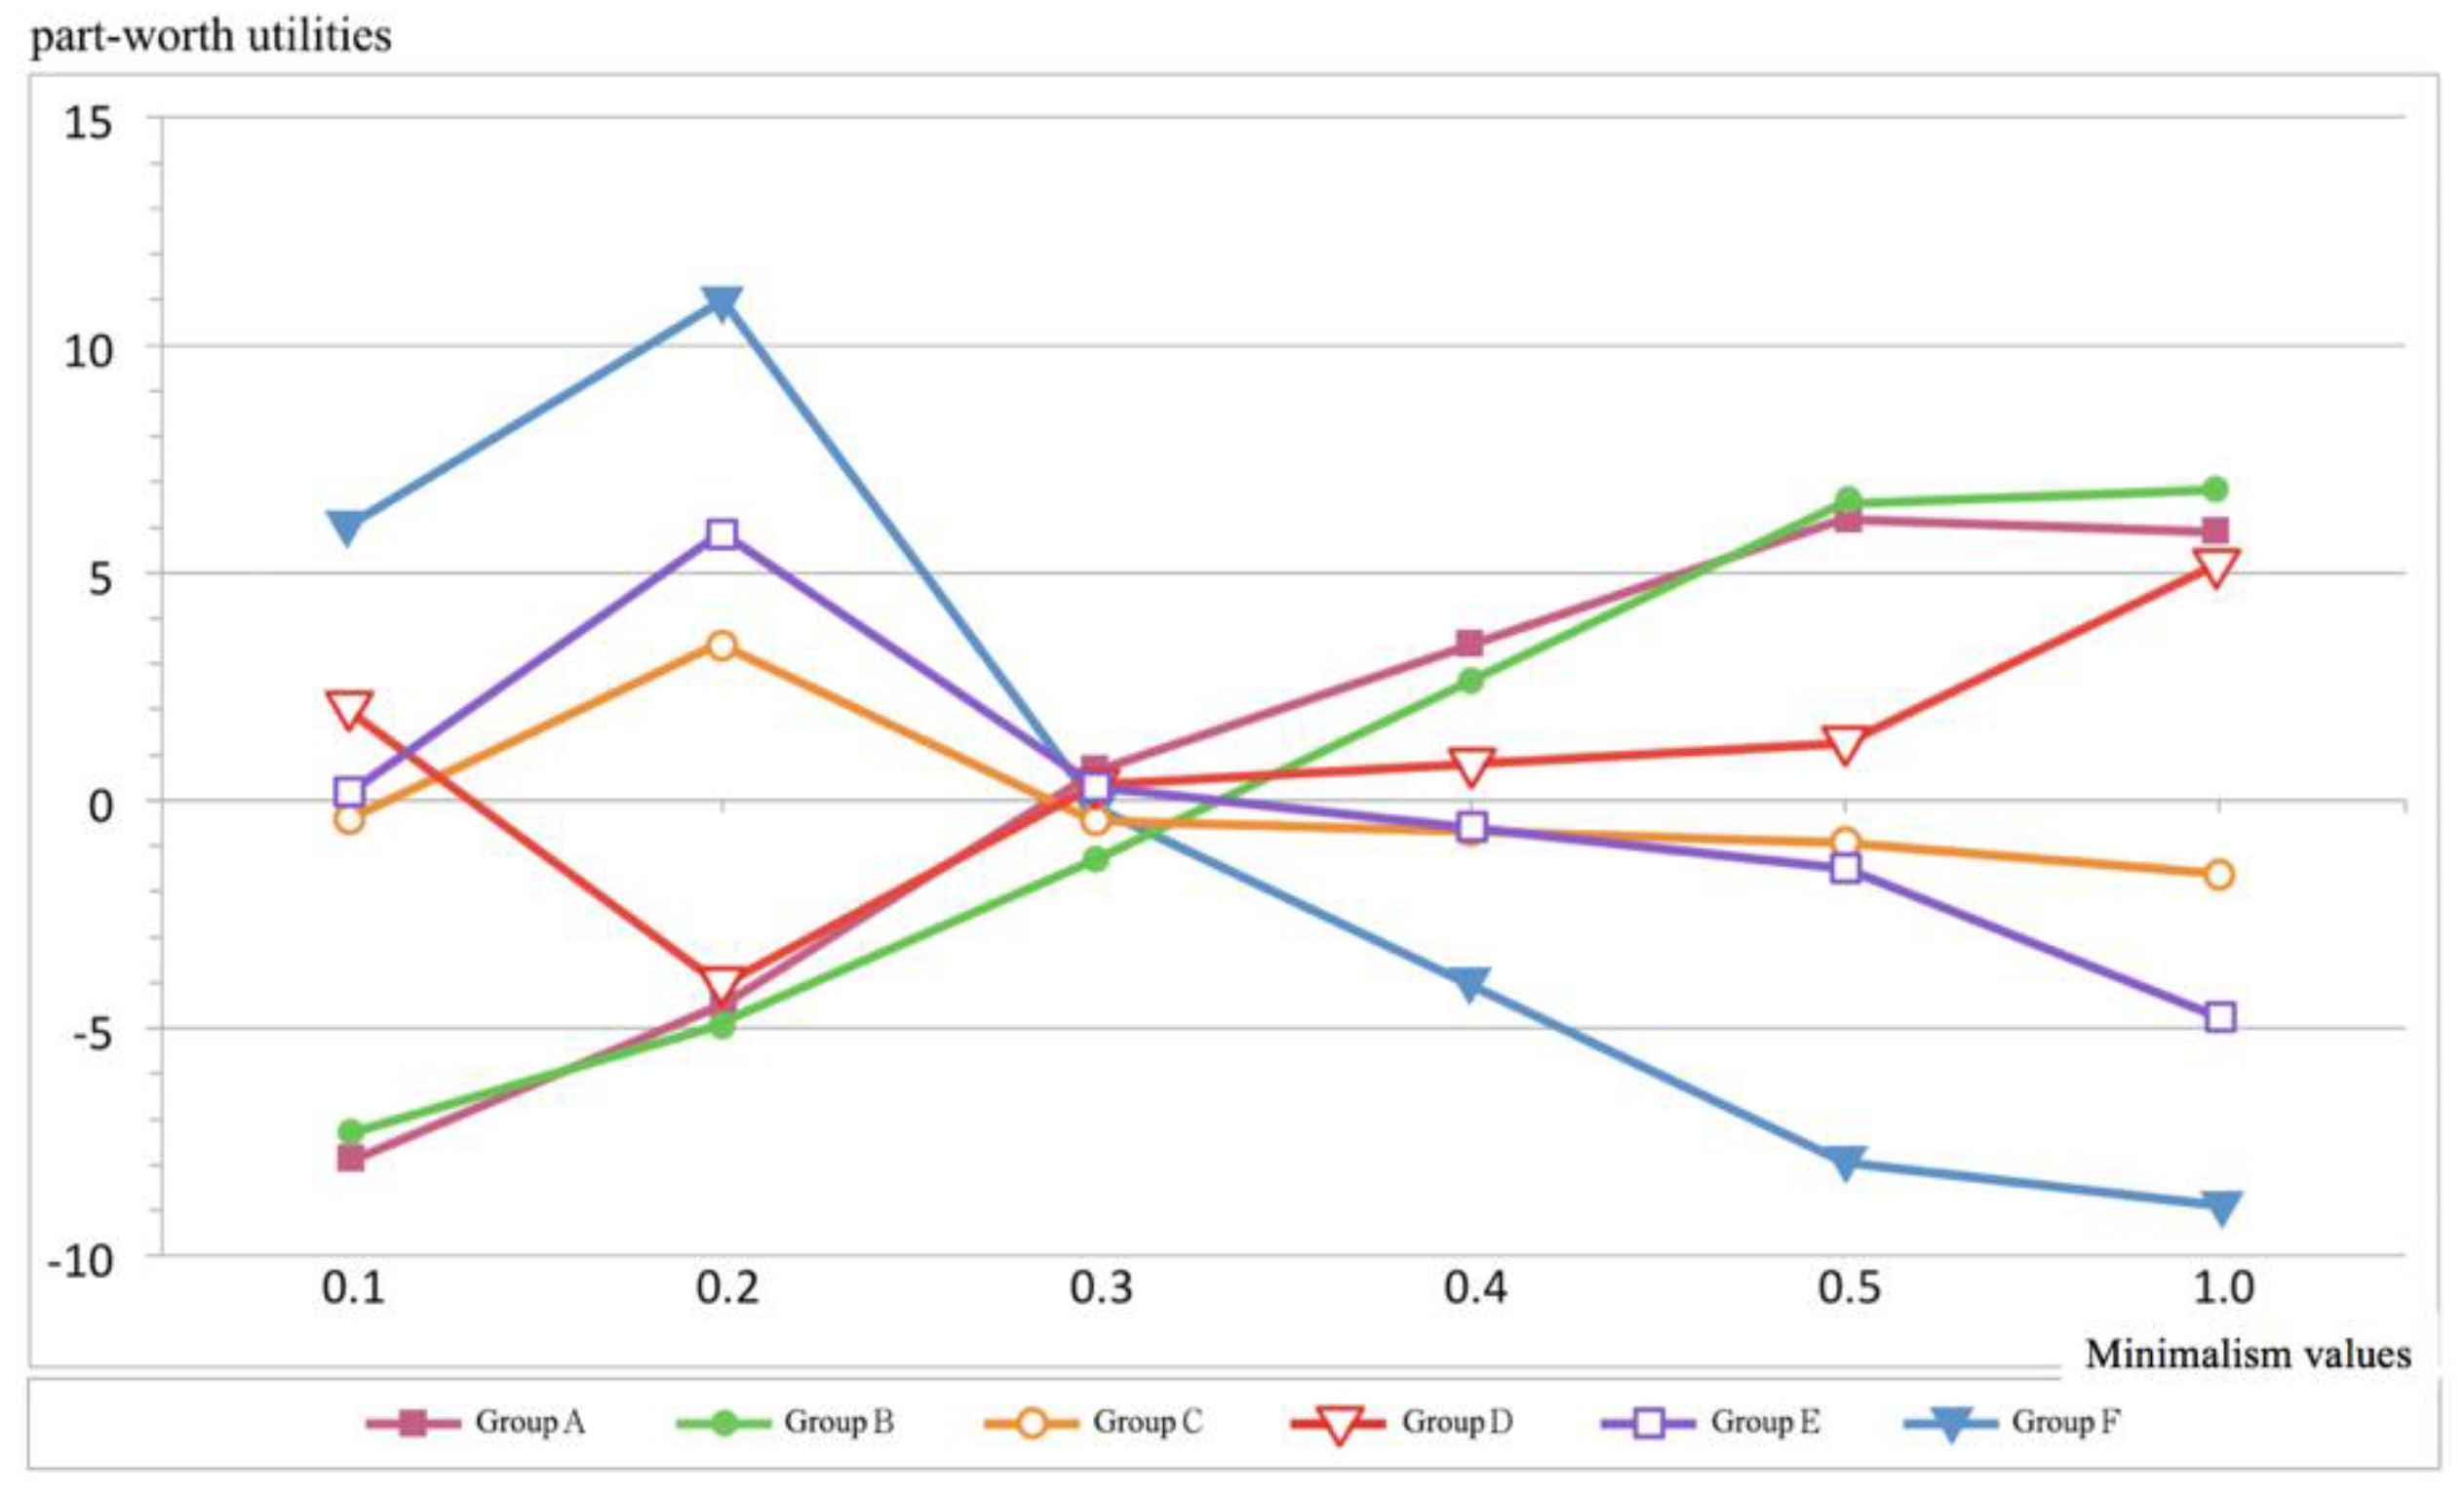
Figure 9.
Part−worth utilities of different Minimalism values for the six groups.

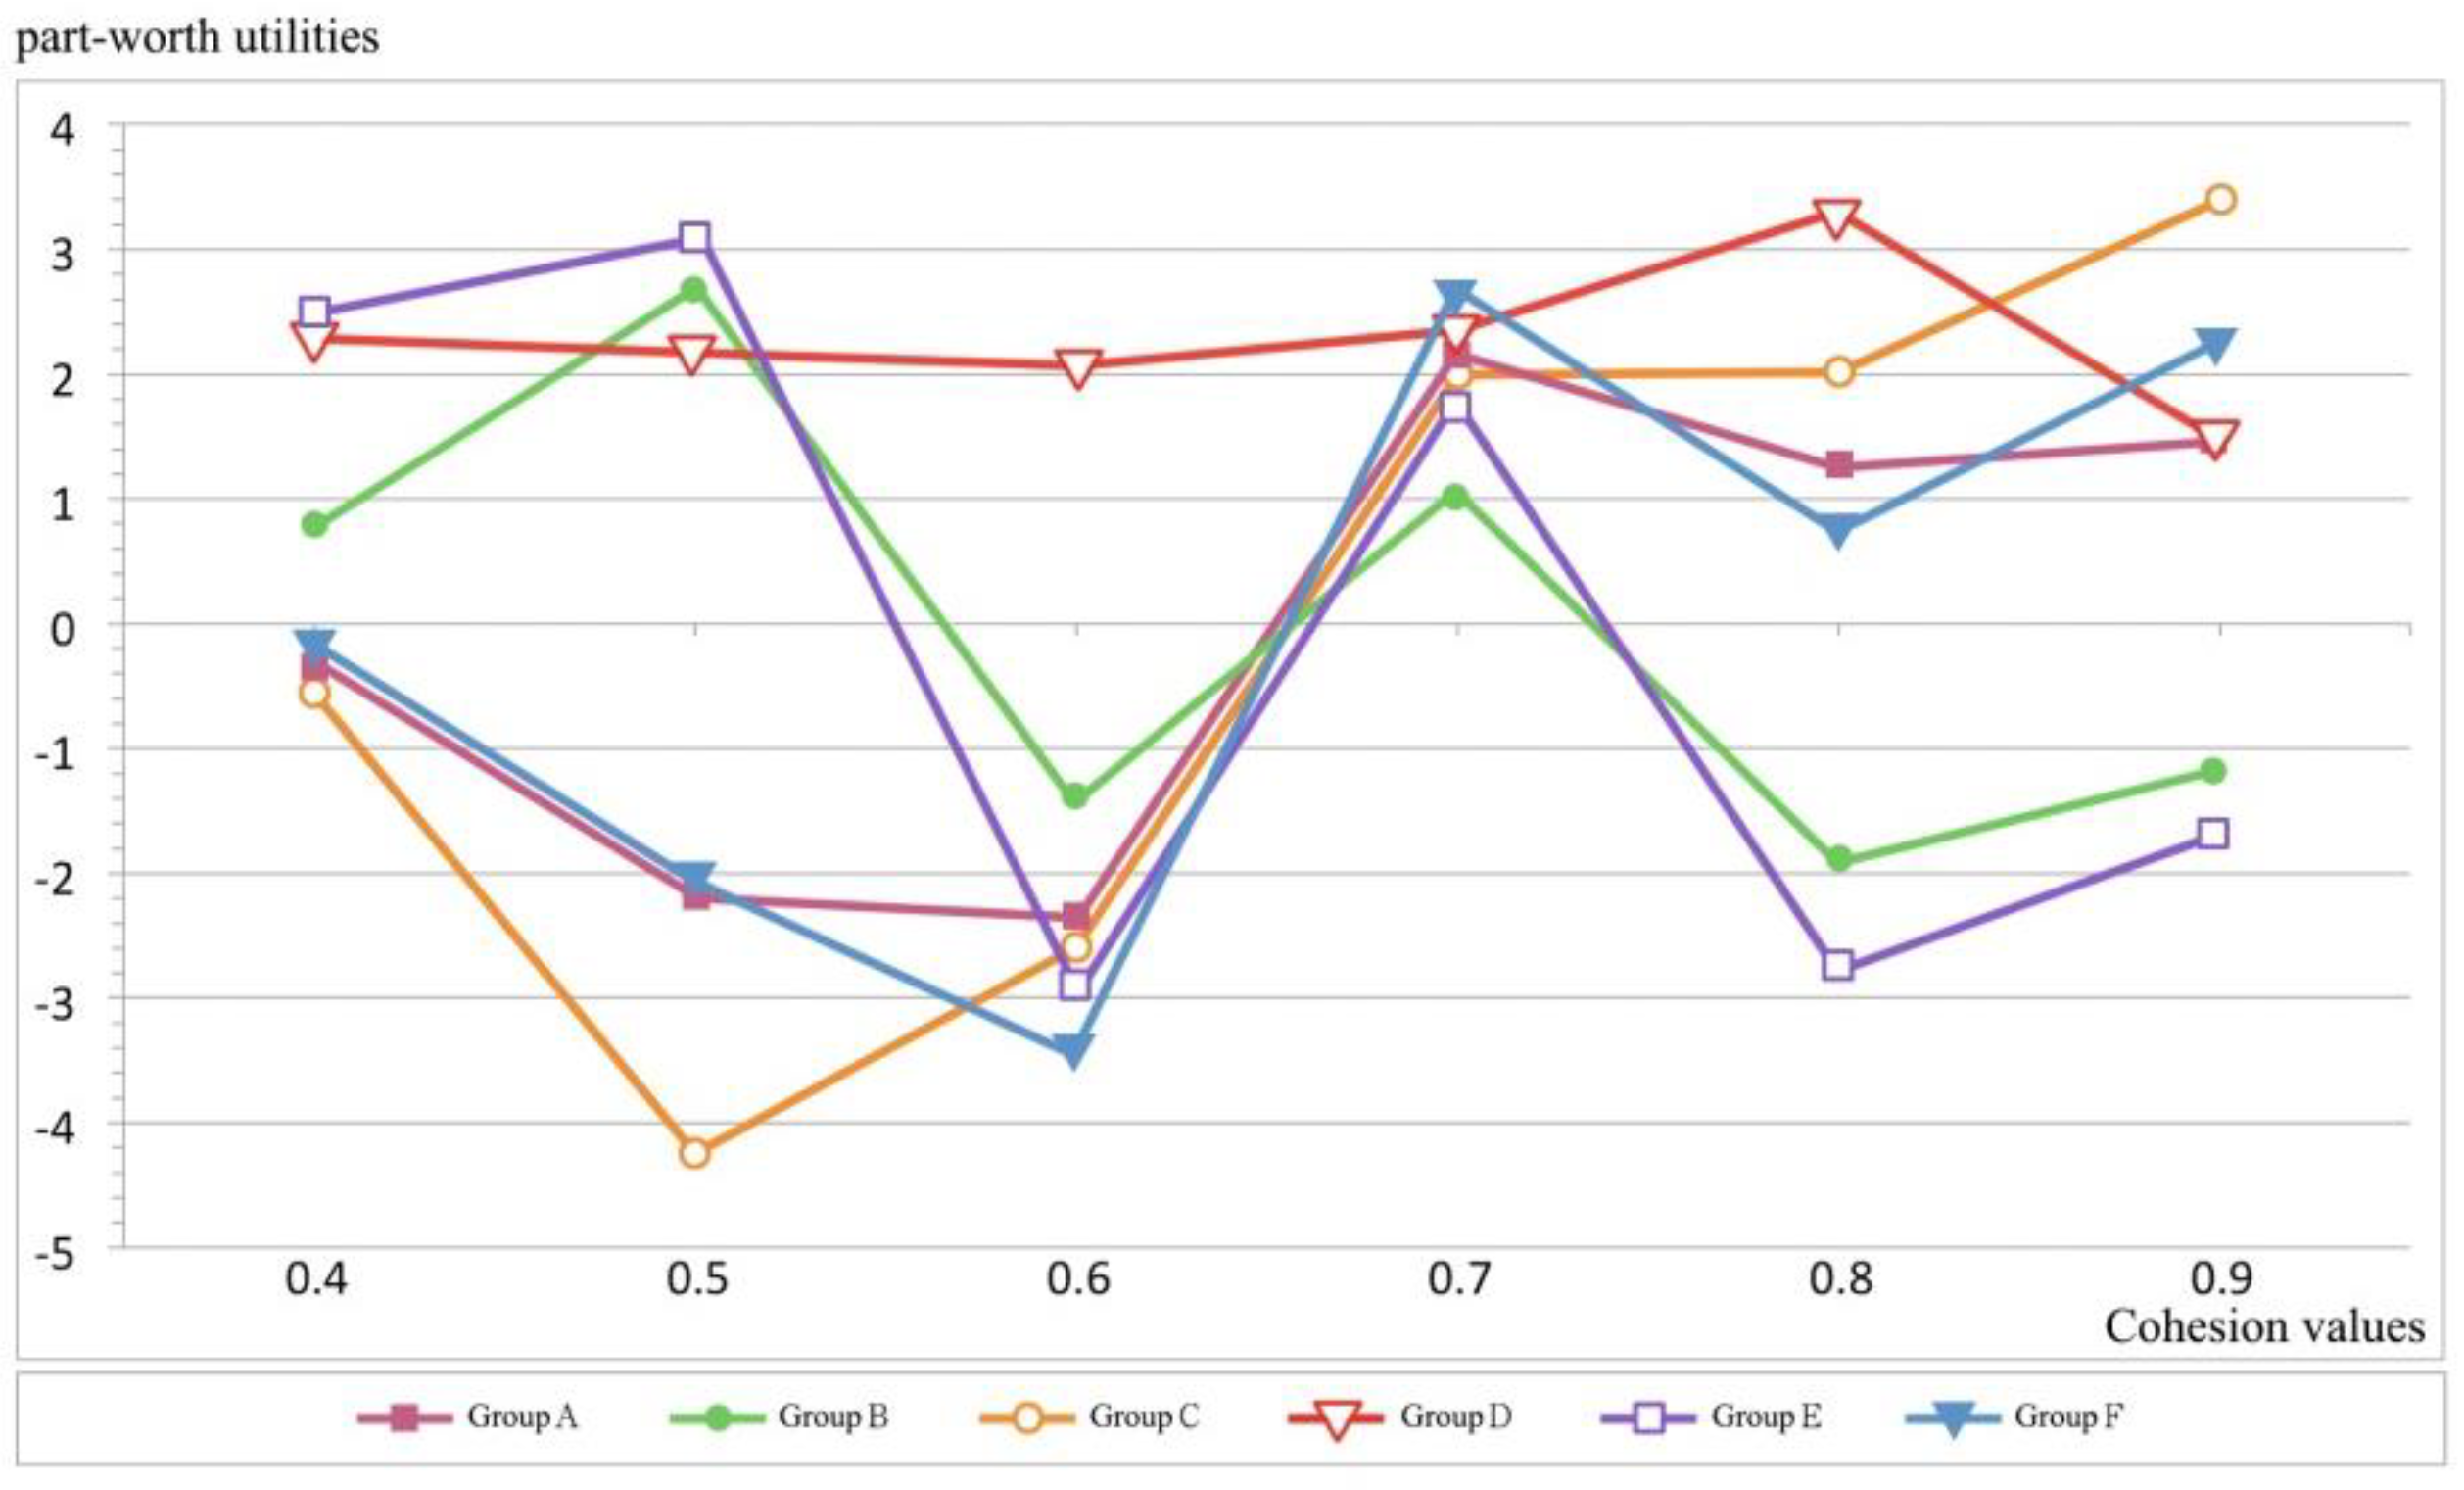
Figure 10.
Part−worth utilities of different Cohesion values for the six groups.

Figure 11.
The overall utility values of six groups toward 21 vase forms.


Table 1.
Structure of subject samples.
| Gender Breakdown | Design Background | Non-Design Background | Total |
|---|---|---|---|
| Male | 25 | 26 | 51 |
| Female | 29 | 27 | 56 |
| Total | 54 | 53 | 107 |
Table 2.
Presentations of 21 vases in the aesthetic principles.
| Vase Number | Vase Form | Symmetry | Minimalism | Cohesion |
|---|---|---|---|---|
| 1 |  | 0.8 | 0.3 | 0.8 |
| 2 |  | 0.4 | 0.3 | 0.6 |
| 3 |  | 0.8 | 0.3 | 0.6 |
| 4 |  | 0.5 | 0.1 | 0.4 |
| 5 |  | 0.9 | 0.5 | 0.8 |
| 6 |  | 0.9 | 0.3 | 0.7 |
| 7 |  | 0.8 | 1.0 | 0.8 |
| 8 |  | 0.3 | 0.2 | 0.6 |
| 9 |  | 1.0 | 0.2 | 0.6 |
| 10 |  | 0.5 | 0.3 | 0.7 |
| 11 |  | 0.8 | 0.3 | 0.9 |
| 12 |  | 1.0 | 1.0 | 0.9 |
| 13 |  | 0.7 | 0.3 | 0.5 |
| 14 |  | 0.8 | 0.3 | 0.6 |
| 15 |  | 0.9 | 0.3 | 0.5 |
| 16 |  | 0.7 | 0.3 | 0.5 |
| 17 |  | 0.5 | 0.1 | 0.7 |
| 18 |  | 0.4 | 0.5 | 0.6 |
| 19 |  | 0.5 | 0.2 | 0.6 |
| 20 |  | 0.3 | 0.1 | 0.9 |
| 21 |  | 0.5 | 0.5 | 0.6 |
Table 3.
Average part-worth utilities of each aesthetic value for each group.
| Aesthetic group | Symmetry 0.3 | Symmetry 0.4 | Symmetry 0.5 | Symmetry 0.6 | Symmetry 0.7 | Symmetry 0.8 | Symmetry 0.9 | Symmetry 1.0 | Minimalism 0.1 | Minimalism 0.2 | Minimalism 0.3 | Minimalism 0.4 | Minimalism 0.5 | Minimalism 1.0 | Cohesion 0.4 | Cohesion 0.5 | Cohesion 0.6 | Cohesion 0.7 | Cohesion 0.8 | Cohesion 0.9 |
|---|---|---|---|---|---|---|---|---|---|---|---|---|---|---|---|---|---|---|---|---|
| A | −0.45 | 2.02 | −0.62 | −0.875 | −1.13 | 0.73 | −0.84 | 0.30 | −8.04 | −4.57 | 0.60 | 3.37 | 6.14 | 5.87 | −0.31 | −2.20 | −2.36 | 2.16 | 1.25 | 1.46 |
| B | −2.41 | −0.52 | −1.78 | −2.555 | −3.33 | 3.30 | 2.93 | 1.81 | −7.14 | −4.71 | −1.23 | 2.59 | 6.41 | 6.66 | 0.76 | 2.67 | −1.42 | 1.06 | −1.90 | −1.17 |
| C | 6.53 | 8.03 | 2.55 | −0.735 | −4.02 | −2.18 | −4.29 | −6.61 | −0.41 | 3.42 | −0.44 | −0.695 | −0.95 | −1.62 | −0.56 | −4.25 | −2.59 | 2.00 | 2.012 | 3.39 |
| D | 9.87 | 4.01 | 6.59 | 3.315 | 0.04 | 7.41 | 5.26 | 7.84 | 2.03 | −4.12 | 0.30 | 0.77 | 1.24 | 5.22 | 2.30 | 2.18 | 2.06 | 2.35 | 3.29 | 1.48 |
| E | −10.44 | −3.12 | −5.75 | −3.13 | −0.51 | 7.43 | 4.99 | 7.41 | 0.18 | 5.95 | 0.31 | −0.64 | −1.59 | −4.85 | 2.51 | 3.07 | −2.94 | 1.79 | −2.79 | −1.67 |
| F | −0.69 | 2.93 | −1 | −1.54 | −2.08 | 1.92 | −1.20 | 0.12 | 6.03 | 10.99 | −0.16 | −4.055 | −7.95 | −8.90 | −0.17 | −2.03 | −3.44 | 2.66 | 0.73 | 2.25 |
© 2018 by the author. Licensee MDPI, Basel, Switzerland. This article is an open access article distributed under the terms and conditions of the Creative Commons Attribution (CC BY) license (http://creativecommons.org/licenses/by/4.0/).
Share and Cite
MDPI and ACS Style
Lo, C.-H. Application of Aesthetic Principles to the Study of Consumer Preference Models for Vase Forms. Appl. Sci. 2018, 8, 1199. https://doi.org/10.3390/app8071199
AMA Style
Lo C-H. Application of Aesthetic Principles to the Study of Consumer Preference Models for Vase Forms. Applied Sciences. 2018; 8(7):1199. https://doi.org/10.3390/app8071199
Chicago/Turabian StyleLo, Chi-Hung. 2018. "Application of Aesthetic Principles to the Study of Consumer Preference Models for Vase Forms" Applied Sciences 8, no. 7: 1199. https://doi.org/10.3390/app8071199
Note that from the first issue of 2016, this journal uses article numbers instead of page numbers. See further details here.