Quantitative Analysis of Micron-Scale and Nano-Scale Pore Throat Characteristics of Tight Sandstone Using Matlab


1
School of Energy Resources, China University of Geosciences, Beijing 100083, China
2
Key Laboratory for Marine Reservoir Evolution and Hydrocarbon Abundance Mechanism, China University of Geosciences, Beijing 100083, China
3
Beijing Key Laboratory of Unconventional National Gas Geology Evaluation and Development Engineering, China University of Geosciences, Beijing 100083, China
*
Author to whom correspondence should be addressed.
Appl. Sci. 2018, 8(8), 1272; https://doi.org/10.3390/app8081272
Submission received: 5 July 2018
/
Revised: 22 July 2018
/
Accepted: 25 July 2018
/
Published: 1 August 2018
(This article belongs to the Special Issue Nanotech for Oil and Gas)
Abstract
:Based on micro-scale casting thin sections, nano-scale SEM images, and the pore distribution map identified through a binary image in Matlab, the pore size distribution and pore throat coordination number of the strata of Upper Paleozoic He8 section tight sandstone in the southeastern Ordos Basin were quantitatively analyzed with the above experimental data. In combination with a high-pressure mercury injection experiment, the pore throat distribution, the pore throat ratio, and the relationships between the characteristics, parameters, and pore permeability were investigated clearly. The results show that the tight sandstone pore space in the study area is dominated by micron-sized intergranular pores, dissolved pores, and intragranular pores. The nano-scale pore throat consisted of clay minerals, intercrystalline pores, and the flake intergranular pores of overgrowth quartz grains. Kaolinite and illite intercrystalline pores occupy the pore space below 600 nm, while the ones above 800 nm are mainly dominated by the intergranular pores of overgrowth quartz grains, and the 600–800 nm ones are transitional zones. The permeability of tight sandstone increases with the average pore throat radius, sorting coefficient, median pore throat radius, and average pore throat number. The porosity is positively correlated with the average pore radius and the average pore throat coordination number, and negatively correlated with the median pore throat radius.
1. Introduction
The microscopic pore structure of a reservoir refers to the geometry, size, distribution, and mutual connectivity of the pores and throats in the reservoir rock [1,2], which directly affects the development of the reservoir pore space. The pore space of tight sandstone reservoirs is divided into three levels: millimeter pore, micron-scale pore, and nano-scale pore. Zou et al. discovered nano-scale pores for the first time in a study of unconventional reservoirs in China by applying field emission scanning electron microscopy and X- CT (X-ray computed tomography) reconstruction techniques [3]. From the millimeter pore to the nano-scale pore, many analytical methods, including experiments and numerical simulations, have been applied to the pore structure and characterization of tight sandstone. Different methods are suitable for different samples (Table 1). Nuclear magnetic resonance logging techniques [4,5,6], fluid injection experiments [6,7,8], and image observation method are the three major categories [9,10,11]. Nuclear magnetic resonance logging technology based on rock resistivity parameters is mainly used to determine the reservoir pore size distribution. The fluid injection experiment represented by the mercury intrusion method can indirectly obtain the parameters of pore characteristics such as reservoir space distribution and pore size through the mercury intrusion curve, but it cannot directly observe the characteristics of reservoir space and pore throat, compared with the scanning electron microscope and nano-CT technology. Scanning electron microscopy and X-ray CT were used as experimental guides [12,13]. The results of the study were mostly based on the quantitative analysis of the geometry and connectivity of pore throats. There are still deficiencies in studying micron pore size distribution. For the quantitative analysis of tight sandstones, gas adsorption, high-pressure mercury injection, and helium gas porosity are the main methods. High-pressure mercury injection is suitable for the analysis of nano-pore throats [14]. Helium porosity can reflect the pore size distribution of the entire reservoir, but it cannot measure some nano-scale pores [15,16]. In addition, many scholars have combined these experiments with numerical simulation to quantitatively analyze the pore throat characterization. In this paper, casting thin sections, scanning electron microscope, and high-pressure mercury injection experiments were taken as the experimental methods, and Matlab software was used as the processing method to quantitatively analyze the pore throat characteristics of tight sandstone in the study area from the two dimensions of nano-scale pore and micro-scale pore throat.
The Matlab software has a powerful ability to process image and data, and has been applied by scholars in various research studies, including biology, materials science, and mechanical engineering [17,18,19,20,21,22]. Many scholars use Matlab to study the pores of various types of rocks and materials as well. This article takes the tight sandstone of the He8 section of the Ordos Basin as the research sample, using the Matlab built-in application ‘Color Threshold’ and related functions to quantify the pore-related characteristics and parameters of the samples.
2. Materials and Methods
2.1. Geological Setting and Samples
Ordos Basin is rich in oil and gas [23,24]. In the strata of Carboniferous-Permian, several groups of coal-bearing clastic rock series were developed, which produced abundant coal measures and gas [23,24] The basin has become the largest tight gas production base of China, including Sulige Gas Field, Wushenqi Gas Field, Yulin Gas Field, Mizhi Gas Field, and Daniudi Gas Field [25,26]. The Upper Paleozoic of Basin developed four formations: Taiyuan, Shanxi, Shihezi, and Shiqianfeng from top to bottom with a total sediment thickness of 700 m [27]. The body thickness of Shihezi Formation is about 130–150 m. As the major gas reservoir in the study area (Figure 1), the Shihezi Formation developed a braided river delta sedimentary facies, which is divided into four rock formation groups from bottom to top: He8, He7, He6, and He5. This article focuses on the He8 section. Forty-six sandstone samples were collected in this paper. All of them are from the He8 section in the Shihezi Formation around the southern part of the Yanchang Gas Field, which is currently an important target area for tight gas in China.
2.2. Procedures
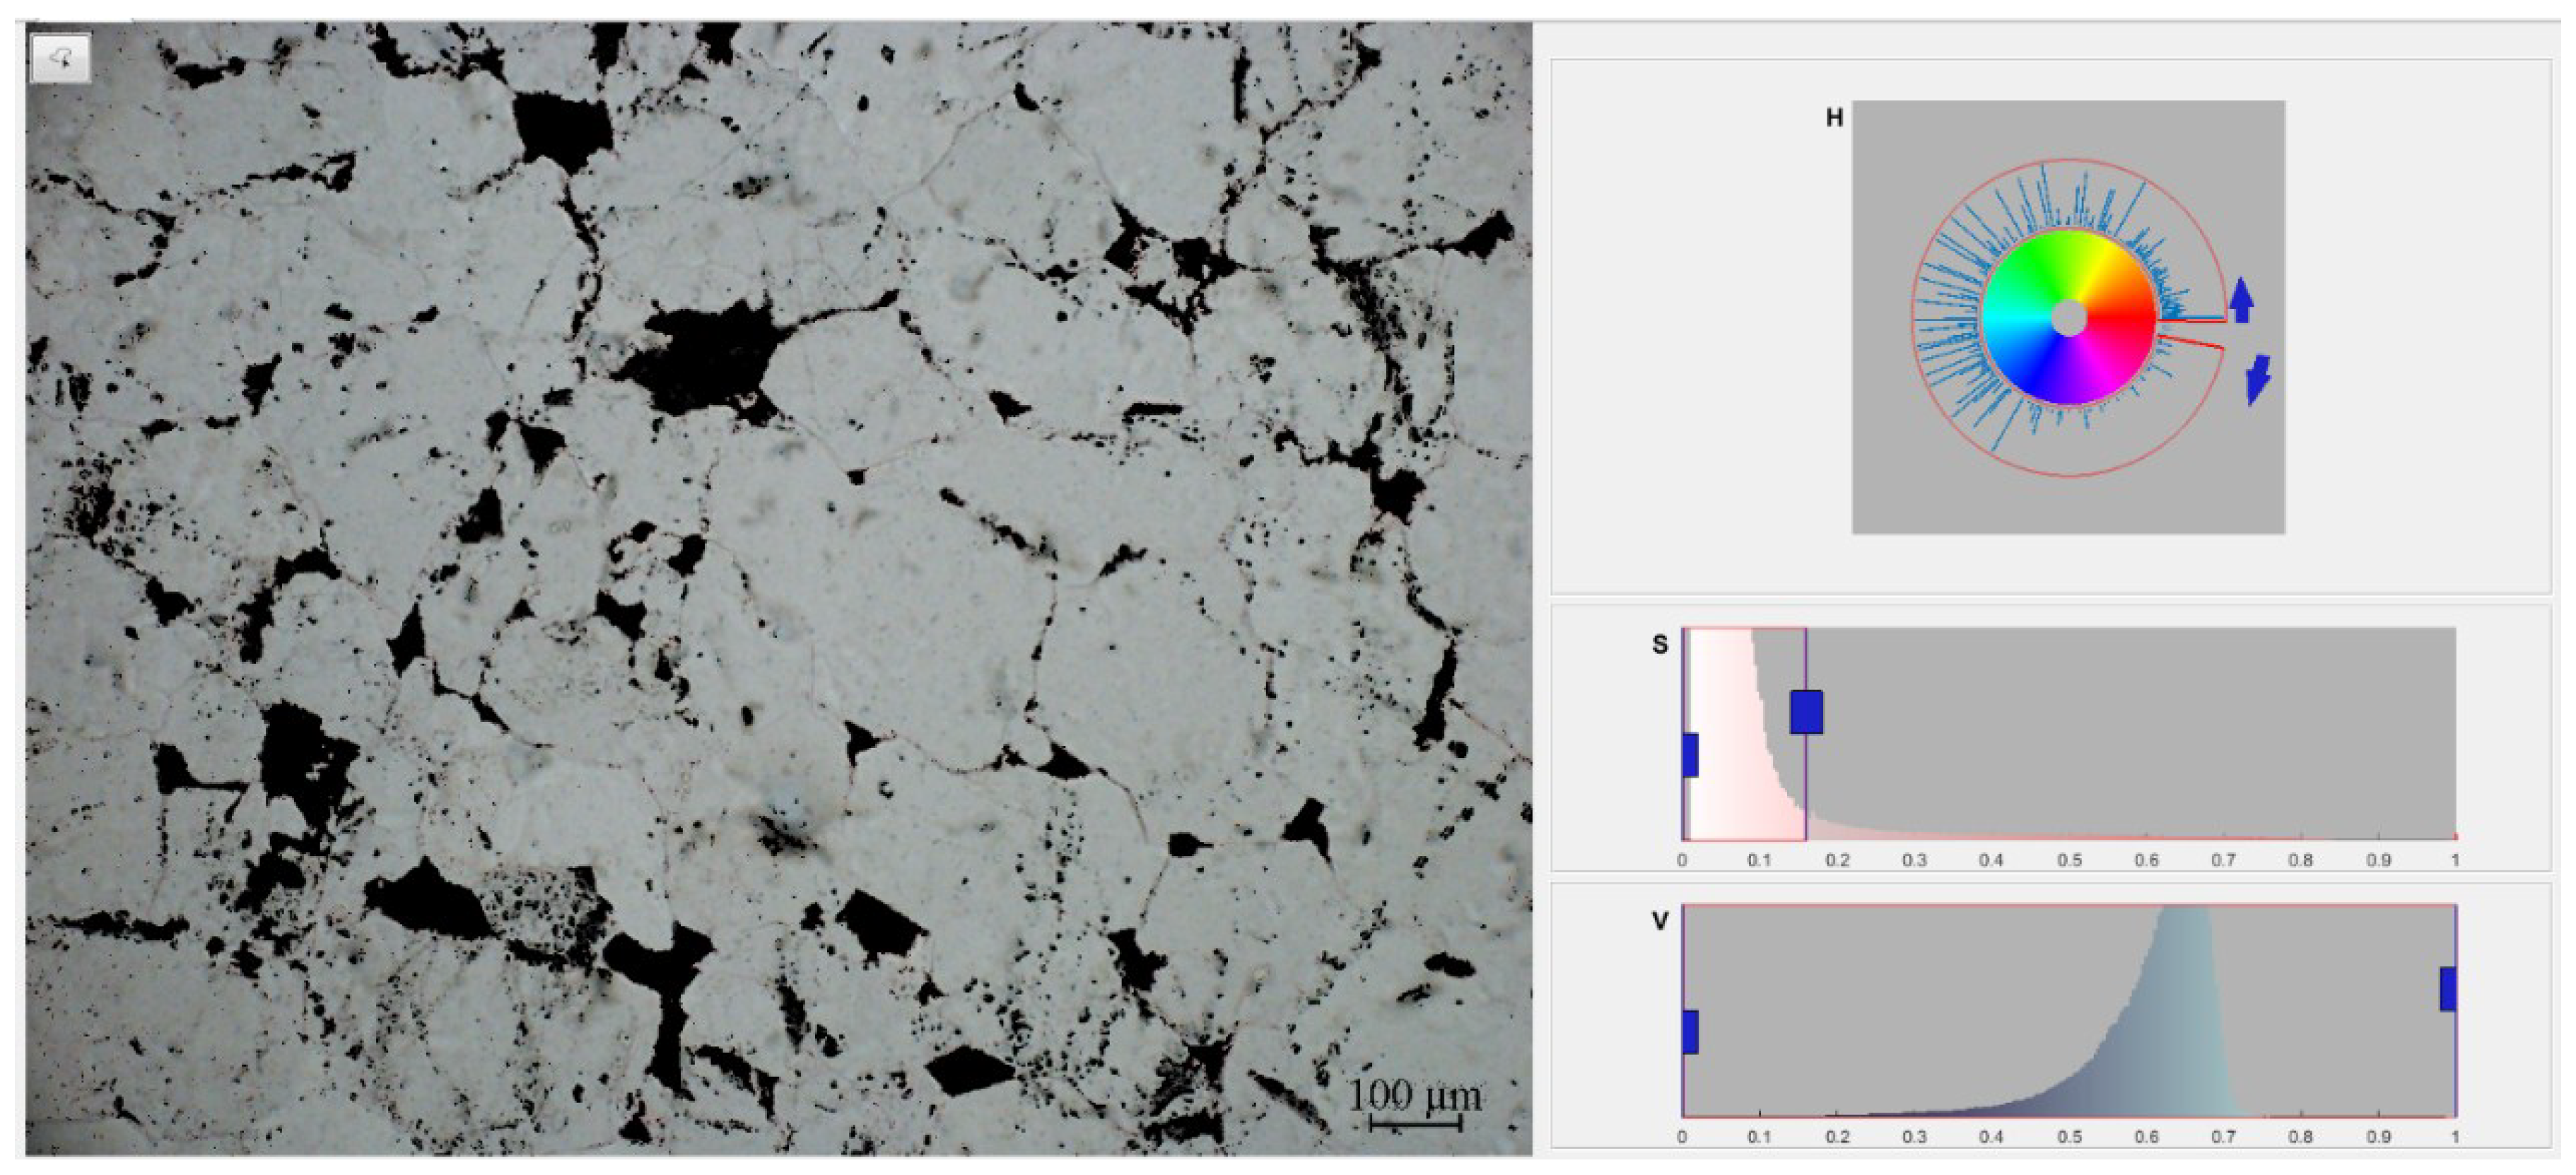
Conventional core analysis is commonly used to analyze matrix porosity and permeability in tight sand rocks, because sampling makes it difficult to contain fractures in samples. A total of 62 non-fractured samples were used to perform conventional core analysis using a SL-5 rock permeability analyzer. It was done with a temperature and pressure of 24 °C and 91.5 KPa, respectively, following the standard SY/T 5336–1996 of China. Before the experiments, every core was cut into three parts for casting thin sections, SEM, and high-pressure mercury injection experiments. Fresh sections and polished samples were coated with gold and then observed by a FEI Quanta 200F SEM (20 KV, high vacuum mode), and all of the experiments were done at China University of Geosciences in Beijing. Based on casting thin sections and SEM, the pore structure, including both micron pores and nano-pores, were analyzed using the Matlab software. Using Matlab to quantitatively analyze the tight sandstones in different research areas, we first needed to convert the cast image and scanning electron microscope image into a binary image, and the image binarization then required setting the gray value of pixels on the image to 0 or 255. The entire image presents a clear black-and-white effect, and the binary image displays the internal structure of the image to the greatest extent. Corresponding to the reservoir sandstone image, the point where the pixel is 0 is black, and represents the particle. The point where the pixel is 255 is white, and represents the pore area. First, the image is binarized by the built-in application ‘Color Thresholder’ in Matlab (Figure 2). H is the whole color space of the image, and the entire image range is controlled when the red void space is removed from the color disk. S and V are respectively saturated.
After pretreatment of casting thin sections images and SEM images, corresponding binary images are obtained (Figure 3d–f), and the parameters such as image porosity, particle size, pore throat distribution, and average pore radius are further calculated. The function ‘size’ in Matlab can identify and extract the pixels in the binary image. Through the built-in function ‘bwarea’, the total number of image points ‘Np’ (the sum of all of the black and white pixels) can be obtained, respectively. Meanwhile, the pixels of pores ‘Na’ can also be identified by function ‘size’. So, porosity ‘P’ is the ratio of white pixels to the total pixels:
Furthermore, for the distribution of pore radius, the built-in function ‘bwlabel’ in Matlab can identify areas of the same pixel value and determine the boundary of the area. Based on this principle, the void area (black or white pixel value connected area) can be determined. Apply the function ‘bwlabel’ for each connected area (pore area and non-pore area) to find the maximum and minimum values of the X and Y axes for each region; xmax, xmin, ymax, and ymin are calculated so that the diameter ‘d’ for each particle or pore is the average of the differences in the X and Y directions. The size of the radius d:
The results are displayed as shown in Figure 3g–i. Different colors represent different particle sizes. Most of the aperture recognition results are relatively good, but sometimes, there is noise generated during the image binarization process. Thus, some pores were divided into smaller parts, some long pores were divided into several parts, and some smaller pores were also merged into larger pores, which is also the main error of the experiment. Error and accuracy will be discussed later.
The internal function ‘imhist’ is further called to superimpose three types of pores: intergranular pores, dissolved pores, and rock dissolution pores in the study area, and draw a histogram of pore size distribution. See Figure 4, and calculate the average porosity. The formula is as follows:
The pore radius distribution, size, average pore throat coordination number of every casting thin section, and every SEM image were gained by means of modes with the above algorithms and functions in Matlab.
3. Results
3.1. Physical Properties
As a whole, the reservoir properties in the He8 sandstones are quite poor. According to the routine analysis of cores, the reservoir porosity of the He8 section of the study area ranges from 2.26% to 12.96%, with an average of 7.73%. Horizontal permeability ranges from 0.0262–1.569 mD, with an average permeability of 0.4509 mD.
3.2. Pore Types and Pore Throat Characteristics
Casting thin sections and SEM observations revealed the presence of two main types of pores in the He8 Section of the study area, including micron-scale intergranular pores and dissolved pores. Meanwhile, pore throat is dominated by micron-sized clay minerals, including intercrystalline pores, intergranular pores of overgrowth quartz, and microfractures. As nano-scale intergranular pores and dissolved pores mainly constitute tight sandstone reservoir spaces, their pore size, distribution, and quantity influences the entire tight sandstone reservoir capacity, and as micron-scale intercrystalline pores and intergranular pores of overgrowth quartz grains, their distribution, number, and shape affect the permeability of tight sandstone.
For micron-sized pores, the pore distribution, average pore throat coordination number, and average pore size of the tight sandstones were quantitatively analyzed using Matlab and casting thin sections. For nano-scale pore throats, each type of pore was quantitatively analyzed by Matlab and SEM images. However, the whole pore throat physical property of the sample cannot be gained by thin sections. For a better understanding of the whole sample, and also to comprehensively quantify the effect of different pore and throat types on tight sandstones, high-pressure mercury intrusion curves were combined with the analysis results of Matlab. Since micron-scale pores and nano-sized pores have different size grades, the pore space, structure, and size that are exhibited are also quite different. The pore characterizations at two different scales are discussed below.
3.2.1. Micron-Scale Pores
Based on casting thin sections, the main pore types of tight sandstone in the He8 section of the study area are mainly intergranular pores (Figure 3a), grain dissolved pores (Figure 3b), and intragranular dissolved pores (Figure 3c). The occurrence of intergranular pores that exist between quartz grains is triangular and long. The dissolved pores are dominated by particle dissolved pores, and some of rock fragments develop intragranular dissolved pores.
To gain a whole quantitative analysis of pore and pore throat in tight sandstones, first, all of the casting thin sections of the sample were pretreated following the above analysis process. Correspondingly, binary images of samples were obtained (Figure 3d–f). Furthermore, based on the main functions ‘size’, ‘bwarea’, ‘bwlabel’, which analyze the statistics for each pixel of the image, each pixel of the casting thin sections image was also analyzed. The distribution histogram of the pore radius is displayed in Figure 4, as well as the average pore radius of every sample.
As shown in Figure 4, the blue line represents intergranular pores in tight sandstones with a low pore radius. The yellow line represents intergranular pores and rock fragment intragranular pores. The pore radius is higher than that of a single intergranular pore, and the purple line represents the dissolved pores and intergranular pores. For this combination, the pore radius distribution is generally higher than the other two pore types.
The pore throat coordination number represents the number of interconnected pores and throats, and is an important parameter for the connectivity of the reaction pores. Similarly, based on ‘bwlabel’ and ‘bwarea’ in the Matlab software, every connected area in which the pixel is 255, the number of pores and throats smaller than 2 μm, and the average pore size were counted and calculated. The number of throat coordination figures is the total number of pores to the total number of connected pores where the distance of connected pores were controlled under 20 μm. The calculated results are consistent with the porosity and permeability of the samples (Figure 5).
As shown in Figure 5, the pore throat coordination numbers of the tight sandstone in the He8 section of the study area ranges mainly from 0.5 to 2.5, with an average of 1.36. The left figure shows the relationship between the average coordination number and porosity with a low correlation coefficient, R2 (0.217). The coordination number and porosity of tight sandstone have a weak positive correlation. The right figure shows the relationship between the average coordination number and the permeability of tight sandstone. The correlation coefficient is 0.856, and the linear relationship is very high. It can be clearly seen that the permeability increases with the increase of the average coordination number, so for tight sandstone, the pore throat coordination ratio is an important influencing factor for the permeability.
3.2.2. Nano-Scale Pore Throats
For the He8 section of the study area, pores and throats developed in the stratum are mainly intercrystalline pores of clay minerals, intergranular throats between secondary overgrowth quartz grains, and microcracks in a small amount of quartz grains. The intergranular pores of minerals are dominated by illite intercrystalline pores and kaolinite intercrystalline pores. Based on the SEM image of the study area and Matlab, the pore size distribution and pore throat radius of every sample in the study area were quantitatively analyzed. However, due to the limitations of SEM, a complete and macroscopic understanding of the sample is absent. So, through combining high-pressure mercury injection experiments with Matlab, the analysis of the pore throat distribution of the whole tight sandstone is systematic and comprehensive.
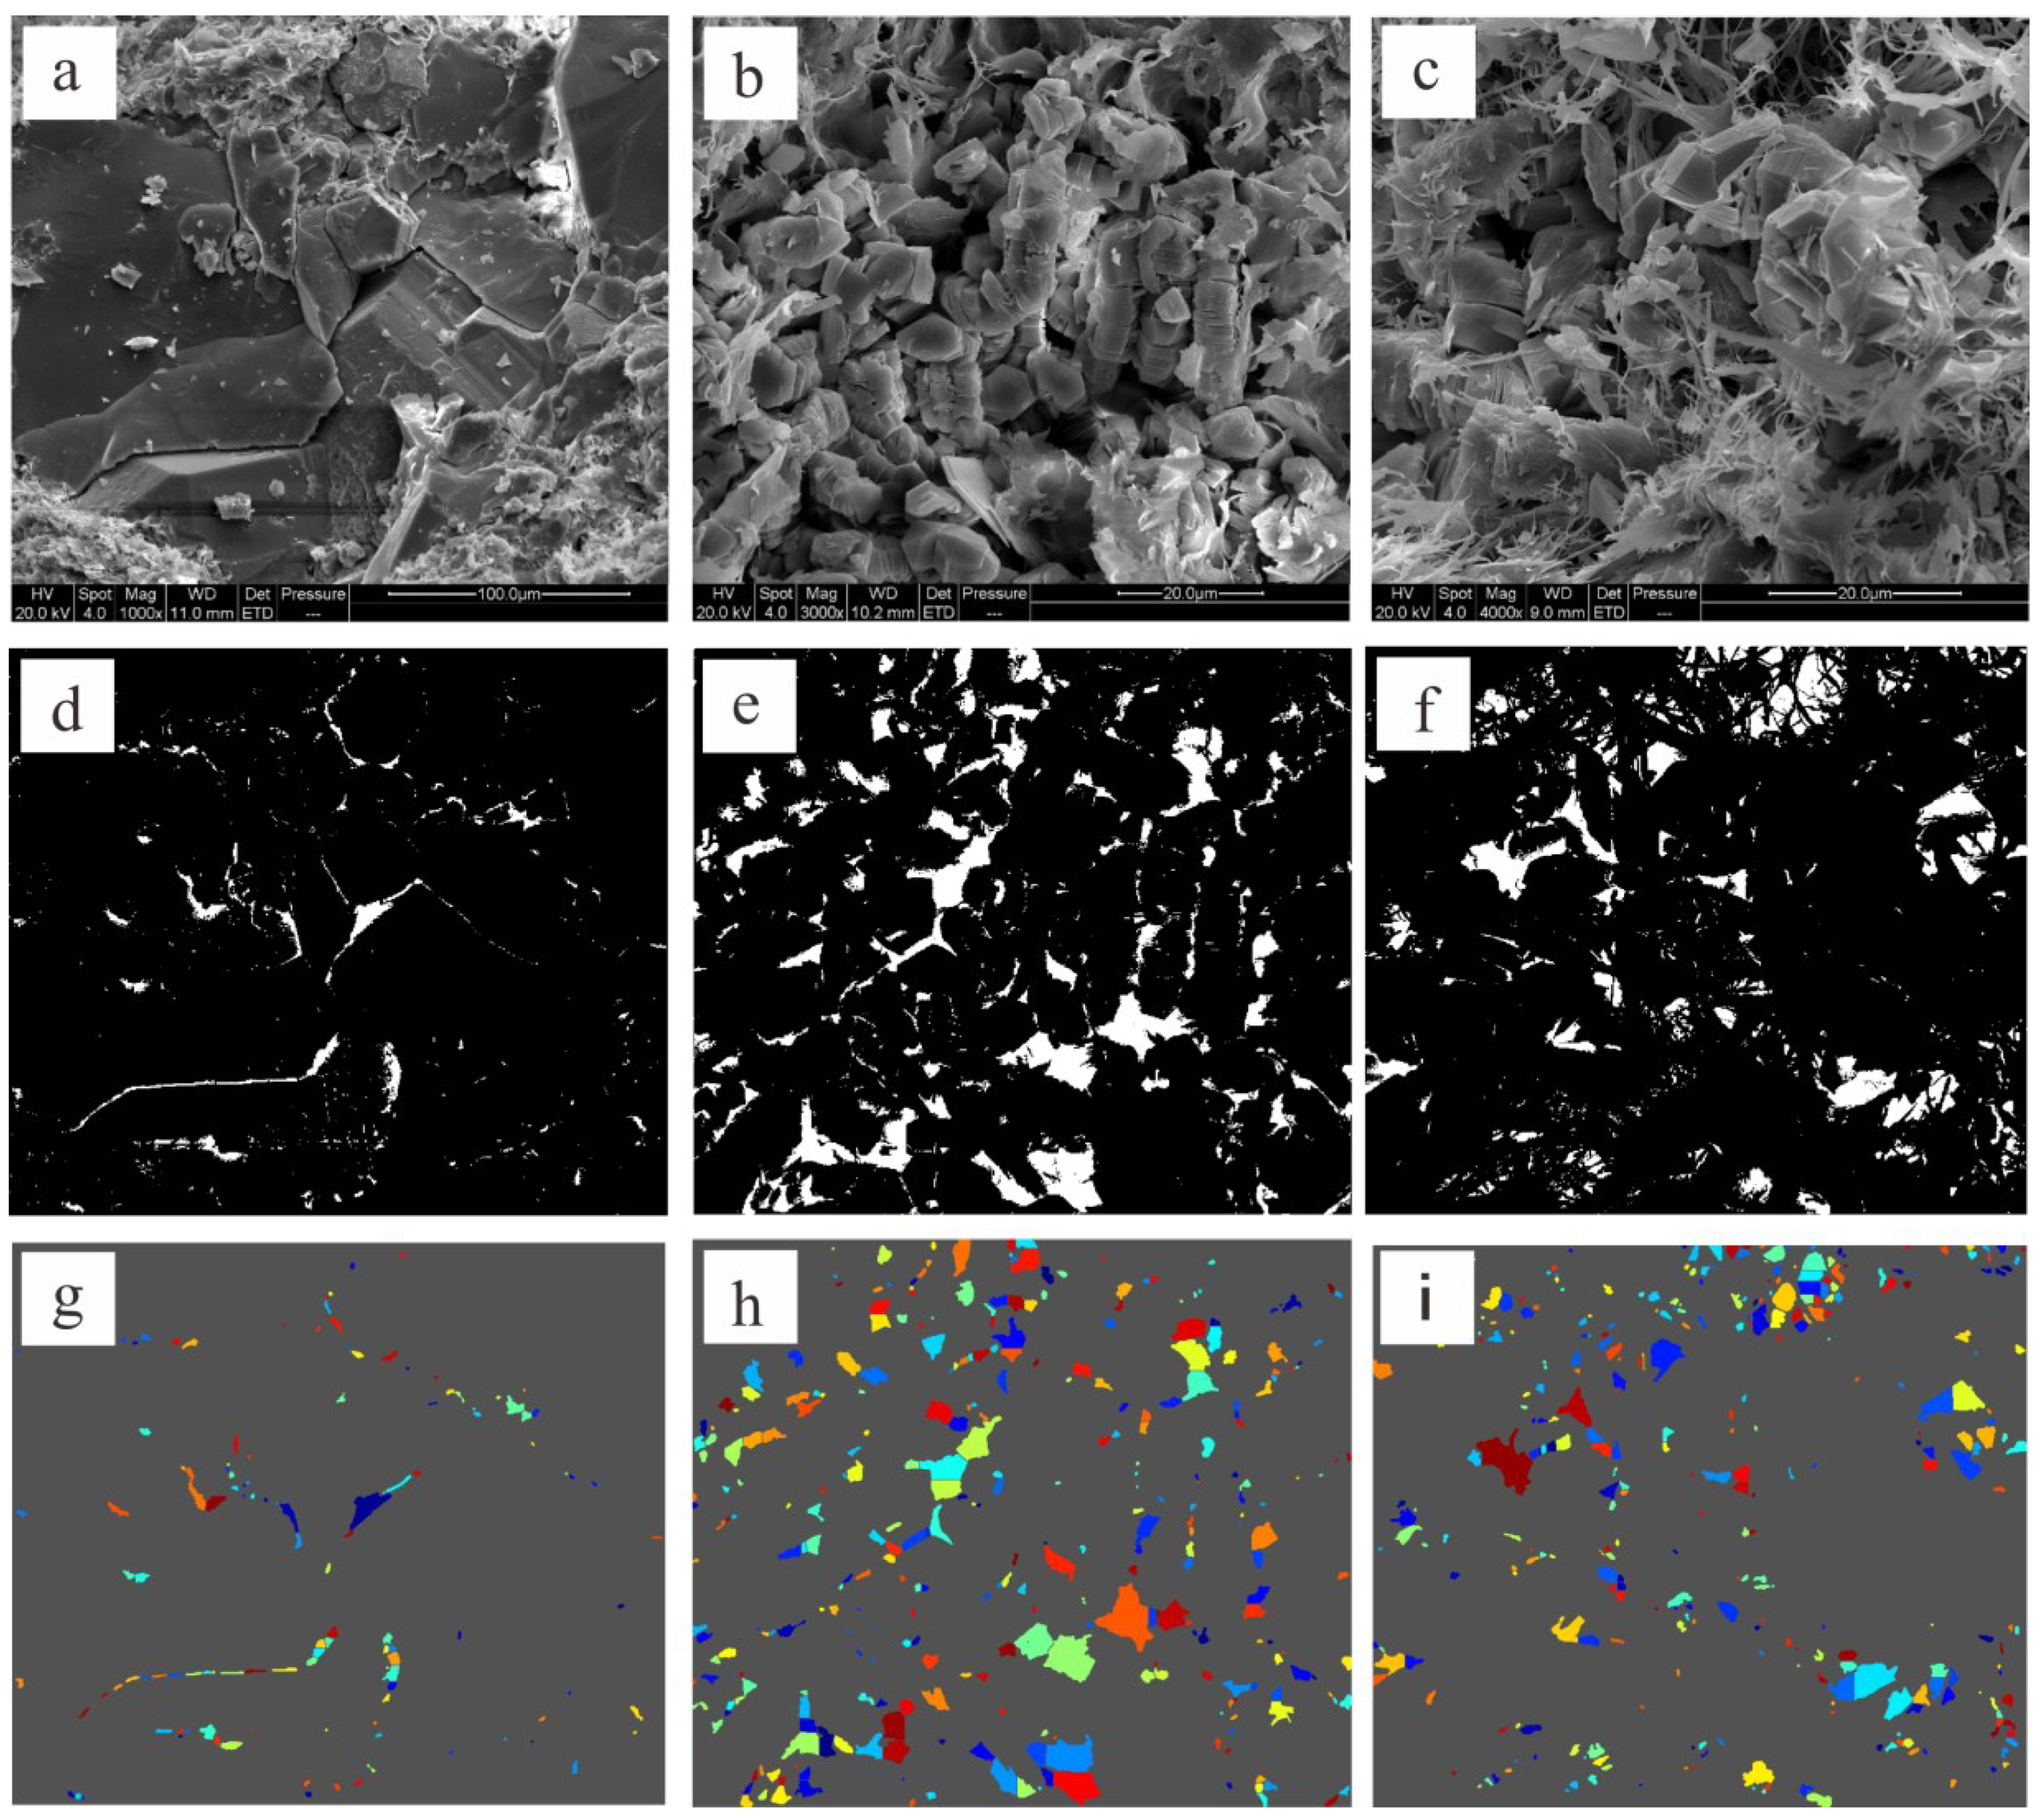
The research method is similar to that of the micron pore throat. However, for the nano-pore throat, throat distribution and size are key points, and three main pore throats are respectively flake throats between the overgrowth quartz grains (Figure 6a), the book-like intercrystalline pores of kaolinite (Figure 6b), and the intercrystalline pores of the illite (Figure 6c). First, the SEM images are binarized (Figure 6a–c) by the ‘Color Thresholder’ application in Matlab, and the corresponding binary images are shown in Figure 6d–f. Furthermore, according to functions ‘bwlabel’ and ‘bwarea’ and related codes, the pore throat size distribution is constructed (Figure 6g–i).
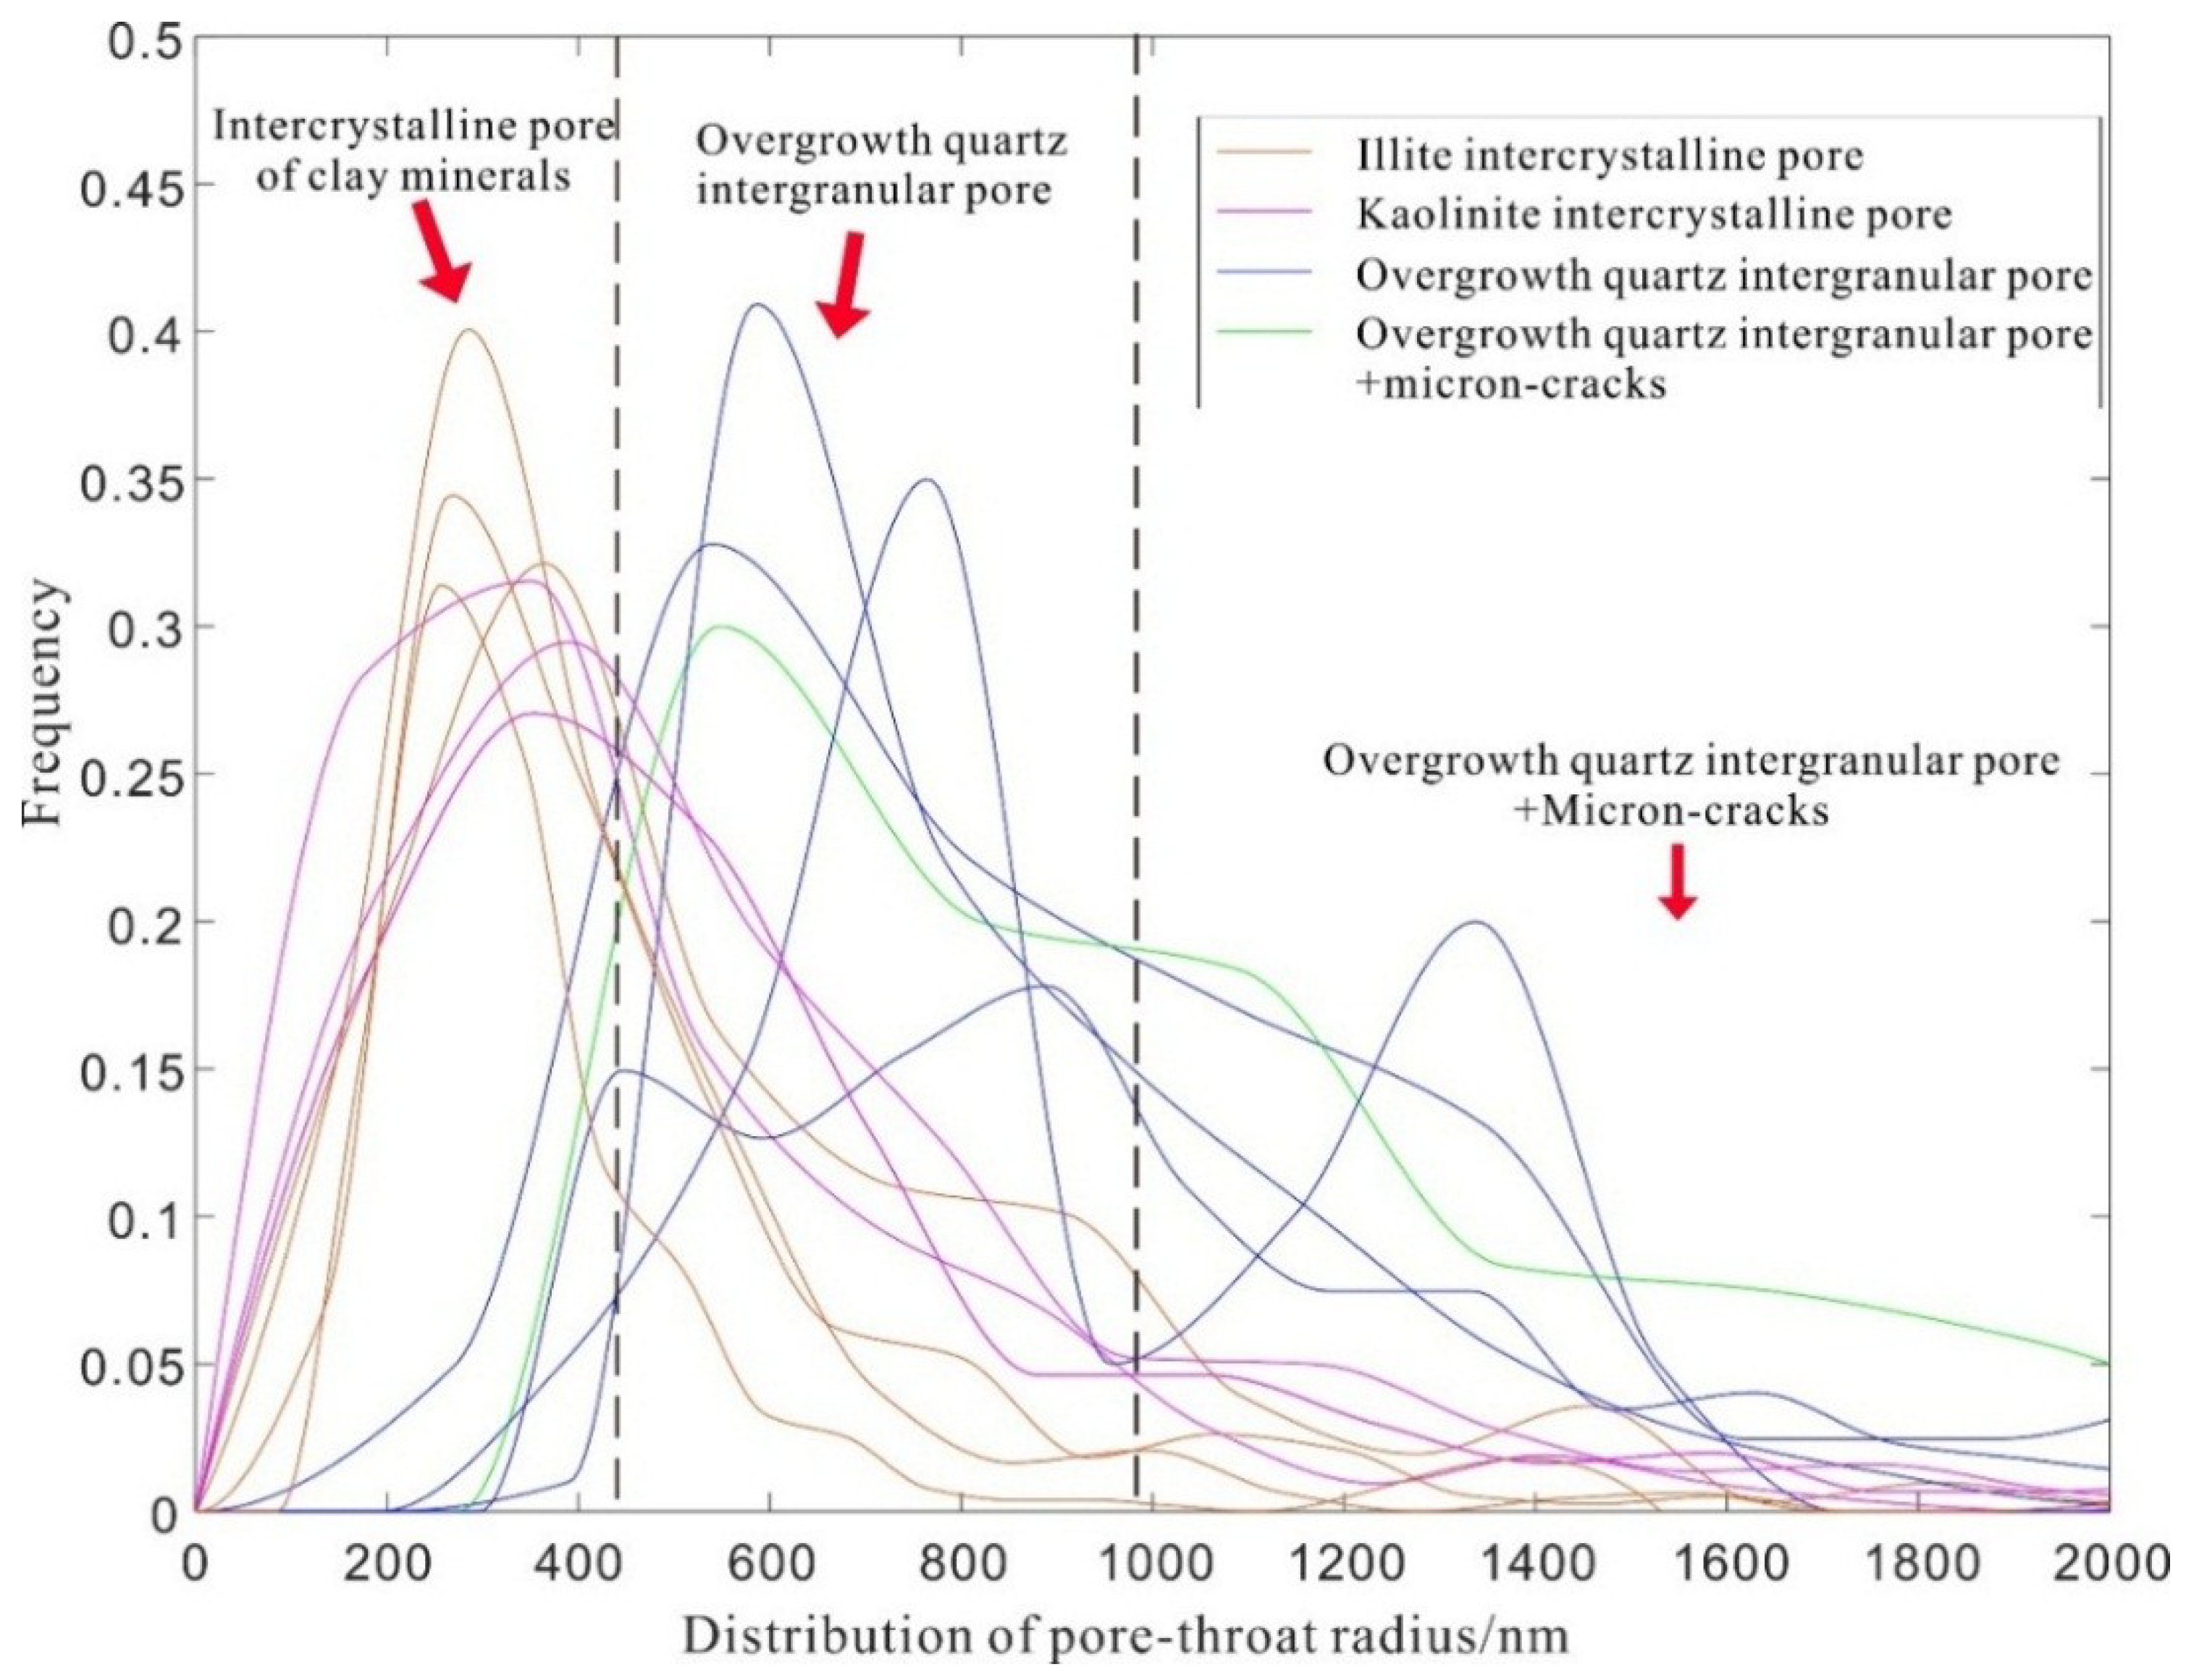
Figure 6g–i shows that the different color areas represent the different pore areas, which are identified by Matlab. Through detailed statistics of various types of pore throats in the study area, the pore throat distribution histogram of the samples is shown in Figure 7. Pore throat statistics consist of illite intercrystalline pores and kaolinite intercrystalline pores, overgrowth quartz intergranular pores, and quartz grains intergranular pores and microcracks in the study area (Figure 7).
In Figure 7, the orange and purple curves represent the intercrystalline pores of clay minerals (intergranular pores of illite and kaolinite). The pore throat radius is mainly concentrated between 0 nm and 600 nm, and is mainly distributed at about 300 nm. The blue curve represents the overgrowth quartz intergranular pores. The pore throat radius mainly ranges from 300 nm to 1200 nm. On the whole, the tight sandstone throat radius of the study area is mainly concentrated in the 200–1000 nm range. A quantitative analysis of the scanning electron microscope images in Matlab can clearly analyze the various types of pore throat radius distribution, including the distribution range, pore throat size distribution, and pore and throat characteristics of every image. However, the overall tight sandstone distribution is poorly fitted on this method. Therefore, combined with the characteristics of high-pressure mercury intrusion curves, the distribution characteristics of the tight sandstone throat can be well displayed in every dimension (Figure 8).
Figure 8 shows the pore throat radius distribution of a whole sample measured by high-pressure mercury intrusion. Based on the quantitative analysis results measured by Matlab, the radius from 0 nm to 600 nm is mainly dominated by the intercrystalline pores of clay minerals, and that larger than 800 nm are dominated by the long intergranular pores between the overgrowth quartz grains. The transition zone ranges from 600 nm to 800 nm, which contains both the intergranular pore throat and the long intergranular pores between the overgrowth quartz grains. The quantitative calculation by Matlab and the high-pressure mercury injection experiment can not only specifically analyze the size and distribution of different types of pore throats, it can also analyze the development status of each pore throat type in the entire tight sandstone.
4. Discussions
4.1. The Effect of the Characterization Parameters on Reservoir Properties
Combining Matlab and the high-pressure mercury injection to quantitatively analyze the pore throat parameters of tight sandstone, the main parameters are simultaneous with the porosity and permeability of the samples. In order to reduce the interaction factors of porosity and permeability, permeability is controlled between 0.35 and 0.55 (based on an average permeability of 0.452), to explore the relationship between average pore throat radius, skewness, sorting coefficient, median pore throat radius, median pressure, average pore throat coordination number, average pore radius, pore throat ratio, and porosity. The results are shown in Table 2. Likewise, we also control the porosity between 6.5–8.5% (based on the average porosity of 7.728%), and explore the average pore throat radius, skewness, sorting coefficient, median pore throat radius, median pressure, coordination number, average pore radius, pore throat ratio, and permeability. The results are also shown in Table 2.
As shown in Table 2, the average pore throat radius, sorting coefficient, median pore throat radius, coordination number, and pore throat ratio of the tight sandstone all have a large impact on permeability (Figure 9). Among these parameters, the permeability of tight sandstone has a positive correlation with the sorting coefficient and the average pore throat radius; the correlation coefficient between them is high. On the contrary, the permeability decreases with the increasing ratio of pore and pore throat, but the linear relationship is lower. Based on the high-pressure mercury injection curve, the porosity is negatively correlated with the median pore throat radius. The median pore throat radius of the study area is mainly affected by the intergranular pore, which was composed of the main reservoir space. The larger the median pore throat, the smaller the throat. When the throat that composed the main reservoir space becomes small, the porosity also decreases. For porosity, it is mainly influenced by the average pore radius, the median pore throat radius, and the coordination number of the tight sandstone, and it is positively correlated with the average pore radius and the average pore throat coordination number, and it is negatively correlated with the median pore throat radius with R2 (0.5). Since the sorting coefficient represents the heterogeneity of pore distribution, the pore throat ratio and average pore throat coordination number represent the development degree of the number of throats, so the permeability is mainly controlled by the pore throat in the tight sandstone. The larger pore-throat radius, the higher the permeability of tight sandstone. For porosity, because the linear correlation coefficient of each parameter is less than 0.5, the correlation with the pore throat parameters is poor.
4.2. Quantitative Analysis Accuracy Using Matlab
4.2.1. Error
When using Matlab to quantitatively analyze the pore throat characteristic parameters of tight sandstone, errors caused by various functions and codes to identify image errors are explored. The experimental errors are discussed below.
Throughout the entire process, from the binarization of casting thin sections to the modeling of pore throat distribution, errors will be produced in any links. Thus, this article measured the porosity of 60 samples by Matlab, from which three samples were taken from each of the samples for the mean value, and the final results were compared with a routine analysis of the cores (Figure 10a).
In Figure 10a, the sample is taken from the tight sandstone in the He8 section of the study area. The red color line represents the measurement result by means of Matlab, the blue color represents the routine analysis of cores, and the four delineated pore types are intergranular pore, dissolved pore and intergranular pore, intragranular dissolved pore and dissolved pore, and microcracks and intergranular pore. It can be seen from Figure 10b that most of the measured values of dissolved pore and intergranular pore, and intragranular dissolved pore and dissolved pore, are more than the actual values. The reason is that noise was produced in the process of image binarization by different color space modes and parameters. The noise caused by the parameter control was treated as pores by Matlab, resulting in an increase in porosity over the actual value. In turn, the result of two other pore types—intergranular pore, and microfracture and intergranular pore—is inverse; most of the measured values are lower than the actual values. This is due to the characteristics of the intergranular pores and microcracks themselves. As there are narrow gaps between some interparticle pores and microcracks, the sizes of the nano-scale pores have not been identified by Matlab. Most of the porosity errors are concentrated between −5% and 10% (Figure 10b), with an average of +4.661%. Among these samples, the average error rate for intergranular pores is −4.370%, and the standard deviation is 8.818. The average error rate of dissolved pore and intergranular pore is +6.734%, with a standard deviation of 6.913. The average error rate of intergranular pore and intragranular dissolved pores +6.144%, with a standard deviation of 6.731. The average error rate of microcracks is −0.314%, with a standard deviation of 9.271. Therefore, a quantitative analysis by Matlab of both intragranular pores, and dissolved pores and intergranular dissolved pores, is most suitable for the tight sandstones of the study area, and the applicability of tight sandstones with microcracks is poor.
4.2.2. Color Space
The accuracy of image binarization directly affects the distribution of pores, and has the most direct effect on quantitative analysis. The premise of image binarization is the perfect selection of color space and the control of parameters. There are four color space modes in the Color Thresholder (RGB, HSV, YCbCr, and L*a*b*). Different color space modes are suitable for different types of images. Take the common “red–grey–white” casting thin sections as an example (grey white is the interference color of tight sandstone, and red is the staining color of pores). Three conventional color space modes of RGB, HSV, and L*a*b* are used to carry out analysis on the same image, respectively (Figure 11). For color mode ‘RGB’, the three variables r, g, and b have a color difference due to the red color in the casting thin sections (r value is not 255), and cannot eliminate the red in the color space very well. Linear transformation controlled by variables in the color space leads to a large amount of noise in the dark minerals, and a matrix in the casting thin sections image. In the L*a*b* mode, ‘L’ represents Luminosity, ‘a’ represents the color range from magenta to green, and ‘b’ represents the color range from yellow to green in the blue range, although the parameter b can eliminate the blue in the image well. However, due to the linear transformation, some of the gray particles will also be affected, resulting in a large amount of noise in the particles. For the HSV mode, the ‘H’ color wheel can easily remove blue as a non-linear transformation in space, without affecting other colors. The most important element is that no noise was produced in this process. So, it is also best suited for tight sandstone casting thin sections.
5. Conclusions
The permeability of the tight sandstone of the study area increases with the average pore throat radius, sorting coefficient, median pore throat radius, and average pore throat coordination number. It has a negative correlation with pore throat ratio and decreases with the increase of the pore throat ratio. The porosity is positively correlated with the average pore radius and the average pore throat coordination number, and negatively correlated with the median pore throat radius.
The quantitative analysis of the pore throat characteristics of all kinds of tight sandstone using Matlab has a mean error rate of +4.661%. The pore structure of intergranular pore and intragranular dissolved pore, and dissolved pore and intergranular pore, is most suitable in this method.
For the tight sandstone of the He8 section of the study area, the greater the average pore throat radius, the sorting coefficient, the median pore throat radius, and the coordination number of the tight sandstone, the better the physical properties of the tight sandstone reservoir.
This study provides a fundamental base and possesses important implications for investigating the gas/oil reserves in tight sandstone. This method is also suitable for other unconventional reservoirs as well.
Author Contributions
H.W., as the supervisor of the subject, designs this experiment and retouch this article. J.B. operates the whole experiment and write this manuscript. H.M. collects and investigates the articles of the experiment. L.F. and L.C. take samples of this experiment from the study area.
Funding
This work was financially supported by the ‘National Natural Science Foundation of China’ (Grant No. 41472136).
Acknowledgments
The authors thank for the help from the key laboratory for marine reservoir evolution and hydrocarbon abundance mechanism in China University of Geosciences in Beijing.
Conflicts of Interest
The authors declare no conflicts of interest.
References
- Wilson, M.D.; Pittman, E.D. Authigenic clays in sandstones: Recognition and influence on reservoir properties and paleoenvironmental analysis. J. Sediment. Res. 1977, 47, 3–31. [Google Scholar]
- Sahimi, M. Flow phenomena in rocks: From continuum models to fractals, percolation, cellular automata, and simulated annealing. Rev. Mod. Phys. 1993, 65, 1393–1534. [Google Scholar] [CrossRef]
- Zou, C.; Zhu, R.; Bai, B.; Yang, Z.; Wu, S.; Su, L.; Dong, D.; Li, X. First discovery of nano-pore throat in oil and gas reservoir in China and its scientific value. Acta Petrol. Sin. 2011, 27, 1857–1864. [Google Scholar]
- Mitchell, J. Rapid measurements of heterogeneity in sandstones using low-field nuclear magnetic resonance. J. Magn. Reson. 2014, 240, 52–60. [Google Scholar] [CrossRef] [PubMed]
- Shao, X.; Pang, X.; Jiang, F.; Li, L.; Huyan, Y.; Zheng, D. Reservoir Characterization of Tight Sandstones Using Nuclear Magnetic Resonance and Incremental Pressure Mercury Injection Experiments: Implication for Tight Sand Gas Reservoir Quality. Energy Fuels 2017, 31, 10420–10431. [Google Scholar] [CrossRef]
- Lyu, C.; Ning, Z.; Wang, Q.; Chen, M. Application of NMR T2 to Pore Size Distribution and Movable Fluid Distribution in Tight Sandstones. Energy Fuels 2018, 32, 1395–1405. [Google Scholar] [CrossRef]
- Wu, K.; Li, X.; Guo, C.; Wang, C.; Chen, Z. A Unified Model for Gas Transfer in Nanopores of Shale-Gas Reservoirs: Coupling Pore Diffusion and Surface Diffusion. Spe J. 2016, 21, 2079–2088. [Google Scholar] [CrossRef]
- Wu, K.; Chen, Z.; Li, X.; Dong, X. Methane storage in nanoporous material at supercritical temperature over a wide range of pressures. Sci. Rep. 2016, 6, 33461. [Google Scholar] [CrossRef] [PubMed] [Green Version]
- Nabawy, B.S.; Rochette, P.; Géraud, Y. Petrophysical and magnetic pore network anisotropy of some cretaceous sandstone from Tushka Basin, Egypt. Geophys. J. Int. 2009, 177, 43–61. [Google Scholar] [CrossRef] [Green Version]
- Wargo, E.A.; Hanna, A.C.; Çeçen, A.; Kalidindi, S.R.; Kumbur, E.C. Selection of representative volume elements for pore-scale analysis of transport in fuel cell materials. J. Power Sources 2012, 197, 168–179. [Google Scholar] [CrossRef]
- Turner, D.M.; Kalidindi, S.R. Statistical construction of 3-D microstructures from 2-D exemplars collected on oblique sections. Acta Mater. 2016, 102, 136–148. [Google Scholar] [CrossRef]
- Nabawy, B.S.; David, C. X-Ray CT scanning imaging for the Nubia sandstone as a tool for characterizing its capillary properties. Geosci. J. 2016, 20, 691–704. [Google Scholar] [CrossRef]
- Wu, K.; Li, X.; Wang, C.; Chen, Z.; Yu, W. A model for gas transport in microfractures of shale and tight gas reservoirs. Aiche J. 2015, 61, 2079–2088. [Google Scholar] [CrossRef]
- Zhang, Y.; Qu, Y.; Wang, J. Effect of crystal size on the catalytic performance of HZSM-5 Zeolite in the methanol to aromatics reaction. Pet. Sci. Technol. 2018, 36, 898–903. [Google Scholar] [CrossRef]
- Zhang, T.; Murphy, M.; Yu, H.; Bagaria, H.G.; Yoon, K.Y.; Nielson, B.M.; Bielawski, C.W.; Johnston, K.P.; Huh, C.; Bryant, S.L. Investigation of Nanoparticle Adsorption During Transport in Porous Media. Soc. Pet. Eng. 2013, 20, 667–677. [Google Scholar]
- Medina, C.R.; Mastalerz, M.; Rupp, J.A. Characterization of porosity and pore-size distribution using multiple analytical tools: Implications for carbonate reservoir characterization in geologic storage of CO2. Environ. Geosci. 2017, 24, 51–72. [Google Scholar] [CrossRef]
- Cam, E.; Gorel, G.; Mamur, H. Use of the Genetic Algorithm-Based Fuzzy Logic Controller for Load-Frequency Control in a Two Area Interconnected Power System. Appl. Sci. 2017, 7, 308. [Google Scholar] [CrossRef]
- Huang, S.; Fang, X.; Liu, D.; Fang, C.; Huang, T. Natural gas genesis and sources in the Zizhou gas field, Ordos Basin, China. Int. J. Coal Geol. 2015, 152, 132–143. [Google Scholar] [CrossRef]
- Hussein, M.; Senjyu, T.; Orabi, M.; Wahab, M.; Hamada, M. Control of a Stand-Alone Variable Speed Wind Energy Supply System. Appl. Sci. 2013, 3, 437–456. [Google Scholar] [CrossRef] [Green Version]
- Koelle, K.; Rodó, X.; Pascual, M.; Yunus, M.; Mostafa, G. Refractory periods and climate forcing in cholera dynamics. Nature 2005, 436, 696–700. [Google Scholar] [CrossRef] [PubMed]
- Najib, N.; Bachok, N.; Arifin, N.; Ali, F. Stability Analysis of Stagnation-Point Flow in a Nanofluid over a Stretching/Shrinking Sheet with Second-Order Slip, Soret and Dufour Effects: A Revised Model. Appl. Sci. 2018, 8, 642. [Google Scholar] [CrossRef]
- Singh, A.; Dehiya, R.; Gupta, P.K.; Israil, M. A MATLAB based 3D modeling and inversion code for MT data. Comput. Geosci. 2017, 104, 1–11. [Google Scholar] [CrossRef]
- Whitehead, H. SOCPROG programs: Analysing animal social structures. Behav. Ecol. Sociobiol. 2009, 63, 765–778. [Google Scholar] [CrossRef]
- Yang, H.; Liu, X. Progress of Paleozoic coal-derived gas exploration in Ordos Basin, West China. Pet. Explor. Dev. 2014, 41, 225–236. [Google Scholar] [CrossRef]
- Zhang, Z.; Sun, K.; Yin, J. Sedimentology and sequence stratigraphy of the Shanxi Formation (Lower Permian) in the northwestern Ordos Basin, China: An alternative sequence model for fluvial strata. Sediment. Geol. 1997, 112, 123–136. [Google Scholar] [CrossRef]
- Zhao, Z.Y.; Guo, Y.R.; Wang, Y.; Lin, D.J. Study Progress in Tectonic Evolution and Paleogeography of Ordos Basin. Spec. Oil Gas Reserv. 2012, 19, 15–20. [Google Scholar]
- Du, W.; Jiang, Z.; Li, Q.; Zhang, Y. Sedimentary characterization of the Upper Paleozoic coal-bearing tight sand strata, Daniudi Gas Field, Ordos Basin, China. J. Earth Sci. 2016, 27, 823–834. [Google Scholar] [CrossRef]
Figure 1.
The location map of the study area.

Figure 2.
Binarization of casting thin section.

Figure 3.
The main types of pore, binary image, and identified binary images of the He8 section of the study area. (a) Y488, intergranular pores of tight sandstones, ×5; (b) Y482, dissolved pores of tight sandstone, ×5; (c) Y391, intercrystalline pore of kaolinite, ×5; (d) binary images of intergranular pores and coordinate bonds; (e) binary images of dissolved pores and coordinate bonds; (f) binary images of intercrystalline pore of kaolinite and coordinate bonds; (g) distribution of intergranular pores identified by the function ‘bwlabel’; (h) distribution of dissolved pores identified by the function ‘bwlabel’; (i) distribution of intercrystalline pore of kaolinite identified by the function ‘bwlabel’.

Figure 4.
Distribution map of different types of pore radius.

Figure 5.
Relationship between average pore throat coordination number and porosity and the permeability of tight sandstone.
Figure 5.
Relationship between average pore throat coordination number and porosity and the permeability of tight sandstone.

Figure 6.
SEM image, binary image, and pore distribution image of pore throat in the He8 Section. (a) SEM image of intergranular pores of overgrowth quartz; (b) SEM image of kaolinite intercrystalline; (c) SEM image of illite intercrystalline; (d) binary image of intergranular pores of overgrowth quartz; (e) binary image of kaolinite intercrystalline; (f) binary image of illite intercrystalline; (g) pore throat distribution of intergranular pores of overgrowth quartz; (h) pore throat distribution of kaolinite intercrystalline; (i) pore throat distribution of illite intercrystalline.

Figure 7.
Distribution of the nano-scale throat radius of the He8 section.

Figure 8.
Distribution of pore throat based on a high-pressure mercury injection experiment.

Figure 9.
Diagram of different parameters of pore throat and porosity and permeability.

Figure 10.
Porosity measurement comparison chart with two experimental methods. (a) the left figure shows the porosity difference of different experimental methods; (b) the right figure shows the error of different experimental methods.
Figure 10.
Porosity measurement comparison chart with two experimental methods. (a) the left figure shows the porosity difference of different experimental methods; (b) the right figure shows the error of different experimental methods.

Figure 11.
Color space changes before and after binary image processing.


Table 1.
The advantages and disadvantages of different experimental methods [4,5,6,7,8,9,10,11]. 2D: two-dimensional, 3D: three-dimensional.
| Analysis Method | Advantages | Disadvantages |
|---|---|---|
| FIB(Focused Ion beam) | 3D pore space distribution and characterization | Lack of specific point of the reservoir |
| X-CT (X-ray computed tomography) | ||
| SEM | 2D pore throat distribution | The whole pore throat distribution |
| High resolution 3D model | ||
| High resolution 2D image | ||
| Nuclear magnetic resonance | Accurate porosity and pore throat distribution | Main range under 10 mm |
| Gas adsorption | Specific surface area | Micron pore |
| Pore radius size | ||
| High pressure mercury injection | Porosity | Main range from 3.6–1 mm pores |
| Pore throat radius |
Table 2.
Relation coefficient between different parameters of pore throat and porosity and permeability.
Table 2.
Relation coefficient between different parameters of pore throat and porosity and permeability.
| Characteristic Parameter of Pore-Throat | Permeability | Porosity |
|---|---|---|
| Average Pore Throat Radius/μm | +0.693 | −0.080 |
| Skewness | +0.014 | −0.001 |
| Sorting Coefficient | +0.702 | −0.005 |
| Median Pore Throat Radius/μm | +0.445 | +0.264 |
| Median Pressure (MPa) | +0.169 | +0.145 |
| Average Pore Throat Coordination Number | +0.856 | +0.217 |
| Average Pore Radius/μm | +0.021 | +0.375 |
| Pore Throat Ratio | −0.448 | −0.007 |
© 2018 by the authors. Licensee MDPI, Basel, Switzerland. This article is an open access article distributed under the terms and conditions of the Creative Commons Attribution (CC BY) license (http://creativecommons.org/licenses/by/4.0/).
Share and Cite
MDPI and ACS Style
Jiu, B.; Huang, W.; He, M.; Lv, C.; Liang, F. Quantitative Analysis of Micron-Scale and Nano-Scale Pore Throat Characteristics of Tight Sandstone Using Matlab. Appl. Sci. 2018, 8, 1272. https://doi.org/10.3390/app8081272
AMA Style
Jiu B, Huang W, He M, Lv C, Liang F. Quantitative Analysis of Micron-Scale and Nano-Scale Pore Throat Characteristics of Tight Sandstone Using Matlab. Applied Sciences. 2018; 8(8):1272. https://doi.org/10.3390/app8081272
Chicago/Turabian StyleJiu, Bo, Wenhui Huang, Mingqian He, Chenhang Lv, and Fei Liang. 2018. "Quantitative Analysis of Micron-Scale and Nano-Scale Pore Throat Characteristics of Tight Sandstone Using Matlab" Applied Sciences 8, no. 8: 1272. https://doi.org/10.3390/app8081272
Note that from the first issue of 2016, this journal uses article numbers instead of page numbers. See further details here.