1. Introduction
Uninterruptible Power Supply Systems (UPS) are utilized as back-up source in electrical systems. They can be classified according to DIN 62040-3 [
1] as a static, rotary or hybrid system. The static UPS always consists of batteries, which shall provide energy during grid disturbances or grid failures. In the event of a grid failure the critical load of the connected customer must be covered and the batteries are discharged. However, for most of the operation time the battery is kept at 100% state of charge (SoC) by a so-called float charge. Under these conditions and without regular check-ups or additional measurements the operator is usually unable to estimate the discharge behavior and thus the available capacity or state of health (SoH, which equals 1 in the new state and decreases to 0 at the defined end-of-life (EoL)). Due to calendric and cyclic aging the SoH decreases over the battery lifetime. Therefore, frequent maintenance is necessary to determine this value as an indicator for the available capacity under a specific load.
One common but strongly discussed measure for the SoH of a battery are impedance or admittance readings as they are non-invasive and cause no down time compared to regular capacity tests. It is expected that the measured impedance increases over the lifetime of the battery and thus with decreasing SoH [
2,
3,
4,
5,
6]. Likewise, the admittance decreases. It should be noted that due to run-in processes and an incomplete formation the measured impedance can decrease at the beginning of utilization. Kiel et al. have shown in [
6] the exponential increase of the impedance measured at 69 Hz with the first LEM Sentinel sensor. In their experiment, 160 Ah batteries with an absorbent glass mat (AGM) separator were exposed to an accelerated aging test corresponding to a typical UPS application profile. The impedance values were measured at 100% SoC with superimposed charge currents (float charge). After a capacity decay of roughly 20% of the highest measurable capacity the impedance at this frequency has increased by over 45%.
However, the way of measuring the battery impedance and thus the gained values vary in literature and the field. Huet [
7] has published a comprehensive overview on the different techniques and their implications. One variation, which makes the comparison between historic measurement results difficult, is the utilization of potentiostatic or galvanostatic devices. The latter method uses the current excitation signal and measures the voltage response. It is preferred over potentiostatic measurements as similar voltage levels can be reached at completely different states of the battery [
8]. This can be due to overvoltages caused by a changed SoH or due to acid stratification. Therefore, impedance measurements which shall be used for state diagnostics should use a current excitation signal. In that case the voltage amplitude needs to be controlled during the measurement [
7].
However, even with the same method the excitation signal can deviate. For example, monitoring systems such as the LEM Sentinel 2 sensor introduce a half wave signal at a frequency of about 70 Hz while the impedance measurement device by Hioki (here BT3554) measures with a 1 kHz sinusoidal signal. There are much more commercial solutions for impedance monitoring available. Here a handheld and an online monitoring system, for which the measurement technique is known, were chosen and compared. On the one hand, Kiel [
6] has proven that the impedances gained by a half wave signal are close to the impedance values extracted from sinusoidal signals over the lifetime of a battery. On the other hand, the theory of electrochemical impedance spectroscopy (EIS) of battery systems claims that the impedances at specific frequencies describe different processes within the battery [
9]. Furthermore, Kwiecien et al. [
10] have presented that the impedances of lead-acid batteries at different frequencies have also different relative changing rates over the battery lifetime. Thus, these measurement devices will show deviating absolute values and relative increases. Additionally, the impedance reading is influenced by the overlaying direct current (DC) and is dependent on SoC and temperature. Therefore, a clear understanding of the measurement and its conditions is necessary to get to the right implications for maintenance decisions.
While the relative increase of one specific impedance reading at one frequency can be a good indicator for early failure detection [
2], a reliable absolute correlation between available capacity and the gained impedance at only one frequency over the lifetime of a lead-acid battery is hard to find [
3,
4,
5,
6,
11]. This is because singular impedance readings regardless of the measured frequency cannot derive all parameters that affect the available capacity. In addition, Kwiecien et al. [
10] have shown that the frequency range of one specific process (e.g., charge transfer of the negative electrode) changes with SoH. Consequently, the choice of single-frequency measurements must be made with care.
A more descriptive evaluation of one battery’s electrical behavior can be derived via the simulation of a representative equivalent electrical circuit (EEC). The parameters of such an EEC are gained through the fitting of impedance spectra measured with EIS. Consequently, faster and slower processes can be parameterized. Diverse EEC-based models have been described in literature (for an overview see [
12]). The main components are typically the inductive element (L), the inner resistance (
Ri) as sum of the half-cell resistances, and two RC-elements with
Rct,NAM,
Cct,NAM and
Rct,PAM,
Cct,PAM representing each one charge transfer (ct) at the negative active mass (NAM) and positive active mass (PAM). It is expected that the different processes and thus the parameters of the underlying EEC do change differently not only with SoC (e.g., [
13,
14]), current rate (e.g., [
14]) and temperature but with SoH of the battery (e.g., [
5,
10,
11,
15]).
In addition, different aging mechanisms are expected to vary the EEC elements distinguishable. The common aging mechanisms of a lead-acid battery can be summarized as sulfation, corrosion, water loss and shedding of active mass (for further description see [
16]). For the conducted experiment under UPS conditions with commonly used valve-regulated lead-acid (VRLA) batteries corrosion and water loss or dry out in combination with contact loss between electrodes and separator are often detected degradation mechanisms ([
17,
18], see also tear down analysis in [
2]). Nevertheless, the operation in large strings under float charge conditions can cause voltage deviations between the batteries. This can lead to batteries at high voltages while other batteries stay below the necessary charging voltage. Consequently, in strings with high voltage deviations, sulfation due to undercharge conditions can also be investigated [
18,
19]. In VRLA such an undercharge can also occur in each cell due to an imbalance between the two electrodes [
20].
Several authors have investigated the influence of the aforementioned aging processes on the EEC elements. For resistance measurements, Kurisawa and Iwata [
5] describe that water loss and corrosion in VRLA batteries can be distinguished through the comparison of voltage drops after 500 μs (2 kHz) and 5 s (0.2 Hz) within a discharge pulse (the rated current was 0.15 C
n). Before the test the battery was in open circuit voltage (OCV) state at 100% SoC. According to the authors, the short-term drop describes the internal resistance and thus, the change due to corrosive attack of the positive electrode. The second voltage deviation is caused by diffusion processes and gives an indication for the change due to water loss.
Subsequent to this time domain evaluation, Handschuh measured in [
11] the change of electrical parameters for the full battery as well as the single electrodes in the frequency domain. Therefore, he performed a cyclic and an overcharge test. The latter is closest to the focused application of UPS systems. It was conducted on a 12 V AGM battery (95 Ah with 4 I
20 discharge current), which was charged with 2 A for 100 h and no voltage limitation. I
20 stands for the current value, which discharges the battery in 20 h. It is equivalent to a current rate of 0.05 C
20, which is referring to the nominal 20 h discharge capacity. The positive electrode saw overpotentials of 225 mV. Nevertheless, based on gas analysis the author expected that the overcharge has led mainly to water loss and that corrosion was negligible. The EEC parameters were extracted from impedance spectra performed with the Gamry impedance spectroscope and a superimposed 10 A DC discharge current. It was found that the water loss has led to an increase in the fitted parameter
Ri. This parameter represents the internal resistance and was measured at high frequencies where the imaginary part is close to 0.
Ri had increased by about 27% at 50% SoC but showed only a slightly higher value at 100% SoC. Other aging mechanisms such as sulfation or the combination in cycling had no influence on the inner resistance. Consequently, the author states that the pure inner resistance measured at high frequencies and high SoC is not a good indicator for the capacity loss. For the cyclic test with sulfation as main aging mechanism, he proofs that the measurement of the charge transfer resistances can be correlated with the SoH. From his findings the development of impedances between 100 Hz and 1 Hz shall be monitored for changes on the negative electrode capacity, while impedances between 1 Hz and 0.01 Hz would give an indication for the positive electrode. According to [
11] both values need to be measured for a correct indication, as the capacity limitation can be due to either one of the electrodes or the electrolyte. Such a separation of electrodes according to frequency range in the impedance spectrum have also been suggested by [
8].
Pilatowicz et al. [
15] have studied the change of EEC elements for a 12 V flooded starting-lighting-ignition (SLI) battery tested with a driving profile. In this profile cycles with high currents (20 I
20) and different depth of discharges (up to 50%) were combined with pause phases. The expected aging mechanism was sulfation of the negative electrode. EIS measurements were regularly conducted with an EISmeter at 80% SoC and excitation frequencies between 5 kHz to 1 mHz and superimposed DC current. The spectra were fitted to a simple
Ri and RC circuit. The latter shall describe the process measured between 100 Hz up to 10 Hz. The change of these parameters with SoH was analyzed. An exponential increase of the internal resistance
Ri with increased capacity loss and a linear increase of
Rct as well as a linear decrease of the corresponding capacitance of the single RC-element was found.
In summary, literature and field experience agree that changes in impedance are a good indicator for a failing battery. However, a good correlation between measured impedance and available capacity or SoH still needs to be found. Furthermore, there are controversial statements about the visibility of different aging effects within the general EEC elements. However, most agree that the different aging mechanisms shall be detectable within the change of the EEC parameters.
While other authors have analyzed the change of impedance measurements at one specific frequency during accelerated aging (e.g., [
6]) or under standard UPS conditions (e.g., [
3]), the authors of this work want to show the change of the full spectrum during standard float charge operation at room temperature. The experiment shows how the EIS and the extracted parameters of the EEC evolve over time for selected batteries of the two UPS strings under test. The analyses shall show the influence of the expected aging mechanisms on the impedance values. Aging mechanisms due to cyclic profiles shall be excluded. Furthermore, the changes at specific frequencies are evaluated to give an indication for the best frequency range for measurements and the possible interpretation of the data. The concept of comparing the evolution of impedance changes at different pulse durations or frequencies described by [
5,
11] shall be adopted for the suggested battery monitoring. Additionally, the indications gained from EIS measurements as well as the parameter fitting are compared to those of the two commercial devices (LEM Sentinel 2 and Hioki BT3554).
2. Materials and Methods
In
Section 2.1 the test setup of the UPS lifetime test is described in detail. It is followed by an explanation of the utilized devices for continuous (
Section 2.2) measurements and regular check-ups (
Section 2.3). Finally, the fitting of the EIS measurements and the utilized electrical model will be elaborated in
Section 2.4 and a theoretical explanation of the influence of aging mechanisms on the EEC elements is given in
Section 2.5.
2.1. Test Setup of UPS Systems
For this experiment two serial battery strings (in the following named as string 2 and string 3) consisting each of 24 battery mono-blocks with a nominal voltage of 12 V were installed in October 2016. Before the installation the battery voltage, weight and inner resistance were measured during inventory. The latter was taken with the same Hioki BT3554 as in the following regular check-ups described in
Section 2.2. The key parameters of the utilized batteries are listed in
Table 1. The Panasonic batteries (string 3) showed a slightly higher deviation in inner resistance while the Yuasa batteries (string 2) had a much lower weight as stated by the data sheet of the manufacturer. However, overall, the batteries in one string are very similar to each other, which is important for the aging test.
Both strings are connected in parallel with a third string to a power supply system by convertec (M5000-12). This rectifier charges the batteries with a constant-current constant-voltage (CC-CV) charging program. The maximum current can be 1.6 A and the nominal voltage per string is set to 328.80 V at 20 °C. This results in theoretical 13.70 V per mono-block, which was the recommended floating voltage for the sealed lead-acid batteries. Between −20 °C and +60 °C the voltage is linearly compensated with 26.4 mV per 1 °C and block, subsequently a lower voltage is set at higher temperatures then 20 °C. During further float charge (CV-phase) the rectifier performs pulse tests every 300 s with forced discharges over a 30 kΩ resistor for 2 s (~0.011 A). This is part of an internal functionality test. Its status is “ok” as long as the string voltage stays above 270 V.
In the field, different float voltages will be utilized in accordance to manufacturer recommendations. The influence of different float voltages on the measurable inner resistance is not part of this analysis. Instead, the current work is focusing on the change of impedance readings with the operation lifetime of the batteries. Nevertheless, a further evaluation of the impedance dependency on the registered voltages within this test is included in
Appendix A. It shows no clear correlation of these two values for the devices under test.
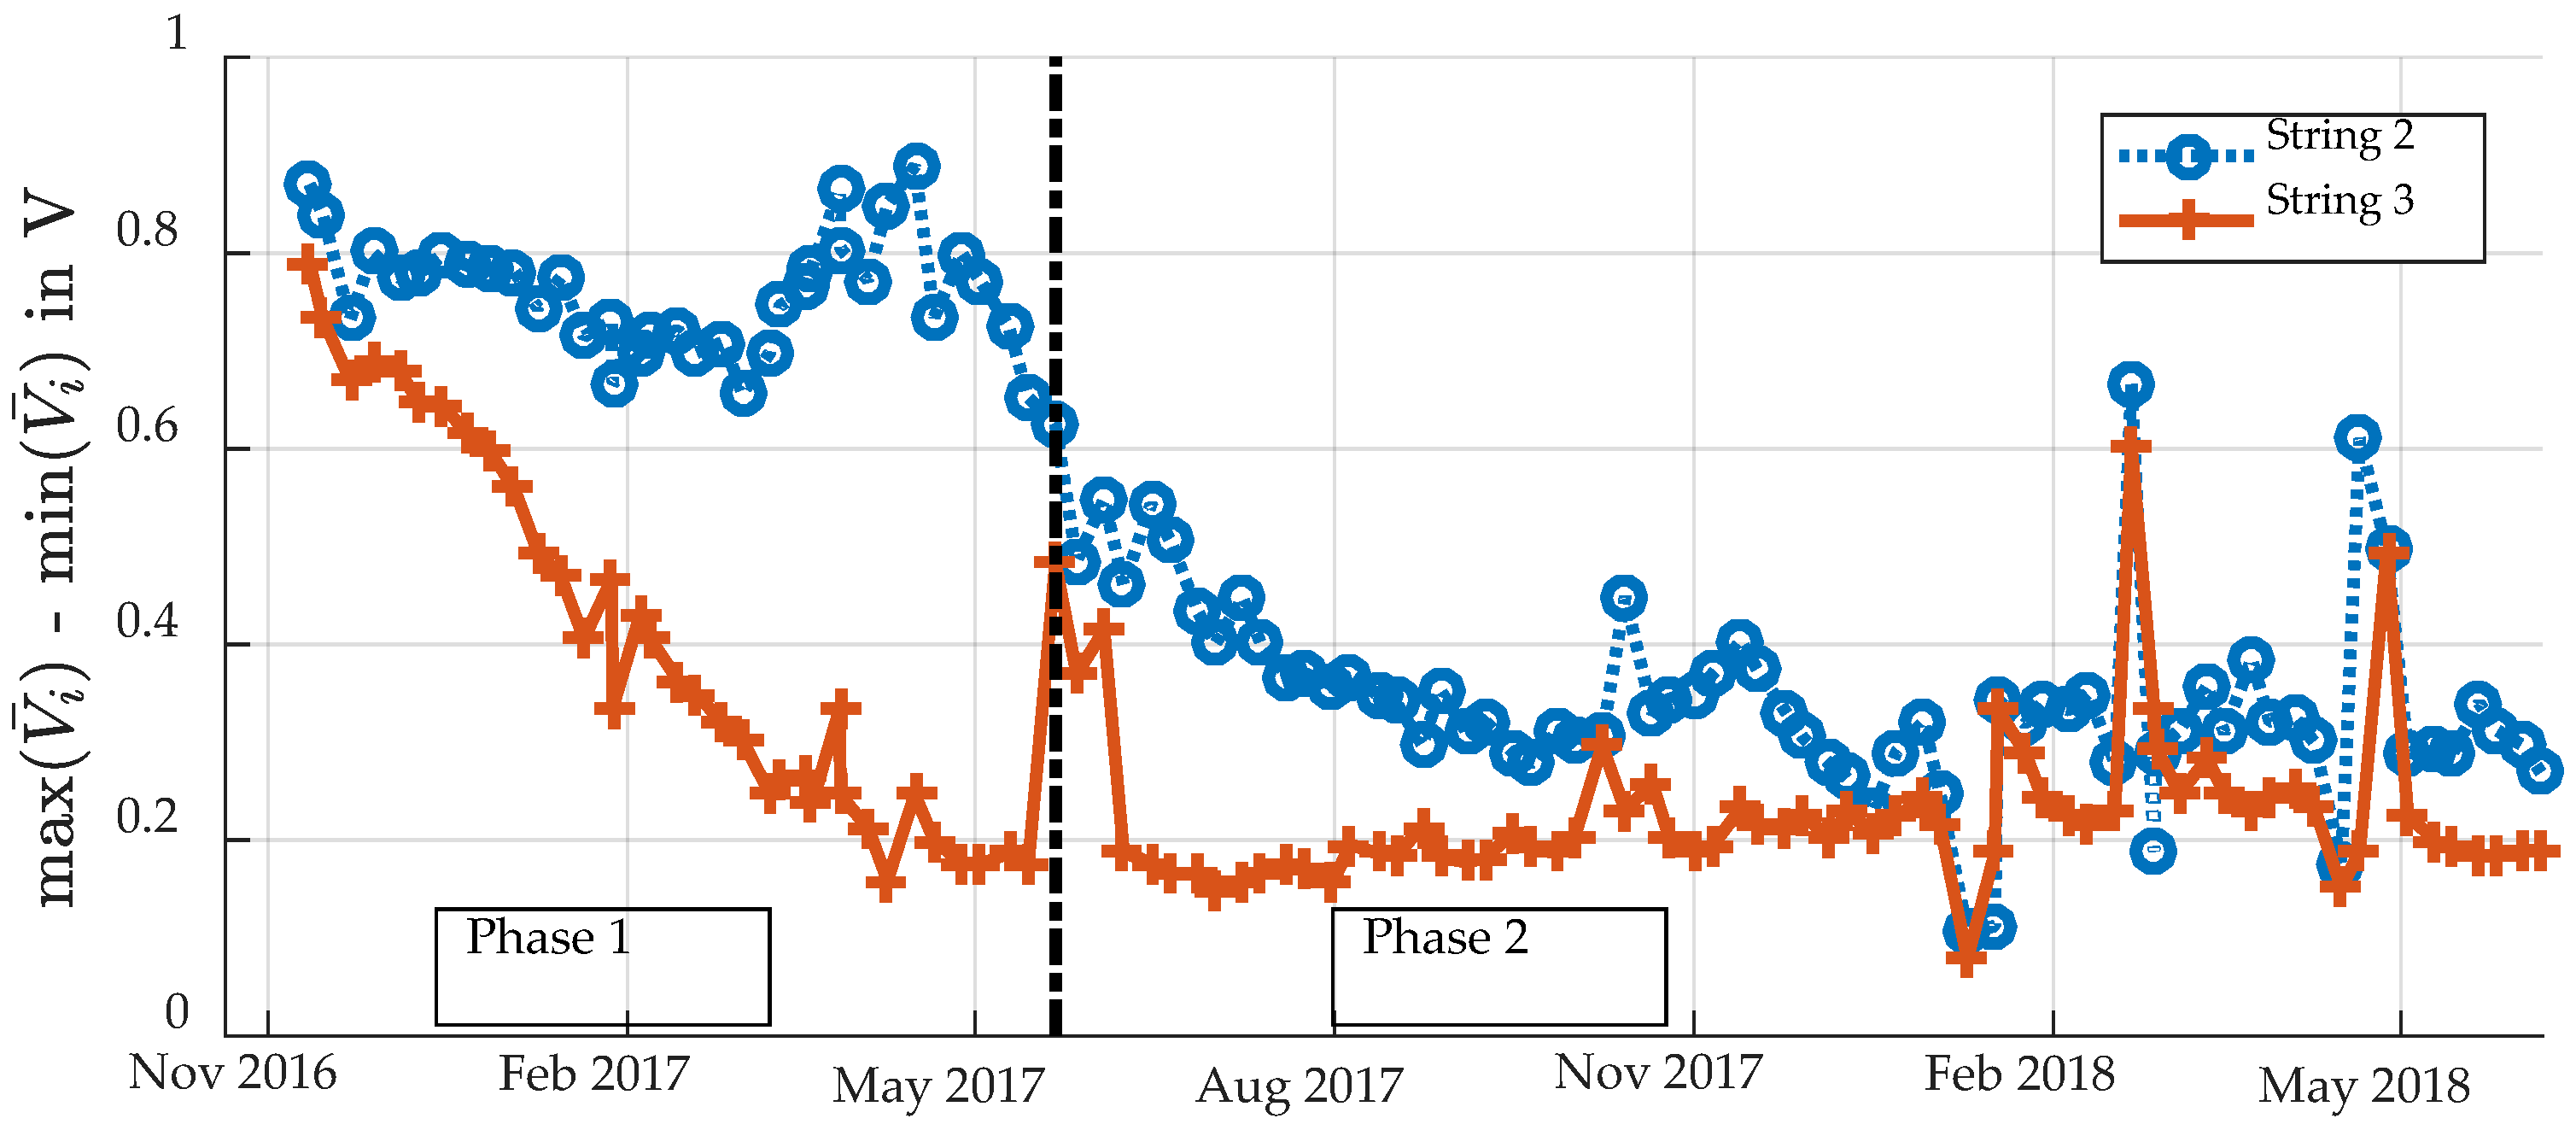
The average voltage per mono-block for string 2 (Yuasa) and string 3 (Panasonic) is 13.53 V during the full test period (including pause phases). String 2 has a higher deviation on average within the string of 0.115 V compared to 0.061 V for string 3. This is counterintuitive if the initial resistances and the measured deviation shown in
Table 1 are considered. However, over the course of the float charge operation the difference between the minimum and maximum weekly average voltage (
, with
i = [1, 24]) of string 2 stays longer at higher values compared to string 3. Consequently, for the following analysis of the mean voltages the measurement was divided into two phases. The first phase ends as soon as the voltage deviation of the string 2, presented in
Figure 1, sinks below 0.5 V. This was the case on the 21th of May 2017. This measurement indicates that string 3 has a faster equalization among the batteries e.g., through a better activation of the oxygen recombination cycle. At the beginning of the VRLA battery life, the process of oxygen recombination at the negative electrode is typically hindered due to a lack of open channels in the saturated AGM fleece [
11]. Gas channels emerge with water loss and allow for a faster diffusion of oxygen and thus higher recombination efficiency. With this comes a depolarization of the negative electrode (see also [
11] page 56) and as a result, the deviation in voltage among batteries with limited charging voltages decrease.
The whole test bench was set up in an air-conditioned room. The mean measured temperatures for string 2 and 3 were 20.5 °C and 20.1 °C. Minimum temperatures of 13.4 °C and 12.5 °C were reached for a period of 29.5 days from mid-November to December 2017 and were due to a failure of the air conditioning system. The maximum temperatures were 24.1 °C and 23.3 °C, respectively, while the standard deviation of the mono-block average temperature within one string is below 1 °C and thus within the measurement error of the device.
The batteries are continuously connected to the rectifier except for the duration of the regular check-up (about 2–3 days). In these cases, the batteries are disconnected completely, and selected batteries are taken out for additional measurements. The exact procedure is described in
Section 2.2 and
Section 2.3. The remaining batteries stayed connected to the LEM Sentinel 2 sensors, which were used for continuous measurements. Due to the current consumption of the LEM Sentinel 2 (10 mA) a slow discharge of the remaining batteries occurs within this period, which is approximately the same capacity discharged from the selected batteries during EIS measurements.
2.2. Continuous Measurements
For the experiment the voltage, temperature and inner resistance of each 12 V mono-block were measured with a LEM Sentinel 2 sensor. Each monitoring device was connected via clamps to the poles of the battery. These clamps offered a separate connection for the power and sense cables. Such a 4-point measurement reduces the interference of the current signal within the voltage measurement. The manufacturer states the following measurement ranges and accuracies [
21]:
voltage: +4.8 to +15.0 V (±0.5%)
temperature: −10 to +70 °C (±2 C)
impedance: 0.05 to 250 mΩ (±2%)
The LEM Sentinel 2 measurements were steered through an own LabView program, which utilizes the communication protocol given by the manufacturer. Voltages are measured every 10 s, temperatures every 100 s and the impedance of one mono-block is measured every 14 h. Additionally, voltage and temperature were logged before and after each impedance measurement event.
For the impedance measurement the LEM Sentinel 2 generates a half wave signal with a discharge pulse of 1.8 A, which is kept constant for 6.86 ms and repeated for 4.2 s at a frequency of 69.58 Hz. This behavior was measured via a Hameg HMO724 oscilloscope and also documented by [
4]. Via a high-pass filter the measured voltage response is aggregated to a root mean square (RMS) value. With its constant current and the voltage response the modulus of the impedance is registered [
4,
6]. The LEM Sentinel 2 is designed to measure the impedance during float charge conditions. Nevertheless, for the comparison with the check-up measurements the influence of the superimposed charge current was evaluated and compared to a measurement under OCV conditions. The measurement was performed at 24 °C. The deviation between a measurement with current flow, which was here smaller than 12.5 mA, and the subsequently conducted measurement without current and after voltage relaxation is shown in
Table 2. The measurable deviation is within the range of accuracy. Thus, it can be concluded that an influence of the small superimposed DC charge current will not be detectable in the Sentinel measurements over time. The current measurement for each string was performed with a shunt 1 mΩ by Weigel (50 mV per 50 A with an accuracy of 0.5%). The voltage signal of the shunt was logged by a Gantner Q.bloxx A104 module with a registration rate of 10 Hz.
2.3. Check-Up Measurements
Check-up measurements have been conducted after 184, 324, 456, 514 and 568 days under float charge conditions. An initial measurement was performed after a few days under float charge and is marked with 0. The check-ups were first conducted after longer periods under float charge as no changes were expected and the influence of the check-ups should be kept as small as possible. Within the process of writing this paper the check-ups were performed more frequently. For the check-up the strings were disconnected from the power supply.
In a first step, the impedance of each mono-block was measured with a Hioki BT3554 within the first 12 h after disconnection. The Hioki was connected through the pin type leads 9465-10 to perform a 4-terminal measurement. For the chosen measurement range of 30 mΩ or 300 mΩ a sinusoidal signal with excitation currents of 160 mA or 16 mA, respectively, is introduced into the battery at a frequency of 1 kHz ± 30 Hz [
22]. The accuracy of the impedance reading is given with 3% (with ±0.8% on the reading (rdg.) ± 6 digits (dgt.) absolute error due to the resolution). The influence of superimposed charge currents on the impedance reading was measured simultaneously to the LEM Sentinel 2 test described above.
Table A1 in
Appendix A summarizes the results. It can be concluded that the small charge current does not influence the measured resistance above the range of accuracy. However, for the analysis over time only the measurements in disconnected state without current flow and after some relaxation will be compared.
In a second step, the EIS measurements were conducted on five selected batteries with an impedance spectroscope developed by ISEA. It is described in more detail in [
8,
23]. The device is called μEIS and is a pre-version of the now commercially available EISmeter from Digatron [
24]. The frequency of the excitation signal has been varied between 6.25 kHz and 10 mHz with 8 measurement points per decade and a minimum of 3 periods per frequency. The μEIS is a galvanostatic impedance spectroscope, which imposes a sinusoidal current on the battery and the voltage response is measured. The amplitude of this AC signal was set to a maximum of 0.5 A. Based on the amplitude of the voltage signal the current is then automatically decreased for decreasing frequency or increasing impedance respectively. The AC voltage response is controlled and kept in a limit of ±18 mV for the 12 V battery. Each battery was at full state of charge before the EIS measurement, which was first conducted with no overlaying DC current (0 DC) and afterwards with a discharge current of 0.35 A (~I
20 DC). The resulting voltage drift during measurement is automatically compensated. The discharge was performed according to the description of mini-cycling during impedance measurements as suggested by Karden et al. [
8] and refined by Budde-Meiwes et al. [
25]. In this process the EIS measurement starts after a discharge of 1% C
n (the nominal capacity) and is conducted during the discharge of another 4% C
n. Here the discharge is steered through a time limit of 1 h and thus a maximal discharge of 0.35 Ah. Furthermore, the batteries were kept at room temperature within a water bath. The cable connection as well as the measurement channel was kept equal for all check-ups and each battery.
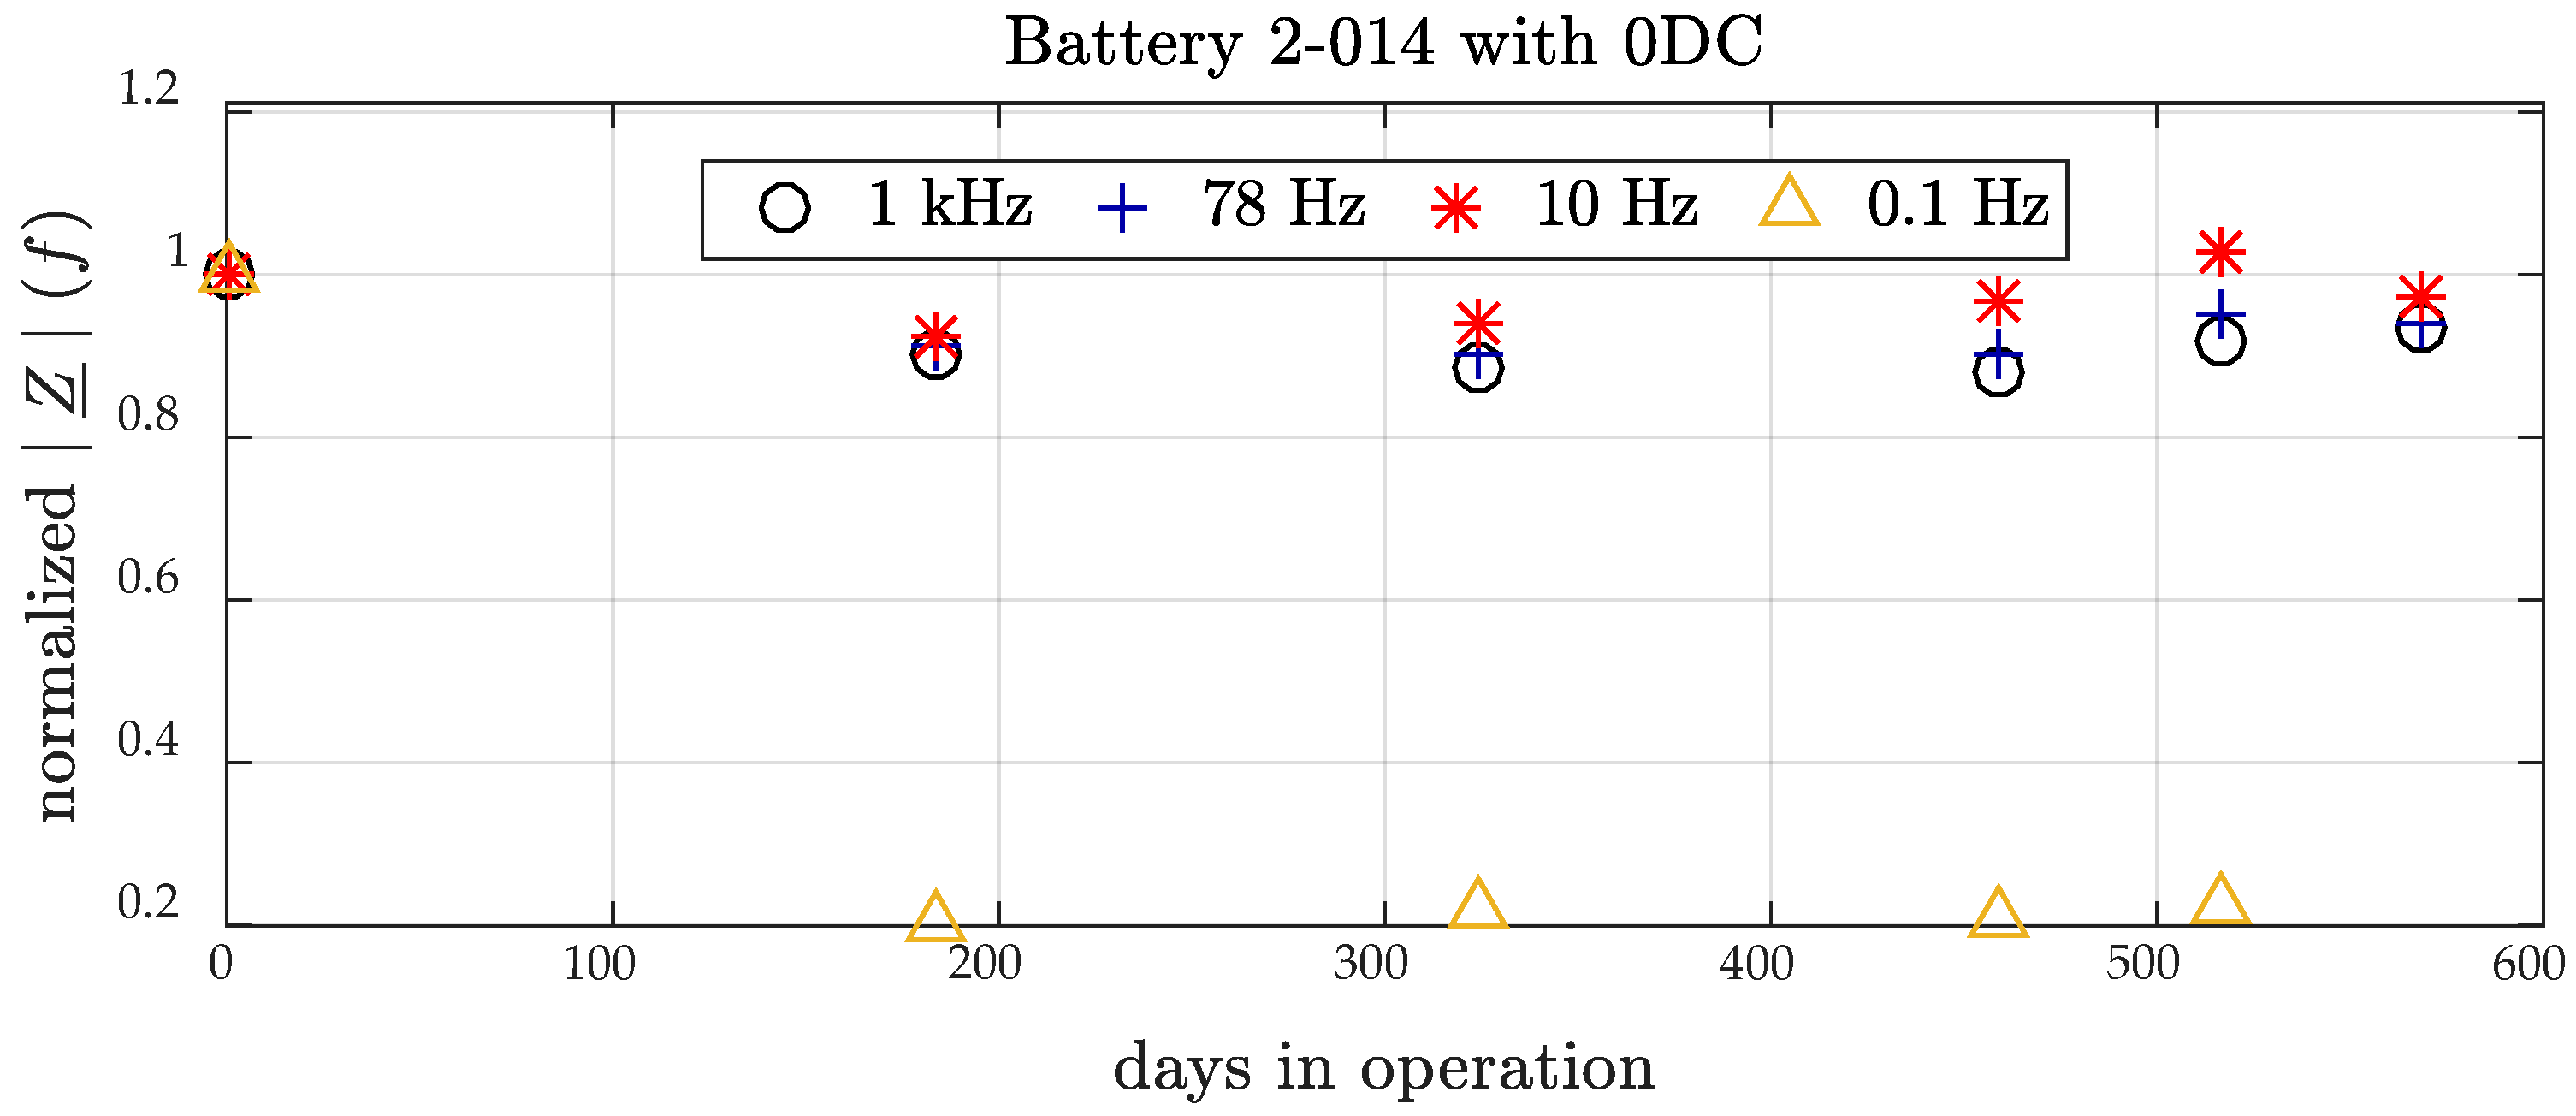
It has been shown by Kwiecien et al. [
10] that measurements with superimposed DC-currents in discharge direction are more robust and deliver more reliable results over the lifetime than 0 DC measurements or spectra with superimposed charge currents. Therefore, the values of the spectra with superimposed discharge current will be mainly utilized for this work (see also
Appendix A,
Figure A1). Nevertheless, for the comparison of measurement devices, the single values for the modulus |
Z| at 1 kHz with 0 DC is compared to the Hioki device as these measurements were also performed under no load.
Different to other tests in literature check-up tests did not include a capacity test. The authors wanted to avoid the introduction of any other aging mechanisms such as cyclic wear of the electrodes (active mass loss or additional sulfation) so that the impedance development is solely influenced by the operation under float charge.
2.4. Electrical Model and Fitting of Impedance Measurements
The analysis of the impedance spectra was performed with the open source fitting tool of ISEA available at [
26]. The principles behind the fitting methodology are also described in [
27]. The tool was adapted to include the comparison of spectra with superimposed DC-currents. The chosen equivalent electrical circuit, which was used for the fitting process, is depicted in
Figure 2. The areas of impedance values represented by the EEC elements are marked within the initially measured spectrum of battery 2-014. The parameters for the inductive element (L), the inner resistance (
Ri), and one ZARC element as well as one RC-element were collected over time to see their development with operation time of the batteries. The ZARC element consists of the charge transfer resistance for the negative electrode
Rct,NAM and a constant phase element (CPE), which includes
Cct,NAM and
ϕct,NAM. Its impedance is described by Equation (1):
The exponent
ϕct,NAM describes a depression of the semi-circle which would appear in a Nyquist diagram. Such a depression is usually associated with a distribution of relaxation times of a process around a mean value. The RC-element here mainly describes the processes with higher time constants and consists of the charge transfer resistance of the positive electrode
Rct,PAM and the capacitance
Cct,PAM. In this case,
ϕct,NAM equals 1. In earlier studies the EEC of two separated electrodes was extended by Warburg elements based on the fundamental Randles circuit [
8]. Such a Warburg element would describe the increased overpotentials at longer excitation durations due to diffusion processes. Here solely the faster reactions shall be parameterized as the parameters will be utilized in another step within a model which simulates these diffusion processes separately (as in [
28]). Therefore, the EEC is not integrating Warburg elements for the two electrodes to describe the behavior at low frequencies. The shift between the first impedance spectrum and the one measured after 568 days is illustrated in
Figure 2.
One restriction, which needs to be mentioned, is that such an EEC can either be fitted to measurements of one single cell or to a 12 V block with 6 cells in series, as it was done in the conducted tests. In the latter case it is expected that the general behavior of these 6 cells is equal and can be described by a serial connection of cell EEC, which can be joined to one summarized EEC. In this way the battery behavior can be described, but a deviation of the cells in SoC and SoH will overlap and influence the signal. It is expected that the impedance of the full battery cannot represent the worst cell and thus available capacity might be overestimated ([
11] see page 119 ff.). Additionally, for a full battery model the EEC is usually combined with further models describing for example the diffusion process within the cell [
28]. Such a hybrid model would include processes in frequency and time domain for a better estimation of all overpotentials and thus the available capacity at different loads. However, for the aim of comparing the indications of field measurement devices and the impedance spectroscope, the basic approach of value comparison for a full battery was chosen. For the analysis here, solely the change of parameters at full-state of charge and 25 °C after float charge will be evaluated. Additionally, measured impedances were validated with the
zHit method described in [
29]. Measurement points of the impedance spectra were excluded if this criterion was not met. Especially the points at low frequencies violated this criterion. A possible monitoring of the low frequency range is described in [
8], but was not in the focus of this work.
For the identification of the time constants
τi of the ZARC- and RC-element the analysis of the distribution function of time constants (DRT) was utilized, which is included in the fitting tool of [
26]. The DRT is calculated directly from the impedance measurements with Fourier transformation as well as signal processing methods [
27,
30]. For this step no knowledge about the underlying processes and no a-priori assumption on the number of dynamic EEC elements must be made. Based on the distribution functions processes and their time constants were identified, which were subsequently used for the impedance fit.
2.5. Basic Assumptions on the Influence of Aging Mechanisms on the EEC Elements
The expected main aging mechanisms during float charge are corrosion and water loss or dry out of the batteries. Both mechanisms will be severer with higher temperatures and higher positive overpotentials. In undercharge conditions, when battery potentials are below the typical charge reaction potential, sulfation can also occur.
Corrosion describes an oxidization of the lead grid at the positive electrode. The educts, under charge conditions lead-oxides, have a higher resistance than the original product. In undercharge state also lead-sulfates can evolve at the outer corrosion layer, additionally increasing the resistance. Furthermore, the diameter of the grid as the current collector is decreased which also leads to an ohmic increase. Therefore, corrosion should be mainly seen within the increase of Ri.
The inner resistance
Ri does increase over SoC due to a reduced conductivity of the lower concentrated acid and a coverage with insulating lead-sulfate [
7]. Water loss would lead to a higher concentration of the electrolyte, consequently decreasing the resistance. However, at concentrations above 1.26 g cm
−3 the resistance increases again (see [
31] p. 119). In addition, a dry out of the AGM will lead to contact loss between the electrode surface and the separator. Thus, longer reaction paths will also result in higher inner resistances. However, the active surface area that is available for a charge transfer will be influenced by water loss. As a result, this aging mechanism should also be visible in
Rct as well as in the diffusion processes.
Moreover, the
Rct will increase with coverage of the active surface area by PbSO
4. Such an effect is seen especially at SoC between 50–100% [
32]. The non-reactive lead-sulfate is reducing the electrode capacitance and will slow down the charge transfer process. Subsequently, the time constant
τct will increase with a higher rate of sulfation.
In summary, it could be said, that Ri should be mainly resemble the corrosion mechanism, while water loss and sulfation should be detectable through the charge transfer resistances.
3. Results and Discussion
The results of the continuous measurements and subsequently the overall operation conditions are described in
Section 3.1. Afterwards the impedance readings of the different devices are compared in
Section 3.2. Followed by
Section 3.3 where the impedance development at different frequencies measured by μEIS is discussed. For the visualization of the results battery 2-014 is chosen as one representative example, while the most important indicators are then given for all batteries.
Section 3.4 describes the results of impedance spectra fitting and concludes with the comparison of the different implications gained from the measurements. Finally,
Section 3.5 closes with a suggestion for a monitoring in the field.
3.1. Conditions for the Check-Up Batteries
The voltage and temperature measurements were evaluated for two different periods, phase 1 and phase 2 as described in
Section 2.1. The average values measured for each cell are listed in
Table 3. For string 2 the voltage readings deviate between 48 to 180 mV and for string 3 between 12 to 120 mV per mono-block. As these voltage readings as well as the deviation between temperatures is within the accuracy range of the measurement device the conditions for all cells are expected to be similar and comparable. However, differences in aging can arise from deviations within the battery (e.g., saturation of the fleece, grid casts etc.).
Weight measurements are utilized as an indicator for water loss in flooded batteries. However, the actual water loss in a VRLA battery can be higher than the measured weight loss. This is due to corrosion reactions at the positive electrode, which bind the heavier oxygen as the counterpart to hydrogen evolution on the negative electrode, which is in total accounting for most of the water loss [
31]. The batteries investigated show a weight decrease by less than 0.3% based on the total weight. If a proportion for the electrolyte of about 60% is assumed for AGM batteries, the measured weight loss corresponds to a water loss of less than 0.5%. Additionally, the OCV measurements before EIS are not yet showing a reproducible increase due to concentration changes. Based on these values, water loss is expected to be marginal at this point.
An exemplary result of the continuous measurement for one battery of string 2 is depicted in
Figure 3. The check-up measurements are marked with red circles. Each time step of a resistance measurement is marked with
tR,i [
i = 0, …, 5]. Temperature and voltage measurements were taken immediately before the impedance measurement. This time step is described by
tR,i-
δt. During the check-ups the temperature was 21.6 (±1.8) °C and the voltages was 13.59 (±0.08) V. Within the profile it can be seen that the detected impedance rises steeply above a ratio of 1.8 in the spring of 2018. After the 5th check-up the impedance shows a steep decline. A similar behavior with less intensity can be seen before and after the previous check-ups. It is expected that the readings are influenced by changes at the contact of the battery poles. This is an important implication for field applications as the measurement would have indicated a necessary exchange of the battery too early. Thus, the connection of the measurement devices should be checked if implausible steep rises or declines can be seen within the data. The registered lower temperatures in the winter of 2017 were explained in
Section 2.1. Two other disruptions in the acclimatization of the test field can be seen. Aside from these events the temperature profile is between +20 °C and +25 °C. The high voltage deviation at the beginning of the measurement is within phase 1, which is defined in
Section 2.1. Here the deviating voltages within one string seem to steer this higher fluctuation. Additionally, it should be noted that the accuracy of the device at 13.75 V allows for a deviation of ±0.069 V.
3.2. Comparison of Commercial Measurement Devices and EIS
The marked check-up values within the continuous measurements of the LEM Sentinel 2 were compared to the check-up measurements of the μEIS at 78 Hz with superimposed discharge currents (−1 I
20). For the comparison, the offset between the first valid measurement of the LEM Sentinel 2 in January 2017 and the initial EIS measurement in the winter of 2016 was subtracted from all following measurements. The absolute impedance values are plotted in
Figure 4. Additionally, the Hioki BT3554 as well as the corresponding 1 kHz μEIS measurements with no superimposed DC current are plotted. A good accordance between the Hioki measurement and the 1 kHz μEIS can be seen. The relative deviation depicted in
Figure 5 is within the given range of accuracy for most of the measurements. The deviation between the LEM Sentinel 2 and the 78 Hz measurement is higher and outside of the accuracy range. The 5th check-up shows the strongest deviation with high impedance measured by the LEM Sentinel 2. This could be explained, as previously stated and visualized in
Figure 3, by a change in the contact resistance. The comparison of the relative change shows that the tendency of the compared values is similar (see
Figure 4). At first, the impedance decreases for both frequency ranges. This is probably due to a run-in effect of the new batteries, which can mean a further formation of the active mass reducing the inner resistance as well as a decrease in AGM saturation and thus a better recombination cycle, which changes the parameters of the ZARC element. Similar developments were seen for the other batteries (see
Table 4).
Up to now the 1 kHz measurement with no superimposed DC current indicates no aging for most of the batteries as the values are below the initially measured impedances. Only battery 3-008 shows an increase for high frequency impedance. For the lower frequency values an increase in impedance was detected for all batteries and is in the range of 5 to 28% for the LEM Sentinel and up to 15% for the μEIS measurement. It becomes clear that especially the lower frequency measurements, which are more prone to inaccuracies, deviate from each other and give contradictive indications (e.g., for battery 3-004). The continuous measurements of the LEM Sentinel 2 with overcharge currents at 100% SoC will also be affected by the gassing reaction and the resulting gas bubbles within the porous electrode structure. The coverage of the active surface with gas bubbles will influence the impedance but should be of less relevance at the given frequency. An analysis of the absolute value of the LEM Sentinel 2 in comparison to impedances collected through EIS showed a better correlation to values gained at lower frequencies <32 Hz. The high impedance of battery 3-004 can only be seen at less than 13 Hz in the EIS measurements.
In total, based on these relative changes, all batteries would still be described as healthy and would stay in operation. The typically stated EoL criteria would be a 100% increase of the initial internal resistance. For the increase of resistances at lower frequency no rule of thumb is known; however former analyses such as the one of [
6] have shown increase of over 45%. Based on these measurements, battery 3-008 and 2-024 should be in the scope of further observation.
3.3. Implications from EIS Measurements
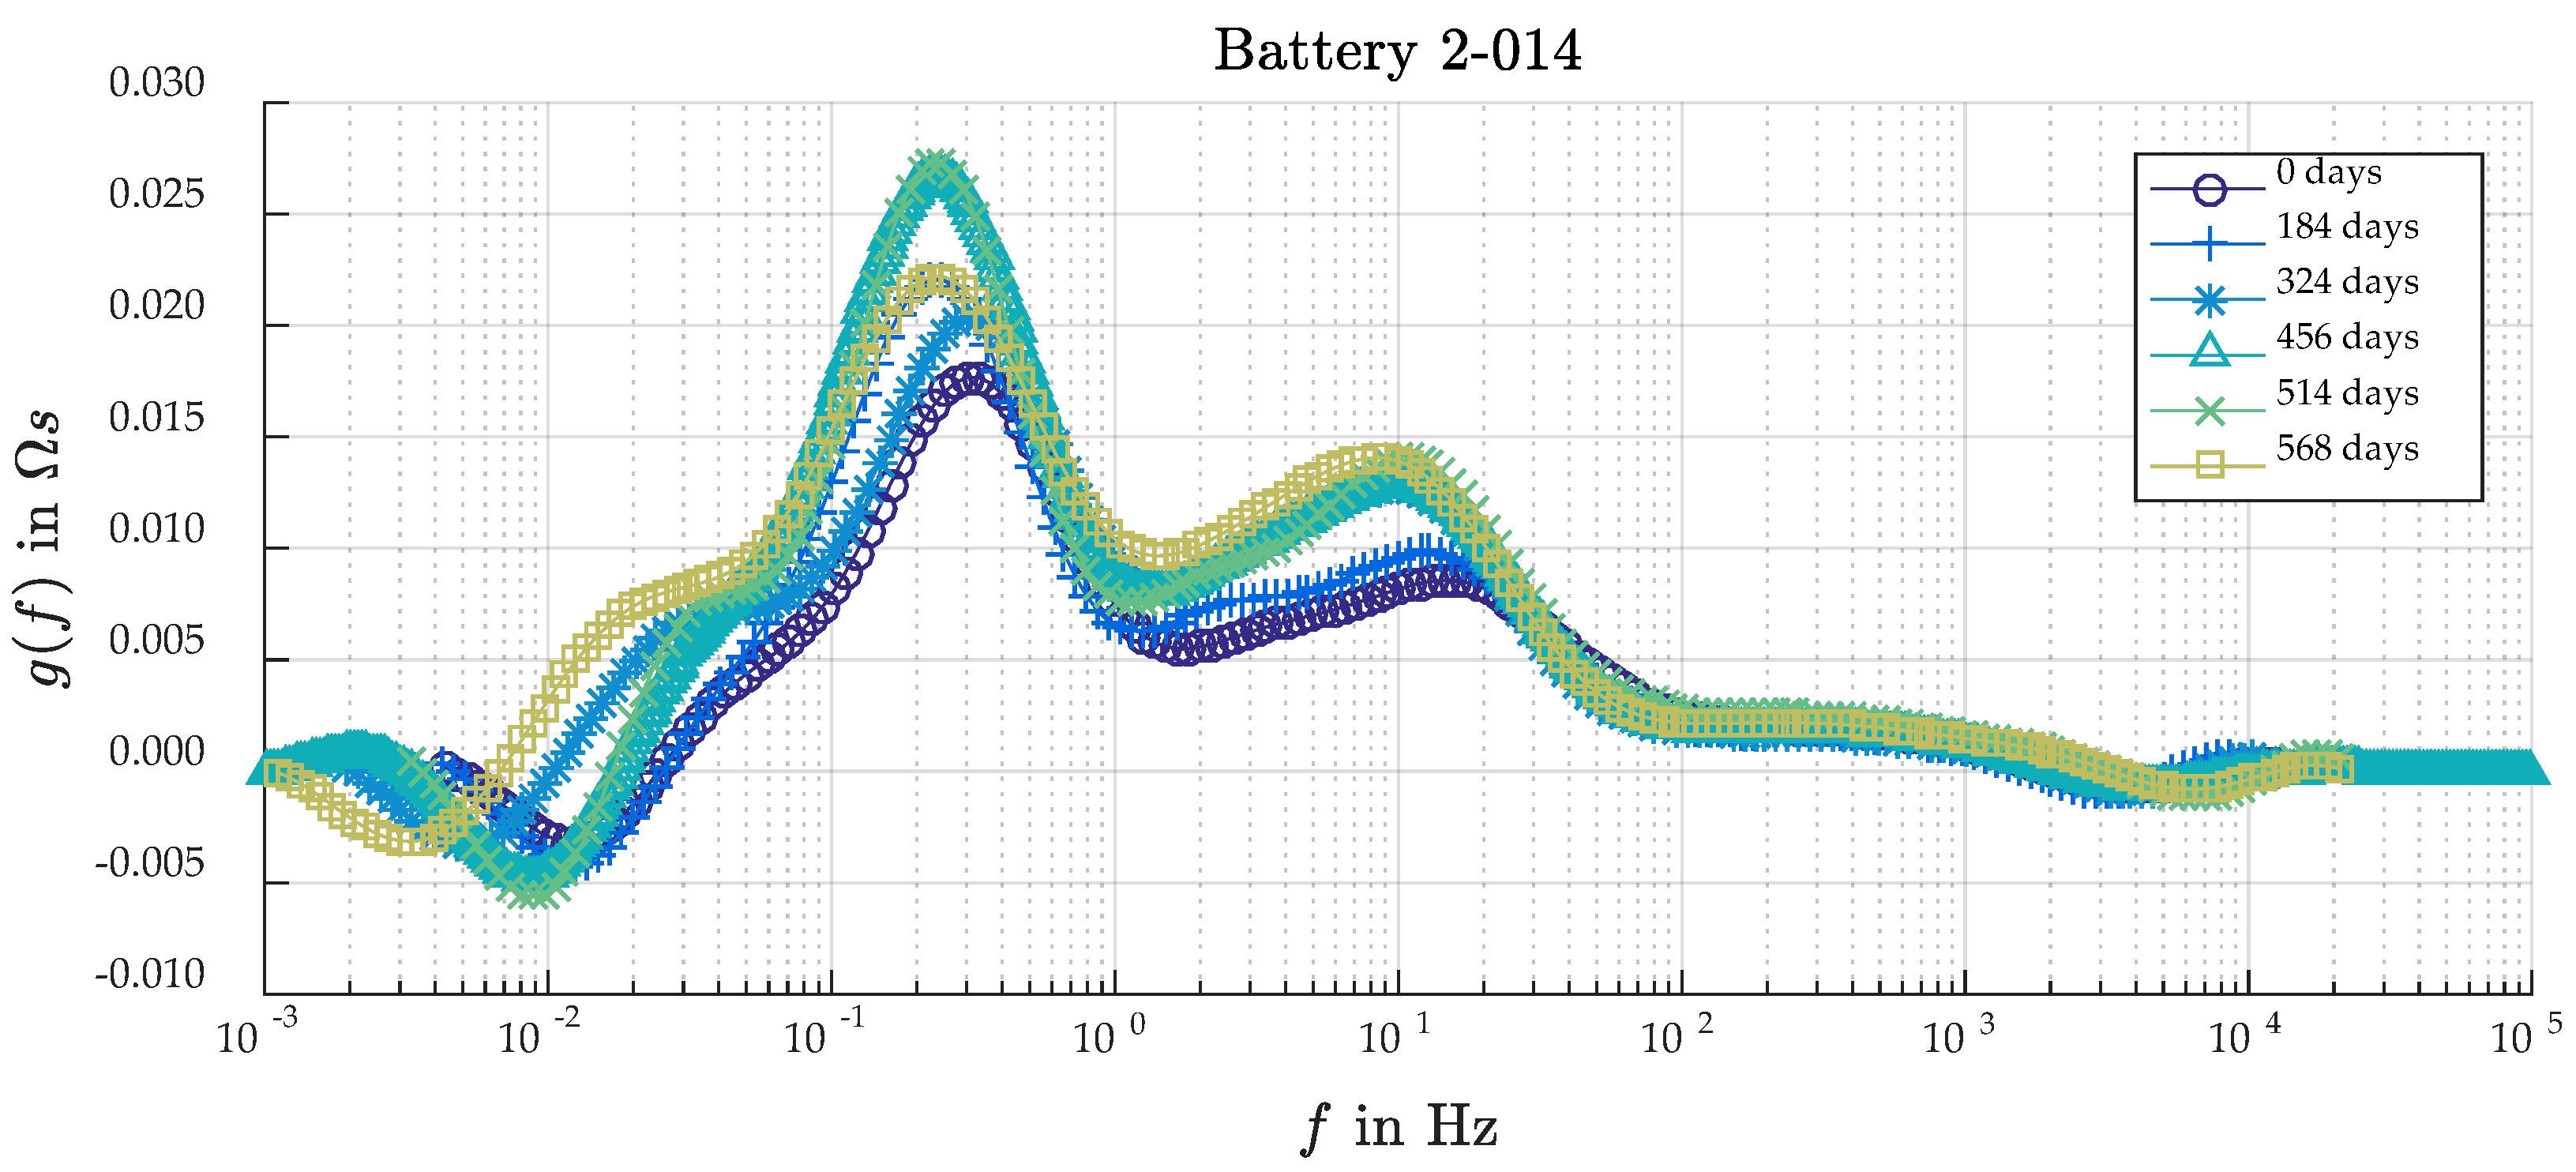
The recorded impedance spectra deliver 46 measurement points at different frequencies. For the illustration of the impedance change at different frequencies the 1 kHz, 78 Hz, 10 Hz and 0.1 Hz measurements, which are also marked in
Figure 2, were chosen. As can be seen from
Figure 6 and from
Table 5, the strongest relative increase is detectable for the lowest frequency. The deviation between 1 kHz and 78 Hz with superimposed DC discharge current is marginal and would not lead to a divergent conclusion on the SoH of the battery. It can be noted that with a superimposed discharge current the 1 kHz measurement shows a relative increase compared to the initial value, while with 0 DC spectra deliver lower relative values. Nevertheless, for these impedances at different frequencies also battery 2-024 and battery 3-008 are showing higher increases (see
Table 5) and subsequently would be detected as the once more stressed within the string. Although the differences in voltage and temperature of the continuous measurement were within the range of accuracy, the slightly higher voltage of 2-024 and the higher voltage in phase 1 as well as the higher temperature for 3-008 could be a first explanation.
The development of the transient frequency, the point in the spectrum where the imaginary part of |
Z| gets 0, could be used as an indicator for SoC as described by [
23] or even for SoH. However, it delivers no valid result as the measurement even with a starting frequency of 6.25 kHz have almost no zero crossing.
3.4. Implications from EIS Parameter Fitting
With the DRT analysis two processes were identified. The faster process with an initial time constant of <12.4 ms was attributed to the first semi-circle of the ZARC element. It is detectable as a peak distribution between 100 Hz and 1 Hz of the relaxation time distribution function as depicted in
Figure 7. This frequency range is equal to the one stated by [
11] for the negative electrode. The second process is represented by the larger peak between 1 Hz and 0.1 Hz and should be mainly influenced by the positive electrode. It would be associated with the RC-element of the representative EEC even though a RC-element would deliver a single peak in the DRT. For both processes, it can be said that with proceeding operation time the time constant increases, which means that the process is slowed down. The resulting fit for
τct,NAM is depicted in
Figure 8.
Furthermore, the corresponding resistance of the processes increases. This development is also evident for the relative increase of
Rct,NAM of the ZARC element, which is depicted in
Figure 8 as well as the increasing inner resistance
Ri. Similar to the impedance reading at about 1 kHz the fitted internal resistance
Ri decreases first and then increases by 8.28 to 13.4%. The relative increase of the fitted
Rct,NAM is even strong then for |
Z| at 0.1 Hz. The RC-element with higher time constants cannot be fitted reliably as some impedance values at lower frequencies are not meeting the zHit criterion and thus a fit was not always possible.
Interestingly, the capacitance of the first process is first increasing. This could be an indication for the aforementioned run-in effect with an additional formation of the active mass.
The increase of Rct,NAM and τct,NAM would be an indication for water loss. The strong increase at the beginning could be associated with an imperfect recombination cycle. As the efficiency of this cycle increases with a lower saturated AGM the increase rate of the two parameters slows down.
3.5. Alternative Detection Method for the Field Application
Impedance measurements with a spectroscope are inapplicable in the field. The measurement technique is too expensive for most applications. Furthermore, the fitting process which leads to the parameters (Ri, Rct,NAM etc.) would have to be automated and would need additional computational power. Therefore, based on the former results an alternative detection method for the field application is suggested. As the main aging effects could be detected with the change of Ri and Rct,NAM it is argued to use a correlation between two basic impedance measurements. The first should be taken around 100 Hz, while the second should come from a 1 Hz excitation signal. Selecting these two frequencies is a compromise between the number of necessary measurement points as well as necessary registration rate and thus equipment cost and the accuracy of the measurement. Of course, a 1 kHz measurement would be more accurate for the measurement of the ohmic resistance as described above. Measurements have however shown that the relative change, which shall be evaluated, is deviating only marginally. It can be argued that the frequency should be adapted in a way that it is not a multiple of the electrical grid frequency, which leads to a practical frequency of 100 Hz + x in the field application.
For the validation of this assumption the impedances measured at these two frequencies with the μEIS have been utilized. It would have been possible to use the measurements of the two commercial products instead. However, the results of the LEM Sentinel 2 were discussable and thus not further evaluated. As real impedance values are hard to collect in the field, the implication from evaluating only the real part has been investigated and compared to the impedance values.
Figure 9 illustrates the normalized development of the internal resistance gained from the measurements at 100 Hz (
Ri,calc) as well as the normalized resistance calculated by a subtraction of the full impedance or the real part measured at 100 Hz and 1 Hz. A similar result was gained for the batteries of string 3 (see
Figure in Appendix A). In comparison to the implications of the impedance fit (see
Figure 8), this simple implementation delivers results with similar indications for the resistance developments.
Table 6 summarizes the values of the different resistances at the last check-up as well as their relative increase based on the initial measurement.
It is worth noticing that the analysis of the EIS measurements as well as the suggested evaluation method also indicate battery 2-024 and 3-008 as the batteries with noticeable changes. However, the recognized higher proportional weight loss of the batteries in string 3 is neither influencing the low frequency process nor is it detectable in a higher change of internal resistance. Further, investigations in this prolonged test as well as final post mortem analysis will be performed to validate the made assumptions. At this point of the investigation it can be said that the measurement of two distinct frequencies can gain comparable results to the fitting of a full impedance spectrum. Thus, this methodology can be used and extended to distinguish the aging mechanisms, which are attributed to different frequency domains.
4. Conclusions
An analysis of different impedance measurement devices and their correlation has been conducted. For this experiment two strings of each 24 VRLA batteries with 12 V rating have been operated under float charge at room temperature for over 560 days. The blocks were monitored continuously and were put into regular check-ups. The commercial devices Hioki BT3554 and LEM Sentinel 2 were utilized for single-frequency measurements. Additionally, regular electrochemical impedance spectroscopy has been performed with a μEIS.
The Hioki handheld has a good correlation with 1 kHz impedance readings of the μEIS. Higher failure possibilities at lower frequencies lead to higher deviation between 78 Hz EIS and the LEM Sentinel 2, which should collect impedances at about 70 Hz. However, the gained impedances are more likely representing values at even lower frequencies (here <32 Hz). All in all, the implications drawn from 1 kHz and 78 Hz EIS measurements are very similar. The fitted Ri taken from EIS does show comparable behavior. Consequently, it can be said that current measurement techniques do cover the change in high frequency impedance very well.
One issue is that the high frequency values will not foresee the aging mechanisms also influencing the lower frequency behavior, such as water loss and sulfation. These lower frequency values are more important for the estimation of available capacity and thus SoH. While the high frequency impedances of the tested batteries showed no to marginal increases in impedance, lower frequencies already show a significant change. Thus, the age of the batteries would be underestimated at high frequencies. Therefore, the impedance spectra were taken and fitted under utilization of a DRT analysis. The fitting of EIS parameters for the utilized EEC as well as the DRT show an increase of parameters describing the charge transfer processes. From the DRT it can also be concluded that the frequency of the processes changes over time, while the range for the first process is 100 Hz and 1 Hz and the second 1 Hz and 0.1 Hz. This corresponds well with the assumed time constants for the negative and positive electrode, respectively.
As field measurements typically do not allow for highly complex measurements and analysis such as recording complete impedance spectra and fitting, another methodology is suggested. Comparable results to the fitted EEC parameters were gained from the analysis of two single-frequency measurements. Namely, the real part of the 100 Hz and 1 Hz impedance were analyzed to calculate Ri and Rct,NAM. With a device monitoring the development of these two impedances much more information can be gained from the batteries in operation. The stability of low frequency measurements in the field must be further investigated. Additionally, it must be controlled how much relative change in impedance at low frequencies can occur before the battery reaches its EoL. Further analysis at the EoL will be performed with post mortem analyses to check on the intensity of each aging mechanism. In another step, the monitoring device will be coupled with further models (e.g., diffusion) to optimize the online diagnostics.


