Spatial Information on Voice Generation from a Multi-Channel Electroglottograph


1
Department of Architecture, University of Bologna, 47521 Cesena (FC), Italy
2
Hochschule für Musik, University of Detmold, 32756 Detmold, Germany
3
Department of Civil Engineering, University of Salerno, 84084 Fisciano (SA) Italy
*
Author to whom correspondence should be addressed.
Appl. Sci. 2018, 8(9), 1560; https://doi.org/10.3390/app8091560
Submission received: 13 August 2018
/
Revised: 31 August 2018
/
Accepted: 3 September 2018
/
Published: 5 September 2018
(This article belongs to the Special Issue Modelling, Simulation and Data Analysis in Acoustical Problems)
Abstract
:In the acoustics of human voice, an important role is reserved for the study of larynx movements. One of the most important aspects of the physical behavior of the larynx is the proper description and simulation of swallowing and singing register changes, which require complex laryngeal manoeuvres. In order to describe (and solve, in some cases) these actions, it is fundamental to analyze the accurate synchronization of vocal fold adduction/abduction and the change of the larynx position. In the case of dysfunction, which often occurs for professional singers, this synchronization can be disturbed. The simultaneous assessment of glottal dynamics (typically electroglottograph, EGG signal) and larynx position might be useful for the diagnosis of disordered voice and swallowing. Currently, it is very difficult to instantaneously gather this information because of technology problems. In this work, we implemented a time-multiplex measurement approach of space-resolved transfer impedances through the larynx (Multi-Channel electroglottograph MC-EGG). For this purpose, we developed specific software (Labview code) for the visualization of the main waveforms in the study of the EGG signals. Moreover, the data acquired by the Labview code have been used to create a theoretical algorithm for deriving the position of the larynx inside the neck. Finally, we verified the results of the algorithm for the 3D larynx movement by comparing the data acquired with the values described in the literature. The paths of the larynx and the displacement on the sagittal and transverse plans matched the ones known for the emission of low/high notes and for swallowing. Besides, we have introduced the possibility to study the movement on the coronal (x) plan (so far, unexplored), which might be a starting point for further analysis.
1. Introduction
The study of musical acoustics includes several aspects about the physics of musical instruments, and the main purpose consists of describing their sound [1], including the development of new physical parameters [2]. One of the most important applications of these studies is to emulate their sound by means of the proper description of their behavior, by means of convolution between the music piece played by the musician and impulse responses of the instrument [3]. However, sound production in humans is a complex process depending on different singing styles, which involves several anatomic structures [4]. This process is responsible for the generation of formant frequencies [5]. For these reasons, it is necessary to properly describe their movements, also including nonlinear aspects, in order to emulate nonlinearities using novel approaches [6,7]. Considering these aspects, it would be feasible to obtain a proper reconstruction of the diffuseness of musical signals for subjective evaluations [8].
Nevertheless, the interest in the description and modelling of the phonetic act includes researchers working in medicine and singing teaching. This interest has grown in the last few years and is continuing to grow even more.
Scientific studies of the human voice started with Helmholtz, who gave a detailed explanation of this phenomenon in 1863, describing that the voice is produced by a steady flow of air from the lungs, segmented at the laryngeal level into a series of air puffs at a fundamental frequency (f0) that generates higher harmonics in the cavity of the upper airway. The supra-laryngeal cavity plays the role of a resonator, only filtering some frequencies, and finally the mouth and nose cavities modify the air flux, generating sound [9].
Mechanically, the phenomenon can be compared with the pression provoked by a piston. The air pressure forces the vocal folds to open. As the suction produced by the drop in pressure in the region of the folds plus static tissue forces begins to counterbalance the subglottic pressure in the region of the lungs, the folds begin to move inward, and the narrowing channel causes an increase in suction until the folds snap shut. Once the vocal fold cycle is completed, the folds return to the starting position.
Complex laryngeal manoeuvres occur during swallowing and singing register changes. These actions require an accurate synchronization of vocal fold adduction or abduction and the change of the larynx position. The simultaneous assessment of glottal dynamics and larynx position could be beneficial for several reasons: it might be an important instrument for the diagnosis of disordered voice or speech production and swallowing, it might be useful in the research of effective correlations between the control of the speech frequency f0 and the position of the larynx, and it can also be an instrument for the mechanic evaluation of singing techniques. Currently, the existing tools normally available do not allow this simultaneous assessment because of their features (e.g., the incompatibility between MRI and other electric devices) or low resolution (e.g., CT).
For the aforementioned reasons, there is interest in a device which might be capable of making both the measurements at the same time. This is the reason why a prototype of MC-EGG (Multi-Channel Electroglottograph) was realized. This new device differs from a standard EGG in that more electrodes are rapidly switched to give information about the larynx position inside the neck [10].
2. Multi-Channel Electroglottograph
There are several different devices that might be used for the evaluation of the glottal dynamic. One of the most important is the EGG, which was utilized in this research [11].
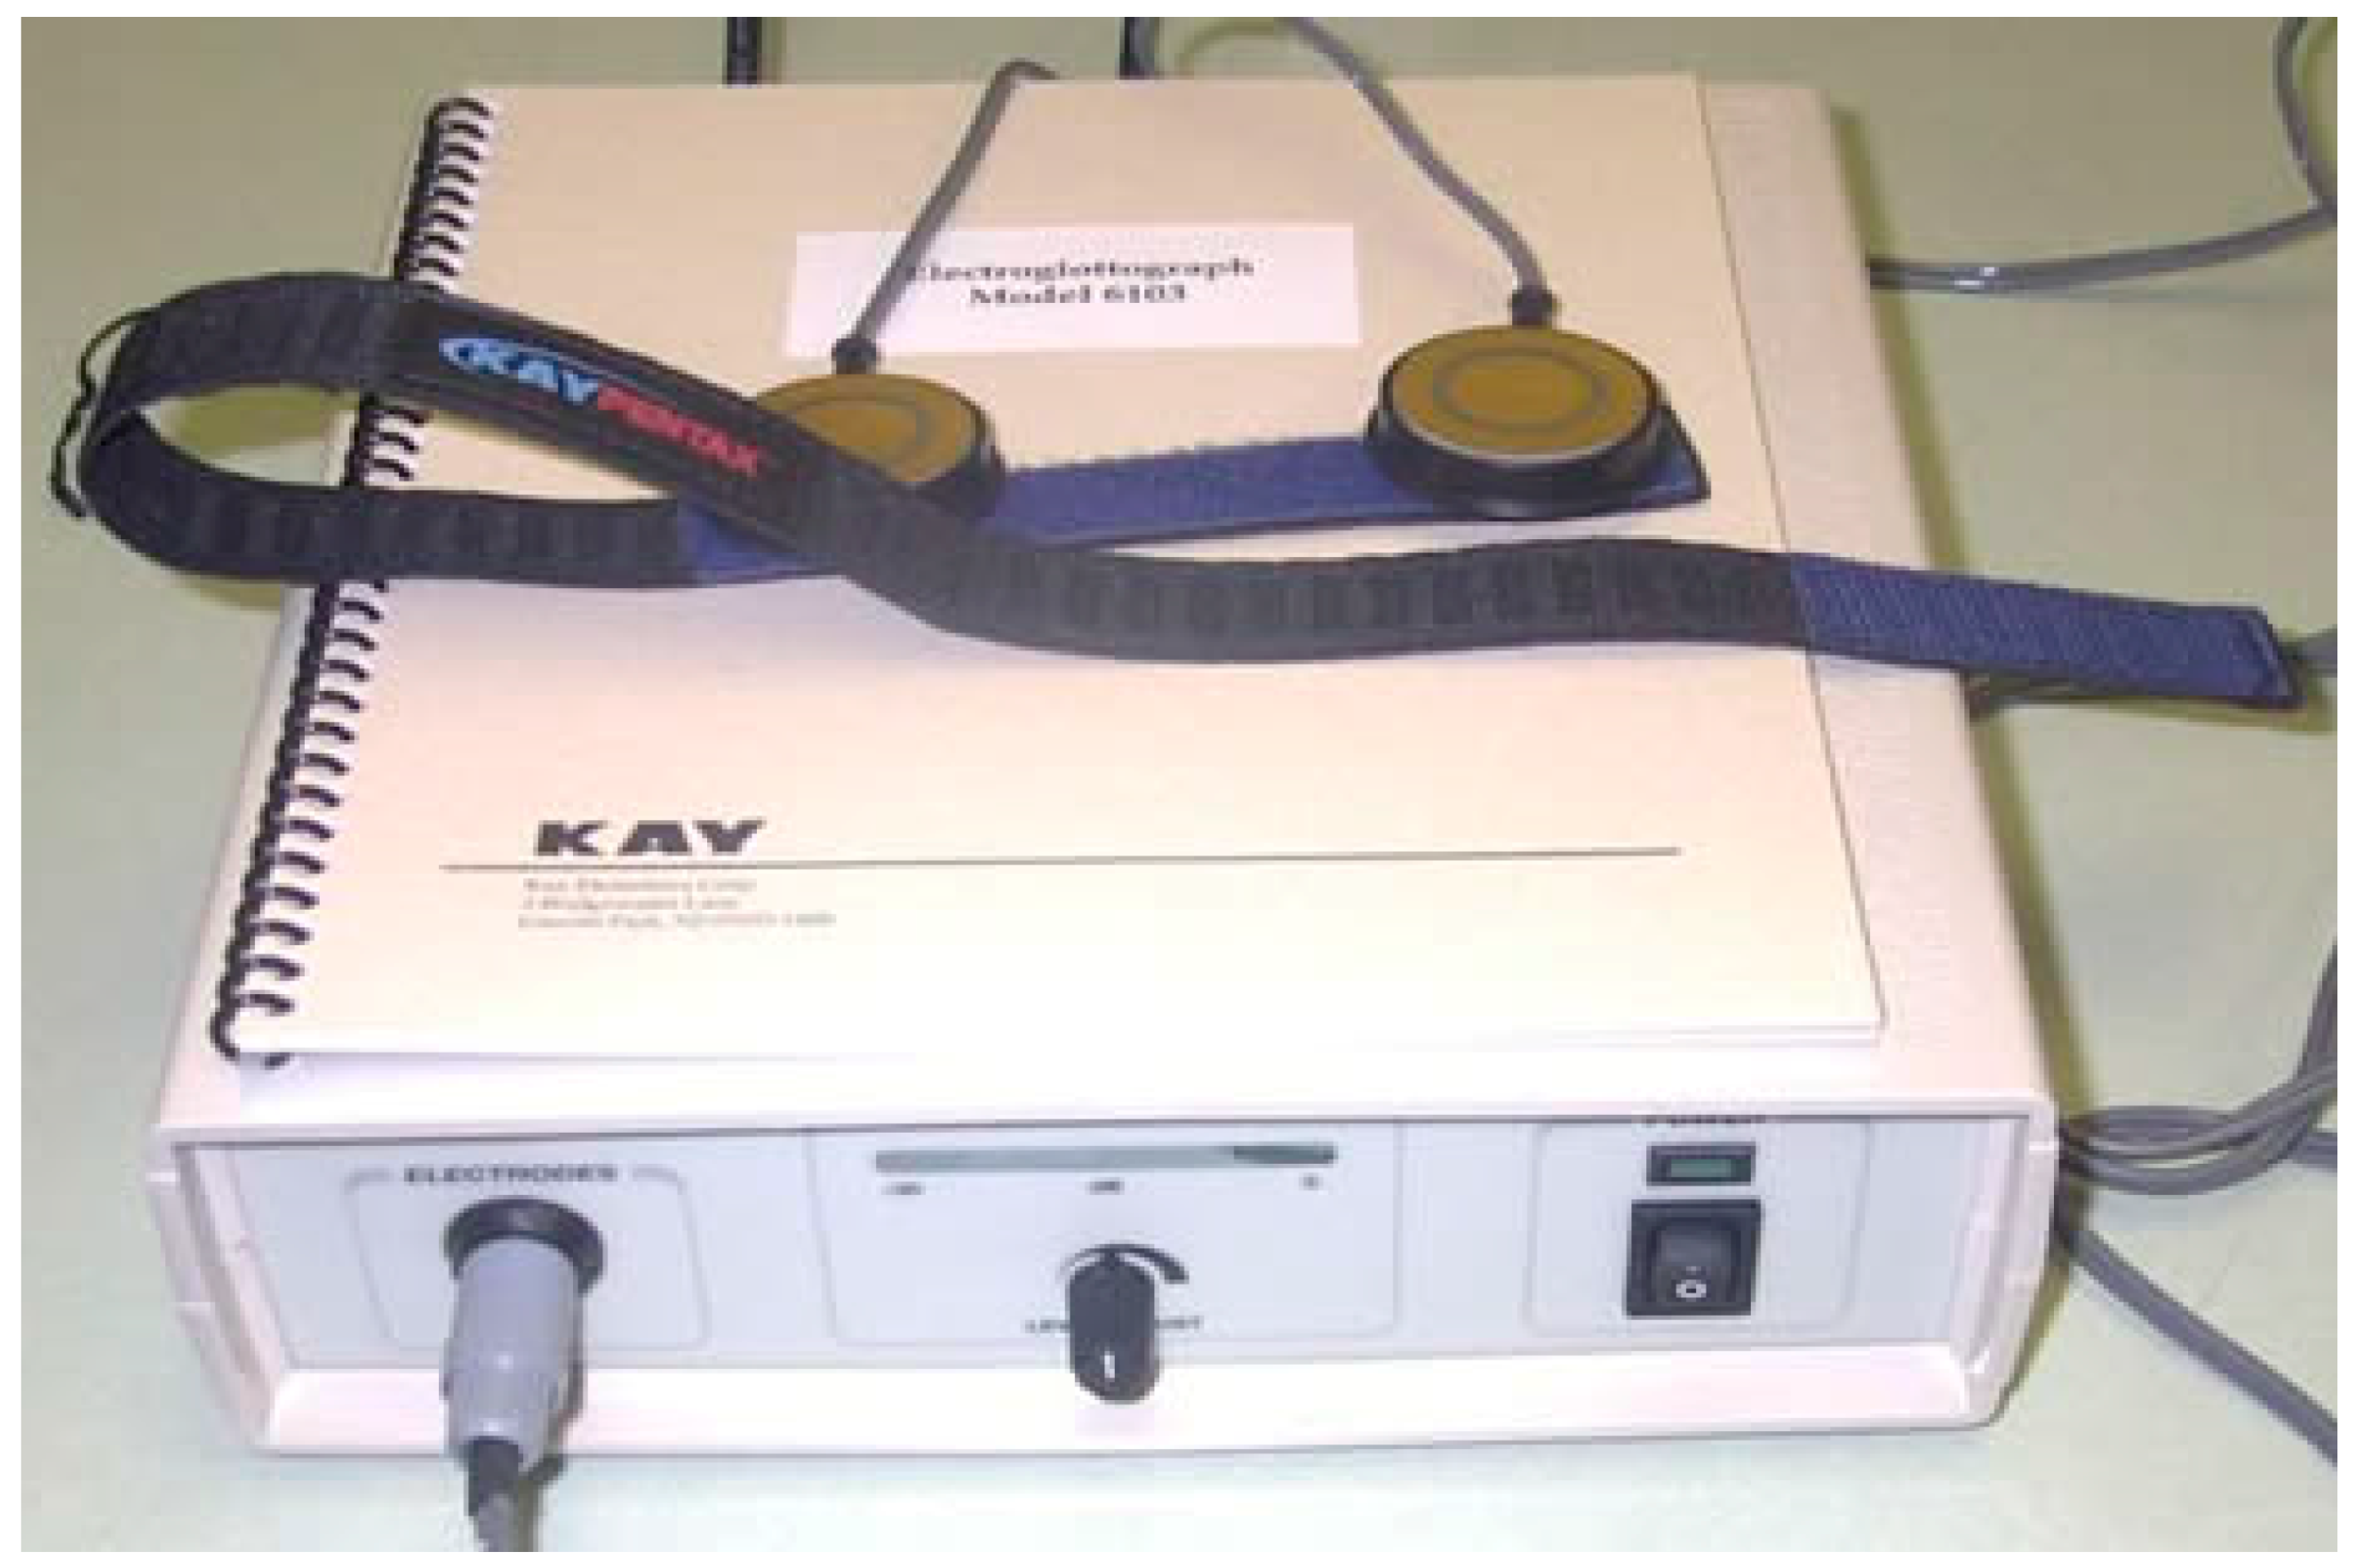
This device evaluates the TEC (Transverse Electrical Conductance) between two electrodes placed on the sides of the neck. The first electrode sends a low intensity-high frequency current stimulus that is received by the second electrode.
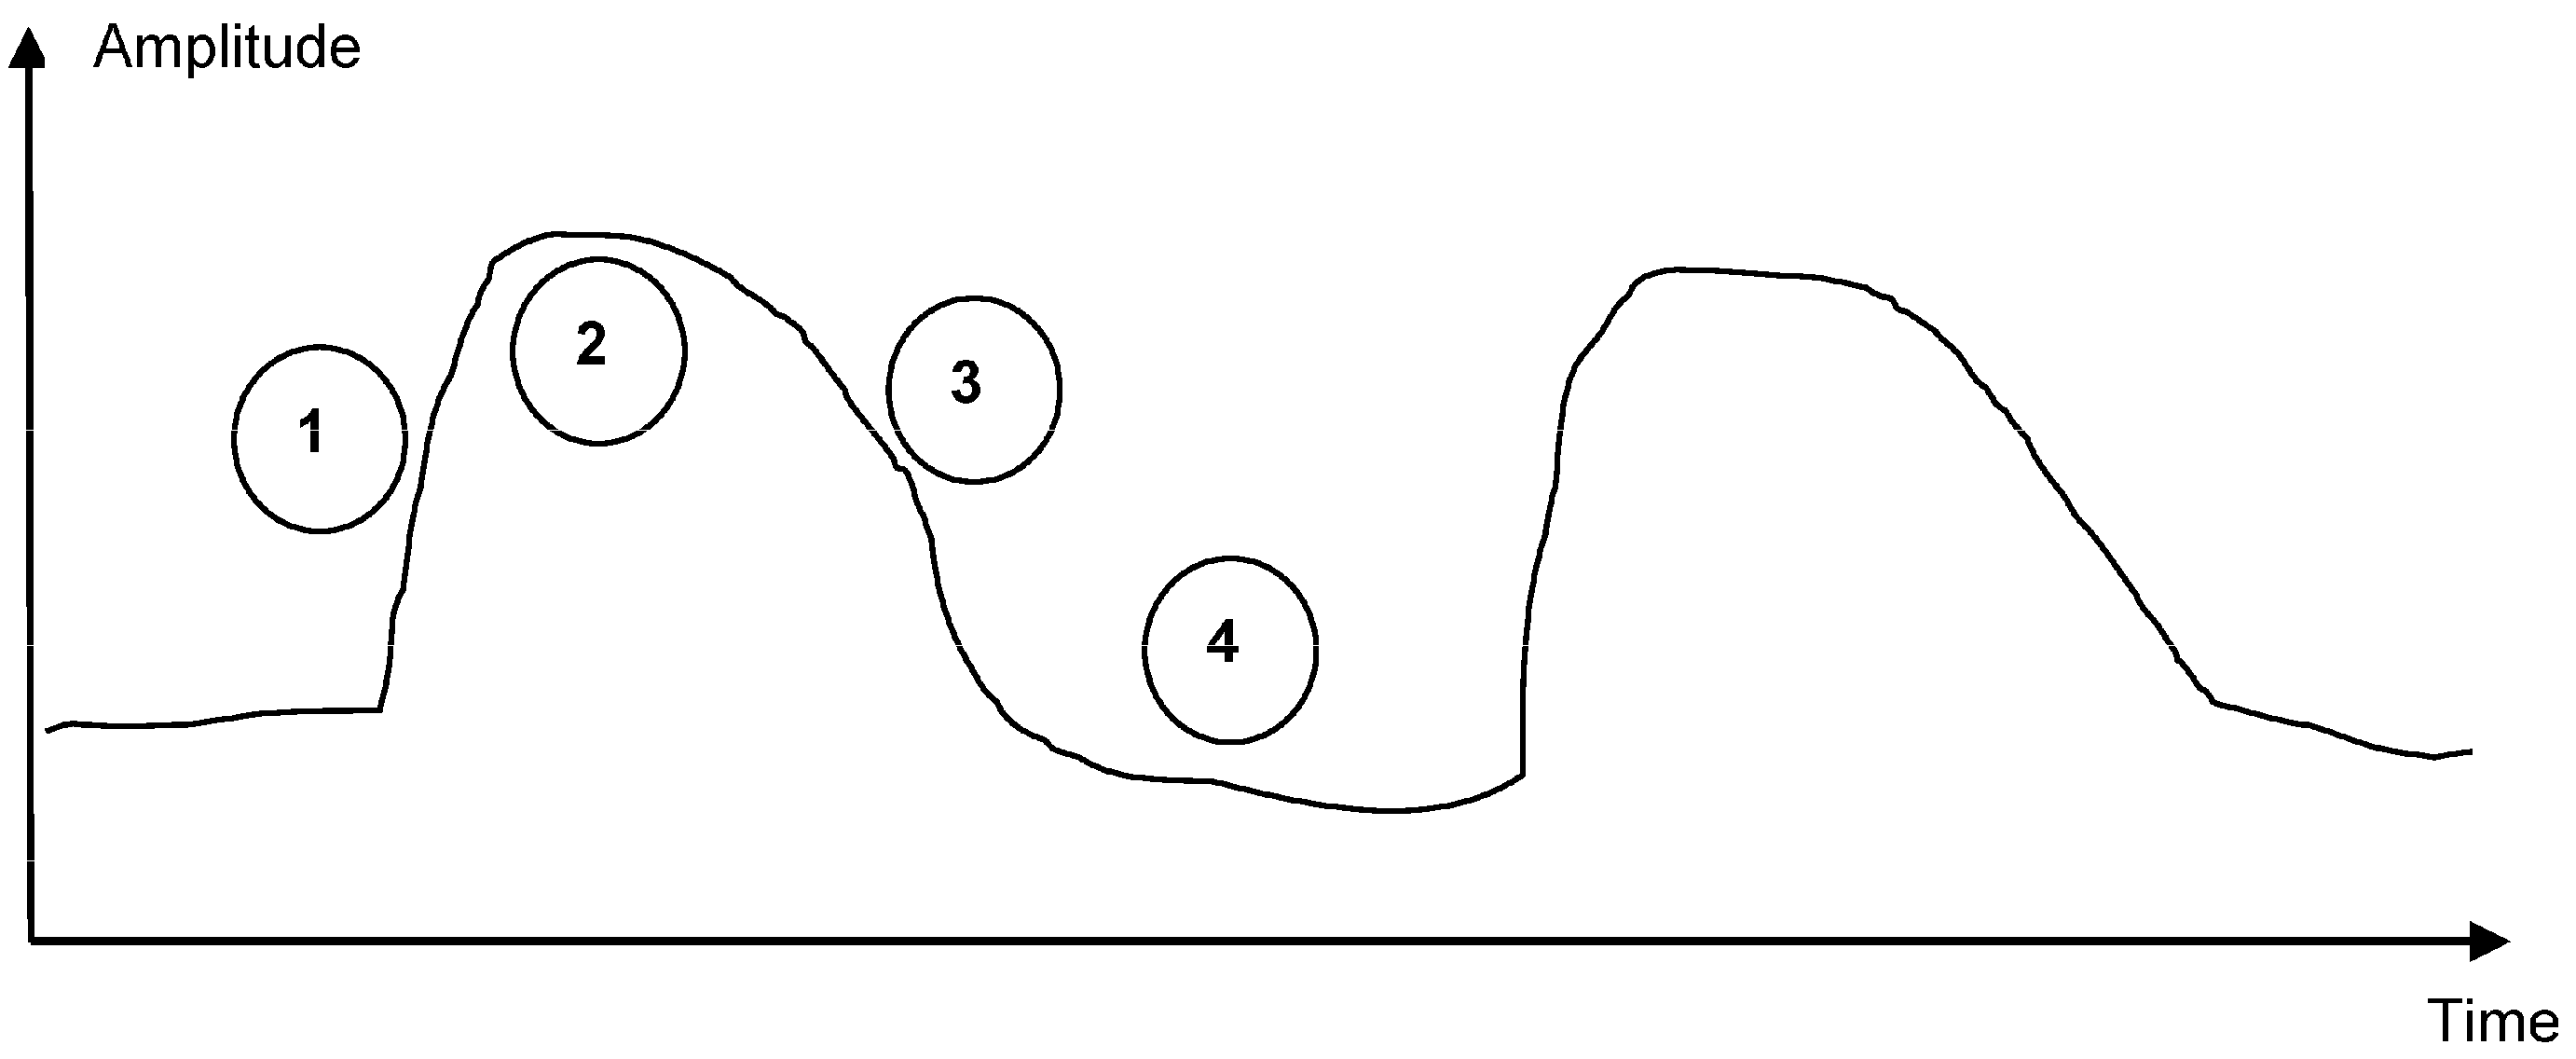
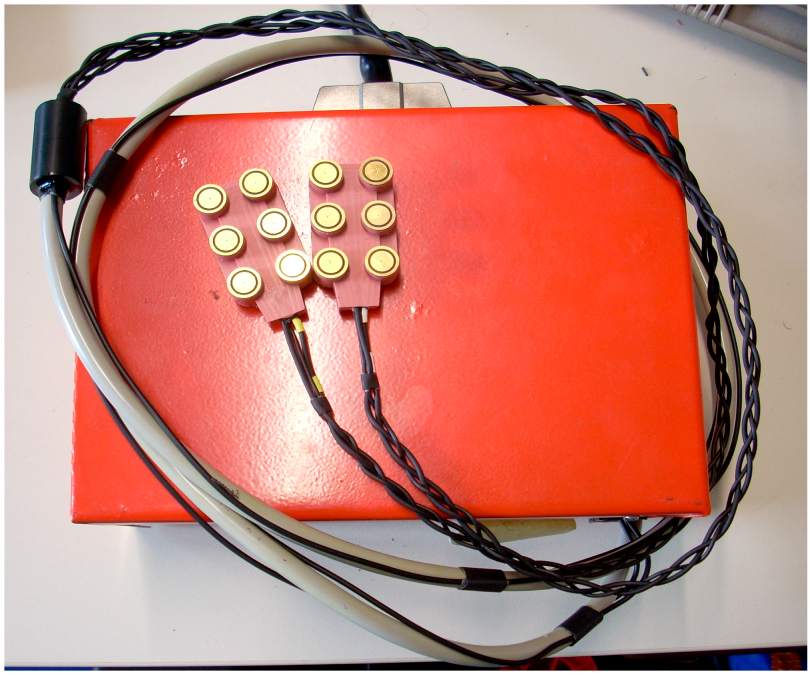
The typical EGG signal appears as in Figure 1; the maximum conductance is at the maximum contact point of vocal folds and the minimum is at the maximum opening point. A standard EGG has two electrodes (one sender and one receiver), while the MC-EGG uses two six-electrode arrays (Figure 2 and Figure 3).
For each electrode’s switch in the transmitter array, we have a fast switch of all the electrodes on the receiving array (every 25 ms). In this way, we could obtain all the 36 possible paths of current inside the neck [10]. In other words, by using an MC-EGG, it is possible to simultaneously obtain much more information if compared with a normal EGG. In this way, the resolution of the possible movements of the larynges increases. Further information about the behavior of the MC-EGG could be found in [10].
3. Methodologies
In order to describe the laryngeal manoeuvres, it was very important to focus on acquiring, visualizing, and saving data on a computer from the MC-EGG. Moreover, an algorithm for the evaluation of the larynx position inside the neck has been developed.
For the acquisition, we used a DAQ 6035E, 38.5 kHz, and we developed a Labview (National Instrument) tool to interface the device with a laptop. This tool included a user interface (Front Panel) and a code interface (Block Diagram), following the numerical description of the phenomenon [12].
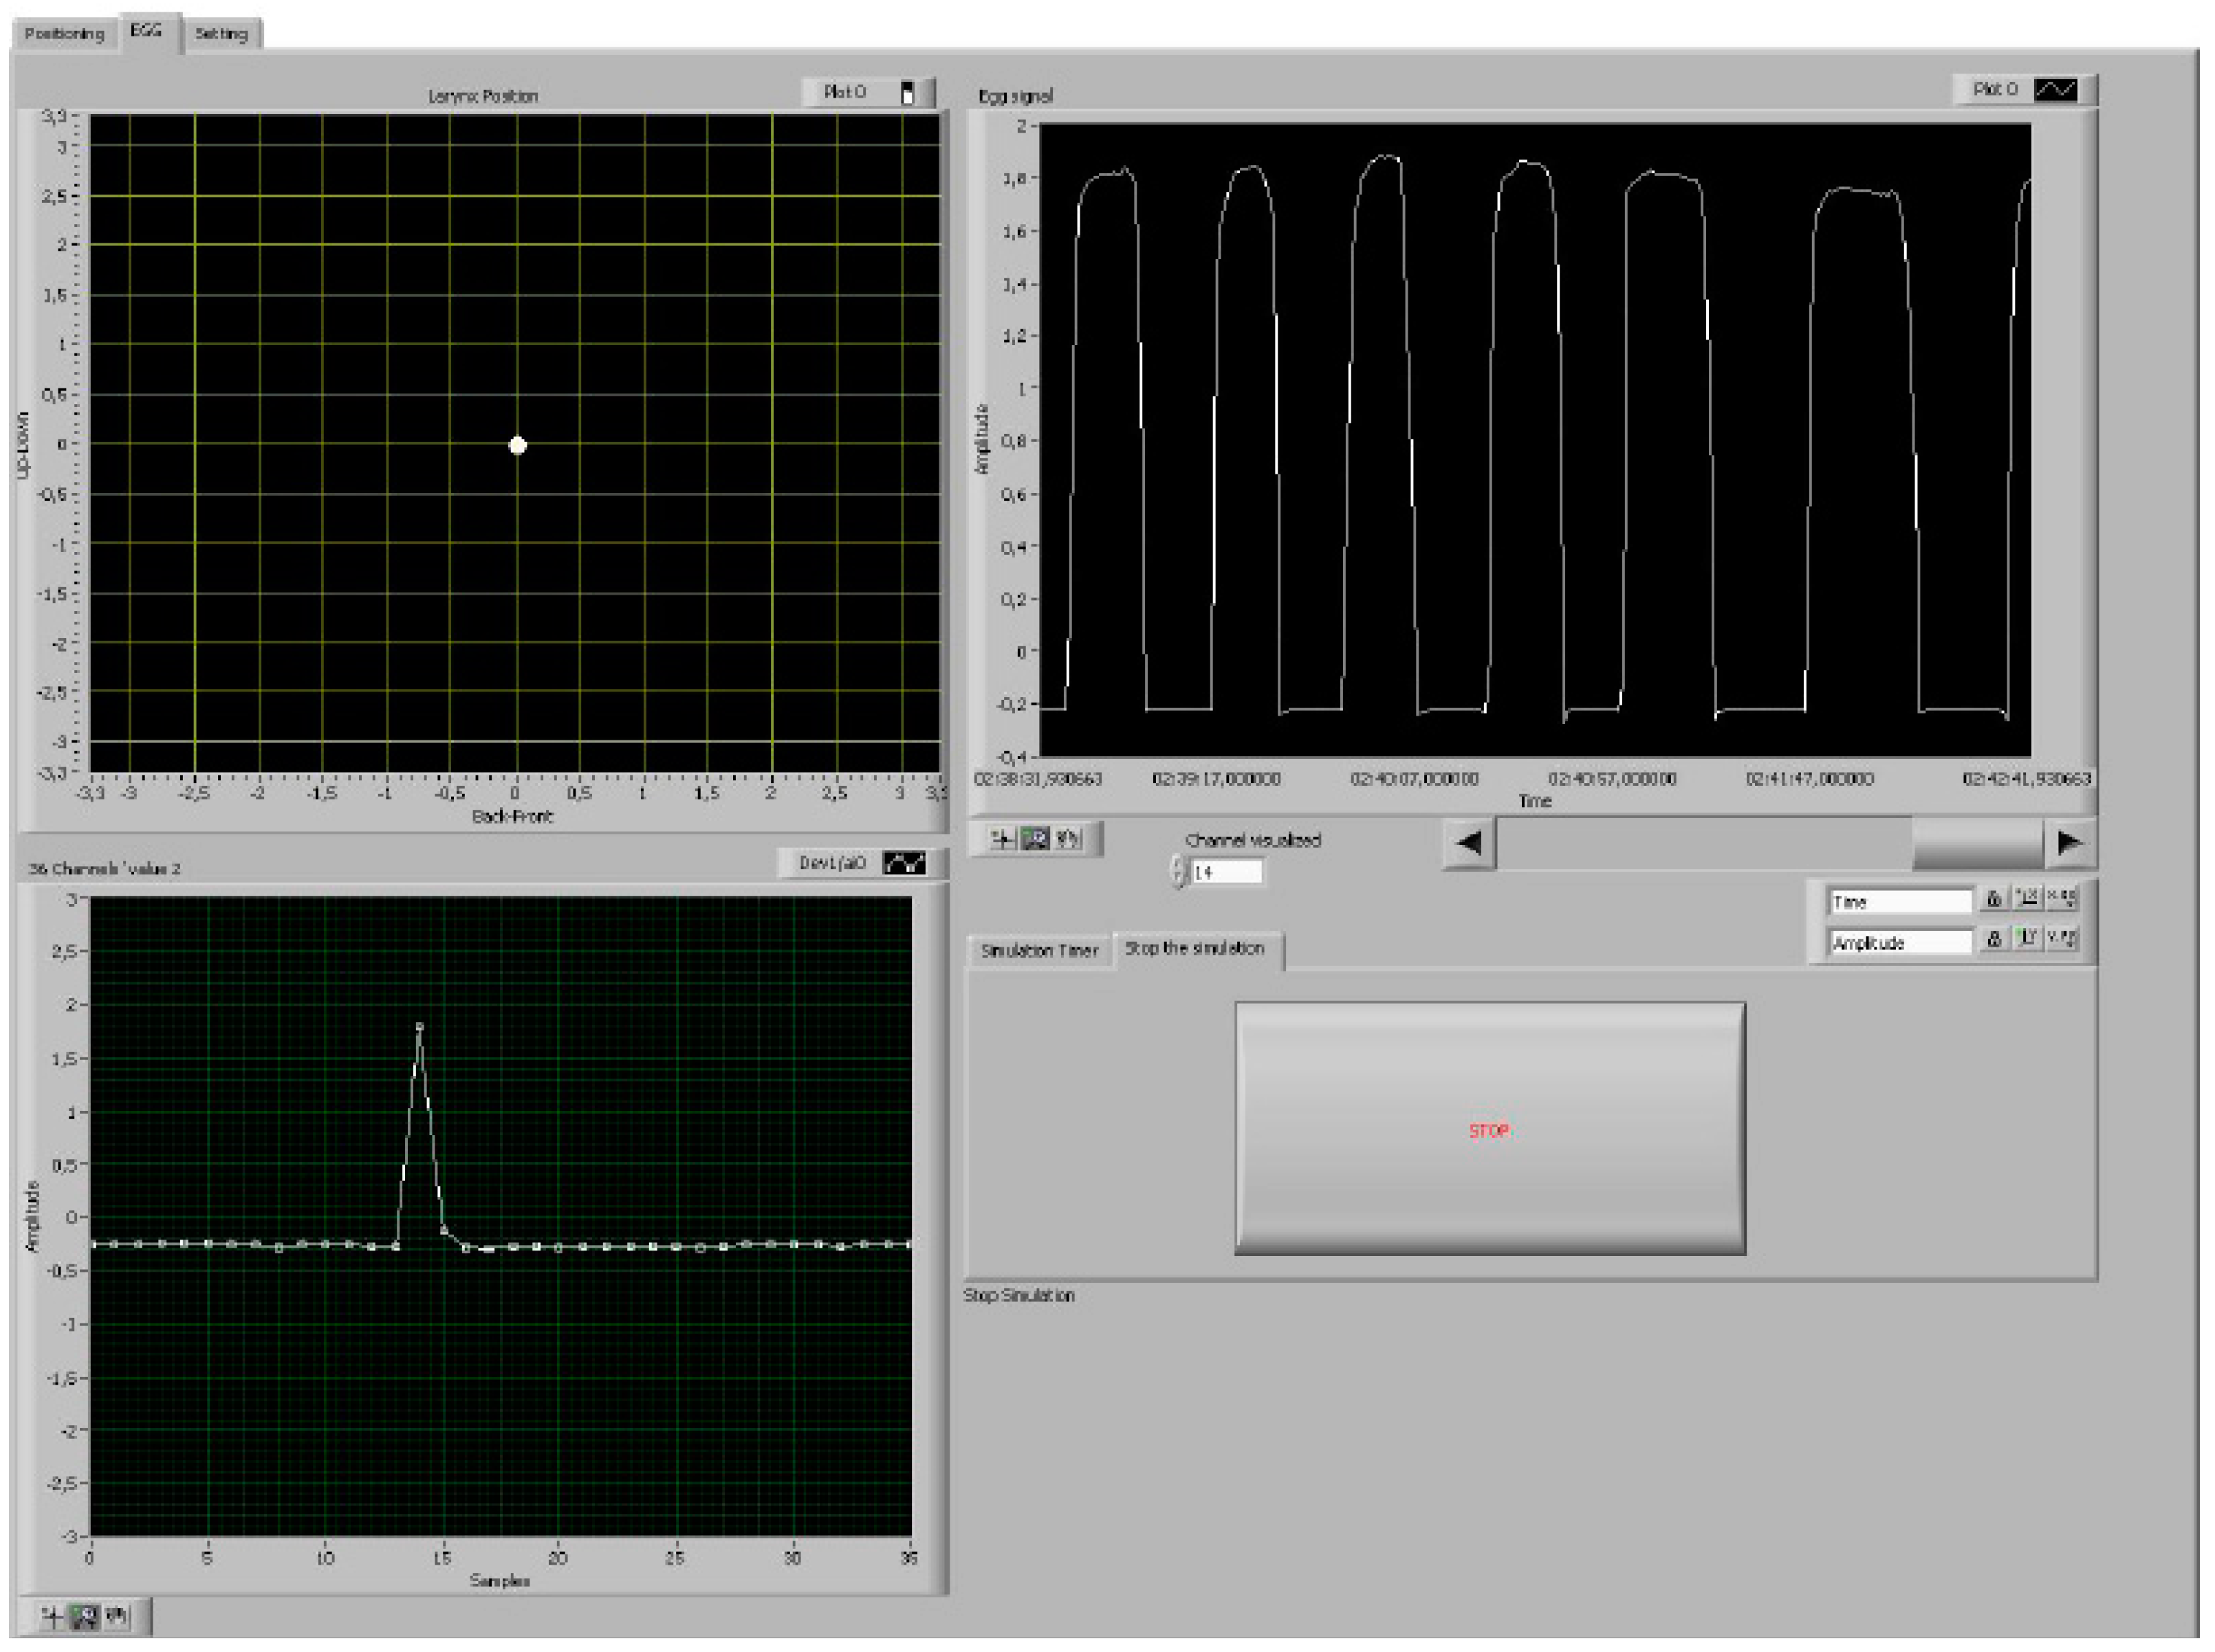
The Front Panel tool consisted of a macro-box with three folders (Figure 4): the first was used for the electrodes’ positioning; the second, called the EGG, was developed to acquire data and to evaluate the larynx position inside the neck. The same box also includes a graph that shows the real-time dynamic of one channel (user defined), which represents the TEC variation in time (the typical EGG signal that evaluates the glottal dynamic).
The second folder included another box that allowed the user to set the simulation time or to manually stop it.
The third (last) folder, called “Setting”, enclosed all the settable parameters. The acquired-data matrix is also visualized in that folder. This might be saved as a text file, which is useful for a Matlab post-processing, in a spreadsheet (.xls) file, or both [13].
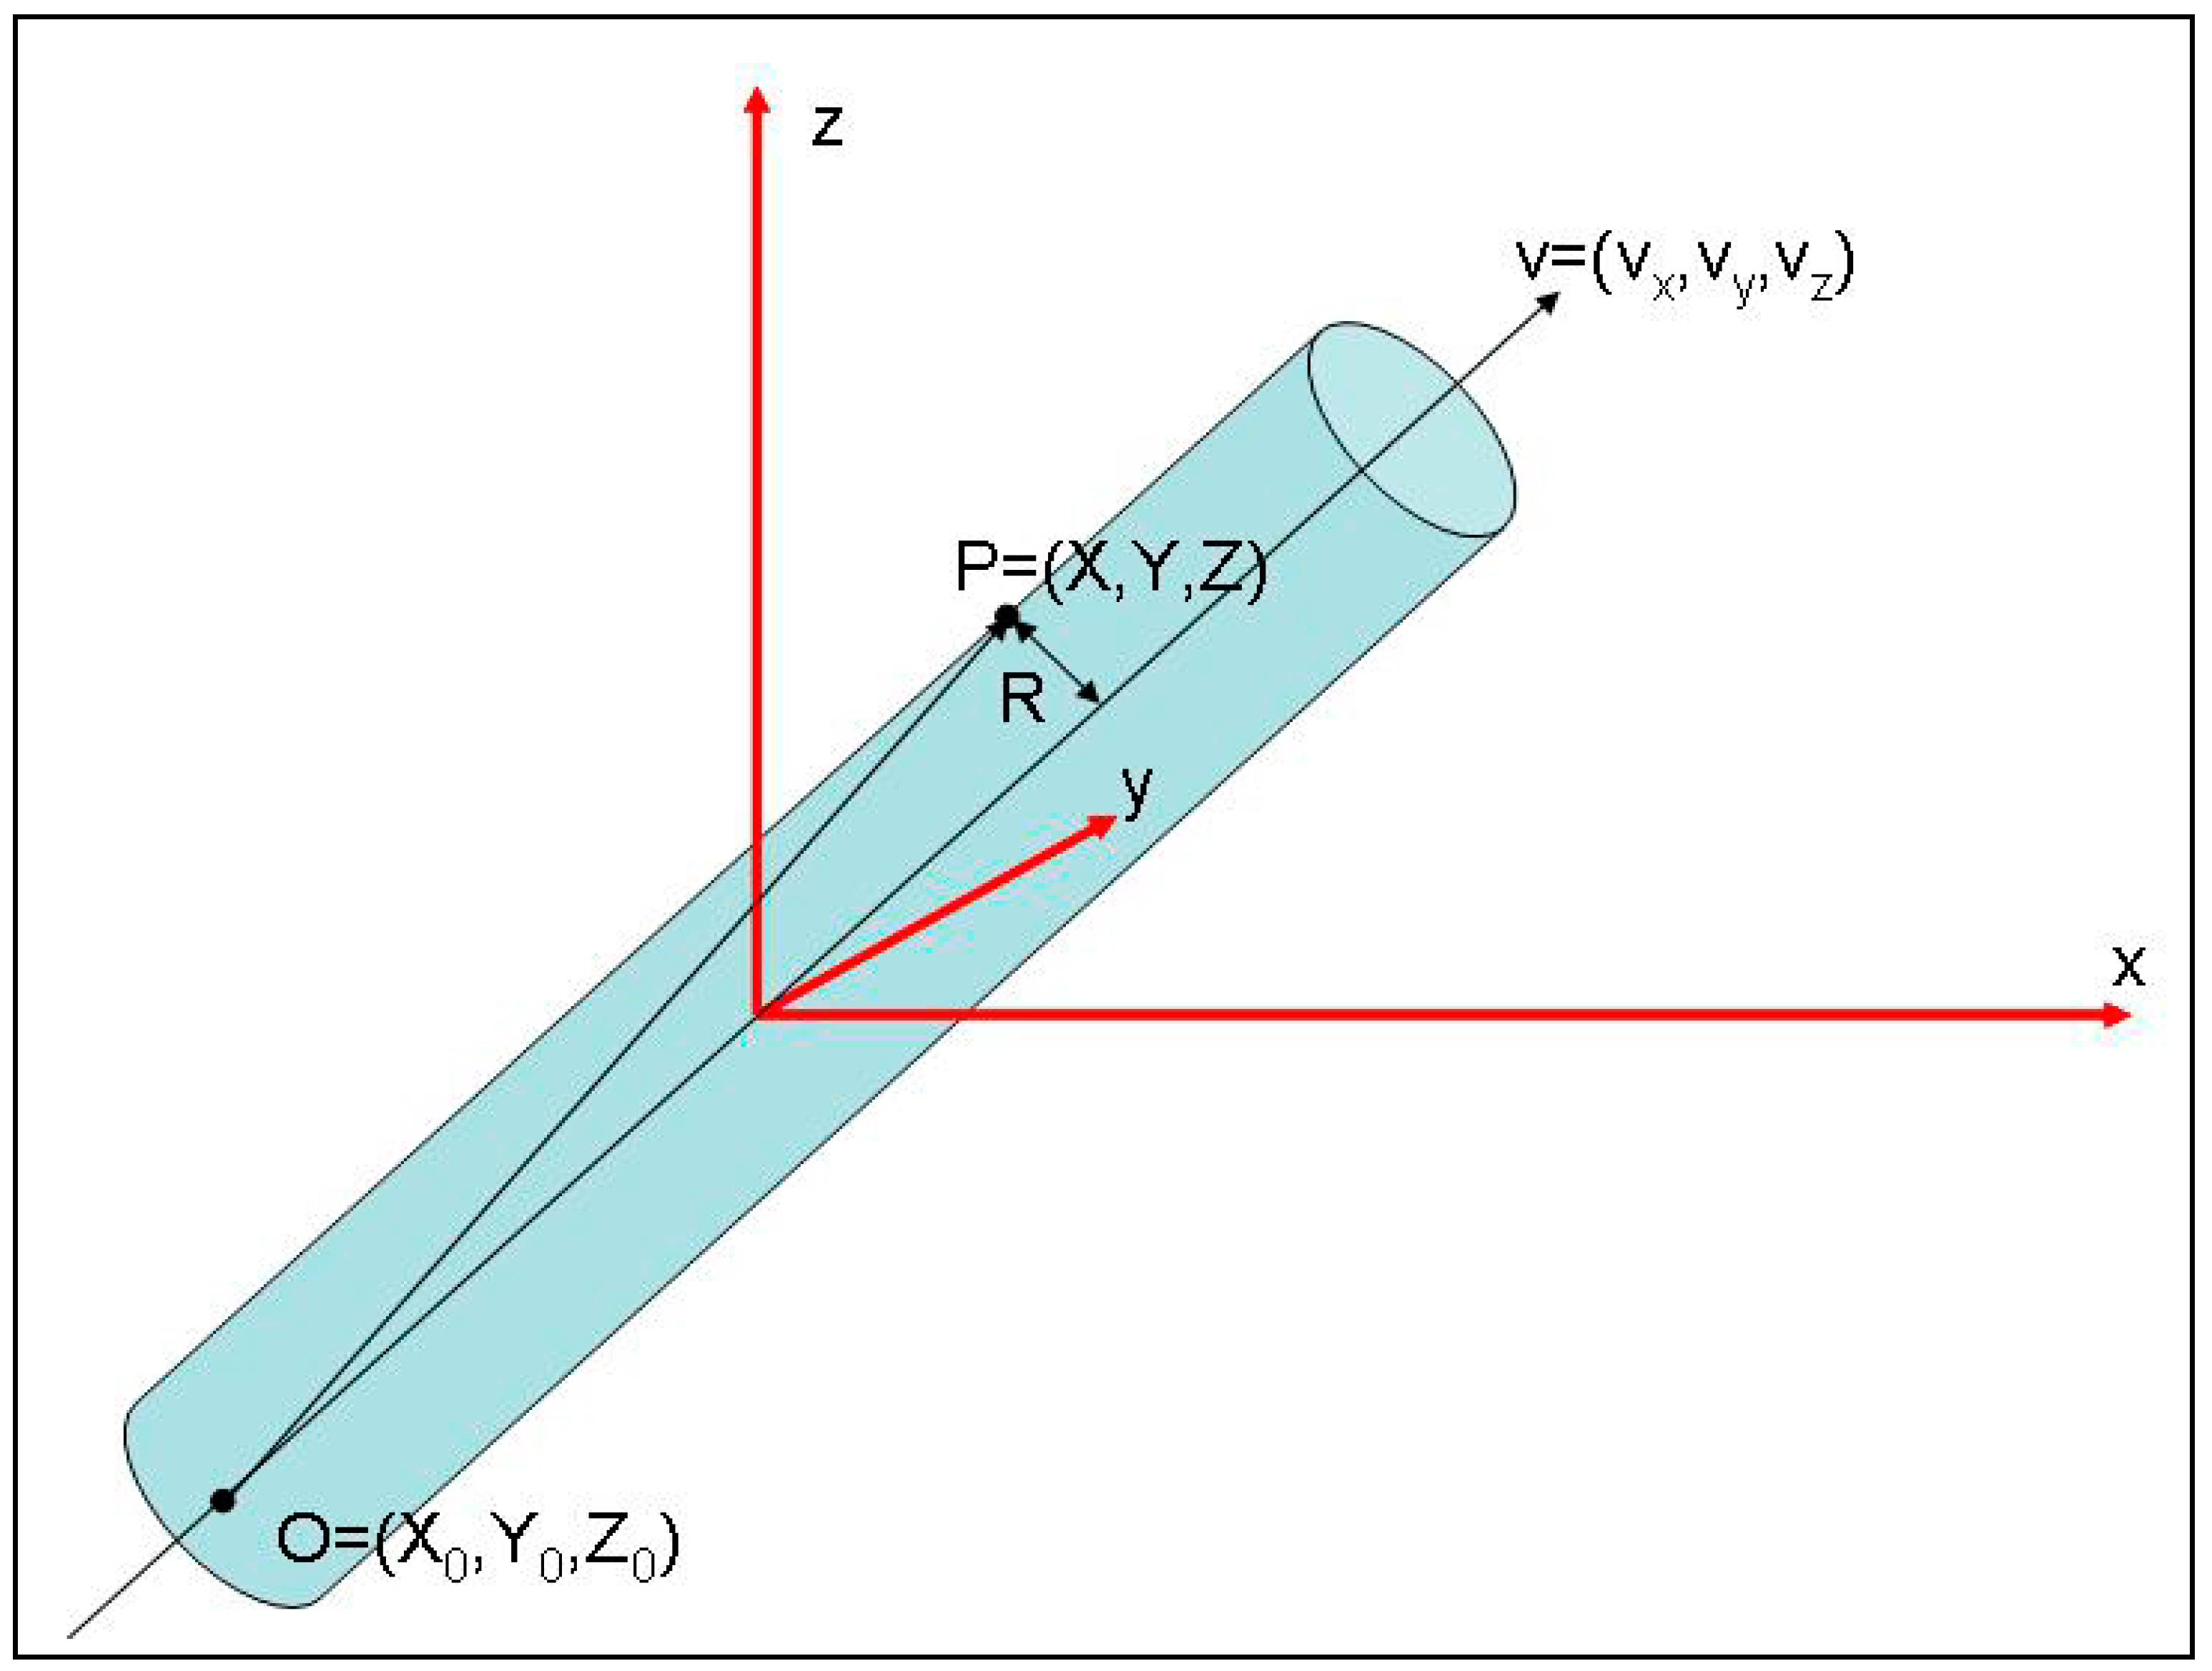
The output matrix contained 36 columns, with each one representing a possible current path inside the neck between a sender and a receiver electrode: the number of rows depends on the simulation time. The algorithm for the evaluation of the larynx position has been developed in a “light” version, in terms of computational cost, in order to work online with Labview. In Matlab, the algorithm is more complex and more precise because it might work offline. The EGG signal consists of an AM (Amplitude Modulated) signal; its value is bigger when the current flows through the vocal folds’ plane. On the other hand, it becomes smaller if that plane is partially crossed or not crossed at all. We approximated the field between two electrodes as a cylindrical shape. Therefore, we used the information given by the EGG signal to obtain information about the distance between the axis of each cylinder and the vocal folds’ plane.
When the distance between electrodes is known, we can calculate all the 36 possible cylinders representing the 36 current paths (Figure 5).
The mathematical equation that should be solved for each cylinder is:
where i = 1,…,6 is the index for the sending electrodes; j = 1,…,6 is for the receiver ones; and X, Y, Z represents the larynx position coordinates, which start from position (Xi0, Yi0, Zi0). They should potentially assume any value inside the volume mapped by the two electrodes’ arrays.
In Formula (1), C represents the “cost function”. Therefore, for each set of X, Y, Z, we could obtain 36 possible cost functions. The sum of the cost function for all 36 paths will give the global cost function. The most probable point where the larynx is located is obtained by minimizing the global cost function, by varying the X, Y, Z sets.
Since in a volume we could localize infinite values for X, Y, and Z, it was necessary to divide them into finite elements in each direction, otherwise the problem could not be solved in a continuous medium.
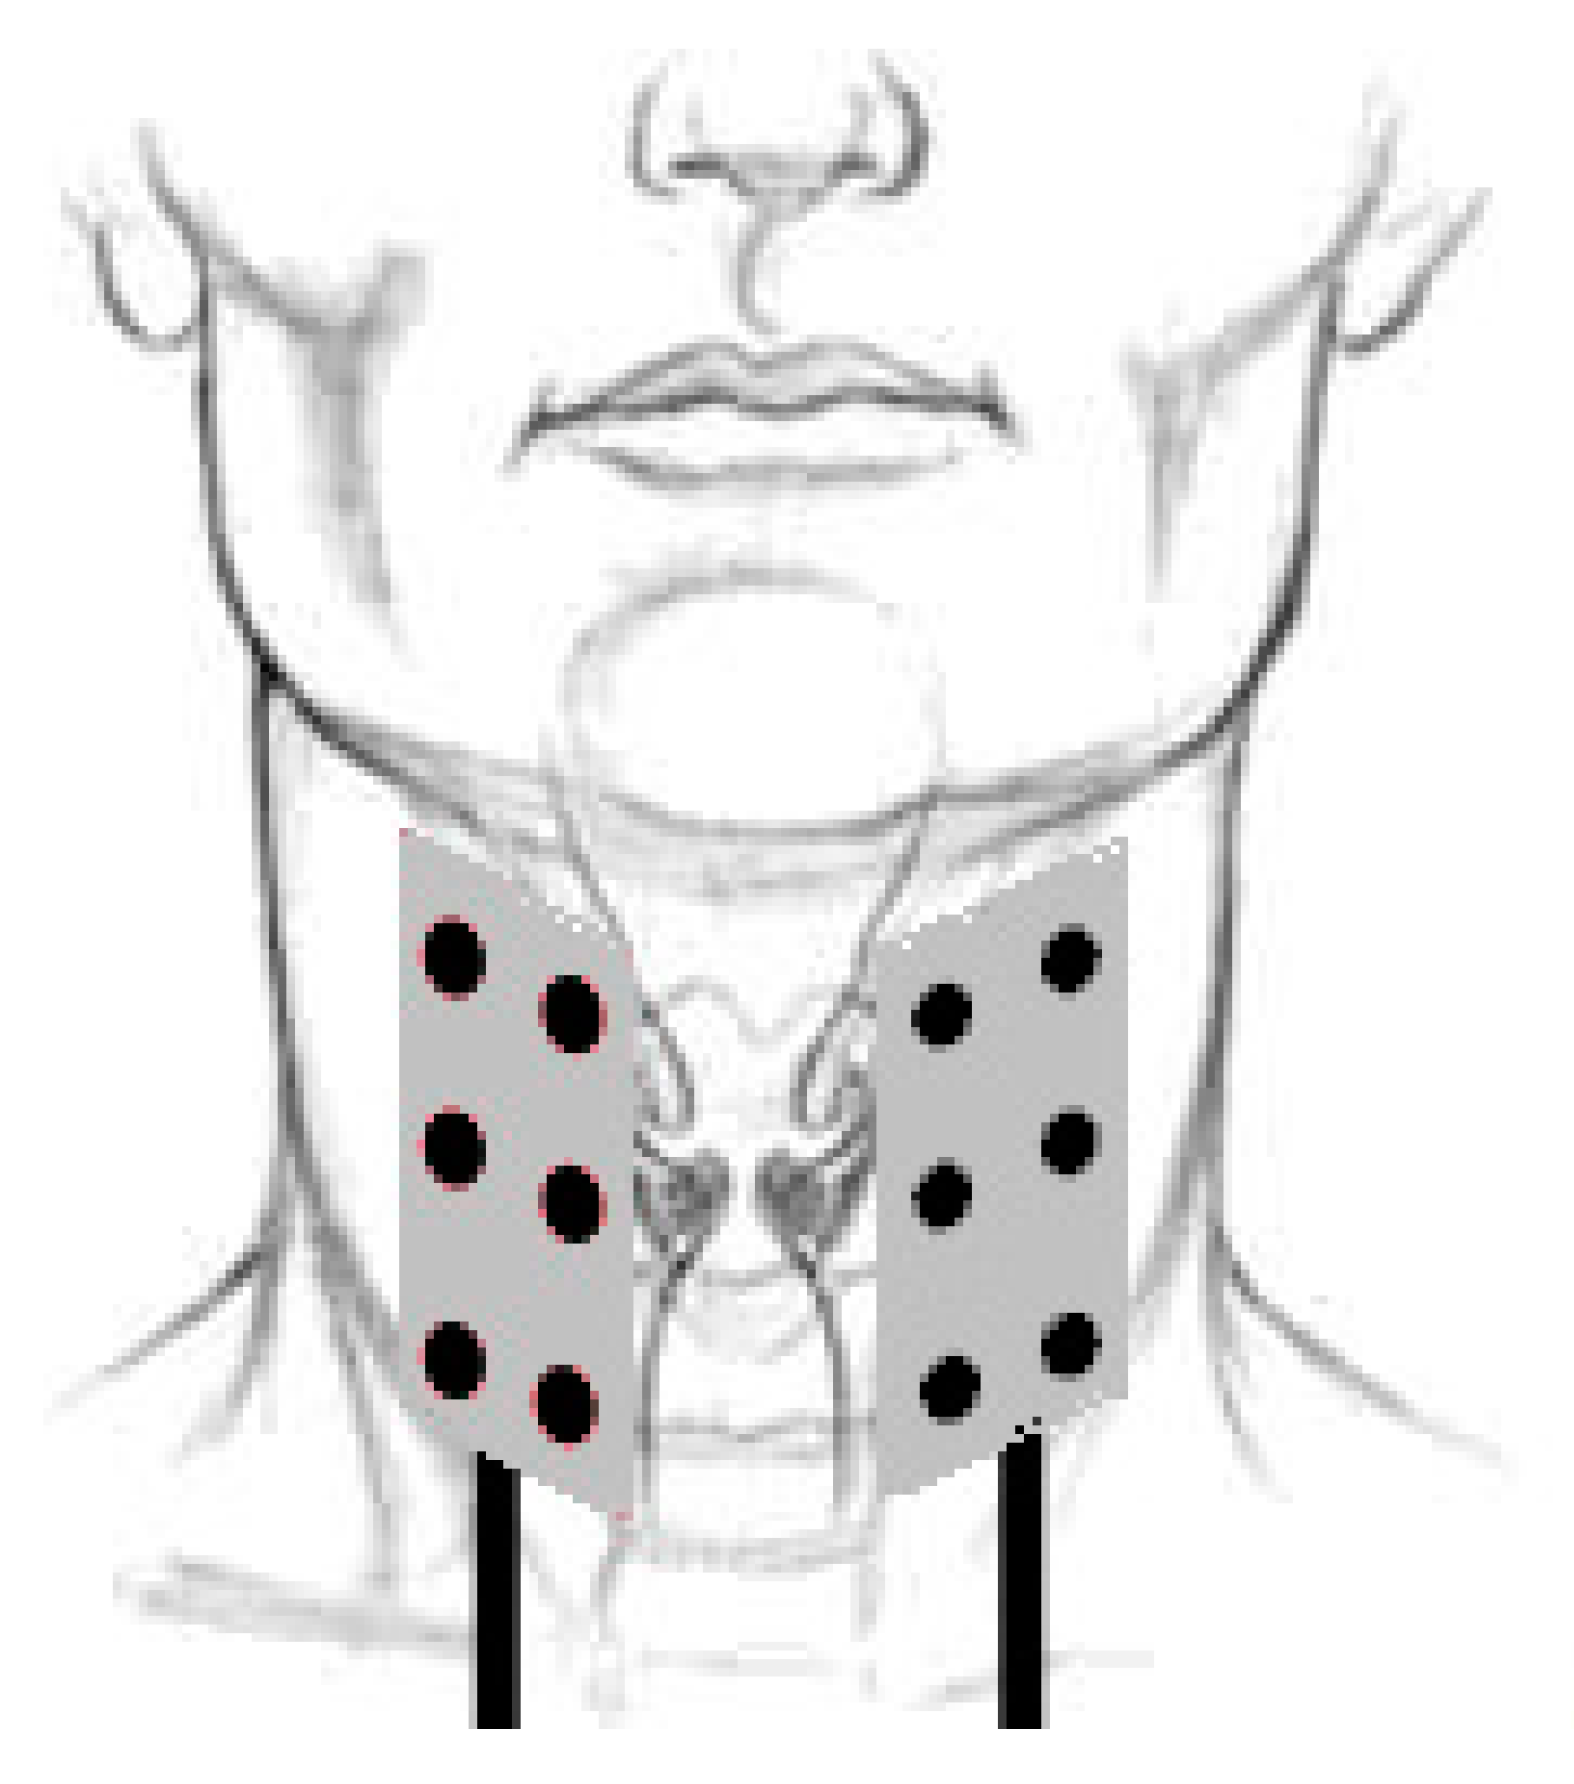
In order to obtain a finite number of values for X, Y, and Z in a specific volume, we have divided the global volume through three grids on the main axis, evaluating only the intersection points. Nevertheless, even in this case, we would have had an excessive number of points, aiming to reach a good spatial resolution (i.e., millimeters). Figure 6 reports the position of MC-EGG for humans.
This problem has been solved using the EGG values, acquired at the beginning of each measure cycle, to restrict the number of possible values.
In order to reduce the number of tested points, we introduced two logic trees, one for the Y coordinates and the other one for the Z coordinates. These trees exclude, by logical operation of the 36 EGG signal, the zones of the mapped volume that could not be interested by the position of the larynx; in this way, we reduced the number of tested points. The full algorithm has been implemented in Matlab to obtain an accurate solution.
The lateral displacement of the larynx (on the X axis) has never been studied and there is no literature material about it; nevertheless, this algorithm gives the user the possibility to also set a displacement range on the X axis.
The Labview code worked online and the implementation of the whole algorithm was not possible; for this reason, we built another, lighter algorithm, that uses just the two logic trees to define a range of possible values on Y and Z. This algorithm considered the midpoint as the most probable point for the larynx position.
4. Comparison between Software and Experiments
The new developed software has been tested by studying the larynx displacement during two well-known vocal acts: the alternate emission of the vowel/a, first with a low note and then with a high note; and swallowing.
In order to guarantee a correct synchronization between the physical (measured) signal and the acquisition (samples acquired), the acquisition chain in Labview should be set to read data in Finite Mode. The sampling rate that allows the best synchronization was estimated to be around 38.5 kHz: using this sampling rate, we could acquire 36 samples every 3.5 ms. It is also important to remember that the EGG signals are normally studied during the emission of a low note characterized by a fundamental frequency of f0 ≈ 100 Hz. It is also important to note that during the alternate emission of a low and high note, the larynx has a marked displacement, in the range between 18 and 22 mm [14].
Moreover, the high level of background noise caused some difficulties of accuracy during the acquisition of the experimental data, since the EGG signal has a magnitude of around 1 mV, which is comparable with the background noise. However, this background noise, which represents the main issue during these experiments with an EGG device, is often discussed in scientific literature [14,15].
In order to reduce the background noise, the first attempt consisted of using a proper contact gel which could increase the ECC signal, improving the contact between the electrode and the skin surface. The second attempt consisted of using a higher voltage range, which was in the order of tens of mV.
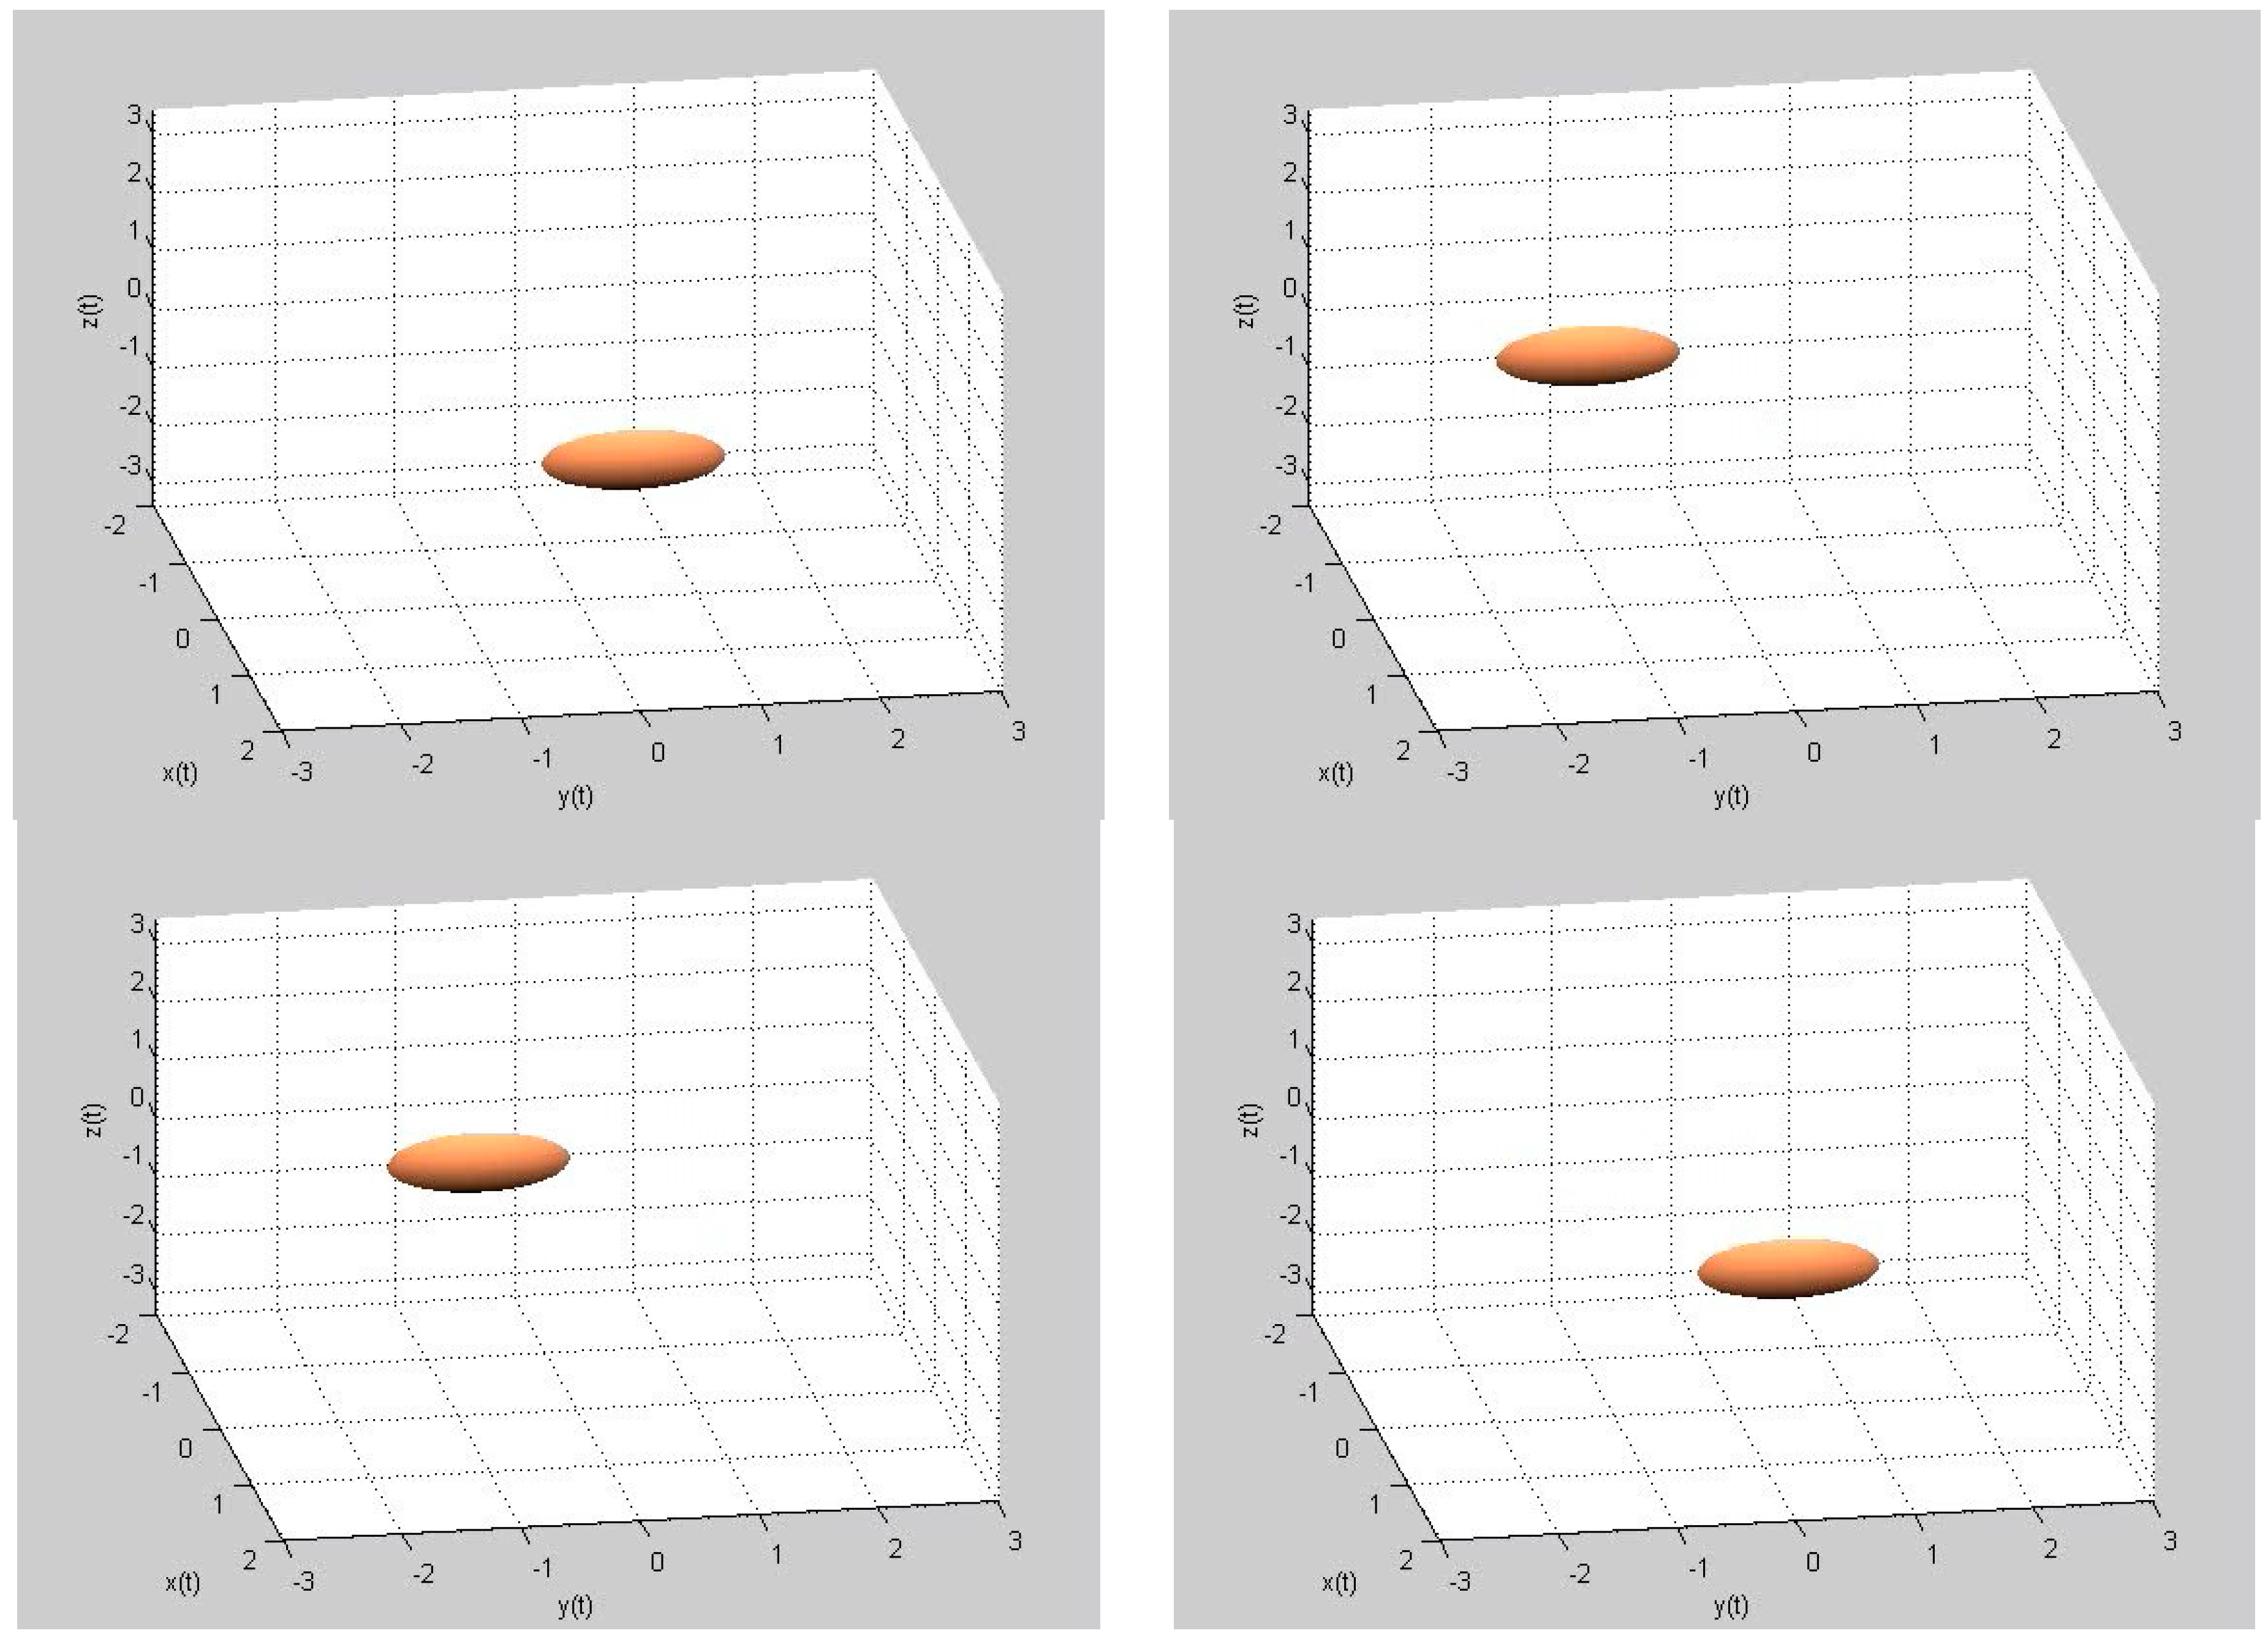
The two codes were initially tested using the Labview code, and then the Matlab code. As expected, Labview allowed us to visualize the larynx in a downward position during the emission of the low note and an upward displacement during the emission of the same note at a higher frequency. There is no back-forward displacement of the larynx during this phonetic act. The range of displacement was 0 mm on the sagittal plane and 18.2 mm on the vertical plane, as described in scientific literature [15].
The data acquired by the Labview code was processed with the Matlab algorithm. In this way, the larynx movement was graphically visualized. The resulting movement was similar to the Labview one, and the resulting displacement was 0 mm for the sagittal plane and 18.4 mm for the vertical one. Besides the graphs, a video of the displacement was also obtained. Figure 7 reports some frames of the video.
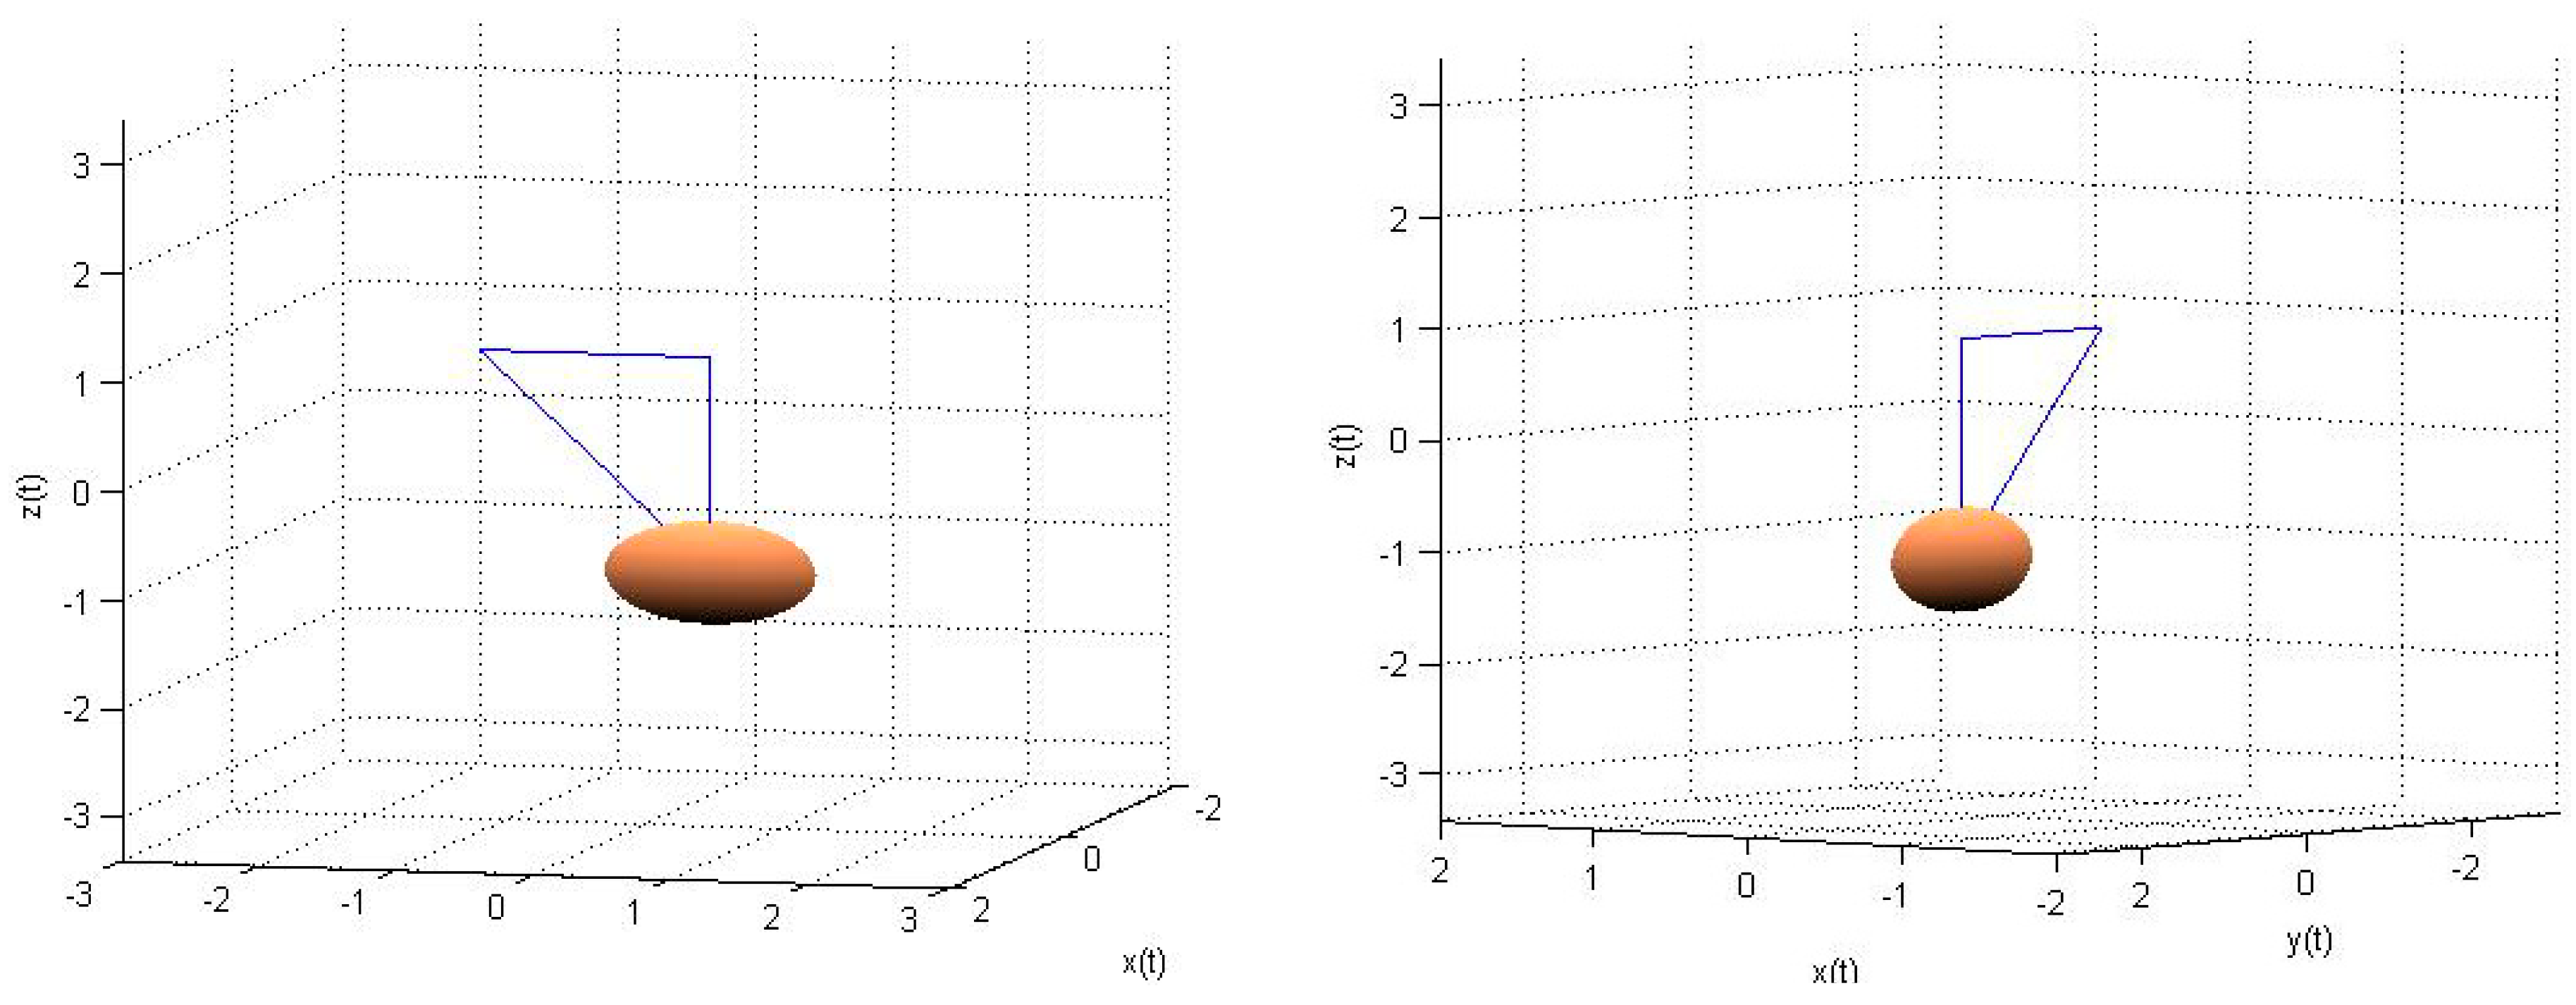
During swallowing, the path of the larynx inside the neck is more complex; the larynx responds to this act by rising up in the first moment to push down the bolus, the epiglottis then moves backward to avoid the bolus penetration into the respiratory airways and, when the bolus is passed, the larynx returns to the original position.
The results obtained from the evaluation made through Labview and Matlab confirmed this path [13]. We recorded a 19.7 mm vertical displacement (both in Labview and Matlab), while the sagittal movement was 16.65 mm with Labview and 16.75 mm in Matlab. All these values are inside the range described by scientific literature [15]. Figure 8 reports the swallowing displacement as elaborated by Matlab.
5. Conclusions
The purpose of this work was to develop a tool able to visualize the glottal dynamic and the displacement of the larynx inside the neck during phonetic acts. This task was possible to achieve by means of fast EGG data acquisition, properly designed and configured, and by means of the development of a specific algorithm to process the data acquired.
The Matlab code also allowed us to study the larynx displacement on the coronal plane. Currently, there is not enough knowledge about this kind of movement and this research could be a starting point for further analysis.
Moreover, there is the prospective to extend the potentiality of the numerical code for exploiting the number of electrodes. In this way, it might be possible to study the behavior of the ventricular (or false) vocal folds. These are not exactly vocal folds, because they have different tissues and do not display muscular activity. The false vocal folds are not usually used in the normal phonation, but could be used for some kinds of singing styles, and they take the place of the true vocal folds in some voice diseases. So far, the ventricular (false) vocal folds have been less investigated, but the interest in them is growing. This research could contribute to, for example, detecting voice disorders in a non-invasive way.
Author Contributions
L.T., M.K. and C.G. contributed equally for writing original draft, control, review and editing, for setting up the experiments and the codes, for formal analysis and funding.
Funding
This research received no external funding.
Acknowledgments
The Authors wish to thank Andrea Casadei for having collaborated with the measurements.
Conflicts of Interest
The authors declare no conflict of interest.
References
- Campbell, D.M. Evaluating musical instruments. Phys. Today 2014, 67, 35–40. [Google Scholar] [CrossRef] [Green Version]
- Tronchin, L. Modal analysis and Intensity of Acoustic Radiation of the kettledrum. J. Acoust. Soc. Am. 2005, 117, 926–933. [Google Scholar] [CrossRef] [PubMed]
- Farina, A.; Tronchin, L. On the “Virtual” reconstruction of sound quality of trumpets. Acta Acust. Acust. 2000, 86, 737–745. [Google Scholar]
- Kato, K.; Fujii, K.; Hirawa, T.; Kawai, K.; Yano, T.; Ando, Y. Investigation of the relation between minimum effective duration of running autocorrelation function and operatic singing with different interpretation styles. Acta Acust. Acust. 2007, 93, 421–434. [Google Scholar]
- Nakayama, M.; Kato, K.; Matsunaga, M. Statistical analysis and modeling of formant frequencies of vowels phonated by traditional Japanese Shigin singers. Int. J. Innov. Comput. Inf. Control 2017, 13, 1441–1452. [Google Scholar]
- Tronchin, L. The emulation of nonlinear time-invariant audio systems with memory by means of Volterra series. J. Audio Eng. Soc. 2012, 60, 984–996. [Google Scholar]
- Tronchin, L.; Coli, V.L. Further investigations in the emulation of nonlinear systems with Volterra series. J. Audio Eng. Soc. 2015, 63, 671–683. [Google Scholar] [CrossRef]
- Shimokura, R.; Tronchin, L.; Cocchi, A.; Soeta, Y. Subjective diffuseness of music signals convolved with binaural impulse responses. J. Sound Vib. 2011, 330, 3526–3537. [Google Scholar] [CrossRef]
- Titze, I. The Myoelastic Theory of Phonation; National Center for Voice and Speech: Iowa City, IA, USA, 2006. [Google Scholar]
- Kob, M.; Frauenrath, T. A system for parallel measurement of glottis opening and larynx position. Biomed. Signal Process. Control 2009, 4, 221–228. [Google Scholar] [CrossRef]
- Maresek, K. Description of the EGG Waveform. Available online: www.ims.uni-stuttgart.de/phonetik/EGG/pagee2.htm (accessed on 4 September 2018).
- Deller, J.R.; Hansen, J.H.; Proakis, J.G. Discrete-Time Processing of Speech Signals; Macmillan: New York, NY, USA, 1993. [Google Scholar]
- Casadei, A.; Tronchin, L.; Kob, M. Derivation of Spatial Information from a Multi-Channel Electroglottograph. In Proceedings of the Forum Acusticum 2011, Aalborg, Denmark, 27 June–1 July 2011; pp. 415–419. [Google Scholar]
- Lindqvist, J.; Sawashima, M.; Hirose, H. An Investigation of Vertical Movement of the Larynx in a Swedish Speaker; Annual bulletin, No. 7; Research Institute of Logopedics and Phoniatrics: Tokyo, Japan, 1973. [Google Scholar]
- Abe, S.; Kaneko, H.; Nakamura, Y.; Watanabe, Y.; Shintani, M.; Hashimoto, M.; Yamane, G.; Ide, Y.; Shimono, M.; Ishikawa, T.; et al. Experimental device for detecting laryngeal movement during swallowing. Bull. Tokyo Dent. Coll. 2002, 43, 99–203. [Google Scholar] [CrossRef]
Figure 1.
Phases of the idealized EGG waveform related to the vibratory cycle of the folds: 1: closing phase; 2: maximum contact; 3 opening phase; 4: open, no contact.
Figure 1.
Phases of the idealized EGG waveform related to the vibratory cycle of the folds: 1: closing phase; 2: maximum contact; 3 opening phase; 4: open, no contact.

Figure 2.
A standard EGG.

Figure 3.
An example of MC-EGG, used for the experiments.

Figure 4.
Labview Main Panel for acquiring data: EGG page.

Figure 5.
Cylindrical field between two electrodes.

Figure 6.
Application of MC-EGG on humans.

Figure 7.
Frames from the created Matlab movie for the larynx movement.

Figure 8.
Trajectory of the larynx evaluated by the Matlab code for swallowing.

© 2018 by the authors. Licensee MDPI, Basel, Switzerland. This article is an open access article distributed under the terms and conditions of the Creative Commons Attribution (CC BY) license (http://creativecommons.org/licenses/by/4.0/).
Share and Cite
MDPI and ACS Style
Tronchin, L.; Kob, M.; Guarnaccia, C. Spatial Information on Voice Generation from a Multi-Channel Electroglottograph. Appl. Sci. 2018, 8, 1560. https://doi.org/10.3390/app8091560
AMA Style
Tronchin L, Kob M, Guarnaccia C. Spatial Information on Voice Generation from a Multi-Channel Electroglottograph. Applied Sciences. 2018; 8(9):1560. https://doi.org/10.3390/app8091560
Chicago/Turabian StyleTronchin, Lamberto, Malte Kob, and Claudio Guarnaccia. 2018. "Spatial Information on Voice Generation from a Multi-Channel Electroglottograph" Applied Sciences 8, no. 9: 1560. https://doi.org/10.3390/app8091560
Note that from the first issue of 2016, this journal uses article numbers instead of page numbers. See further details here.