Article

Five-Frame Variable Phase-Shifting Method for Full-Range Spectral-Domain Optical Coherence Tomography

1
Laboratory of Optics, Terahertz and Non-Destructive Testing, School of Mechanical Engineering and Automation, Fuzhou University, Fuzhou 350108, China
2
School of Mechatronic Engineering and Automation, Shanghai University, Shanghai 200072, China
3
School of Physics and Information Engineering, Fuzhou University, Fuzhou 350108, China
*
Author to whom correspondence should be addressed.
Appl. Sci. 2018, 8(9), 1580; https://doi.org/10.3390/app8091580
Submission received: 27 July 2018 / Revised: 25 August 2018 / Accepted: 30 August 2018 / Published: 7 September 2018
(This article belongs to the Special Issue Optical Coherence Tomography and its Applications)

Abstract

:

Featured Application

The proposed five-frame variable phase-shifting method can be applied to reduce the effects of polychromatic errors for full-range spectral-domain optical coherence tomography when a broadband light source is employed.

Abstract

In order to achieve a better complex conjugate artifacts (CCA) suppression, we propose a five-frame variable phase-shifting (FVP) method for spectral domain optical coherence tomography (SD-OCT). The traditional five-frame invariant phase-shifting (FIP) method employs five phase shifts correlate with the center wavelength. However, due to the effects of polychromatic errors, the FIP method cannot get excellent CCA suppression. In the present work, we employ FVP method using variable phase shifts which is dependent on all the wavelengths and therefore, theoretically, the system would have no effects of polychromatic errors. This is the reason why the FVP method would achieve better CCA suppression than the FIP method. Comparative studies between FIP and FVP methods are investigated in the work. Subsequently, we develop a homemade SD-OCT system involving a homemade spectrometer, by which the anterior segment of a rat’s eyeball is measured. The experimental results demonstrate that the quality of OCT images is significantly improved by using FVP method with an increase by a factor of 1.7 on the CCA suppression of SD-OCT. FVP provides a new strategy for complex conjugate artifacts suppression for spectral domain optical coherence tomography.

1. Introduction

In the past several decades, spectral domain optical coherence tomography (SD-OCT) has played an important role in many significant fields due to its non-contact, non-invasive nature, and it does not threaten human health. It is currently widely used in high-precision detection of pathological tissue [1,2], the detection of composite materials [3], and medicine imaging [4] etc., since it was proposed by Fercher et al. [5]. In these significant applications, the quality and the depth range of SD-OCT system is very important. In SD-OCT system, a grating is used to spread the interfering two beams by wavelength and capture the frequency domain information of the interference signal through the charge-coupled devices (CCD) camera. A challenging problem which arises in this field is traditional SD-OCT system yields only the real part of the interferometric signal due to spectrometer limitations, which will produce complex conjugate artifacts (CCA) [6]. To achieve better imaging quality and imaging depth, there are many alternative methods available for solving the problem. These methods include phase-shifting method [7,8], achromatic sinusoidal phase modulation [9], off-axis illumination [10], electro-optic phase modulation [11], attenuation-based methods [12,13], using a scanner to modulate spatial interferograms [14,15], full-bandwidth k-domain linearization method [16], and so on. As far as we know, the CCA of SD-OCT system cannot be completely removed by using the traditional five-frame phase-shifting method because of the effects of polychromatic errors whilst achromatic sinusoidal phase modulation method requires too much data. To solve these problems, a new phase shifting strategy named five-frame variable phase-shifting (FVP) method, was proposed. The FVP is dependent on the wavelengths whilst traditional five-frame invariant phase-shifting (FIP) method is correlated with the center wavelength. In comparison with traditional FIP method, this novel phase shifting method has the advantage of higher resistance to polychromatic errors and better error tolerance.

2. Theory and Simulation of Five-Frame Variable Phase-Shifting Method for SD-OCT

2.1. Theory

Figure 1 shows a homemade full-range spectral domain optical coherence tomography system, including a super luminescent diode (SLD) light source, Michelson Interferometer, and a spectrometer, etc. The graded index (GRIN) fiber collimator makes the light output of a SLD (850 nm) into collimated light and a cube beam splitter divided the light into two equal-power beams. One light went to the piezoelectric ceramic transducer (PZT) translating reference mirror and the second one went into the sample arm. The data acquisition (DAQ) card was used to control the moving of the PZT translating reference mirror. The optical path difference between reference and sample arm will be changed if the reference mirror moves. We could obtain five frames of the interference signal of the sample with a phase difference of π / 2 .
In SD-OCT system, the light source from SLD passing through the reference beam of Michelson Interferometer finally captured by the detector could be expressed as:
E R ( k , z ) = A R ( k , z ) e x p ( j 2 k z r )
where A ( k , z ) is the spectral intensity distribution of the SLD light source, j 2 k z r is the phase of signal, 2 z r is the optical path length of reference light, and k is the wave number.
The light reflected from the sample could be expressed as:
E S ( k , z ) = n A S ( k , z ) e x p ( j 2 k z n )
where z n is the optical length of different layers of the sample.
The complex conjugate interference signal in k-space could be expressed as:
I c ( k ) = D C + A C + n A n r ( k ) e x p [ j 2 k ( z n z r ) ]
D C = I r r ( k ) + n I n n ( k )
A C = n m A n m ( k ) e x p [ j 2 k ( z n z m ) ]
where DC is the direct current (DC) item, I r r ( k ) is the light intensity reflected from reference arm, n I n n ( k ) is the light intensity reflected from different sample layers, AC is the auto-correlation (AC) item, z n , z m is the optical path taken by the light reflected from different layers of the sample, and z r is the optical path taken by the light reflected from PZT translating reference mirror.
In SD-OCT, the CCD camera yields only the real part of the interferometric signal. Since the direct current item and the auto-correlation item is not associated with phase shift, Equation (3) could be simplified as:
I ( k ) = I 0 ( k ) + A n r ( k ) c o s [ φ ( k ) + ( k ) ]
( k ) = × k k 0
where φ ( k ) is the phase of the interference signal of each reflection layer of the sample, is the invariant phase shift, k 0 is the central wave number, and k is the wave number. The wavelength-dependent variable phase shift ( k ) varies with the wave number. The five-frame variable phase-shift interference signal correlated with the wavelength, are given as:
{ I ( k ) 1 = I 0 ( k ) + A n r ( k ) c o s [ φ ( k ) 2 ( k ) ] I ( k ) 2 = I 0 ( k ) + A n r ( k ) c o s [ φ ( k ) ( k ) ] I ( k ) 3 = I 0 ( k ) + A n r ( k ) c o s [ φ ( k ) ] I ( k ) 4 = I 0 ( k ) + A n r ( k ) c o s [ φ ( k ) + ( k ) ] I ( k ) 5 = I 0 ( k ) + A n r ( k ) c o s [ φ ( k ) + 2 ( k ) ] .
Subsequently, the intensity A n r ( k ) and phase φ ( k ) of the interference signal could be calculated as:
A n r ( k ) = 1 4 s i n 2 ( k ) s q r t ( 4 ( I 2 I 4 ) 2 ( I 1 I 5 ) 2 + ( 2 I 3 I 1 I 5 ) 2 )
t a n [ φ ( k ) ] = 2 ( I 2 I 4 ) 2 I 3 I 1 I 5 s i n 2 [ ( k ) ]
For the FIP method, if the invariant phase shift is = π / 2 , the intensity A n r ( k ) , and the phase φ ( k ) of the interference signal could be calculated as [1]:
A n r ( k ) = 1 4 s q r t ( 4 ( I 2 I 4 ) 2 ( I 1 I 5 ) 2 + ( 2 I 3 I 1 I 5 ) 2 )
t a n [ φ ( k ) ] = 2 ( I 2 I 4 ) 2 I 3 I 1 I 5
In fact, the Equations (11) and (12) are the special cases of Equations (9) and (10) when ( k ) is equal to an invariant phase shift of π / 2 . After calculating the intensity A n r ( k ) and phase φ ( k ) , the reconstructed complex conjugate interferometric signal I c ( k ) is given by:
I c ( k ) = A n r ( k ) c o s [ φ ( k ) ] + j A n r ( k ) s i n [ φ ( k ) ] .
By doing fast Fourier transform (FFT) for Equation (13), we could obtain the depth information of the sample.

2.2. Simulation

To demonstrate the performance of FVP method, we compared the results by using the proposed method with those of the traditional methods. In the simulation, we used a Gaussian light source with a central wavelength of 850 nm and bandwidth of 75 nm as the light source. In order to get closer to the real situation, we added 0.3% noise (which has normal distribution) to the light source signal. The interferometric signal would be obtained as shown in Figure 2. The five-frame interference signals would be calculated by Equation (8) using MATLAB codes.

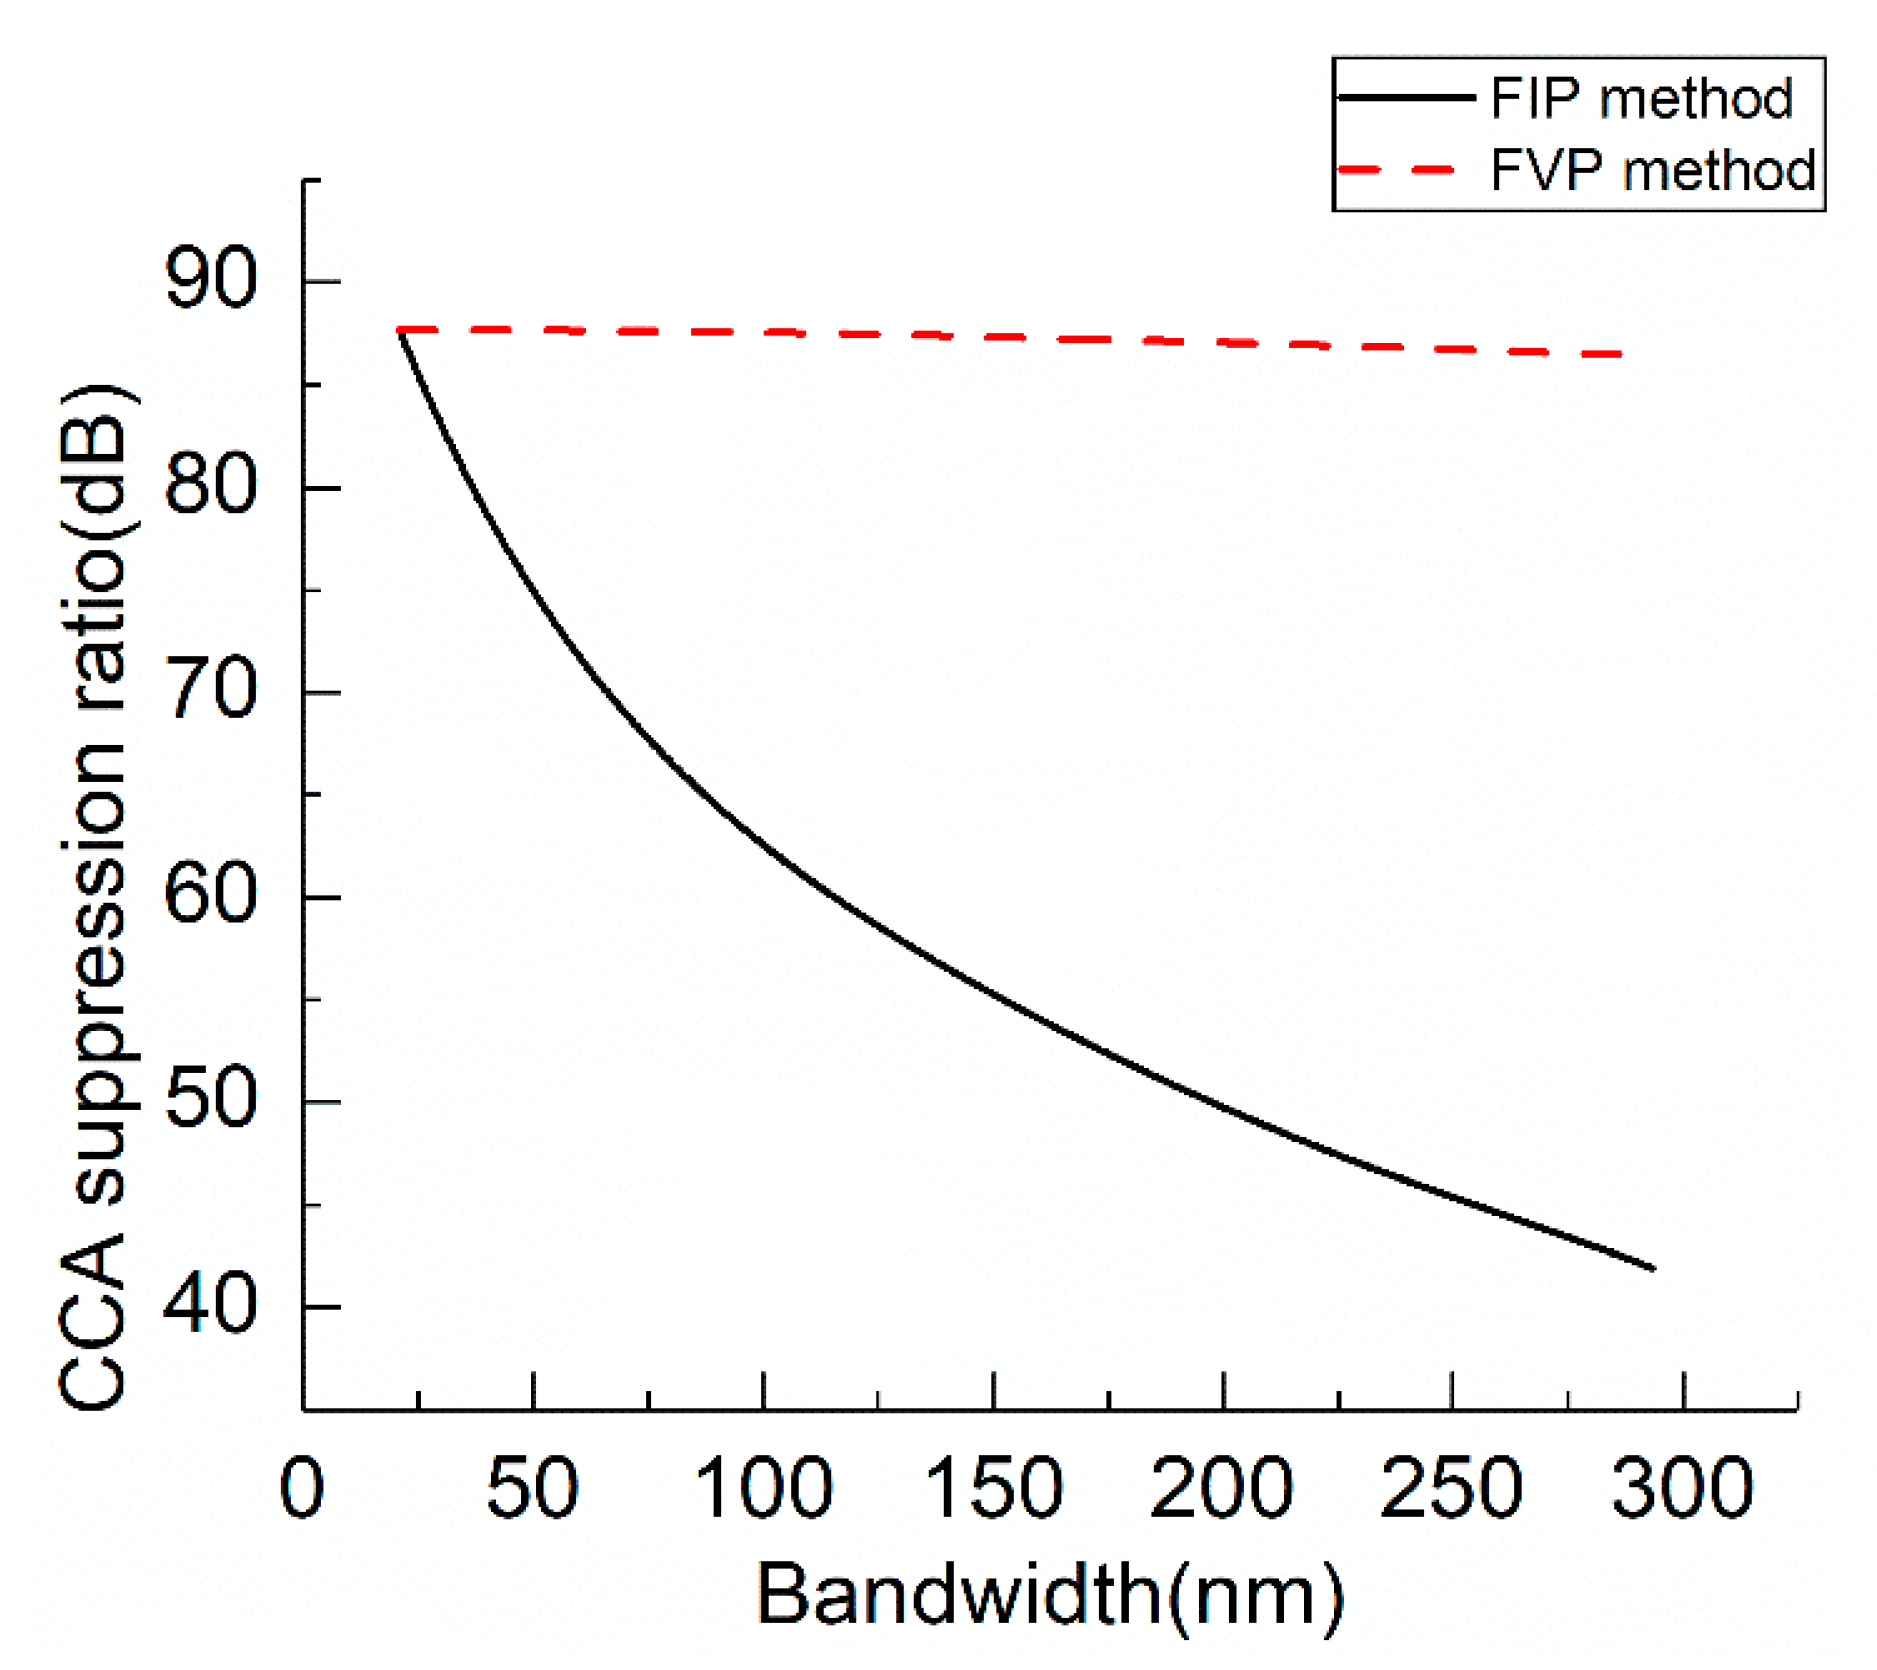
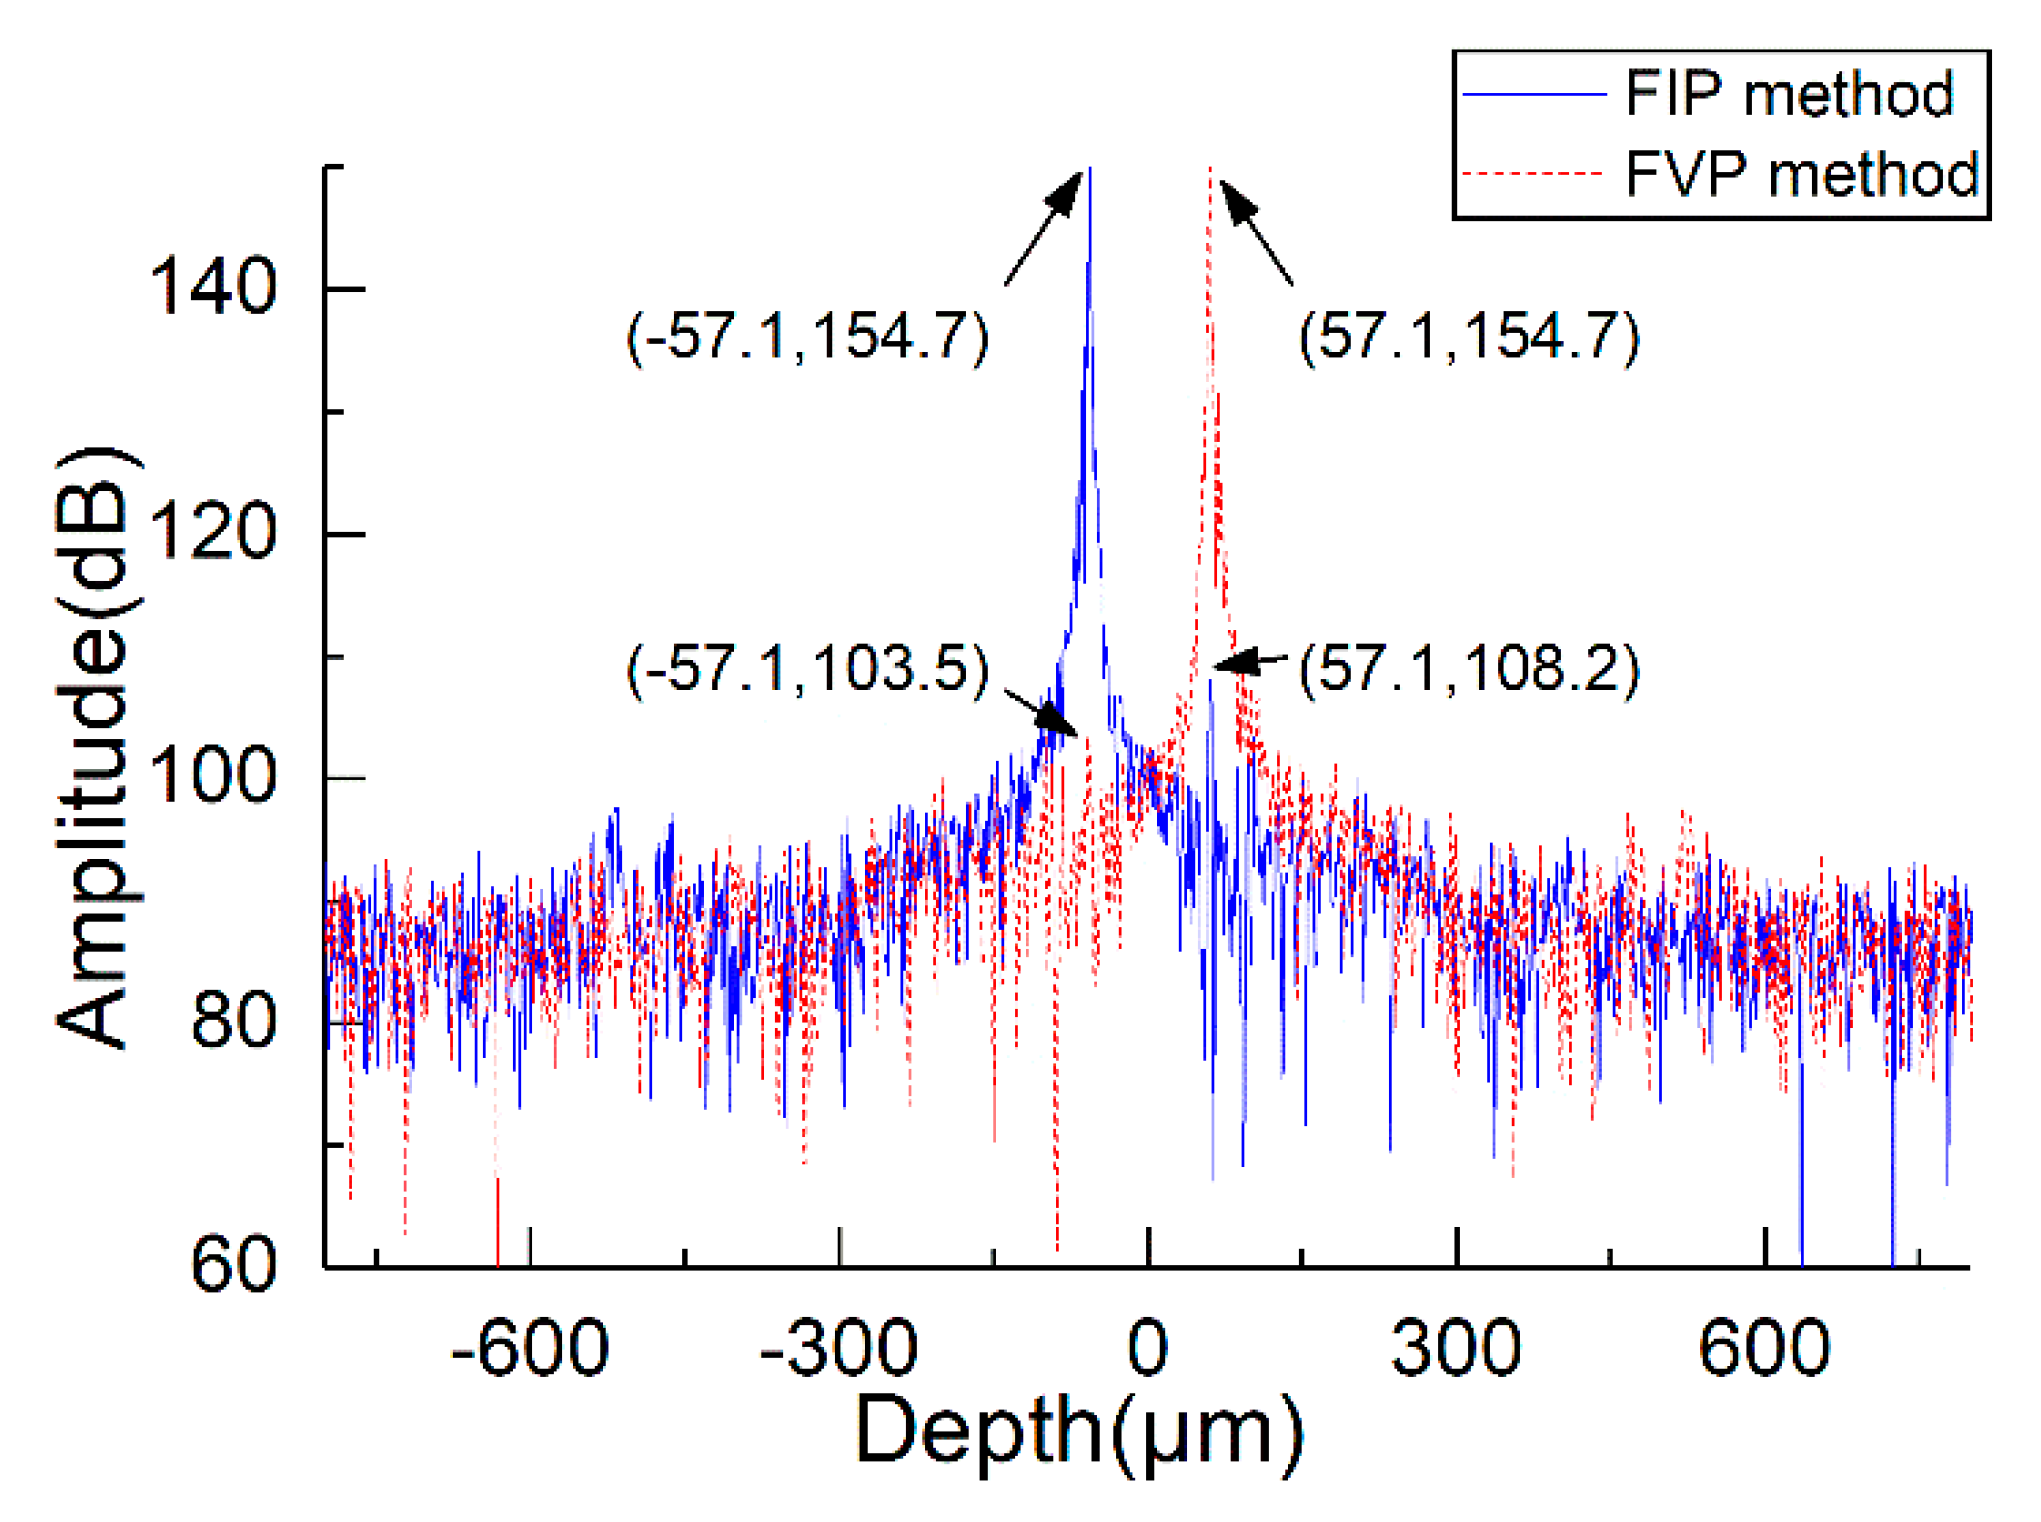
2.2.1. CCA Suppression Ratio

In order to quantify the complex conjugate suppression, the suppression ratio is the most important parameter for complex conjugate removal methods. Here, we defined the CCA suppression ratio as the difference between the amplitudes of the signal and complex conjugate artifact. Figure 3 showed simulated CCA suppression ratio values for FIP and FVP methods. As indicated in Figure 3, the CCA suppression ratios for FIP and FVP methods are 65.0 dB and 87.6 dB , respectively. The reason why the CCA suppression ratio of FVP method is higher than that of FIP method is that the polychromatic error of FIP method is higher than that of FVP method. Figure 4 demonstrated the correlation of polychromatic error and bandwidth of light source. It showed that the polychromatic error increases as the wavelength is far away from the center wavelength. For example, if the wavelength is 820 nm which is away from the center wavelength by a value of 30 nm , we could calculate the actual phase shift according to Equation (7) as ( 2 × π / 820 ) = × 2 × π / 820 2 × π / 850 . Therefore, the phase-shifting error could be calculated by e r r o r = × 2 × π / 820 2 × π / 850 . When the phase shift = ± 90 ° , the phase-shifting errors for 90° and −90° phase shifts reach 3.29°. The error value will be 6.58° for 180° and −180° phase shifts. The FIP method cannot completely remove CCA due to the influence of polychromatic error since the five phase shifts are correlated with the center wavelength and they result in phase-shifting errors. However, for the FVP method, we used variable phase shifts corresponding to the wavelengths instead of an invariant phase shift correlated with center wavelength and therefore, the polychromatic error is 0 in theory.

2.2.2. Polychromatic Error Analysis

In reality, polychromatic error and phase-shifting error of PZT have a great influence on the OCT imaging quality; also, the bandwidth of the light source will influence the polychromatic error. Generally, the wider the bandwidth, the bigger the polychromatic error. We changed the bandwidth of the light source to obtain Figure 5 by MATLAB. In Figure 5, the effect of light source bandwidth on CCA suppression was analyzed. The solid line is for FIP method and the dashed line is for the FVP method. We noticed that when the light source bandwidth is narrow, the CCA suppression ratio of FIP and FVP methods are almost the same. For example, if the light source bandwidth is 30 nm , the CCA suppression ratio for FIP and FVP methods are 88 dB . However, if it is a broadband light source, the difference of CCA suppression between the FIP and FVP methods will be large. For example, if the light source bandwidth is 290 nm , the CCA suppression ratio for FIP method is 45 dB whilst the one for FVP method is ~87 dB . It could be found that the SD-OCT system’s CCA suppression ratio decreases exponentially with the increasing of bandwidth of light source if the FIP method is employed. However, the CCA suppression ratio for the FVP method is nearly unaffected by the bandwidth of the light source.
The influence of phase-shifting error due to PZT movement also takes an important role in CCA suppression ratio. In Figure 6, the effect of phase-shifting error on CCA suppression was also analyzed. The error of phase-shifting displacement and expected displacement is affected by many factors, including random noise of voltage loaded on PZT, random disturbance of the surrounding environment, and so on. This error distribution is generally a normal distribution model. Therefore, we added a random phase-shifting displacement error with a mean of 0 nm and a variance of 0 to 7 nm during the simulation by MATLAB. The CCA suppression ratio of the FIP and FVP methods will decrease exponentially with the increasing of phase-shifting displacement error. As could be seen from Figure 6, the CCA suppression of our novel method is better than FIP method when the phase-shifting displacement error is less than 5 nm . In summary, it is proved that the FVP method can get better CCA suppression for polychromatic errors and phase-shifting errors.

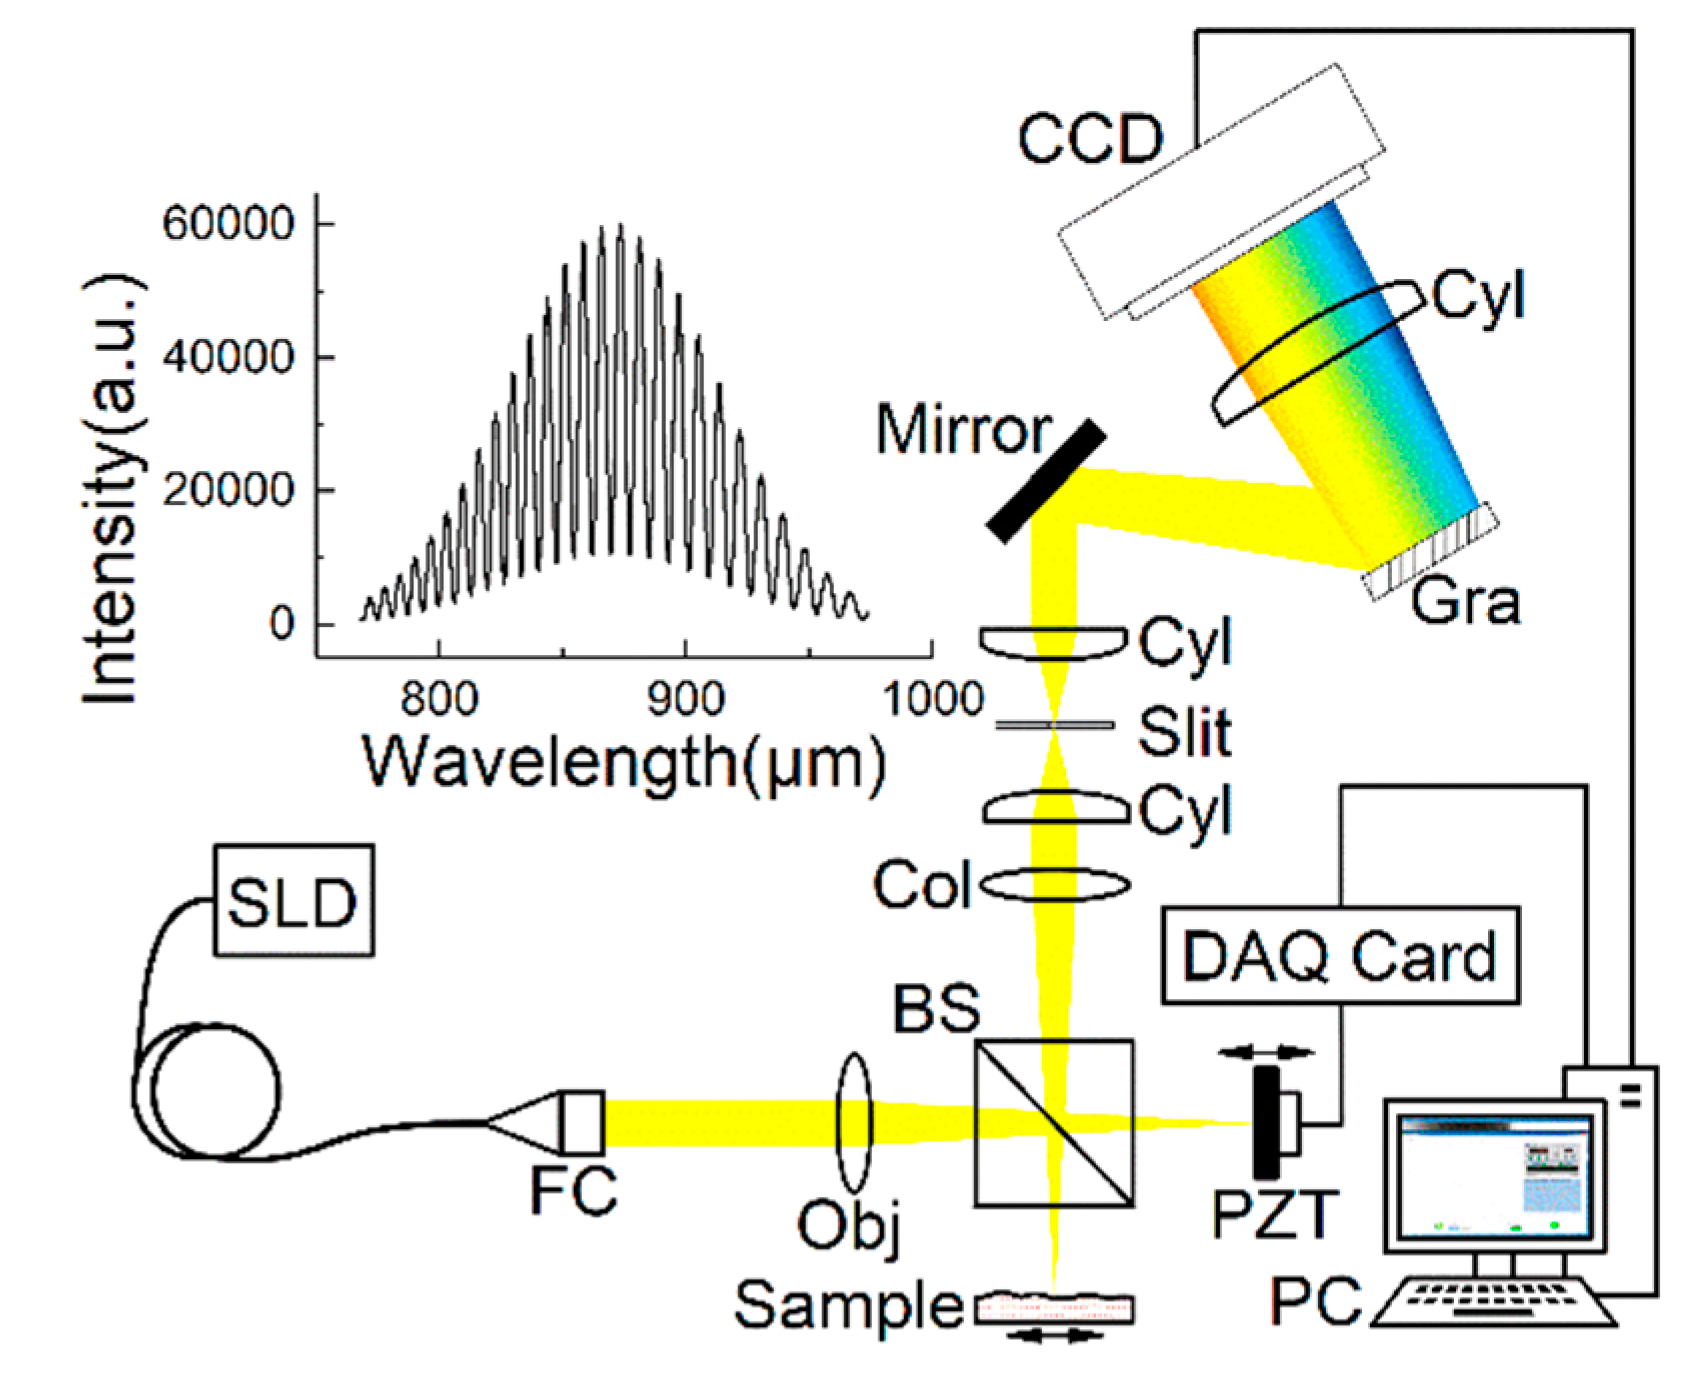
3. Experiments and Discussions

In this section, we presented the results of measuring the suppression ratio of the CCA achieved by using traditional FIP and FVP methods in experiments.

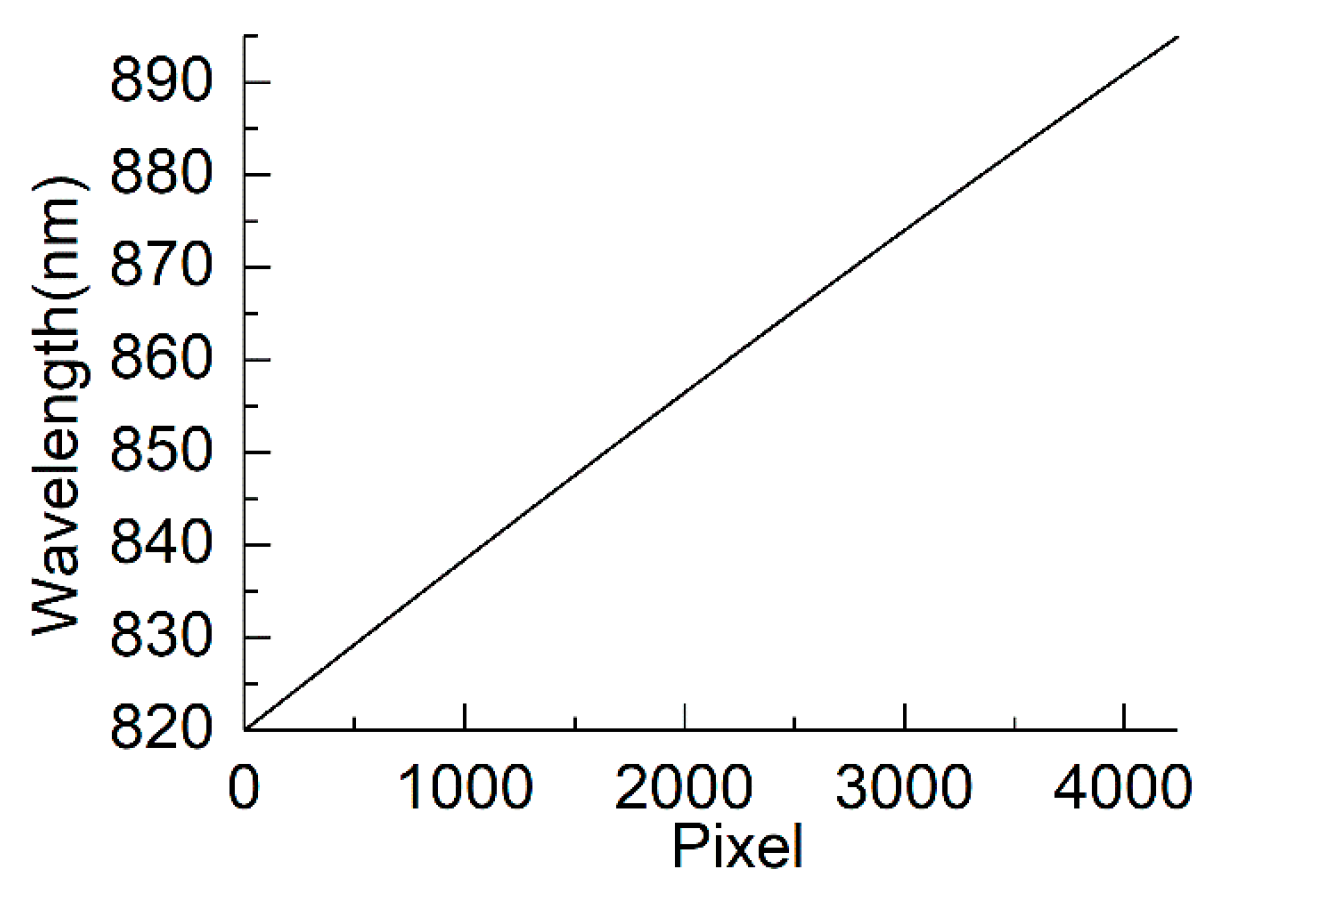
3.1. System Parameters

In the experiments, we developed a homemade full-range SD-OCT system including a homemade spectrometer. Here are some parameters of the components used by the system: the center wavelength λ 0 of SLD was 850 nm and the bandwidth Δ λ was 75 nm , the focal length f O b j of object lens was 75 mm , the spot diameter d of parallel light was 6   mm , cylindrical lens with a focal length of 75 mm , collection lens with a focal length of 75 mm, and the SNR (Signal-to-Noise Ratio) of the system was 60 dB. The camera detector (Ximea, Münster, Germany) had maximum FPS (frames per second) of 30, for the camera, a minimum resolution of 4244 × 200 pixels. However, we only used 4244 × 21 pixels in the experiment; we got the average of the 21 lines of signals as interference signal in order to improve the imaging quality. The reason is that the SNR is the best when 21 lines are used for the average, as can be seen from Figure 7 which shows the SNR for different line numbers when we measured the ex vivo rat eyeball.
In the calibration procedure, the interferometric signal whose optical path is 1005 μ m , was used to calibrate the wavelength axis. The reason for choosing the optical path difference is that the density of interference fringes is more suitable for finding the variation of the wavelength. A single-frequency laser (Thorlabs CPS850) with a wavelength of 850 nm was employed to determine the pixel location for the corresponding 850 nm wavelength. Subsequently, the wavelength λ 1 = λ 0 × | d 1 d 2 | / ( | d 1 d 2 | + λ 0 × | T 1 T 1 | ) of the first pixel of the camera and the one of the last pixel λ 2 = λ 0 × | d 1 d 2 | / ( | d 1 d 2 | λ 0 × | T 2 T 2 | ) can be calculated [17], where λ 0 = 850 nm; d 1 is the location of the reference arm when the period number of interference fringes between the first pixel and the pixel for 850 nm is T 1 whilst the one between the last pixel and the pixel for 850 nm is T 2 . After a slight movement of the reference arm whose location is d 2 , the period number of interference fringes between the first pixel and the pixel for 850 nm is T 1 whilst the one between the last pixel and the pixel for 850 nm is T 2 . With the variation of wavelength and the wavelength of the first pixel and last pixel, the wavelength axis can be calibrated as shown in Figure 8. The wavelength can be used in Equation (7) to calculate the corrected phase shifts which can be substituted to Equations (9) and (10) to calculate intensity and phase of interference signals. It is noted here that the wavelength-calibration error is ± 0.15   nm using the calibration method. The maximum phase shift error caused by the wavelength-calibration error using Equation (7) is 90 × 2 × π / 895 2 × π / 850 90 × 2 × π / 894.85 2 × π / 849.85 = 0.00076 ° . This value is so small that the influence of wavelength-calibration error can be ignored.
The system’s axial resolution could be obtained from the point spread function (PSF). Figure 9 is the PSF of the system at a light path difference of 1005 μm. The dashed line is obtained by FFT of the original interference signal. The solid line is the FFT of the interference signal after the wavelength calibrations. From Figure 9, we could find the effect of wavelength calibration on the system’s PSF. By the definition, the full width half maximum (FWHM) of PSF is the system axial resolution. Therefore, the axial resolution corresponds to the width of the PSF at 6 dB below the peak (1005, 133) in Figure 9. The measured axial resolution is 4.8   μ m . The theoretical axial resolution calculated by Equation (14) is 4.3 μ m (The center wavelength λ 0 of SLD is 850 nm and the bandwidth Δ λ is 75 nm ). Therefore, the measured axial resolution is very close to the theoretical axial resolution.
δ z = 2 l n 2 π × λ 0 2 Δ λ = 2 l n 2 π × 850 2 75 = 4.3   μ m
Subsequently, the lateral resolution calculated from Equation (15) is 13.53 μ m (the focal length f O b j of object lens is 75 mm , the spot diameter d of parallel light is 6 mm ).
δ x = 4 λ 0 f O b j π d = 4 × 850 × 75 π × 6 = 13.53   μ m
Finally, the image depth of homemade SD-OCT system can be defined as the location where the intensity of PSF drops into half (−6 dB). As shown in Figure 10, the imaging depth of the system in air is 1.512 mm . Therefore, the full-range SD-OCT system’s image depth in air is 3.024 mm .

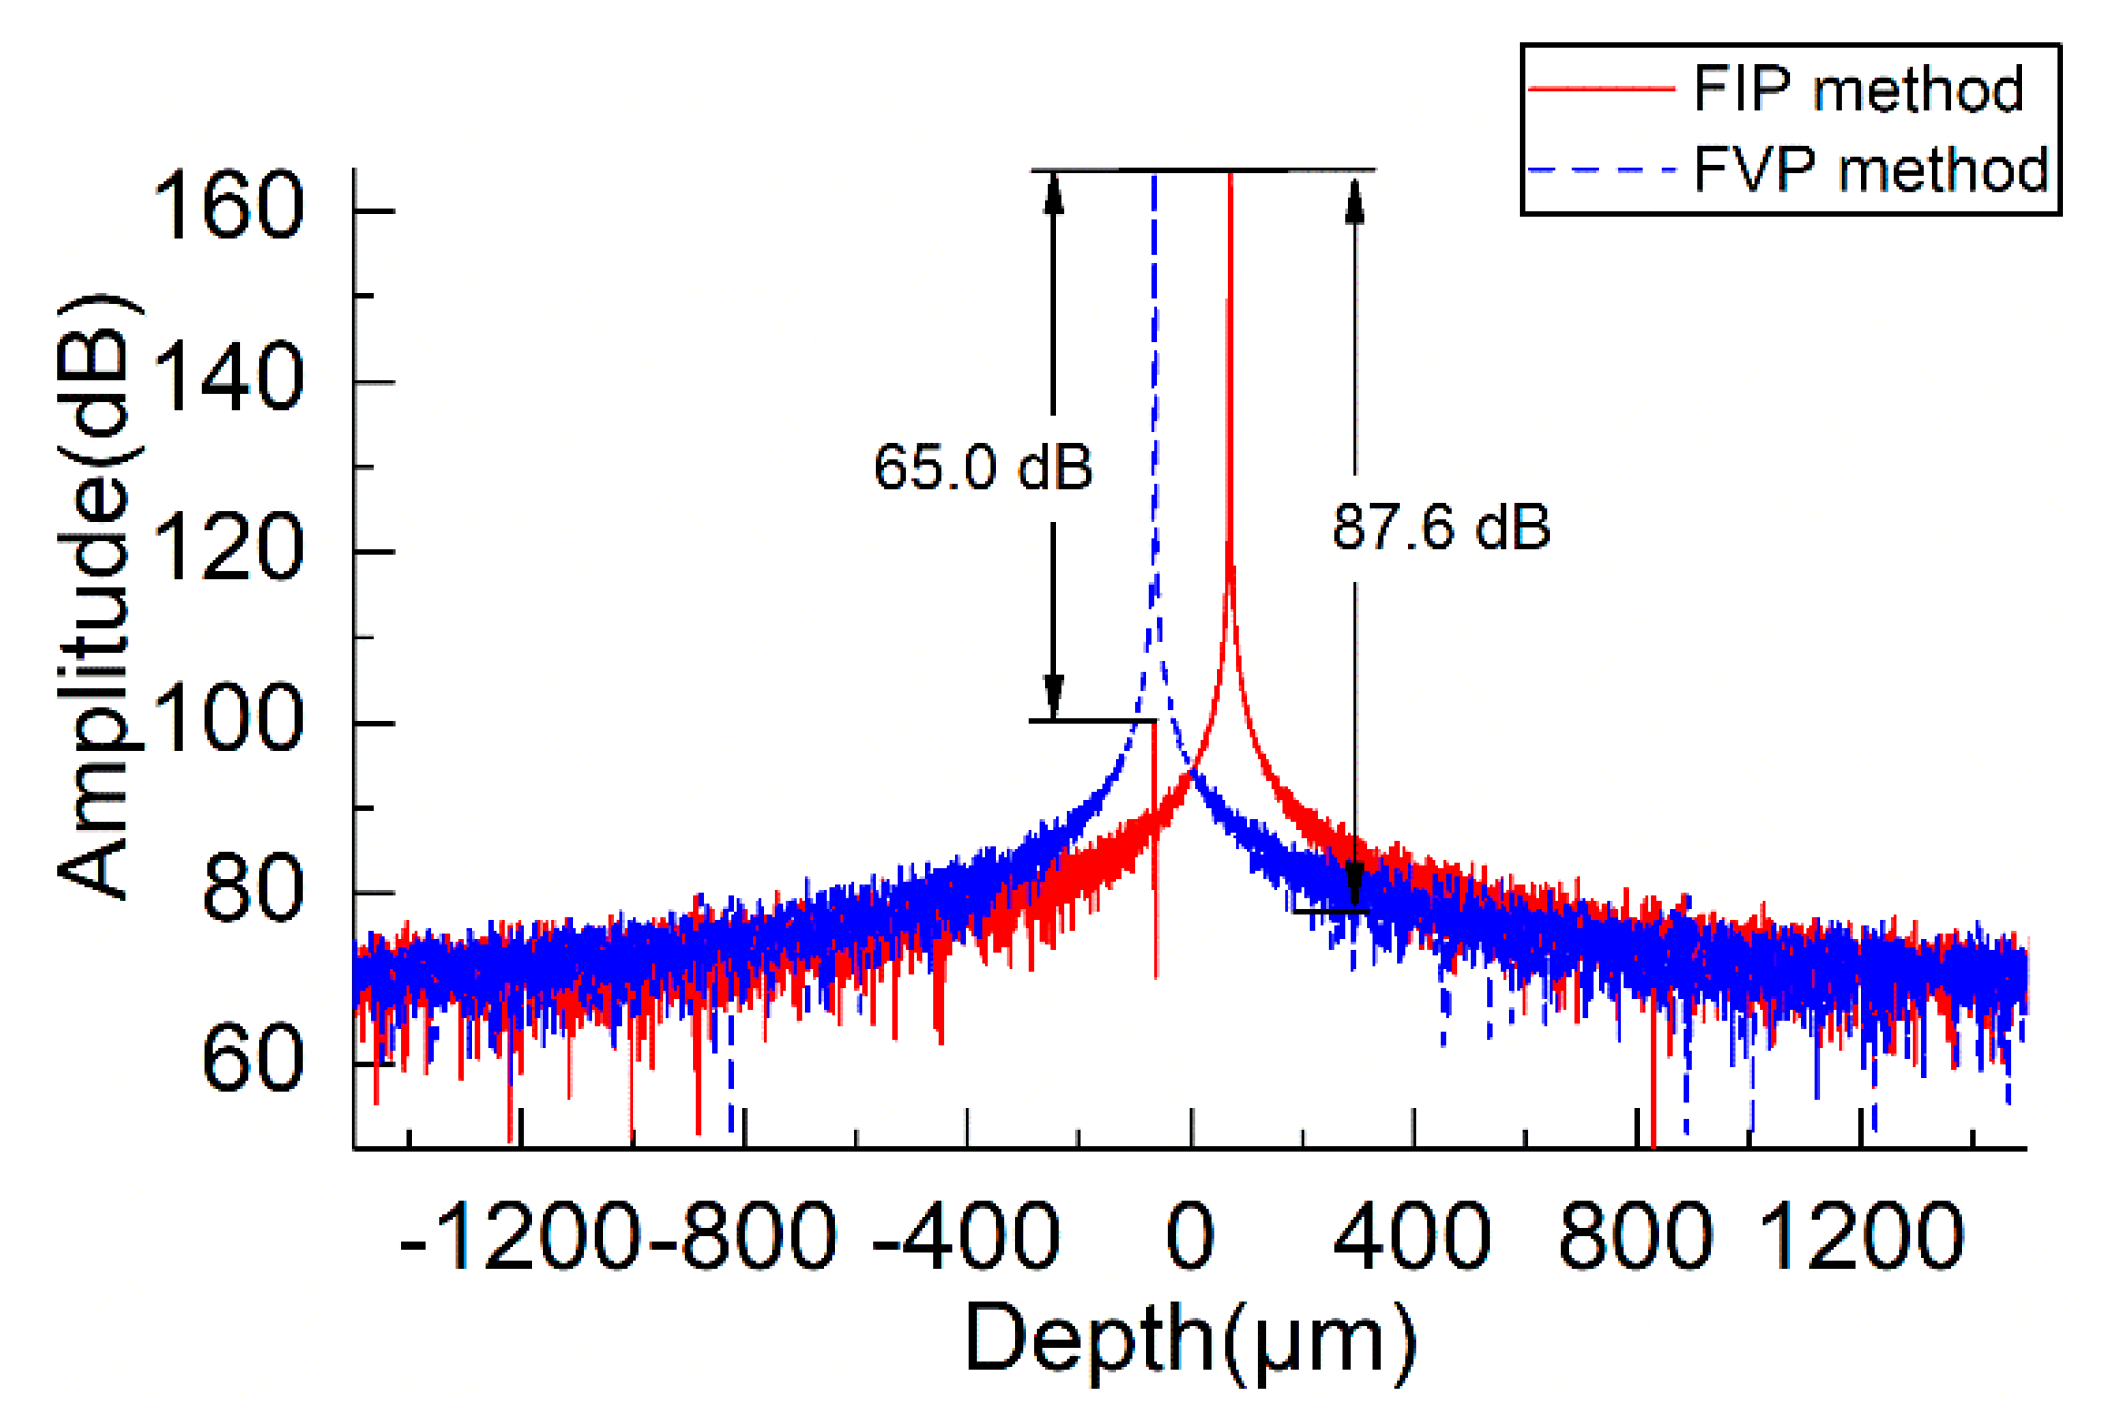
3.2. CCA Suppression Ratio in Experiment

In the experiment, the suppression ratio was obtained by changing applied voltages (0 to 100 V), thereby changing the travel length (0 to 60 μ m ) of the PZT. In order to observe the maximum suppression ratio, a frosted glass was placed in the sample. As shown in Figure 11, the CCA suppression ratio of FIP method is around 46.5 dB and the CCA suppression ratio of FVP method is 51.2 dB . The suppression ratio of FVP method is approximately 4.7 dB higher than that of FIP method. We noticed that the maximum suppression ratio with the FVP method could amplify the CCA suppression ratio of SD-OCT by a factor of 1.7 (20 × log10 (1.7) = 4.7). In addition, in order to verify experimentally the effect of light source bandwidth on CCA suppression, we reduced pixels in the spectral acquisition to calculate the CCA suppressions for different bandwidths of light sources. As shown in Table 1, when the light source bandwidth is 55 nm , the CCA suppression ratio of FVP method is approximately 1.1 dB higher than that of FIP method. The value is 2.4 dB , 3.7 dB , 4.6 dB , and 4.7 dB when the bandwidth is 55 nm , 60 nm , 65 nm , 70 nm , and 75 nm (It is noted here that the bandwidth of our light source is only 75 nm and therefore we cannot go further to 100 nm at this moment). We found that the wider the bandwidth, the bigger the polychromatic error of the FIP method. As discussed earlier, the shortcoming of the FIP method is the effects of polychromatic error.

3.3. Ex Vivo Full-Range Images

Figure 12 shows the full-range spectral domain optical coherence tomography images of the ex vivo anterior segment of a rat eyeball using the FIP and FVP methods. Figure 12a is the cross-sectional image of the anterior segment of the rat eye obtained using the FFT of the original interference signal without FIP or FVP method. Figure 12b is the cross-sectional image of the anterior segment of the rat eye obtained using the FIP method. Figure 12c is the cross-sectional image of the anterior segment of the rat eye obtained using FVP method. Figure 12d is the CCA suppression ratio of FIP and FVP methods at the dashed line in Figure 12b,c. From Figure 12b,c, we found that the rat eyeball’s cornea, lens, and iris could be clearly imaged by using these two methods. However, the CCA suppression ratio of FVP method is slightly better than the FIP one by about 2 dB, as can be seen from Figure 12d. As we know, the wider the bandwidth of light source, the bigger the polychromatic error. Therefore, if the bandwidth is wider, the superiority of FVP method will be more obvious.

4. Conclusions

We proposed a new phase-shifting strategy named five-frame variable phase-shifting (FVP) method to reduce the effects of polychromatic errors. After comparative studies with the traditional FIP and the proposed FVP methods on imaging of an anterior segment of a rat’s eyeball ex vivo, we found that FVP method has a higher CCA suppression ratio than the FIP one. Therefore, FVP provides a new strategy for complex conjugate artifacts suppression for spectral domain optical coherence tomography. However, for our current setup using a 2D CCD camera with 30 FPS, the speed will be a problem for in vivo imaging. However, if a linear CCD camera with 100 k fps (e.g., P4-CM-04K10D-00-R, 100 k FPS, DALSA, Waterloo, Canada) or faster, real-time imaging for our system will be possible. This will be considered as our future work.

Author Contributions

S.Z. conceived and designed the experiments; J.L. performed the experiments; Q.Z. and W.C. analyzed the data; S.Z. and J.L. wrote the paper.

Funding

This research was funded by National Natural Science Foundation of China (51675103), State Key Laboratory of Mechanical System and Vibration (MSV-2018-07), and Shanghai Natural Science Fund (18ZR1414200).

Acknowledgments

This work benefited from discussions with Jianfeng Zhong (Fuzhou University).

Conflicts of Interest

The authors declare no conflict of interest.

References

  1. Wojtkowski, M.; Kowalczyk, A.; Leitgeb, R.; Fercher, A.F. Full range complex spectral optical coherence tomography technique in eye imaging. Opt. Lett. 2002, 27, 1415–1417. [Google Scholar] [CrossRef] [PubMed]
  2. Lawman, S.; Dong, Y.; Williams, B.M.; Romano, V.; Kaye, S.; Harding, S.P.; Willoughby, C.; Shen, Y.-C.; Zheng, Y. High resolution corneal and single pulse imaging with line field spectral domain optical coherence tomography. Opt. Express 2016, 24, 12395–12405. [Google Scholar] [CrossRef] [PubMed]
  3. Zhong, S.; Yan, Y.; Shen, Y. Non-destructive testing of GFRP materials by Fourier-domain infrared optical coherence tomography. In Proceedings of the International Conference on Automatic Control and Artificial Intelligence (ACAI 2012), Xiamen, China, 3–5 March 2012; pp. 1407–1410. [Google Scholar]
  4. Zhong, S.; Shen, Y.-C.; Ho, L.; May, R.K.; Zeitler, J.A.; Evans, M.; Taday, P.F.; Pepper, M.; Rades, T.; Gordon, K.C.; et al. Non-destructive quantification of pharmaceutical tablet coatings using terahertz pulsed imaging and optical coherence tomography. Opt. Lasers Eng. 2011, 49, 361–365. [Google Scholar] [CrossRef] [Green Version]
  5. Fercher, F.; Hitzenberger, C.K.; Kamp, G.; El-Zaiat, S.Y. Measurement of intraocular distances by backscattering spectral interferometry. Opt. Commun. 1995, 117, 43–48. [Google Scholar] [CrossRef]
  6. Vakhtin, A.B.; Peterson, K.A.; Kane, D.J. Resolving the complex conjugate ambiguity in Fourier-domain OCT by harmonic lock-in detection of the spectral interferogram. Opt. Lett. 2006, 31, 1271–1273. [Google Scholar] [CrossRef] [PubMed]
  7. Kim, D.Y.; Werner, J.S.; Zawadzki, R.J. Comparison of phase-shifting techniques for in vivo fullrange, high-speed Fourier-domain optical coherence tomography. J. Biomed. Opt. 2010, 15, 056011. [Google Scholar] [CrossRef] [PubMed]
  8. Ma, Z.-H.; Wang, R.K.; Zhang, F.; Yao, J.-Q. Arbitrary Three-Phase Shifting Method for Achieving Full Range Spectral Optical Coherence Tomography. Chin. Phys. Lett. 2006, 23, 366–369. [Google Scholar]
  9. Peng, B.; Wang, X.; Sasaki, O. Fourier-Domain optical coherence tomography based on sinusoidal phase modulation. Acta Opt. Sin. 2007, 53, 2669–2676. [Google Scholar]
  10. Fechtig, D.J.; Schmoll, T.; Grajciar, B.; Drexler, W.; Leitgeb, R.A. Line-field parallel swept source interferometric imaging at up to 1 MHz. Opt. Lett. 2014, 39, 5333–5336. [Google Scholar] [CrossRef] [PubMed]
  11. Gotzinger, E.; Pircher, M.; Leitgeb, R.A.; Hitzenberger, C.K. High speed full range complex spectral domain optical coherence tomography. Opt. Express 2005, 13, 583–594. [Google Scholar] [CrossRef] [PubMed] [Green Version]
  12. Bradu, A.; Podoleanu, A.G. Attenuation of mirror image and enhancement of the signal-to-noise ratio in a Talbot bands optical coherence tomography system. J. Biomed. Opt. 2011, 16, 076010. [Google Scholar] [CrossRef] [PubMed] [Green Version]
  13. Marques, M.J.; Bradu, A.; Podoleanu, A.G. Towards simultaneous Talbot bands based optical coherence tomography and scanning laser ophthalmoscopy imaging. Biomed. Opt. Express 2014, 5, 1428–1444. [Google Scholar] [CrossRef] [PubMed]
  14. An, L.; Wang, R.K. Use of a scanner to modulate spatial interferograms for in vivo full-range Fourier-domain optical coherence tomography. Opt. Lett. 2007, 32, 3423–3425. [Google Scholar] [CrossRef] [PubMed]
  15. Baumann, B.; Pircher, M.; Götzinger, E.; Hitzenberger, C.K. Full range complex spectral domain optical coherence tomography without additional phase shifters. Opt. Express 2007, 15, 13375–13387. [Google Scholar] [CrossRef] [PubMed]
  16. Jeon, M.; Kim, J.; Jung, U.; Lee, C.; Jung, W.; Boppart, S.A. Full-range k-domain linearization in spectral-domain optical coherence tomography. Appl. Opt. 2011, 50, 1158–1163. [Google Scholar] [CrossRef] [PubMed]
  17. Tong, J.-H.; Zhong, S.-C.; Zhang, Q.-K.; Lin, J.-W.; Fu, X.-B. Spectral calibration of spectrometer based on interference fringes. J. Mech. Electr. Eng. 2017, 34, 856–859. [Google Scholar]
Figure 1. Schematic of full-range spectral domain optical coherence tomography system. SLD Super Luminescent Diode (Exalos), FC Graded Index (GRIN) Fiber Collimator (Thorlabs), Obj Objective Lenses (Thorlabs), BS Cube Beam Splitter (Thorlabs), PZT Piezoelectric Ceramic Transducer (Thorlabs), DAQ Card Data Acquisition Card (NI), PC Personal Computer, Cyl Cylindrical Lens (Thorlabs), Col Collection Lens (Thorlabs), Gra Optical Grating (Thorlabs), CCD CCD camera.
Applsci 08 01580 g001
Figure 2. Interferometric signal generated by a light source with a center wavelength of 850 nm and a bandwidth of 75 nm.
Applsci 08 01580 g002
Figure 3. Fourier transform results. The solid line is for the five-frame invariant phase-shifting (FIP) method and the dashed line is for the five-frame variable phase-shifting (FVP) method.
Applsci 08 01580 g003
Figure 4. The correlation of polychromatic error and bandwidth of light source. The phase shift is 180°, 90°, 0°, −90°, −180°.
Applsci 08 01580 g004
Figure 5. The effect of light source bandwidth on complex conjugate artifacts (CCA) suppression.
Applsci 08 01580 g005
Figure 6. The effect of phase-shifting error on CCA suppression.
Applsci 08 01580 g006
Figure 7. The SNR (Signal-to-Noise Ratio) for different line numbers for averaged interference signal.
Applsci 08 01580 g007
Figure 8. The relation of the wavelengths and the pixels of the spectral domain optical coherence tomography (SD-OCT) system.
Applsci 08 01580 g008
Figure 9. The point spread function (PSF) of SD-OCT system.
Applsci 08 01580 g009
Figure 10. PSF of homemade SD-OCT system at different depths.
Applsci 08 01580 g010
Figure 11. CCA suppression: The solid line is for FIP method, and the dashed line is for FVP method.
Applsci 08 01580 g011
Figure 12. Imaging of the ex vivo anterior segment of rat eyeball. (a) Cross-sectional image of the anterior segment of rat eye obtained using fast Fourier transform (FFT) of the original interference signal without FIP or FVP method. (b) Cross-sectional image of the anterior segment of rat eye obtained using FIP method. (c) Cross-sectional image of the anterior segment of rat eye obtained using FVP method. (d) CCA suppression ratio of FIP and FVP methods at the dashed line in (b,c).
Applsci 08 01580 g012
Table 1. The complex conjugate artifacts (CCA) suppression of different light source bandwidth.
Bandwidth (nm)FIP (dB)FVP (dB)D-Value (dB)
5540.741.81.1
6041.844.22.4
6545.248.93.7
7045.750.34.6
7546.551.24.7
* FVP: five-frame variable phase-shifting method, FIP: five-frame invariant phase-shifting method.

