Article

Evaluation and Optimization of Task-oriented Measurement Uncertainty for Coordinate Measuring Machines Based on Geometrical Product Specifications

1
School of Instrumentation and Optoelectronic Engineering, Beihang University, Beijing 100191, China
2
School of Instrument Science & Opto-electronic Engineering, Hefei University of Technology, Hefei 230009, China
3
Fujian Metrology Institute, Fuzhou 350003, China
*
Author to whom correspondence should be addressed.
Appl. Sci. 2019, 9(1), 6; https://doi.org/10.3390/app9010006
Submission received: 24 September 2018 / Revised: 14 December 2018 / Accepted: 17 December 2018 / Published: 20 December 2018
(This article belongs to the Special Issue Precision Dimensional Measurements)

Abstract

:
Measuring instruments are intended to be intelligent, precise, multi-functional and developing multidirectionally, scientific, and reasonable; the reliable evaluation of measurement uncertainty of precision instruments is also becoming more and more difficult, and the evaluation of the Coordinate Measuring Machines (CMM) measurement uncertainty is among the typical problems. Based on Geometric Product Specification (GPS), this paper has systematically studied the CMM uncertainty for evaluating the size and geometrical errors oriented toward measurement tasks, and thus has realized the rapid and reliable evaluation of the CMM uncertainty for task-oriented measurement. For overestimation of the CMM uncertainty for task-oriented measurements in the initial evaluation, a systematic optimization solution has been proposed. Finally, the feasibility and validity of the evaluation model and the optimization method have been verified by three different types of measurement examples of diameter, flatness and perpendicularity. It is typical and representative to systematically solve the problem of the CMM uncertainty for evaluating the measurement tasks targeted at dimensions and geometric errors, and the research contents can be effectively applied to solve the uncertainty evaluation problems of other precision instruments, which are of great practical significance not only for promoting the combination of modern uncertainty theory and practical applications but also for improving the application values of precision measurement instruments.

1. Introduction

Geometric measurement is the foundation of modern metrology, being the earliest and largest important branch in the field of measurement and also the foundation for the development of modern science and technology. At present, geometric measurement in various fields has developed different types of measurement techniques or instruments and has presented a trend of mutual integration; coordinate measurement technology is undoubtedly among the best [1,2]. Traditional geometric measurement instruments mainly use optical vernier technology to improve the measurement accuracy and resolution based on the measurement mode of geometric theory, so that the geometric quantity cannot be expressed and transmitted digitally, which has been for a long time a difficult technical bottleneck overcome in the field of mechanical manufacturing. In essence, the presence of CMM has solved the problem that geometric measurement cannot be digitalized [3,4]. Coordinate measurement technology is the most common and fundamental measurement technology in the field of modern machinery manufacturing, especially in aerospace, automobile manufacturing, mold processing, and other industries. At present, the whole life cycle of the product development, design, processing, measurement, acceptance, use, maintenance, scrapping and so on must follow the GPS standard system in the field of manufacturing. This standard system covers many aspects such as product size, geometric form and surface appearance. The GPS can effectively eliminate some technical barriers in international trade, boasting an important role in promoting the integration of the global economy as an important technical base for modern manufacturing informatization and quality management. The new generation of the GPS system has overcome the problem of digital representation and transmission of geometric quantities. The traditional measurement mainly relies on optical vernier technology, in which the role of the computer is limited. The development of the CAD technology and the presence of CMM has essentially solved the problem that geometric quantities cannot be expressed and transmitted digitally, which makes it possible to initialize a new generation of the GPS system based on measuring mathematical theory. As a measuring instrument for geometric characteristics of products, CMM plays its role under the guidance of the GPS, boasting important measuring equipment essential to quality control in modern enterprises [5,6].
As an important parameter to characterize the quality of the measurement results, measurement uncertainty reflects the credibility of measurement results. To give scientific and proper evaluation of measurement uncertainty is an important factor to guarantee the development of modern measuring science [7,8]. CMM can complete the measurement of spatial geometric elements (including size, geometrical error parameters) more conveniently, featuring a large measurement range, high measurement efficiency and strong measurement versatility. However, CMM is an omnipotent geometric measurement instrument, so the diversity of its measurement strategies makes the process for evaluating the measurement uncertainty of different measurement tasks quite different from the results; simultaneously there are many error sources affecting CMM measurement uncertainty, and the transitive relationship is difficult to determine between such error sources and measurement results. Therefore, at present, CMM mostly cannot provide reports on the measurement uncertainty during measurement, but usually gives an estimated value of the measured quantity only [9].
Physikalisch-Technische Bundesanstalt (PTB), Germany, National Physical Laboratory (NPL), Britain, Istituto di Metrologia “G. Colonnetti” (IMGC), Italy, and other institutions have taken the CMM measurement uncertainty evaluation as an important research direction. PTB has proposed an expert system scheme for evaluating the uncertainty of a coordinate measuring machine and has researched the influence of the measurement strategy on the CMM uncertainty [10,11]. NPL has standardized the CMM measurement strategy so as to obtain accurate measurement results [12]. IMGC has carried out the research on evaluating the uncertainty of the task-oriented coordinate measuring machine by using computer simulation technology [13]. J. Sładek et al. have proposed an evaluation method of coordinate measurement uncertainty with the use of a virtual machine model based on the Monte Carlo method [14]. W. Jakubiec et al. have discussed the problem of evaluating the CMM measurement uncertainty by Type-B methods and carried out relevant research on CMM uncertainty evaluation based on the GPS specifications [15,16]. P.B. Dhanish et al. have studied the influence of coordinate point selection on the uncertainty of the CMM measurement “circle” [17].; J. Beaman and E. Morse have studied the uncertainty evaluation of the CMM-specific measurement tasks [18]. J. Feng et al. have studied the experimental problem of CMM uncertainty evaluation [19]. J.P. Kruth et al. have studied how to evaluate the uncertainty of the CMM shape measurement tasks based on the Monte Carlo method [20]. F. Aggogeri et al. have designed a simplified process for evaluating the CMM uncertainty by means of simulation experiments [21]. G.X. Zhang proposed a CMM error modeling method based on rigid body models and developed in-depth research on error identification and compensation [22]. R.G. Wilhelm et al. considered task-specific uncertainty as the measurement uncertainty associated with the measurement of a specific feature using a specific measurement plan [23]. H. Haitjiema has discussed task-specific uncertainty estimation in dimensional metrology, and these principles can be used as well for e.g., roughness, roundness, cylindricity, flatness, and CMM measurements [24]. K. Takamasu et al. has formulated methods of estimating uncertainties using the coordinate measuring system after calibration [25].
So far, the CMM task-oriented research has been carried out earlier, focusing on the uncertainty evaluation of specific measurement tasks in practical applications, however, there have been few research results on evaluating the uncertainty of the CMM system-wide measurement tasks targeting sizes and geometric errors, and most of such results have only involved individual aspects of the ISO15530 standards [26,27]. The intelligent evaluation of the CMM measurement uncertainty by virtue of computer simulation technology is an important trend of development in the future; it is especially worth discussing how to combine the virtual measurement technology with uncertainty evaluation, but the software for uncertainty evaluation has had its practical applications limited due to involvement in intellectual property rights. With the increasing improvement of the research on coordinate measurement technology, more theories and methods for CMM measurement uncertainty have been put forward continuously, the ISO15530 series of standards have been gradually formed for evaluating the CMM task-oriented measurement uncertainty and a variety of task-oriented uncertainty evaluation methods have been put forward, such as the strategy of applying repeated measurement, method of alternative measurement, computer simulation and expert analytical judgment. However, the GPS standard system still has a lot of standards to be added and still there is no content of the uncertainty evaluation model.
The simplicity, practicability and economic efficiency is very important in practical applications for evaluating the CMM measurement uncertainty. Within the framework of the GPS standard system [26,27,28,29], it is of great significance for improving the application value of the measuring instrument by studying the CMM uncertainty evaluation of task-oriented measurement for quickly and reliably evaluating the uncertainty of the measurement results.

2. Evaluation Method

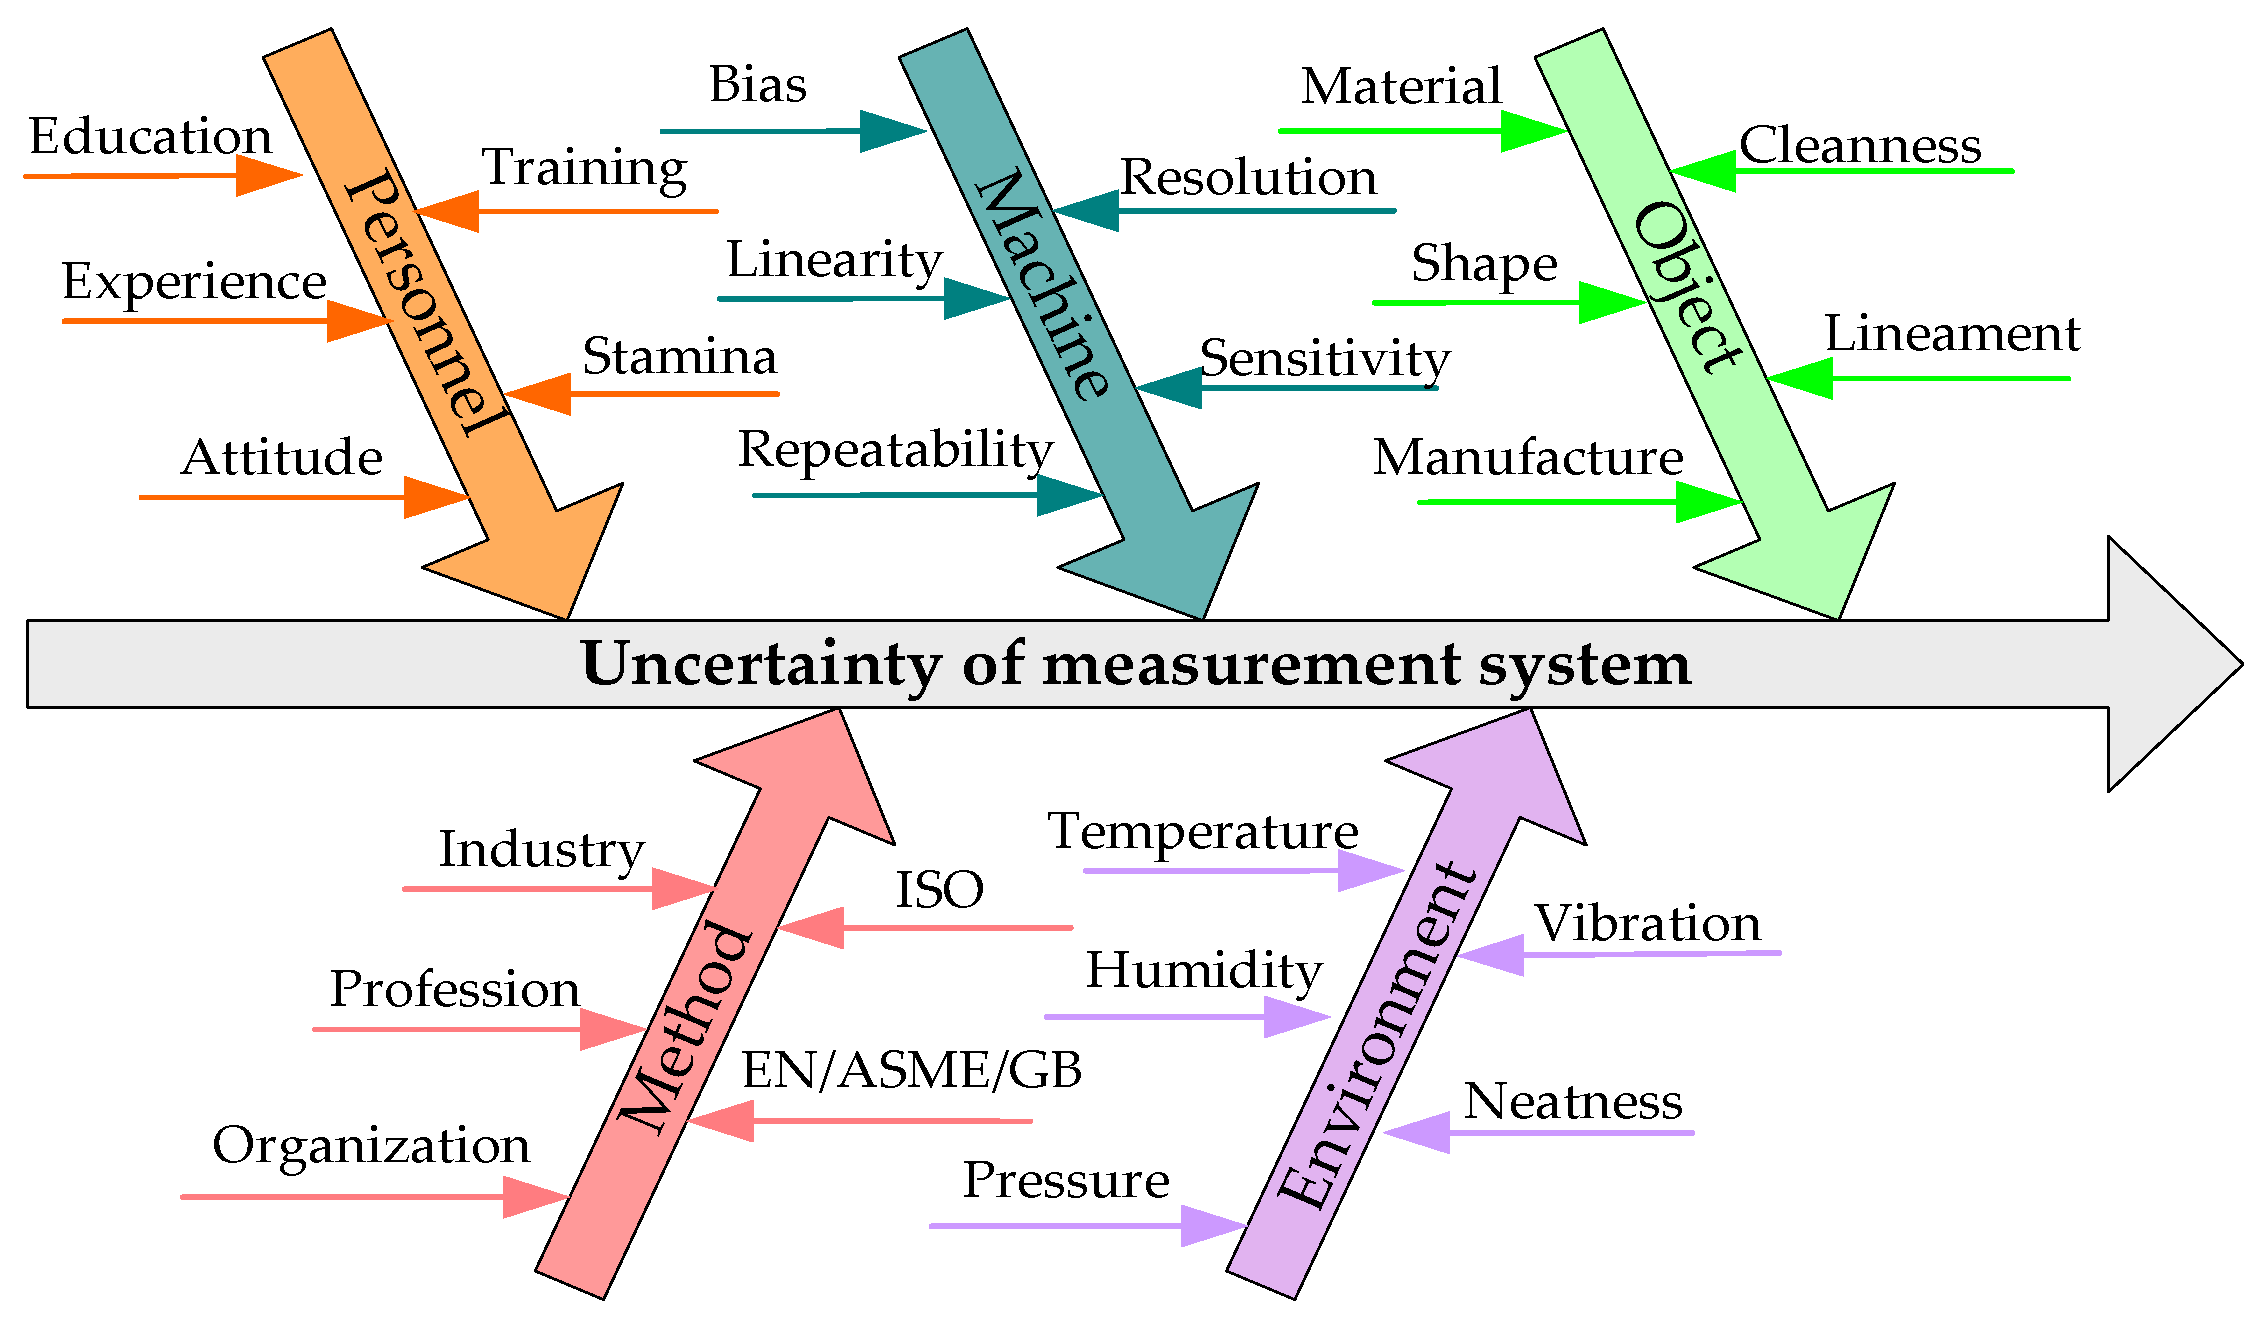
2.1. Source Analysis of Uncertainty

During CMM measurement, all relevant factors may have an impact on the measurement results. The sources of uncertainty in the coordinate measuring system can be divided into five categories according to the analysis method of “personnel, machine, object, method and environment” commonly used in product quality management as shown in Figure 1: Uncertainty caused by CMM instrument’s own errors, measured workpiece, surveyors, measuring method, and external environment.
(1) Uncertainty caused by surveyors
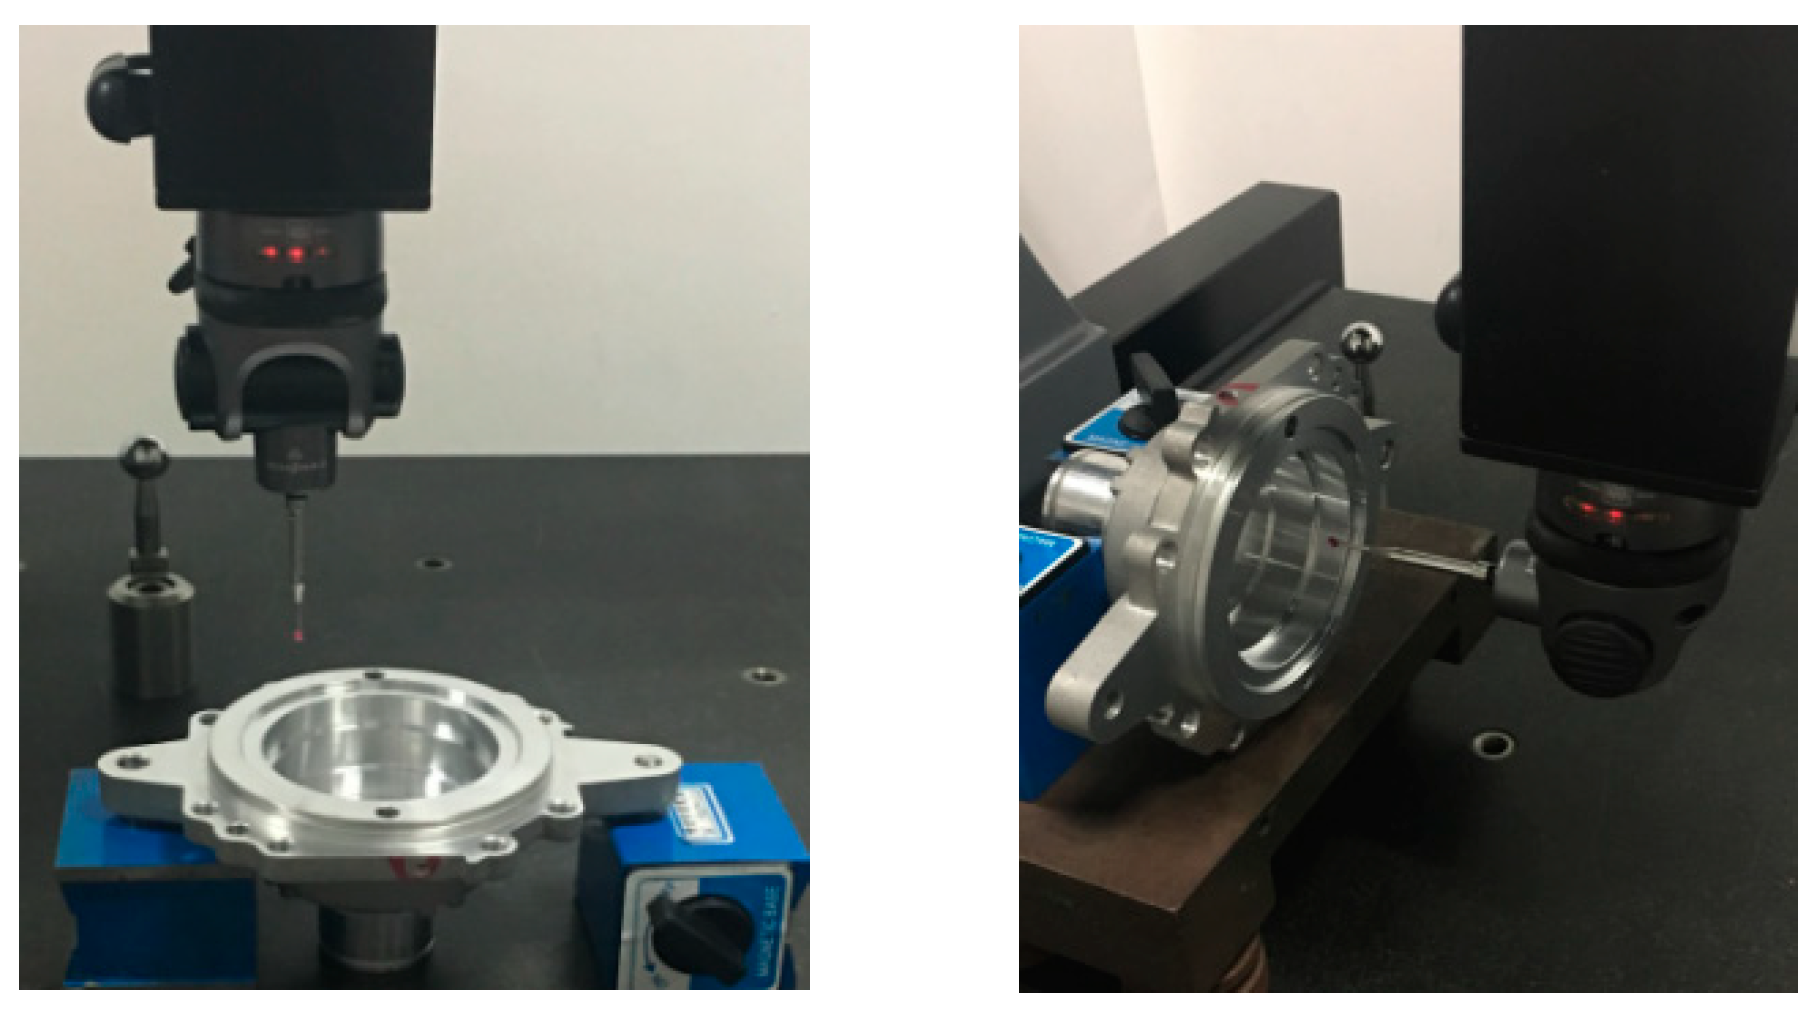
In addition to professional qualities, the uncertainty caused by surveyors is mainly characterized by the differences of the measurement strategies caused by different understandings of the measurement specifications, such as clamping positioning, coordinate system establishment, sampling strategy, and probe configuration.
(2) Uncertainty caused by the instrumental errors
This refers to the uncertainty component produced by the deviation of the CMM’s own metering characteristics from the ideal characteristics, including the uncertainty caused by design, standard quantity, detection system, dynamic characteristics, fitting and evaluation algorithm, and other factors, mainly including the impacts of 21 items of CMM mechanism errors and probe system errors, etc. on the measurement results [30]. Usually, CMM can correct 21 items of mechanism errors and calibrate the probe system. The CMM’s own errors are reflected in the influence of residual system errors after correction and calibration.
To ensure that the CMM measurement accuracy meets the relevant requirements, it is usually necessary to carry out acceptance and re-inspection testing of the CMM measuring characteristics by means of the measurement calibration programs. In the GPS ISO10360 series standards [26,27], the CMM performance evaluation has been defined and relevant performance parameters and evaluation methods of the measuring instrument have been given, such as the indication, detection and scanning detection errors of the dimensional measurement as well as the dimensional and geometrical errors of the universal detection system. The technical parameters corresponding to the above-mentioned performance parameters are generally given before CMM is delivered, that is, the maximum permissible errors. In practical measurement, the Maximum Permissible Indication Error (EL, MPE) is mainly related to the errors of the distance and other dimensional elements, and the MPEP indicates the error of the whole measurement system in a very small test space, generally affecting the form measurement.
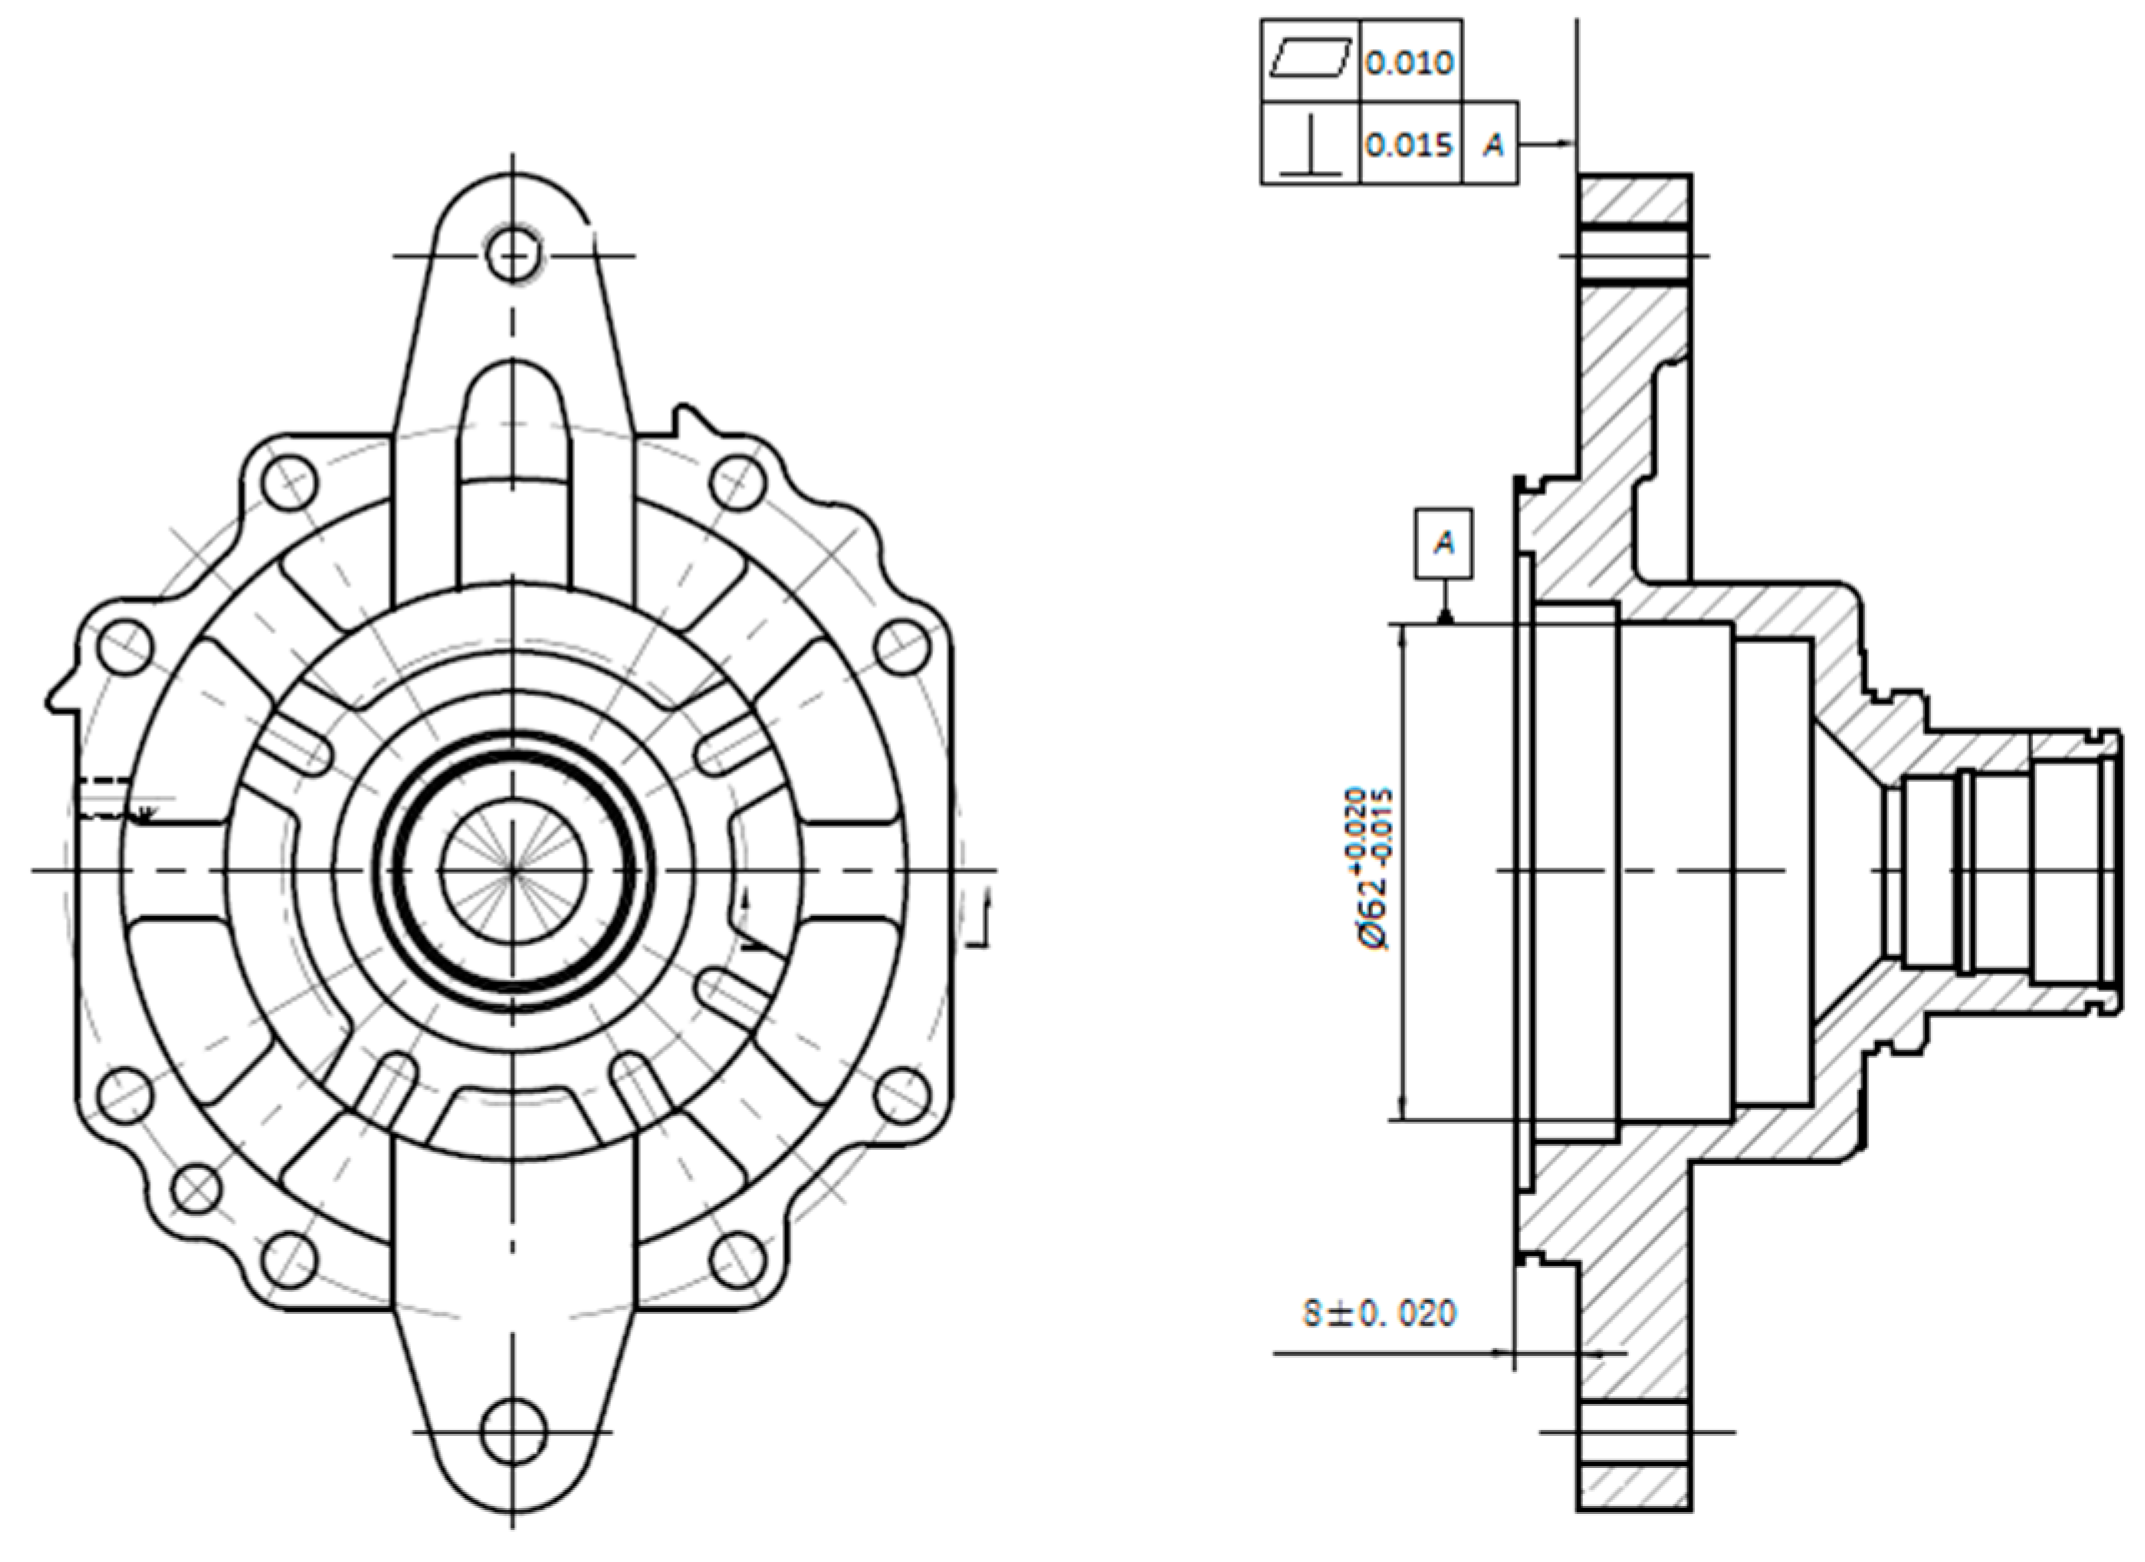
(3) Uncertainty caused by measured workpiece
The geometric and physical characteristics of the workpiece itself will affect the measurement results, for example, the form, surface waviness and surface roughness of the measured elements have impacts on the measurement results together with the sampling strategy and probe configurations; the thermal expansion coefficient of the workpiece and its changes produce uncertainty in the temperature compensation; the force deformation is also affected by the workpiece positioning and clamping mode. Therefore, it is necessary to combine the specific measurement tasks to evaluate the uncertainty introduced by the measured workpiece.
(4) Uncertainty caused by measurement methods
In the actual measurement, measurement specifications only give general guidance and constraints for the measurement process, resulting in a certain degree of randomness in measurement methods. If currently there are no standards or specifications to clearly and meticulously stipulate the choice of the CMM sampling strategy and probe configurations, different sampling strategies and probe configurations will result in inconsistency of the measurement results.
(5) Uncertainty caused by environmental factors
The temperature, humidity, temperature spatial and temporal gradient, vibration, dust, and other environmental factors may have impacts on the measurement results. During CMM dimensional measurement, temperature compensation is usually needed. If the temperature changes, the CMM grating ruler and workpiece thermal expansion coefficient will all cause uncertainty through the process of temperature compensation.
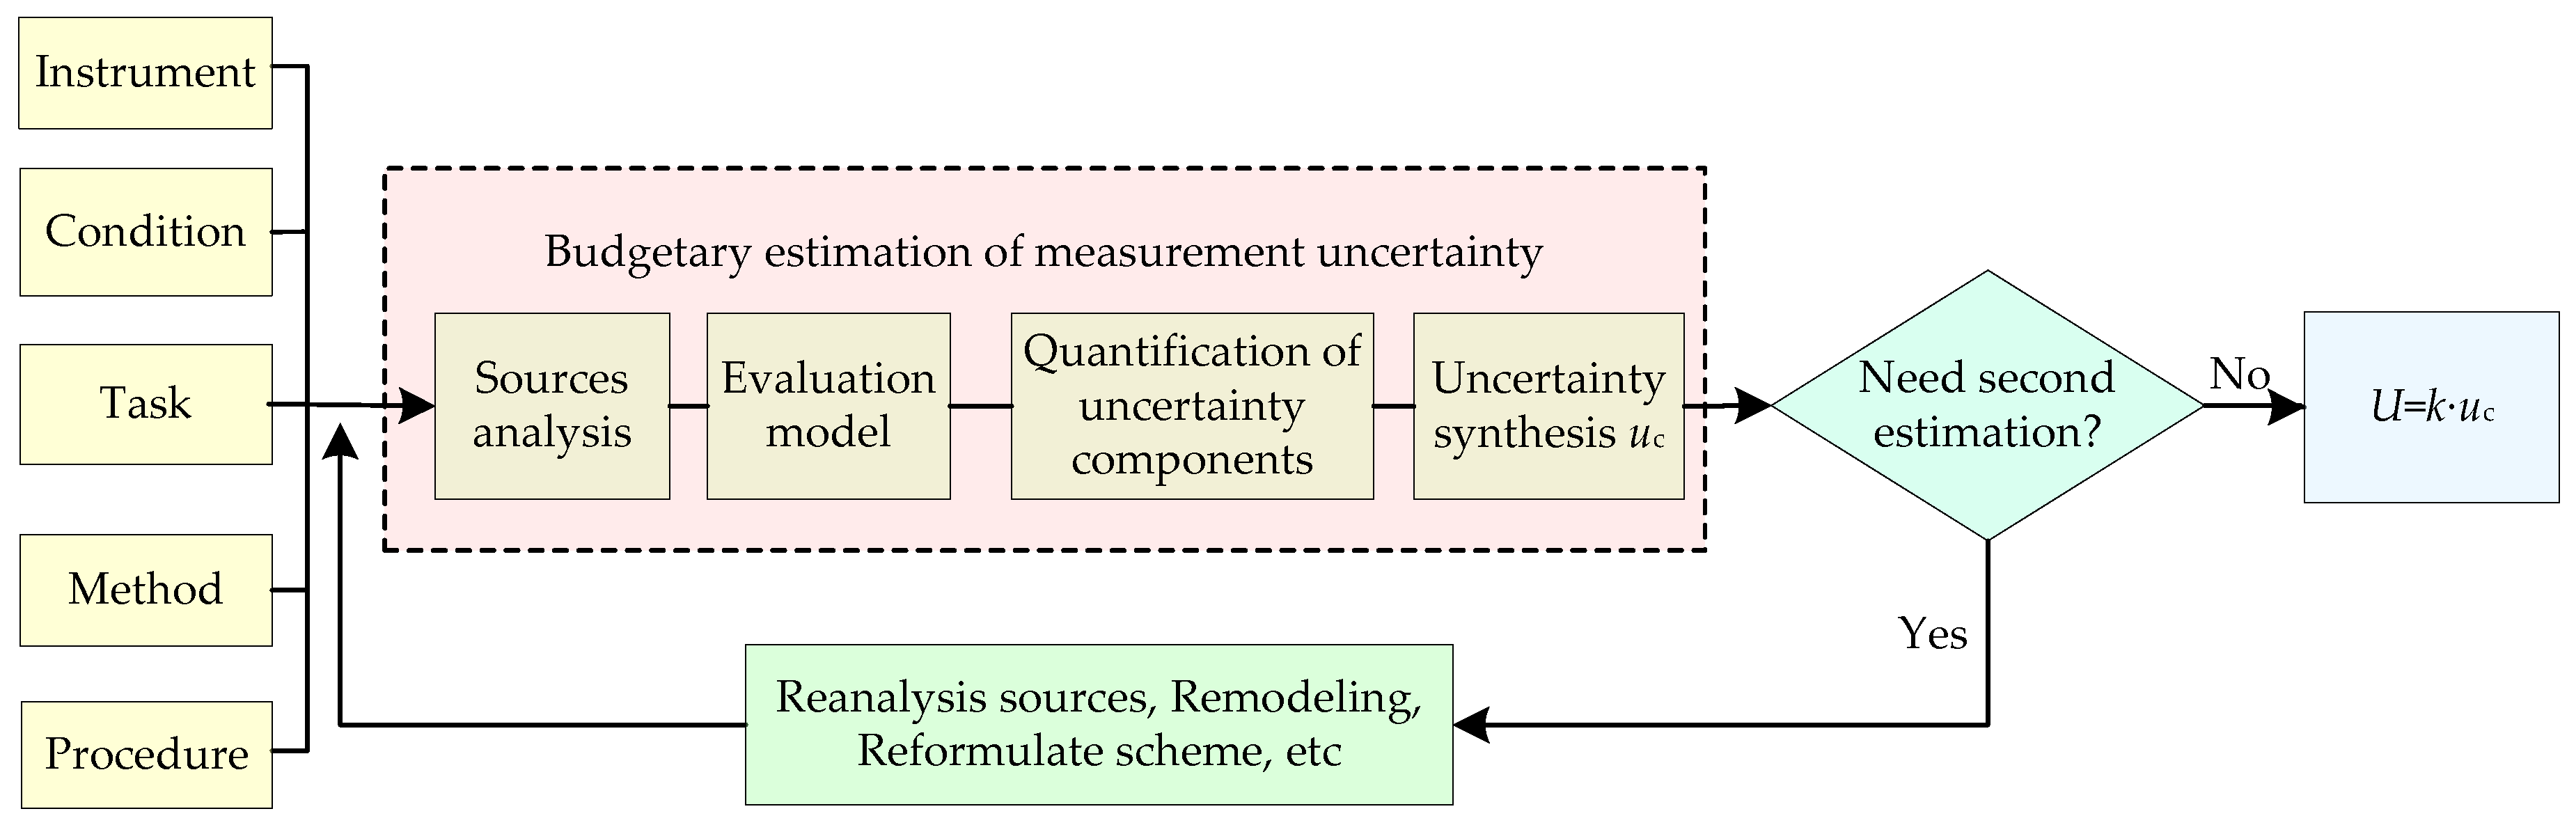
The evaluation of measurement uncertainty should consider all factors that may affect the measurement results and focus on the specific measurement tasks. Based on the above analysis, it can be concluded that the sources of CMM task-oriented measurement uncertainty have the following characteristics: Wide sources and rich types, interconnection between sources of uncertainty, difficulty in quantifying sources of uncertainty and close correlation between sources of uncertainty and measurement tasks. Because of the complexity and quantification difficulty of the sources of uncertainty, it is a key problem to establish an uncertainty evaluation model which can fully reflect the influence of the sources of uncertainty and their relationship on the measurement results.

2.2. Uncertainty Evaluation Model

The quantitative statistical analysis method can carry out direct statistics and analysis of the measurement results; the output and input quantities have identical units and the measurement results can be obtained without relying on any other quantity subject to a functional relationship with the quantity being measured; therefore, compared with the error traceability method, it features a simple transfer relation for uncertainty, it has convenient model use and it has richer adaptability to the requirements of simplicity, rapidness and practicability for task-oriented measurement uncertainty. However, disadvantageously, the quantitative statistical analysis method cannot clearly grasp the law of uncertainty transmission and may cause the consequence of “excessive estimation” of uncertainty components. Moreover, due to the complexity of error sources, it is difficult for general surveyors to ensure that no uncertainty source is repeated or missed in the analysis of error sources. The most obvious problem is that currently most of the relevant researches based on error traceability use indication errors to quantize individual points in the CMM space, and the indication errors essentially limit the measurement results, so the quantification of uncertainty in single point measurement is in itself characterized by the problem of "over estimation". The measurement system analysis method widely used in product quality management has summarized the characteristic indexes of the measurement of the whole measurement system as resolving power, bias, linearity, stability, repeatability, and reproducibility, which can comprehensively reflect the impact of uncertain system and random errors of the measurement system on the measurement results; the uncertainty modeling method based on statistics and analysis of the measurement characteristics has given the guiding ideology for evaluating the CMM task-oriented measurement uncertainty from the top design.
The measurement task of dimensional and geometrical errors mainly includes two essential problems, namely, how to extract the actual elements and how to evaluate the ideal elements. The former determines the detection method while the latter depends on the evaluation method. The new generation of uncertainty evaluation theory has summarized the uncertainty caused by the evaluation method into the category of "normative uncertainty". Therefore, the influence of the method for ideal element evaluation is not considered in the evaluation of "measurement uncertainty", which is particularly important for evaluating the measurement uncertainty of geometrical errors [31]. Thus, the sources of the CMM task-oriented uncertainty can be analyzed as follows:
(1) Uncertainty components caused by bias and linearity
The influence of bias and linearity on the CMM measurement results is reflected in the uncertainty component u E caused by the indication or detection errors of the measuring instrument. For the purpose of safety, the “overestimation” should be adopted, with the CMM E L ,   MPE and MPE P used to quantize u E . In calibration, the CMM indication or detection errors have considered the influence of such factors as probe configurations of the measuring instrument, method for coordinate system establishment, measuring object clamping, space position and environment. Therefore, when E L ,   MPE and MPE P are used to quantize u E , the influence of the above uncertainty sources is also included.
(2) Uncertainty components caused by resolution and repeatability
There is a certain correlation between the resolution and repeatability of the instrument, so CMM only needs to consider the uncertainty component u r caused by repeatability.
(3) Uncertainty components caused by stability and reproducibility
The stability index usually has a significant influence on the electronic measuring instruments but less on the CMM geometric measurement; the stability is equivalent to the reproducibility caused by time variation, so this uncertainty component can be ignored.
The uncertainty component u R caused by CMM task-oriented reproducibility indicates the consistency between the measurement results of the same measuring object when the measurement conditions are changed, that is, different measurement conditions such as personnel changes and different measurement strategies have led to the variations of the measurement mean value for the same measurement task. In the actual uncertainty component quantization, the repeatability experiment is used to determine the influence of the component. For CMM, multiple groups of repeatability quantization experiments are completed by different surveyors according to the sampling strategy with the measuring points determining themselves based on the habits for measurement.
Therein, the uncertainty component caused by sampling strategy is affected by the number and distribution of the sampling points. Sampling point distribution determines the probability of extracting the extreme error point of the errors for measured elements when the number of sampling points is the same. It has become a consensus in CMM applications that minimal measurement uncertainty occurs when the sampling points are evenly distributed. The number of sampling points reflects the CMM ability to extract the form information of the measured elements. When there is a small number of sampling points, the measuring points will have a higher probability of excluding the extreme point of the form tolerance. From the point of view of information extraction only, the larger the number of sampling points, the better. However, the measurement time similar to contact triggered CMM will increase sharply as the number of sampling points increases, which has violated the CMM characteristics of measurement efficiency. At the same time, the excessive increase of the number of measuring points will multiply the impact of the CMM residual mechanism errors on the measurement results. Generally, for contact triggered CMM, the suitable number and preferable distribution of sampling points can be confirmed according to BS7172 [12]. As the evaluation software requires, the number of measurement points just needs to be greater than the minimum number of the points required by the mathematical requirements of the geometric elements to be measured.
Therefore, the primary model is as follows for evaluating the CMM task-oriented uncertainty based on the method for statistical analysis of measurement characteristics:
u c = f ( u E , u r , u R )
Formula (1) shows three inputs, namely, the maximum permissible error δ E , measurement repeatability δ r and measurement reproducibility δ R of the instrument. The expected values are 0 for all inputs and all are the measurement characteristics of the measurement task output Y . y is the measurement estimated value of Y. Therefore, the analysis model is as follows for measurement uncertainty:
Y = y + δ E + δ r + δ R
Based on the Guide to the expression of uncertainty in measurement (GUM) [32], Formula (1) can be written as:
u u c u E 2 + u r 2 + u R 2

3. Modeling for Typical Task Uncertainty Evaluation

3.1. Uncertainty Model for Dimensional Measurement Task

The CMM dimensional measurement tasks mainly include distance, diameter, radius and so on. In time of CMM acceptance and reexamination, EL,MPE is used to express the CMM ability for dimensional measurement. Therefore, the uncertainty component u E caused by the bias and linearity of the CMM dimensional measurement tasks is as follows:
u E = E L , MPE 3
Under the same conditions, measure the target workpiece repeatedly and calculate the laboratory standard deviation of a single measurement via Bessel formula:
S = 1 n 1 i = 1 n ( y i y ¯ ) 2
Where, n indicates the number of repeated measurements, y i is the measured value of the ith measurement and y ¯ is the average value of the repeated measurement column.
If N times’ measurement mean is taken as the best estimation, the uncertainty component u r caused by measurement repeatability is as follows:
u r = S N = 1 N ( n 1 ) i = 1 n ( y i y ¯ ) 2
Several different surveyors can determine the measurement strategy and probe configurations according to their own habits for measurement, carry out m groups of independent measurements repeatedly of the dimensional parameters of the workpiece under test, and set the average value of Group j repeated measurement column as y ¯ j . Then, regard the mean value y ¯ j of the column consisting of m groups of measurements as a measurement column, work out the mean value y ¯ ¯ of the measurement column; the uncertainty component u R caused by the reproducibility is as follows:
u R = 1 ( m 1 ) j = 1 m ( y ¯ j y ¯ ¯ ) 2
Based on the above analysis, the universal model as follows can be achieved for evaluating the uncertainty of the CMM dimensional measurement tasks according to Formula (3):
u u c E L ,   MPE 2 3 + 1 N ( n 1 ) i = 1 n ( y i y ¯ ) 2 + 1 ( m 1 ) j = 1 m ( y ¯ j y ¯ ¯ ) 2

3.2. Uncertainty Model for Form Error Measurement Task

The form error is defined as the variation of the measured actual shape elements relative to the ideal shape elements [33]. Form measurement is not the specialty of the CMM measurement function unless there is a commitment in the measurement time. Compared with roundness meters, autocollimators, level meters and other special form tolerance instruments, CMM is slightly inferior in measurement accuracy, but its functional diversity can significantly improve the comprehensive efficiency of measurement. Therefore, CMM, when selected for form measurement, should be compatible with the competence of the measuring instrument, that is, the elements to be measured should be the task "measurable" by CMM when normal measurement conditions are satisfied, and the requirements for detection efficiency should be fully considered when sampling strategy is selected.
Different from dimensional measurement tasks, the form measurement belongs to miniature measurement and is comparatively sensitive to “overestimation” in time of uncertainty evaluation. Dimensions are characterized by the measurement of absolute values, but form error are considering relative changes in a very small test space. In the analysis of indication errors, linear impacts can be ignored, just focusing on the bias of the form measurement indications caused by residual system errors of the measuring instrument. The CMM ability for form detection is represented by MPEP and is calibrated by the sphericity of the standard ball, which essentially reflects the comprehensive impact of the residual system errors on the form measurement results in different directions and at different positions. It is more reliable for using MPEP to evaluate the uncertainty component caused by the indication errors of the CMM form error measurement; the formula for qualification is as follows:
u E = MPE P 3
Similarly, the uncertainty components caused by repeatability and reproducibility can be obtained according to Formula (6) and Formula (7). According to formula (3), the universal model as follows can be achieved for evaluating the uncertainty of the CMM form measurement tasks according to Formula (3):
u u c MPE P 2 3 + 1 N ( n 1 ) i = 1 n ( y i y ¯ ) 2 + 1 ( m 1 ) j = 1 m ( y ¯ j y ¯ ¯ ) 2

3.3. Uncertainty Model for Location and Orientation Errors Measurement Tasks

The location and orientation errors show the positional relationship between two or more geometric elements, i.e. the relationship between the measured elements and the reference elements. It is defined as the variation of the measured actual elements to the ideal elements with certain direction or location, able to be divided into orientation error and location error [33].
The form and position errors are both variations between the actual and ideal elements, but the methods are different for evaluation. Form measurement does not require reference elements. By sampling on the surface of the workpiece to be measured, enough sampling points of the measured elements can be obtained. Computer software can be used to fit lines, planes, circles or cylinders, and calculate the maximum variation from sampling points to fitting elements as the value of the current form error. However, the location and orientation errors are the positional relationship between two elements. It is necessary to measure the two elements, work out one fitting element as a benchmark and calculate the maximum variation from the other element to the benchmark as the measurement value of the current position error. In the principle of measurement, it is basically the same as the dimensional measurement, so the location and orientation error measurement can be concluded as miniature dimensional measurements. While evaluating the uncertainty of the CMM location and orientation tolerances measurement task, EL, MPE=A+B·L may be used to represent the influence of its indication error. However, the location and orientation errors are still greatly different from dimensional measurement due to the impacts of the instrument offset and linearity; different types of position errors are differently affected by the offset and linearity of the measuring instrument. Here follows the analysis and discussion of the uncertainty components for position errors caused by the indication errors of the measuring instrument.
CMM parallelism measurement task: First measure the reference plane, fit out its plane formula, then sample a characteristic point on the measured plane, calculate the longest distance l max and the shortest distance l min from the sampling point to the reference fitting plane, and the maximum distance difference is the parallelism tolerance t between the two planes:
t = l max l min
Where, the influence of the indication errors is both MPE E for the longest distance l max and the shortest distance l min , then
t = ( l max ± E L ,   MPE ) ( l min ± E L ,   MPE )
Fully consider the influence of EL, MPE and the error range of the overestimated parallelism tolerance t to get:
t = ( l max l min ) ± 2 E L ,   MPE
If it is given that the composite distribution of two identical uniform distributions is a triangular distribution, the uncertainty component u EW 1 of the CMM parallelism measurement task caused by the indication error is as follows according to type B evaluation method [32]:
u EW 1 = 2 E L ,   MPE 6
The tolerance zone of angularity and perpendicularity is the range defined by two parallel planes whose spacing is equal to the tolerance value t. Both indicate the degree to which the measured element maintains a certain angle relative to the reference element. The difference is that the two parallel planes of angularity incline to the reference at a given theoretical angle (excluding 0°, 90° and 180°) and such two parallel planes are vertical (or parallel) to the reference. When measuring the angularity and perpendicularity, CMM will determine the fitting element (direction) according to the reference element and theoretical angle and calculate the difference of the limit distance t = L 1 L 2 between the measured elements and the fitting elements. Therein, L1 and L2 indicate the distances from the measured elements to the fitting elements.
Relative to the dimensional measurement, L1 and L2 both are miniature dimensions, not considering the influence of linearity but only the constant term of the measuring instrument deviation. The uncertainty u EW 2 of angularity and perpendicularity measurement tasks caused by the indication errors is as follows according to uncertainty type B evaluation method:
u EW 2 = 2 A 6
Where, A is the constant term of EL, MPE=A+B·L.
The position degrees can be divided into point, line and plane position degrees. The position degree is essentially two times the maximum distance between extracted elements (point, line and plane) and fitting elements (determined by reference elements and theoretical size), that is, the micro-level dimensional measurement, which can neglect the influence of dimension sizes and only consider the constant term of the deviation.
Similarly, coaxiality represents the maximum distance from the point of the measured element to the reference element (point or line) and is essentially a micro-level dimensional measurement. The indication error also only considers the constant term of the deviation.
The uncertainty component u EW 3 of the CMM position degree and coaxiality measurement tasks caused by the indication errors is as follows according to the uncertainty type B evaluation method:
u EW 3 = A 3
Symmetry is essentially two times the maximum difference between the two extracted elements to be measured and the reference vertical distance, namely, t = 2 ( L 1 L 2 ) . Essentially, it is the difference of the micro-level dimensions and the indication error only considers the constant term of the deviation. Then, the uncertainty component u EW 4 caused by the indication error is as follows for CMM symmetry measurement task:
u EW 4 = 2 A 6
Similarly, the uncertainty components caused by repeatability and reproducibility of position error measurements are Formula (6) and Formula (7). Substitute Formula (14)–Formula (17) into Formula (3) and a universal model can be obtained for evaluating the uncertainty of the CMM position measurement tasks.

4. Method for Optimizing Measurement Uncertainty

4.1. Secondary Optimal Evaluation of Uncertainty Components

The uncertainty component features "overestimation" in time of quantization, which is the possible upper bound of the uncertainty component under worse conditions to ensure the safety and reliability of the evaluation results. Referring to the new generation of GPS uncertainty evaluation theory, develop an uncertainty management program as shown in Figure 2 for a given task-oriented measurement process [34]. In this management program, the measurement tasks, conditions and methods, etc. as well as relevant matters related to the measurement process are given, so its core task is to optimize the estimation of the measurement uncertainty.
From the initial evaluation of the measurement uncertainty, we can find the dominant contribution factors to uncertainty, redesign the scheme for quantization of the dominant uncertainty component, make it more close to the actual situation of the uncertainty component and avoid the influence of excessive estimation. However, such an uncertainty component will somewhat increase the measurement time and economic costs during secondary optimal evaluation, and the surveyors should make corresponding improvements according to their own measurement needs. The optimal evaluation of the uncertainty components described in this section mainly cover the uncertainty components introduced by indication errors and reproducibility.
The uncertainty component caused by the indication errors as described in Section 3 is estimated according to the CMM maximum permissible error, i.e. the error limit. During secondary evaluation, physical standards similar to the object under test or calibrated workpiece can be adopted to calibrate the indication errors and thus to obtain a more accurate upper bound estimation of the indication error. See Table 1 for CMM EL = 60, MPE and MPEP calibration results by using standard gauge blocks and master balls with calibration uncertainty able to be neglected. It is shown that the uncertainty component introduced by the indication errors after secondary evaluation has been significantly reduced compared with the initial evaluation.
The uncertainty component caused by reproducibility depends on the operation difference of the surveyor. The greater uncertainty component of reproducibility indicates that the operation of the surveyor has a significant impact on the measurement results, and a more normalized and standardized measurement program file should be formulated to reasonably reduce the impacts on the evaluation results of reproducibility. For example, the secondary evaluation of the uncertainty component introduced by sampling strategy: When more prior information of the measurement task is available, reasonably and properly reduce the change range of sampling points; use spectral analysis to determine the best sampling strategy and estimate the changes of the measurement results from the difference between the actual measurement points and the optimal sampling points to evaluate the uncertainty caused by the sampling strategy. When the number of optimal sampling points is known, the influence of uncertainty introduced by this factor can be ignored.

4.2. Real-Time Updating of Repeatability Uncertainty Component

The method of calculating uncertainty by means of statistical analysis based on experimental data is called the type A evaluation method [32]. The uncertainty components introduced by repeatability are usually obtained by experimental pre-evaluation and determined only by one experiment, so the information contained in the results is limited and poor in representativeness; moreover, the working states of instruments and workpiece may change with time during the experiment, so the uncertainty component determined by one evaluation experiment cannot reflect the latest information in the evaluation process.
If the uncertainty component caused by repeatability is not changed after evaluation, the evaluation results of the uncertainty will not sufficiently reflect the latest information in the process of measurement. For the measurement of the same batch of workpieces with the same machining accuracy, the cost is rather high for repetitive experiments of each workpiece respectively, so it is impossible to carry out a large number of uncertainty evaluation experiments at any time for batch products. If the uncertainty components caused by repeatability can be updated continuously in real time based on daily measurement data, then the current and historical information can be fully integrated into the uncertainty evaluation results and the latest status of the CMM same or similar measurement tasks can be reflected in real time.
Therefore, this paper has proposed using the Bayesian information fusion method to establish an information fusion model based on Bayesian formula and to achieve real-time and continuous updates of uncertainty components, so that the evaluation results of task-oriented CMM measurement uncertainty could reflect the latest information in the measurement system in real time, and improve the reliability of the uncertainty evaluation results.
The repeated measurements generally obey normal distribution and the prior distribution is identical to the posterior distribution in form during the process of information fusion. Therefore, the conjugate Bayesian method can be used to update the uncertainty components of repeatability continuously.
Set the measurement series of repetitive experiments as X = ( x 1 , x 2 , x 3 , , x n ) and X ~ N ( θ , σ 2 ) . Then the Bessel formula can be used to work out the standard uncertainty component of repeatability in a single result:
u = i = 1 n ( x i x ¯ ) 2 n ( n 1 )
If the number of measurements in the first repeatability experiment is n 0 and the measurement result is X = ( x 01 , x 02 , x 03 , , x 0 n ) , according to the evaluation method of conjugate Bayesian uncertainty, the conjugate prior distribution of σ 2 is as follows:
π ( σ 2 ) = S 0 n 0 1 2 n 0 1 Γ ( n 0 1 2 ) ( 1 σ 2 ) n 0 + 1 2 exp ( S 0 2 σ 2 ) ( 1 σ 2 ) n 0 + 1 2 exp ( S 0 2 σ 2 )
where, S 0 = j = 1 n ( x 0 j x ¯ 0 ) 2 .
Therefore, the uncertainty component of the first repeatability experiment is:
u 0 = S 0 n 0 1
Assuming that the number of measurements in the second repeatability experiment is n 1 and the measurement result is X = ( x 11 , x 12 , x 13 , , x 1 n ) , use the latest repeatability data to update σ 2 and its likelihood function is as follows:
l ( σ 2 | x ) ( 1 σ 2 ) n 1 2 exp ( S 1 2 σ 2 )
where, S 1 = j = 1 n ( x 1 j x ¯ 1 ) 2 .
Calculate the σ 2 posteriori probability density function and its distribution according to the Bayes formula:
π ( σ 2 | x ) π ( σ 2 ) l ( σ 2 | x ) ( σ 2 ) n 0 + n 1 1 2 1 exp ( S 0 + S 1 2 σ 2 )
π ( σ 2 | x ) ~ Γ 1 ( n 0 + n 1 1 2 , S 0 + S 1 2 σ 2 )
Therefore, the updated repeatability uncertainty component is as follows:
u 1 = S 0 + S 1 n 0 + n 1 3
The general formula can be concluded as follows for updating the repeatability uncertainty component:
u 1 = ( n 0 1 ) u 0 2 + j = 1 n 1 ( x 1 j x 1 ¯ ) 2 n 0 + n 1 3

5. Experimental Analysis

HEXAGON Micro-Hite 3D DCC CMM was used to measure the workpiece as shown in Figure 3. The measurement tasks include diameter, flatness and perpendicularity respectively. See Figure 4 for the experiment. The maximum permissible error of CMM is: E L ,   MPE = ( 3 + L / 250 ) μ m , MPE P = 3.5 μ m . The TesaStar-i touch trigger probe is applied to this experiment. The type of tip in routine repeated experiments is 3BY40, namely that the sphere diameter is 3 mm and the pole length is 40 mm. In routine reproducibility tests, the sampling point’s numbers of plane and circle are nine, and the sampling points are evenly distributed.

5.1. Example for Evaluating Uncertainty of Diameter Measurement

The height of the measured cylinder is 14 mm, the upper tolerance limit of diameter is +0.020 mm and the lower tolerance limit of the diameter is −0.015 mm. The measured cylinder is made by a milling-tool, its roughness is 0.8 μm, and the effect of surface roughness for diameter measurement is negligible.
According to Formula (4), the uncertainty component caused by indication errors can be calculated as follows:
u E = E L ,   MPE 3 = 1 3 × ( 3 + 62 250 ) = 1.875   μ m
Under the condition of repeatability, complete 10 times’ continuous and rapid measurement of the circle to be measured. See Table 2 for data on the repeatability experiment. Calculate the standard deviation of the repeatability experiment according to the experimental data in Table 2:
S r = i = 1 n ( d i d ¯ ) 2 ( n 1 ) = 0.51   μ m
If the average value of three times’ measurements is taken as the best estimate of the diameter measurement, the standard uncertainty caused by measurement repeatability is as follows:
u r = S r 3 = 0.294   μ m
Carry out three groups of repeatability measurements independently by three surveyors with professional measurement knowledge and operation level according to their habits and in accordance with the measurement requirements. Try to have the sampling strategy, measurement starting point and other factors in the experiment kept as different as possible. The probe configurations that can be selected by the surveyors include 2BY20, 2BY40, 3BY20, 3BY40, 4BY20, and 4BY40. The number and distribution of sampling points conform to BS 7172 [12]. See Table 3 for the data in the reproducibility experiment:
Total mean of the measurement for calculating reproducibility:
d ¯ ¯ = j = 1 9 d ¯ j 9 = 62.0007   mm
According to Formula (7), the standard uncertainty caused by the reproducibility of the diameter measurement is as follows:
u R = 1 ( 9 1 ) j = 1 9 ( d ¯ j d ¯ ¯ ) 2 = 0.850   μ m
Then see Table 4 for the uncertainty component of the diameter measurement:
According to Formula (3), the combined standard uncertainty of the diameter measurement task can be calculated as follows:
u c = u E 2 + u r 2 + u R 2 = 2.1   μ m
According to GUM, take p = 95 % k = 2 and the expanded uncertainty is as follows:
U = k × u c = 4.2   μ m

5.2. Example for Evaluating Uncertainty of Flatness Measurement

According to Formula (9), the uncertainty component caused by indication errors can be calculated as follows in flatness measurement:
u E = MPE P 3 = 3.5 3 = 2.021   μ m
Similarly, under the condition of repeatability, complete 10 times’ continuous and rapid measurement of the plane to be measured, calculate the standard deviation of the repeatability experiment as Sr = 0.618 μm; if the average value of three times’ measurements is taken as the best estimate of the flatness measurement, then the standard uncertainty caused by measurement repeatability is as follows:
u r = S r 3 = 0.357   μ m
Similarly, complete the repeatability measurements by three surveyors and try to have the sampling strategy and other factors kept as different as possible, thus obtaining the standard uncertainty caused by the reproducibility of flatness measurement as u R = 0.915   μ m .
Then see Table 5 for the uncertainty component for flatness measurement:
The combined standard uncertainty is as follows for flatness measurement tasks:
u c = u E 2 + u r 2 + u R 2 = 2.3   μ m
Similarly, the expanded uncertainty is as follows:
U = k × u c = 4.6   μ m

5.3. Example for Evaluating Uncertainty of Perpendicularity Measurement

According to Formula (15), the uncertainty component caused by indication errors can be calculated as follows in perpendicularity measurement:
u E = 2 A 6 = 2 × 3 6 = 2.449   μ m
Similarly, under the condition of repeatability, complete 10 times’ continuous and rapid measurement of the measurement task, calculate the standard deviation of the repeatability experiment as Sr = 0.682 μm; if the average value of three times’ measurements is taken as the best estimate of the perpendicularity measurement, then the standard uncertainty caused by measurement repeatability is as follows:
u r = S r 3 = 0.394   μ m
Similarly, complete the reproducibility measurements by three surveyors and try to have the sampling strategy and other factors kept as different as possible, thus obtaining the standard uncertainty caused by the reproducibility of perpendicularity measurement as u R = 1.060 μ m . See Table 6 for the uncertainty component for perpendicularity measurement:
The combined standard uncertainty is as follows for perpendicularity measurement tasks:
u c = u E 2 + u r 2 + u R 2 = 2.7   μ m
Similarly, the expanded uncertainty is as follows:
U = k u c = 5.4   μ m

5.4. Result Analysis and Optimizing Uncertainty

After the measurement task is determined, it is necessary to select the measuring instruments and methods according to the accuracy requirements. During measurement, see Table 7 [35] for the requirements of the geometric parameters for measurement accuracy, which is particularly important for geometrical tolerances detection; the tolerance level is Level 5–6 for the measurement object as shown in Figure 3, so the measurement uncertainty should be less than 20% of the tolerance value as required and then the uncertainty should be less than 2.0   μ m and 3.0   μ m respectively in flatness and perpendicularity detections. Obviously, the measurement uncertainty given in Formula (31)–Formula (40) has the evaluation results not in conformity with the accuracy requirements of the measurement tasks. There are two major reasons for such inconformity as follows: Firstly, the production-oriented CMM is not the preferred measuring instrument for geometrical tolerances. Its ability for measuring geometrical tolerance is slightly inferior to that of the roundness meter, autocollimator and other special instruments; secondly, the CMM task-oriented uncertainty evaluation model described in Section 2.2 features “overestimation” to ensure the safety and reliability of the evaluation results. When CMM is selected as the measurement instrument to complete the measurement tasks, it is bound to optimize the conventional measurement scheme and its uncertainty evaluation model. Therefore, here follows the research on the method for optimizing and evaluating the uncertainty of CMM task-oriented measurement in this paper.
Take the flatness measurement in Section 3.4.2 as an example to illustrate how to optimize and evaluate the CMM task-oriented measurement uncertainty and to determine the target measurement uncertainty U o = 2.0   μ m of the measurement task according to the requirements in Table 7. Therefore, only if the uncertainty of flatness measurement U after optimal evaluation should be smaller than U o can the accuracy requirements of the measurement be satisfied.
Use P = 1.2   μ m calibrated in Table 1 to substitute as the upper limit of the indication error and then the uncertainty component caused by the indication error in flatness measurement is as follows:
u E = P 3 = 1.2 3 = 0.69   μ m
In the reproducibility experiment of the flatness measurement in Section 3.4.2, try to have the number and distribution of the sampling points on the plane to be measured and other factors kept somewhat different. See Table 8 for the data of reproducibility measurement.
u R = 1 ( 9 1 ) j = 1 9 ( t ¯ j t ¯ ¯ ) 2 = 0.915   μ m
In time for secondary optimal evaluation, distribute the sampling points evenly, use 12 sampling points in all and adopt 4mm probes and 20 mm measuring rods uniformly; see Table 9 for the reproducibility experimental data after the experimental scheme has been optimized.
u R = 1 ( 9 1 ) j = 1 9 ( t ¯ j t ¯ ¯ ) 2 = 0.518   μ m
It can be seen that the standard uncertainty introduced by reproducibility has reduced from 0.915   μ m to u R = 0.518   μ m by optimizing the experimental scheme.
Considering that the repeatability indexes have been updating by the latest measurement information continuously arising during the process of the measurement process, regard the repeatability uncertainty component u r = 0.357   μ m of the flatness measurement in Section 3.4.2 as prior information u 0 , and the number of measurements contained in the prior information n 0 = 10 .
Table 10 shows the daily measurement data of the flatness for three workpieces in the same batch. Take workpiece A as the sample information and the repeatability uncertainty component can be calculated as follows after information fusion:
u r 1 = ( n 0 1 ) u r 0 2 + j = 1 n 1 ( t 1 j t ¯ 1 ) 2 n 0 + n 1 3 = 0.339   μ m
That is to say, after incorporating the daily measurement information, the repeatability index has been updated from 0.357 μm to 0.339 μm; replace the prior information with the result of information fusion to prepare for the next update; then:
u r 0 = u r 1 = 0.339   μ m
n 0 = n 0 + n 1 2 = 11
Based on the updated prior information, further integrate the measurement results of part B, then the latest production and measurement information can be continuously integrated to achieve real-time and continuous updates of the repeatability index. By fusing the daily measurement data of flatness, the uncertainty components introduced by the repeatability of the flatness measurement of workpieces B and part C can be as follows:
u r 2 = ( n 0 1 ) ( u r 0 ) 2 + j = 1 n 1 ( t 2 j t ¯ 2 ) 2 n 0 + n 2 3 = 0.323   μ m
u r 3 = ( n 0 1 ) ( u r 0 ) 2 + j = 1 n 1 ( t 3 j t ¯ 3 ) 2 n 0 + n 3 3 = 0.309   μ m
If the repeatability index has not been updated, the uncertainty component caused by repeatability will always keep the evaluation results of the previous repeatability experiments. If only daily measurement data is adopted to evaluate the repeatability, then the sample data will be small in number and less representative.
See Table 11 for the results from comparing the repeatability uncertainty component estimated in Section 3.4.2, the repeatability uncertainty component of the workpiece daily measurements and the repeatability uncertainty component updated in real time using the Bayesian formula.
As can be seen from Table 11, the predicted repeatability based on 10 applied measurements, once determined, will remain static, so it can not reflect the latest information in daily measurements in real time. However, when the sample data of daily measurements is used to evaluate the uncertainty component caused by repeatability, the small sample size can only reflect limited information and is easily affected by accidental factors in the experiment. Using the Bayesian method to fully fuse the historical information and the current information for updating the uncertainty component introduced by repeatability in real time can integrate the latest measurement information into the evaluation results to reflect the latest trend of the random effects in the measurement system in time; moreover, the amount of information is comparatively great in the samples used for fully integrating the current and historical information, so the evaluation results will not easily be influenced by accidental factors and the repeatable uncertainty components tend to be stable and reliable.
See Table 12 and Figure 5 for estimations of the uncertainty optimal evaluation for the flatness measurement of the workpieces A, B and C in the same batch:
As can be seen from Figure 5, when the extended uncertainty of the first evaluation is regarded as the uncertainty evaluation result of the flatness measurement task, the requirements of the target uncertainty Uo cannot be satisfied; however, the extended uncertainty of the flatness measurement tasks for three workpieces to be measured after optimal evaluation can meet the accuracy requirements of the measurement tasks, but the sacrifice will be relatively high accordingly. Therefore, according to the basic principle of the task-oriented uncertainty optimal evaluation described in this section, the surveyors should make choices according to their own measurement conditions.

6. Conclusions

In the framework of the GPS standard system, the CMM task-oriented uncertainty evaluation has been studied. The main content is as follows:
(1) The difficulty of uncertainty evaluation for CMM measurement tasks oriented at dimensional and geometric errors has been solved systematically. Based on the systematic analysis of the CMM task-oriented uncertainty sources, a model for evaluating the CMM task-oriented measurement uncertainty based on the measurement system analysis has been proposed. Starting from the statistical characteristic indexes of the measurement results, this model has somewhat comprehensively reflected the impact of the CMM measuring system uncertainty sources on measurement results.
(2) The quantization method and evaluation model for uncertainty components of such three different measurement tasks of the CMM as dimensions, geometrical errors have been studied. The uncertainty components caused by the indication errors of CMM different measurement tasks are quite different, and especially the form error and some position errors reflect the relative changes in the micro-sized space. The linear influence should be neglected when the uncertainty components are quantified. Moreover, the indication bias introduced by the residual system errors of the measuring instrument should also be quantified and characterized by reasonably selecting the error indicators according to the specific measurement tasks.
(3) The optimal evaluation of the CMM task-oriented uncertainty has been studied. The target uncertainty of geometric parameter detection must satisfy the requirements of the design tolerance. In order to ensure the safety and reliability of the evaluation results, there is an "excessive estimation" in the CMM task-oriented uncertainty evaluation, which has the evaluation results of uncertainty possibly not meet the requirements for measurement accuracy. At this time, the secondary optimal evaluation of the measurement uncertainty should be extremely important. The uncertainty source information of the measurement process should be further grasped by means of experiments and other prior information, as well as each uncertainty component should be re-quantified reasonably; thus the combined standard uncertainty would be reduced.

Author Contributions

Conceived the Method and Wrote the Paper, Y.C.; Data curation, H.L. and Y.L.; Performed some Confirmatory Experiments, Y.C., H.L. and H.W.; Resources, Z.W. and X.C.; Edited the Manuscript, Z.W.

Funding

This research was supported by National Key Research and Development Plan of China, Grant Number 2016YFF0203801; Fujian Province Public Scientific Research Institute Special Program of China, Grant Number 2018R1033-6; Natural Science Foundation of China, Grant Number 51575032.

Conflicts of Interest

The authors declare no conflict of interest.

References

  1. Li, H.L.; Chen, X.H.; Cheng, Y.B.; Liu, H.D.; Wang, H.B.; Cheng, Z.Y.; Wang, H.T. Uncertainty modeling and evaluation of CMM task oriented measurement based on SVCMM. Meas. Sci. Rev. 2017, 17, 226–231. [Google Scholar] [CrossRef]
  2. Cappetti, N.; Naddeo, A.; Villecco, F. Fuzzy approach to measures correction on coordinate measuring machines: The case of hole-diameter verification. Measurement 2016, 93, 41–47. [Google Scholar] [CrossRef]
  3. D’Amato, R.; Caja, J.; Maresca, P.; Gómez, E. Use of coordinate measuring machine to measure angles by geometric characterization of perpendicular planes. Estimating uncertainty. Measurement 2014, 47, 598–606. [Google Scholar] [CrossRef]
  4. Vrba, I.; Palencar, R.; Hadzistevic, M.; Strbac, B.; Jokic, V.S.; Hodolic, J. Different approaches in uncertainty evaluation for measurement of complex surfaces using coordinate measuring machine. Meas. Sci. Rev. 2015, 15, 111–118. [Google Scholar] [CrossRef]
  5. Li, R.J.; Fan, K.C.; Huang, Q.X.; Zhou, H.; Gong, E.M.; Xiang, M. A long-stroke 3D contact scanning probe for micro/nano coordinate measuring machine. Precis. Eng. 2016, 43, 220–229. [Google Scholar] [CrossRef]
  6. Thalmann, R.; Meli, F.; Küng, A. State of the art of tactile micro coordinate metrology. Appl. Sci. 2016, 6, 150. [Google Scholar] [CrossRef]
  7. Cheng, Y.B.; Chen, X.H.; Li, H.L.; Cheng, Z.Y.; Jiang, R.; Lü, J.; Fu, H.D. Analysis and comparison of bayesian methods for measurement uncertainty evaluation. Math. Probl. Eng. 2018, 1, 7509046. [Google Scholar] [CrossRef]
  8. Bich, W. Revision of the ‘Guide to the Expression of Uncertainty in Measurement’. Why and how. Metrologia 2014, 51, S155–S158. [Google Scholar] [CrossRef]
  9. Gaska, P.; Gaska, A.; Gruza, M. Challenges for modeling of five-axis coordinate measuring systems. Appl. Sci. 2017, 7, 803. [Google Scholar] [CrossRef]
  10. Schwenke, H.; Siebert, R.L.; Waldele, F.; Kunzmann, H. Assessment of Uncertainties in Dimensional Metrology by Monte Carlo Simulation: Proposal of a Modular and Visual Software. CIRP Ann. Manuf. Technol. 2000, 49, 395–398. [Google Scholar] [CrossRef]
  11. Weckenmann, A.; Knauer, M.; Kunzmann, H. The Influence of Measurement Strategy on the Uncertainty of CMM-Measurements. CIRP Ann. Manuf. Technol. 1998, 47, 451–454. [Google Scholar] [CrossRef]
  12. Advanced Manufacturing Technology Standards Policy Committee of Britain. BS 7172: 1989, Guide to Assessment of Position, Size and Departure from Nominal Form of Geometric Features (Confirmed January 2010); AMT: London, UK, 2010. [Google Scholar]
  13. Balsamo, A.; Di Ciommo, M.; Mugno, R.; Rebaglia, B.I.; Ricci, E.; Grellaz, R. Evaluation of CMM Uncertainty through Monte Carlo Simulations. CIRP Ann. Manuf. Technol. 1999, 48, 425–428. [Google Scholar] [CrossRef]
  14. Sładek, J.; Gąska, A. Evaluation of coordinate measurement uncertainty with use of virtual machine model based on monte carlo method. Measurement 2012, 45, 1564–1575. [Google Scholar] [CrossRef]
  15. Jakubiec, W. Estimation of uncertainty of coordinate measurements according to the Type B method. Key Eng. Mater. 2010, 437, 253–257. [Google Scholar] [CrossRef]
  16. Jakubiec, W.; Płowucha, W. First Coordinate Measurements Uncertainty Evaluation Software Fully Consistent with the GPS Philosophy. Procedia CIRP 2013, 10, 317–322. [Google Scholar] [CrossRef]
  17. Dhanish, P.B.; Mathew, J. Effect of CMM point coordinate uncertainty on uncertainties in determination of circular features. Measurement 2006, 39, 522–531. [Google Scholar] [CrossRef]
  18. Jonathan, B.; Edward, M. Experimental evaluation of software estimates of task specific measurement uncertainty for CMMs. Precis. Eng. 2010, 34, 28–33. [Google Scholar] [CrossRef]
  19. Feng, C.X.J.; Saal, A.L.; Salsbury, J.G.; Ness, A.R.; Lin, G.C.S. Design and analysis of experiments in CMM measurement uncertainty study. Precis. Eng. 2007, 31, 94–101. [Google Scholar] [CrossRef]
  20. Kruth, J.P.; Gestel, N.V.; Bleys, P.; Welkenhuyzen, F. Uncertainty determination for CMMs by monte carlo simulation integrating feature form deviations. CIRP Ann. Manuf. Technol. 2009, 58, 463–466. [Google Scholar] [CrossRef]
  21. Aggogeri, F.; Barbato, G.; Barini, E.M.; Genta, G.; Levi, R. Measurement uncertainty assessment of Coordinate Measuring Machines by simulation and planned experimentation. CIRP J. Manuf. Sci. Technol. 2011, 4, 51–56. [Google Scholar] [CrossRef] [Green Version]
  22. Zhang, G.X. Coordinate Measuring Machines; Tianjin University Press: Tianjin, China, 1999. [Google Scholar]
  23. Wilhelm, R.G.; Hocken, R.; Schwenke, H. Task specific uncertainty in coordinate measurement. CIRP Ann. Manuf. Technol. 2001, 50, 553–563. [Google Scholar] [CrossRef]
  24. Haitjema, H. Task specific uncertainty estimation in dimensional metrology. Int. J. Precis. Technol. 2011, 2, 226–245. [Google Scholar] [CrossRef]
  25. Takamasu, K.; Takahashi, S.; Abbe, M.; Furutani, R. Uncertainty estimation for coordinate metrology with effects of calibration and form deviation in strategy of measurement. Meas. Sci. Technol. 2008, 19, 084001. [Google Scholar] [CrossRef]
  26. International Organization for Standardization. ISO/TS 15530-1: 2013—Geometrical Product Specifications (GPS)—Coordinate Measuring Machines (CMM): Technique for Determining the Uncertainty of Measurement—Part 1: Overview and Metrological Characteristics; ISO: Geneva, Switzerland, 2013. [Google Scholar]
  27. International Organization for Standardization. ISO 15530-3: 2011—Geometrical Product Specifications (GPS)—Coordinate Measuring Machines (CMM): Technique for Determining the Uncertainty of Measurement—Part 3: Use of Calibrated Workpieces or Standards; ISO: Geneva, Switzerland, 2011. [Google Scholar]
  28. International Organization for Standardization. ISO 10360-1: 2000—Geometrical Product Specifications (GPS)—Acceptance and Reverification Tests for Coordinate Measuring Machines (CMM)—Part 1: Vocabulary; ISO: Geneva, Switzerland, 2000. [Google Scholar]
  29. International Organization for Standardization. ISO 10360-2: 2009—Geometrical Product Specifications (GPS)—Acceptance and Reverification Tests for Coordinate Measuring Machines (CMM)—Part 2: CMMs Used for Measuring Linear Dimensions; ISO: Geneva, Switzerland, 2009. [Google Scholar]
  30. Li, R.J.; Xiang, M.; He, Y.X.; Fan, K.C.; Cheng, Z.Y.; Huang, Q.X.; Zhou, B. Development of a high-Precision touch-trigger probe using a single sensor. Appl. Sci. 2016, 6, 86. [Google Scholar] [CrossRef]
  31. International Organization for Standardization. ISO 17450-2: 2012—Geometrical Product Specifications (GPS)—General Concepts—Part 2: Basic Tenets, Specifications, Operators, Uncertainties and Ambiguities; ISO: Geneva, Switzerland, 2012. [Google Scholar]
  32. The Joint Committee for Guides in Metrology. JCGM 100: 2008, Guide to the Expression of Uncertainty in Measurement, GUM 1995 with Minor Corrections; BIPM: Paris, France, 2008. [Google Scholar]
  33. International Organization for Standardization. ISO 1101: 2017, Geometrical Product Specifications (GPS)—Geometrical Tolerancing—Tolerances of Form, Orientation, Location and Run-Out; ISO: Geneva, Switzerland, 2017. [Google Scholar]
  34. International Organization for Standardization. ISO 14253-2: 2011—Geometrical Product Specifications (GPS)—Inspection by Measurement of Workpieces and Measuring Equipment—Part 2: Guidance for the Estimation of Uncertainty in GPS Measurement, in Calibration of Measuring Equipment and in Product Verification; ISO: Geneva, Switzerland, 2011. [Google Scholar]
  35. Standardization Administration of China. GB/T 1958-2017, Geometrical Product Specifications (GPS)—Geometrical Tolerance—Verification; SAC/TC: Beijing, China, 2017.
Figure 1. The uncertainty sources of the measurement system. EN: European Norm; ASME: American Society of Mechanical Engineers; GB: Chinese National Standards.
Applsci 09 00006 g001
Figure 2. Management program of task-oriented uncertainty by definitized measurement process.
Applsci 09 00006 g002
Figure 3. The drawing marking of the measured part.
Applsci 09 00006 g003
Figure 4. The experimental of measurement.
Applsci 09 00006 g004
Figure 5. Comparison of measurement uncertainty before and after optimization.
Applsci 09 00006 g005
Table 1. Calibration results of indication error and probing error of CMM.
ErrorError LimitUncertainty Component
EL = 60, MPE3.24 μm (L = 60 mm)1.87 μm
EL = 601.4 μm (L = 60 mm)0.81 μm
MPEP3.5 μm2.02 μm
P1.2 μm0.69 μm
Table 2. The experimental data of diameter measurement for repeatability detection.
No.12345678910
measured value di (mm)62.001062.001162.001061.999862.001162.000262.000861.999862.000762.0008
Table 3. The experimental data of diameter measurement for reproducibility detection.
The three times measurement mean of surveyor A d ¯ j (mm)Group ⅠGroup ⅡGroup Ⅲ
62.001261.999862.0013
The three times measurement mean of surveyor B d ¯ j (mm)Group ⅣGroup ⅤGroup Ⅵ
61.999862.001662.0001
The three times measurement mean of surveyor C d ¯ j (mm)Group ⅦGroup ⅧGroup Ⅸ
62.001361.999662.0016
Note: d ¯ j indicates the measurement mean of the reproducibility experiment in Group j.
Table 4. The uncertainty budget for the diameter measurement.
Standard UncertaintySource of UncertaintyEvaluation Result
u E Indication error1.875 μm
u r Repeatability0.294 μm
u R Reproducibility0.850 μm
Table 5. The uncertainty budget for flatness measurement.
Standard UncertaintySource of UncertaintyEvaluation Result
u E Indication error2.021 μm
u r Repeatability0.357 μm
u R Reproducibility0.915 μm
Table 6. The uncertainty budget for perpendicularity measurement.
Standard UncertaintySource of UncertaintyEvaluation Result
u E Indication error2.449 μm
u r Repeatability0.394 μm
u R Reproducibility1.060 μm
Table 7. Accuracy requirements of geometric sense measurement.
Tolerance Grade0123456789101112
Proportion of Uncertainty to Tolerance33%25%20%16%12.5%10%
Table 8. The first reproducibility measurement data of flatness.
The three times measurement mean of surveyor A t ¯ j (mm)Group ⅠGroup ⅡGroup Ⅲ
0.00530.00620.0045
The three times measurement mean of surveyor B t ¯ j (mm)Group ⅣGroup ⅤGroup Ⅵ
0.00410.00580.0065
The three times measurement mean of surveyor C t ¯ j (mm)Group ⅦGroup ⅧGroup Ⅸ
0.00470.00660.0049
Table 9. The optimized reproducibility measurement data of flatness.
The three times measurement mean of surveyor A t ¯ j (mm)Group ⅠGroup ⅡGroup Ⅲ
0.00510.00580.0048
The three times measurement mean of surveyor B t ¯ j (mm)Group ⅣGroup ⅤGroup Ⅵ
0.00470.00580.0055
The three times measurement mean of surveyor C t ¯ j (mm)Group ⅦGroup ⅧGroup Ⅸ
0.00490.00610.0049
Table 10. The daily measurement data of flatness.
Measured ValueWorkpiece A/t1jWorkpiece B/t2jWorkpiece C/t3j
ti10.0057 mm0.0051 mm0.0060 mm
ti20.0048 mm0.0044 mm0.0049 mm
ti30.0051 mm0.0054 mm0.0053 mm
Mean value t ¯ i 0.0052 mm0.0050 mm0.0054 mm
ni333
Standard deviation0.458 μm0.513 μm0.556 μm
ur0.265 μm0.296 μm0.321 μm
Table 11. The comparison of the repeatability evaluation results by different methods.
RepeatabilityWorkpiece AWorkpiece BWorkpiece C
Repeatability of prediction0.357 μm0.357 μm0.357 μm
Repeatability of sample data0.265 μm0.296 μm0.321 μm
Repeatability of real-time updates0.339 μm0.323 μm0.309 μm
Table 12. The uncertainty budget of optimized evaluation for flatness measurement.
Uncertainty ComponentsInitial Evaluation ResultsOptimized Evaluation Results
SymbolSourcesWorkpiece AWorkpiece BWorkpiece C
u E Indication error2.021 μm0.69 μm0.69 μm0.69 μm
u r Repeatability0.357 μm0.339 μm0.323 μm0.309 μm
u R Reproducibility0.915 μm0.518 μm0.518 μm0.518 μm
Standard uncertainty uc2.3 μm0.9 μm0.9 μm0.9 μm
Expanded uncertainty U (p = 95%)4.6 μm1.8 μm1.8 μm1.8 μm
Comparison with target uncertainty Uo = 2.0 μmExcessLessLessLess

