Evaluation of Cracks in Metallic Material Using a Self-Organized Data-Driven Model of Acoustic Echo-Signal


1
Key Laboratory of Modern Acoustics (Nanjing University), Ministry of Education, Institute of Acoustics, Nanjing 210093, China
2
School of Electronic and Electric Engineering, Shanghai University of Engineering Science, Shanghai 201620, China
3
Nanjing Manse Acoustics Technology Co. Ltd., Nanjing 210017, China
4
Center for Applied Intelligent Systems Research (CAISR), Halmstad University, SE-30118 Halmstad, Sweden
*
Author to whom correspondence should be addressed.
†
These authors contributed equally to this work.
Appl. Sci. 2019, 9(1), 95; https://doi.org/10.3390/app9010095
Submission received: 24 November 2018
/
Revised: 18 December 2018
/
Accepted: 22 December 2018
/
Published: 28 December 2018
(This article belongs to the Special Issue Modelling, Simulation and Data Analysis in Acoustical Problems)
Abstract
:Non-linear acoustic technique is an attractive approach in evaluating early fatigue as well as cracks in material. However, its accuracy is greatly restricted by external non-linearities of ultra-sonic measurement systems. In this work, an acoustical data-driven deviation detection method, called the consensus self-organizing models (COSMO) based on statistical probability models, was introduced to study the evolution of localized crack growth. By using pitch-catch technique, frequency spectra of acoustic echoes collected from different locations of a specimen were compared, resulting in a Hellinger distance matrix to construct statistical parameters such as z-score, p-value and T-value. It is shown that statistical significance p-value of COSMO method has a strong relationship with the crack growth. Particularly, T-values, logarithm transformed p-value, increases proportionally with the growth of cracks, which thus can be applied to locate the position of cracks and monitor the deterioration of materials.
1. Introduction
Nonlinear ultrasonic behaviors, such as harmonics, mix frequencies, and the resonance frequency shift, have been proven to be sensitive to structure imperfections and early degradation of materials [1,2,3,4,5,6]. In the early stage of damage, material fatigue can induce a number of micro-cracks with a typical length of 1–100 μm by continuous loading cycles, then the micro-cracks further grow, coalesce with other micro-cracks and eventually form macro-cracks [7]. Since the fatigue cracks are localized [8], not uniformly distributed in the structure, the generated nonlinear response is basically dependent on the configuration of the crack area related to the localized hysteretic deformation. Clapping between the contacting surface and dissipative mechanism due to frictional sliding and so on [7,8], leads to a much stronger nonlinearity than the surrounding material behaving linearly [8]. However, non-linear effects induced by the localized cracks in the materials are not obvious enough to conveniently be measured and analyzed [9,10]. In addition, the use of power amplifier, transducers, and coupling media in ultrasonic testing system also bring about external non-linear change. Since it is difficult to separate structure-induced non-linearity in materials from external non-linearity, non-linear ultrasonic technology is not applied widely to accurately evaluate and locate the structure imperfections in practical applications [11].
In terms of the uncertainties in real-life testing conditions, “big data” sets, collected from acoustic echo-signals of vast amounts of damaged material, show different but distinguishable statistical characteristics compared with intact material [12,13,14,15,16,17]. Some statistical models, also called data-driven models, relate the degree of damage to the probability of detection (PoD). They were first introduced by the National Aeronautics and Space Administration (NASA) in 1973 and were soon accepted as a standard method [18,19]. Later Lu and Meeker further developed statistical methods to estimate a time–to–failure distribution for a broad class of degradation structures [16]. Gebraeel employed Bayesian to update a method to develop a closed-form residual-life distribution for the monitored device [20]. Gang Qi et al. proposed a framework to meet the challenge by systematically evaluating material damage based on large data sets collected by using acoustic emission (AE) [12]. Zhou et al. investigated AE relative energy, amplitude distribution as well as amplitude spectrum to discern the delamination damage mechanism of the composites [21]. Kůs et al. employed the model-based Clustering (Hellinger divergence) method to classify certain attributes of the original pure data obtained directly from the acoustic emission signals and form normed frequency spectra to perform physical separation tasks of AE random signals [22].
However, most data-driven methods are probabilistic and obtained historical degradation data or empirical knowledge [23,24], which require a large amount of experimental data to construct the reference curves or the preset feature threshold. Hence, in our previous work [25], we first introduced consensus self-organizing model (COSMO), neither any domain knowledge nor supervision to extract useful features, detecting a single flaw located at a fixed positon of steel specimens based on acoustical echo-signals. Nevertheless, as the contacting surfaces of the flaw produced by an electrical discharge machine were totally separated in [25], evaluating the actual fatigue cracks by applying COMSO method would potentially be problematic. In this paper, four cracks distributed along the length direction of a steel specimen were investigated, and the crack’s growth (produced using fatigue testing [26]) was further discussed in details, which is probably accord with the mechanisms involved in contact acoustic nonlinearity and hysteretic nonlinearity. Both Numerical simulation and experimental measurements showed that COSMO models are effective in NDT inspection, as well as health monitoring for regular metallic structures.
2. The Consensus Self-Organizing Models (COSMO)
The COSMO method identifies the typical variability within a group of systems and to evaluate the likelihood of any individual being significantly different from the majority. In an ultrasonic testing system, a group of acoustic echo-signals were collected using pitch-catch method from N different locations (i.e., the total amount of samples) on a measured object. The spectral density of the acoustic signals were then obtained so that the difference between spectral density of two acoustic signals were compared [27,28], and Hellinger distance di,j was employed [22,23,24]:
where pi and qj are normalized histograms, representing spectral density of two acoustic signals. m is the number of sampled points of each acoustic signal. Two acoustic signals with different spectral density will yield a greater value of Hellinger distance than two similar ones. From the perspective of clustering analysis, samples with larger sum of distances to all peers are prone to be outliers.
For all pairs of these histograms, Hellinger distance was computed, resulting in a symmetric distance matrix D:
Within D, the row with minimum sum of distances is chosen as the most central pattern c, representing the most typical testing sample within this group. Based on the most central pattern c, the z-score is computed for each sample k, representing the percentage of all samples that are further away from c than sample k, that is,
where dk,c is the distance between sample k and c; di,c denotes the distance between sample i and c; N is the total amount of samples. A sample with z-score close to 0 indicates a large distance to its peers. If there is no micro-crack at a particular position, the z-scores of a set of testing samples from this position should be uniformly distributed between (0, 1). We approximate the distribution of the average based on n samples using a normal distribution with mean 0.5 and variance 1/12n, i.e., [23,24]
Therefore, the one-sided p-value, which is the probability that a single observation z picked from a normal distribution with parameters (1/2, (1/12n)1/2) will fall in the interval , can be computed as:
Based on a uniformity test of z-scores over an area, the resulting p-value of this test is obtained to estimate whether the inspected contains any micro-flaws.
3. Crack Identification Based on COSMO
In this section, we employed the COSMO model to identify and locate the cracks to steel specimens by numerical simulation and experimental tests.
3.1. Numerical Simulation
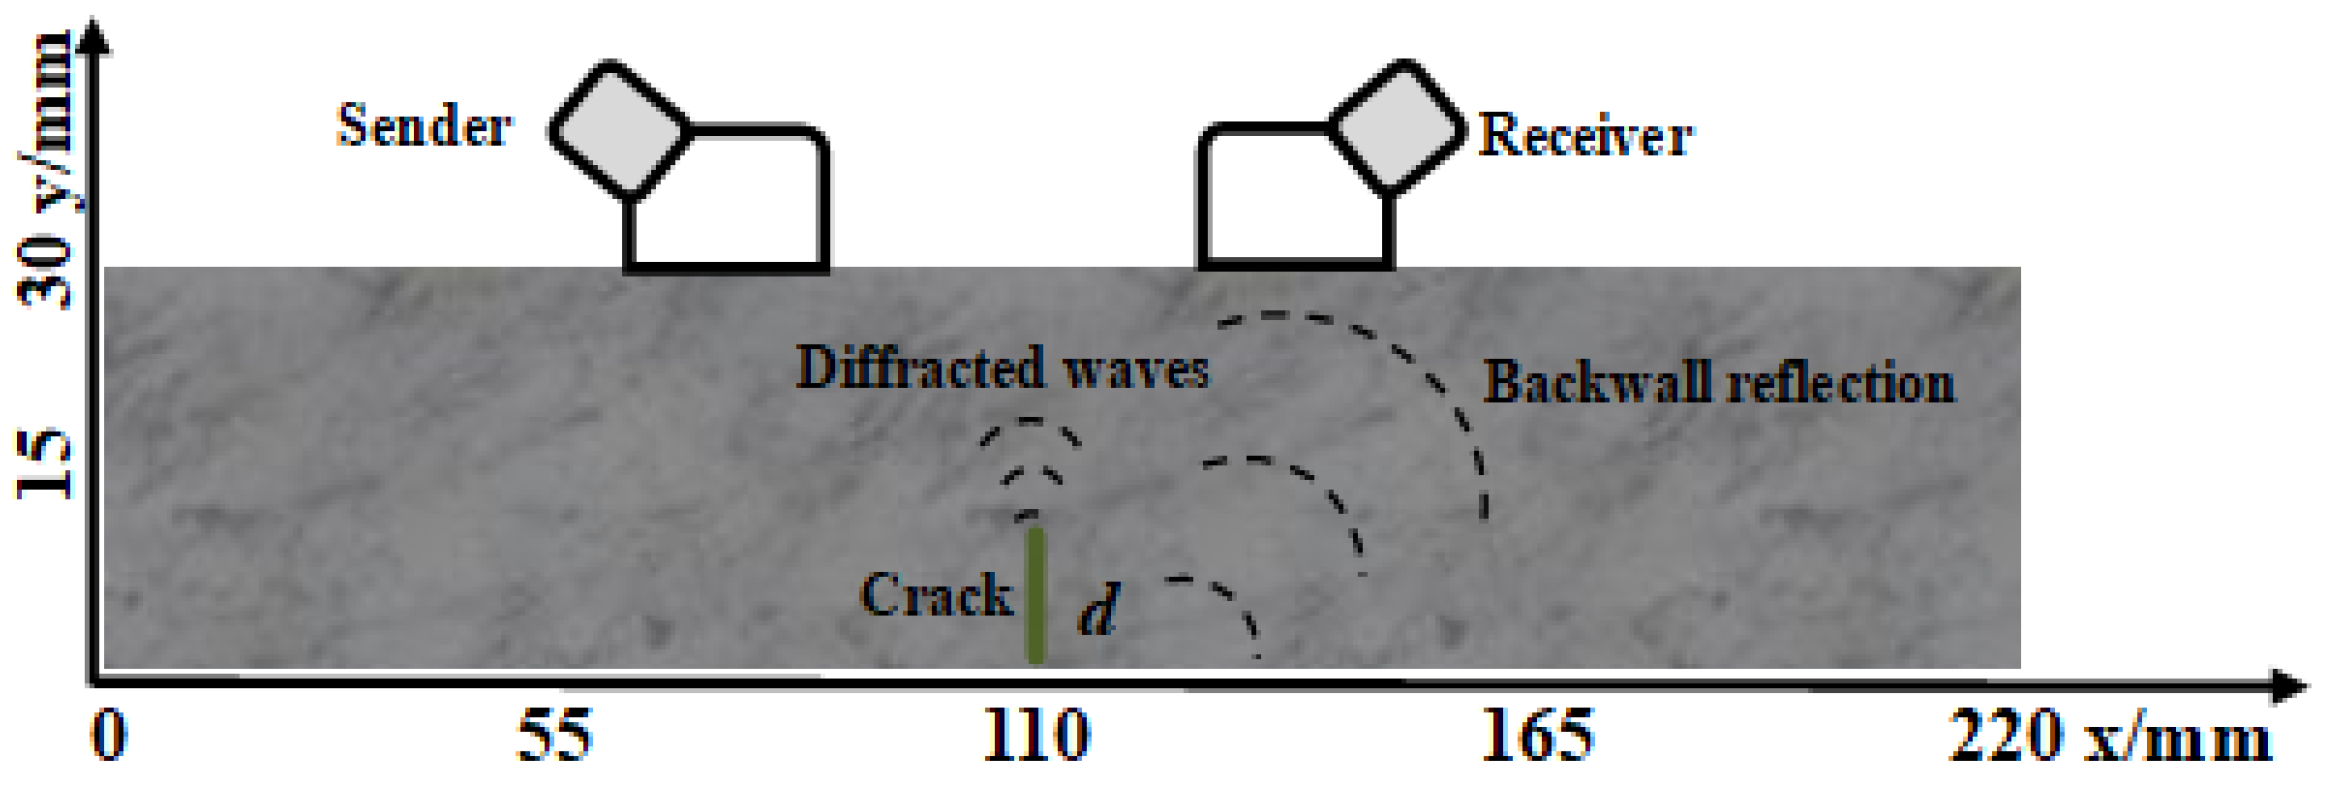
A two-dimensional model of a steel board embedded with a single crack was simulated by using a commercial software (Comsol Multiphysics V4.3a. COMSOL, Inc., Palo Alto, CA, USA). Figure 1 shows the schematic illustration of an ultrasonic measurement system in the simulation. Two longitudinal transducers with 60° wedge as the transmitter were typically used to carry out the ultrasonic inspection on the top surface of the steel board with the length of 220 mm and the height of 30 mm. A fixed distance between the two transducers was kept at a constant interval to make sure the first back wall echo was fully collected by the receiver. The single crack with a depth of d was located at the middle of the steel board along the x direction, i.e., x = 110 mm.
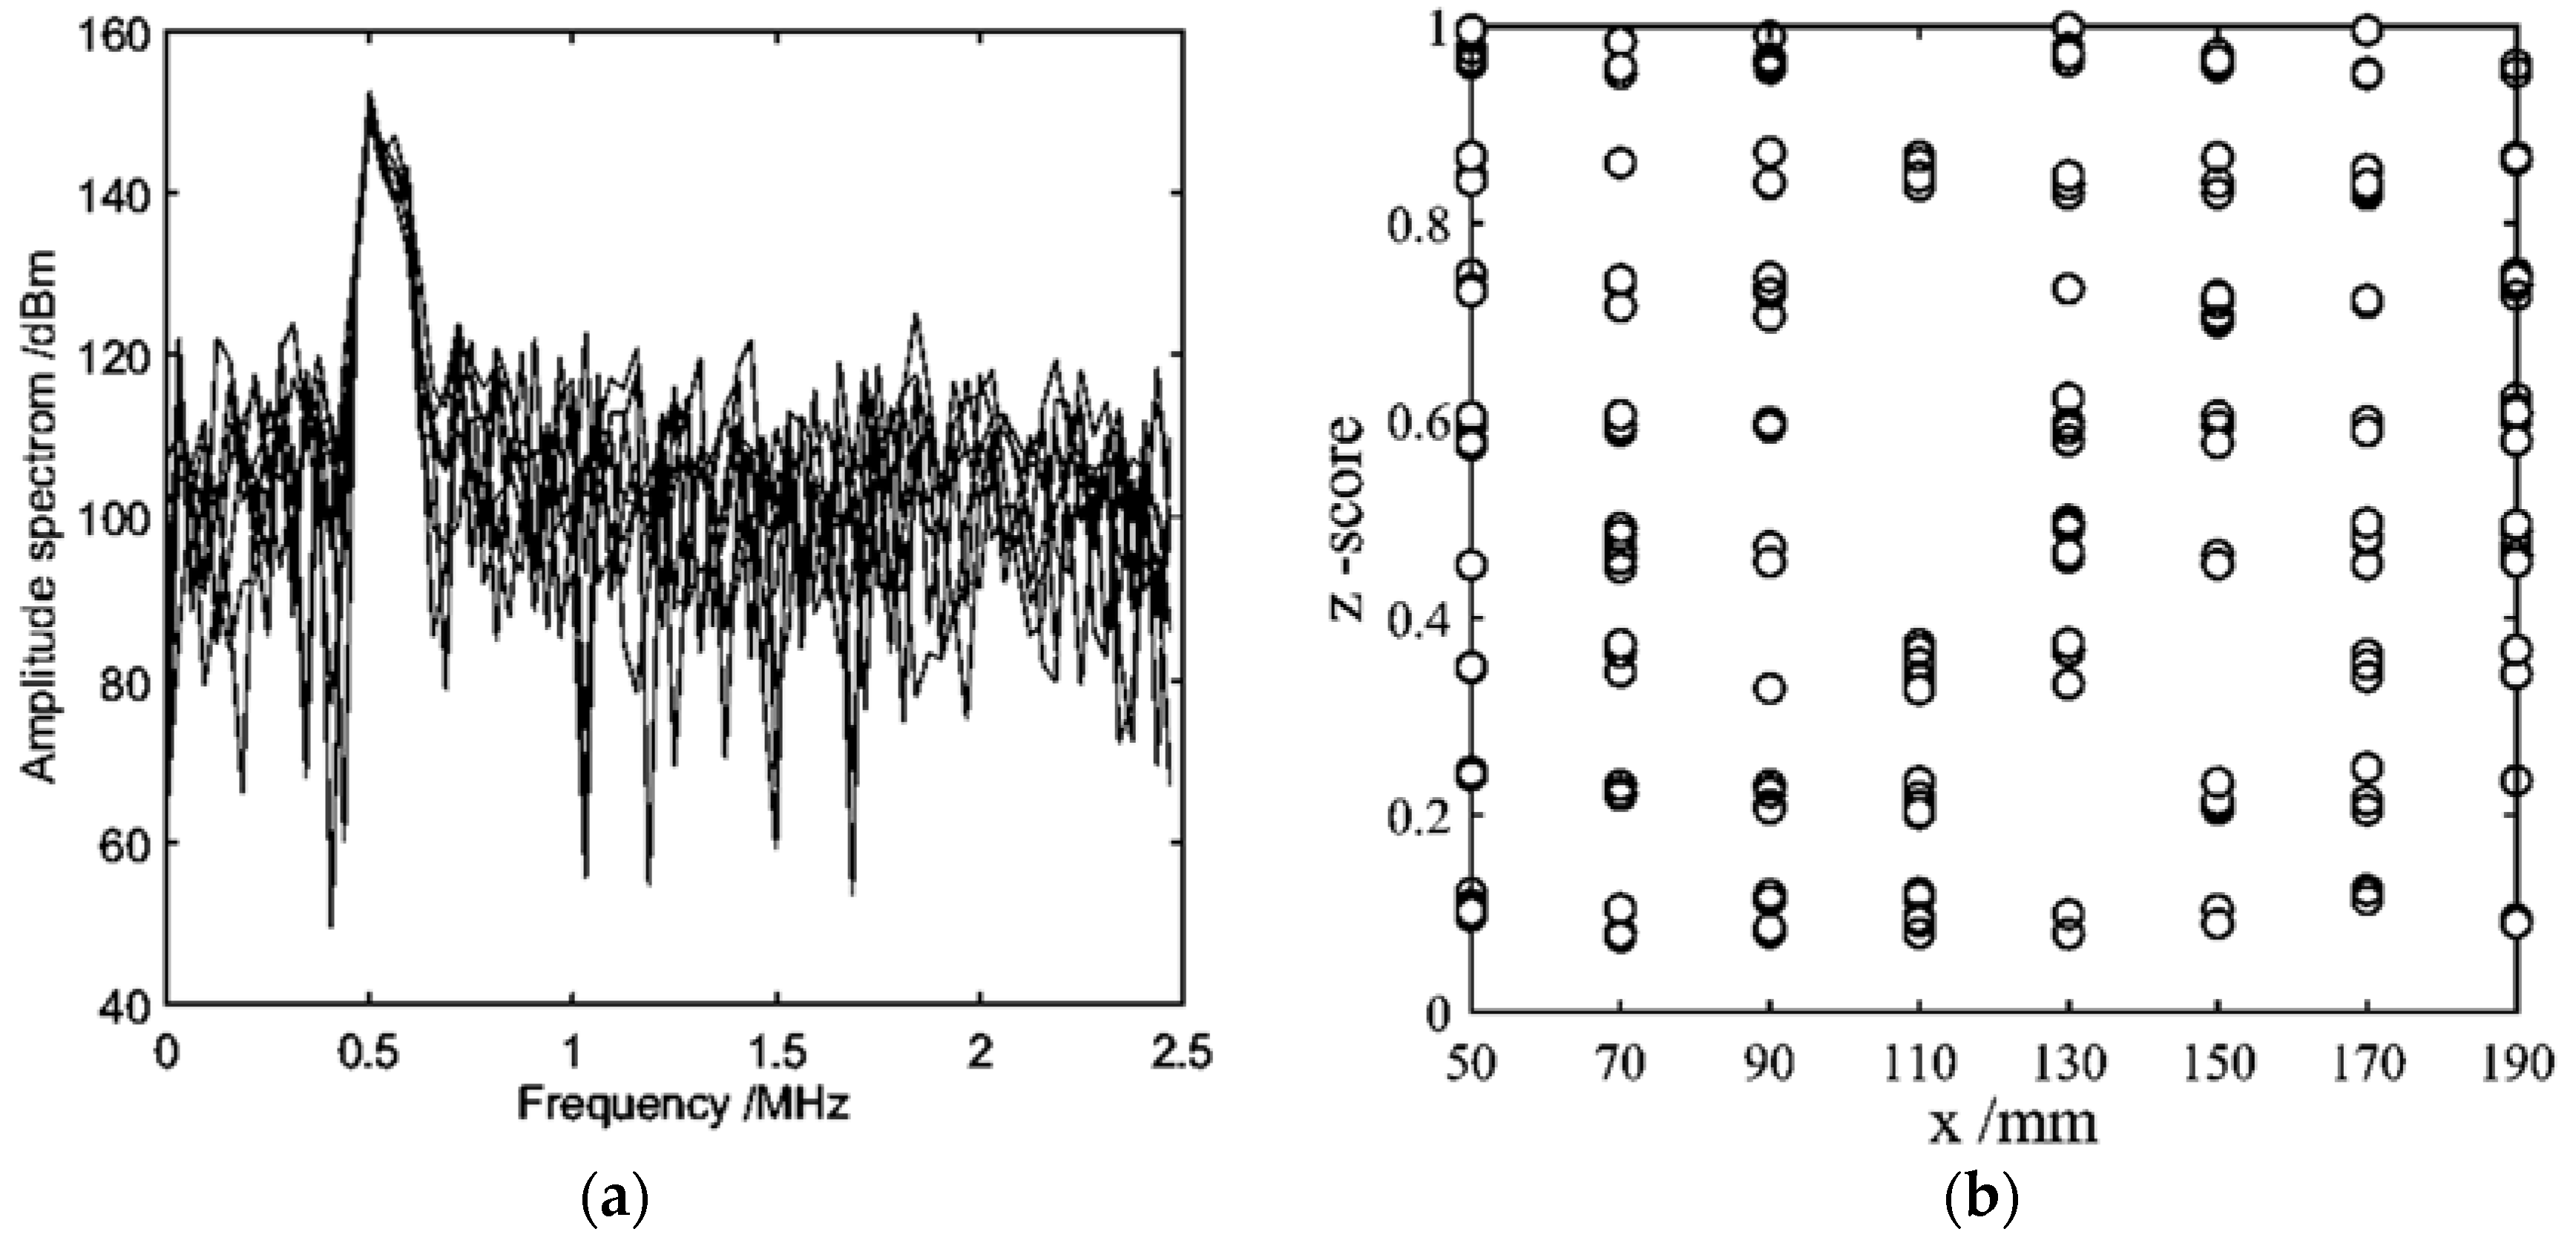
A 0.5 MHz continuous sinusoidal signal with signal-noise ratio (SNR) of 15 dB was applied as the exciting signal. Both the transmitter and the receiver were moved simultaneously to scan the steel board along the x direction. The receiving waveforms, at eight different positions, were spaced by 20 mm on the top of the simulated steel board, recorded, and the corresponding spectrums were then analyzed. Figure 2a depicts spectrums at eight positions of the simulated steel board with crack length d = 2 mm.
According to the COSMO algorithm model, the corresponding spectrums, at eight different observation positions, were saved then a group of z-scores were calculated by Equation (2) after every scanning process, finally 30 groups of z-score were obtained by scanning repeatedly 30 times. It is clearly shown in Figure 2b that z-score of observation points are distributed almost evenly between 0.3 and 1 except x = 110 mm, while most of z-score at x = 110 mm are mainly distributed below 0.4, just right at the crack’s position. It is shown that the distribution of z-scores could be used to locate and identify cracks or defects in materials, i.e., z-score of damaged regions might be below 0.4. However, the conclusions need to be subjected to hypothesis tests to reach statistical significance, which determines whether a null hypothesis can be rejected or retained.
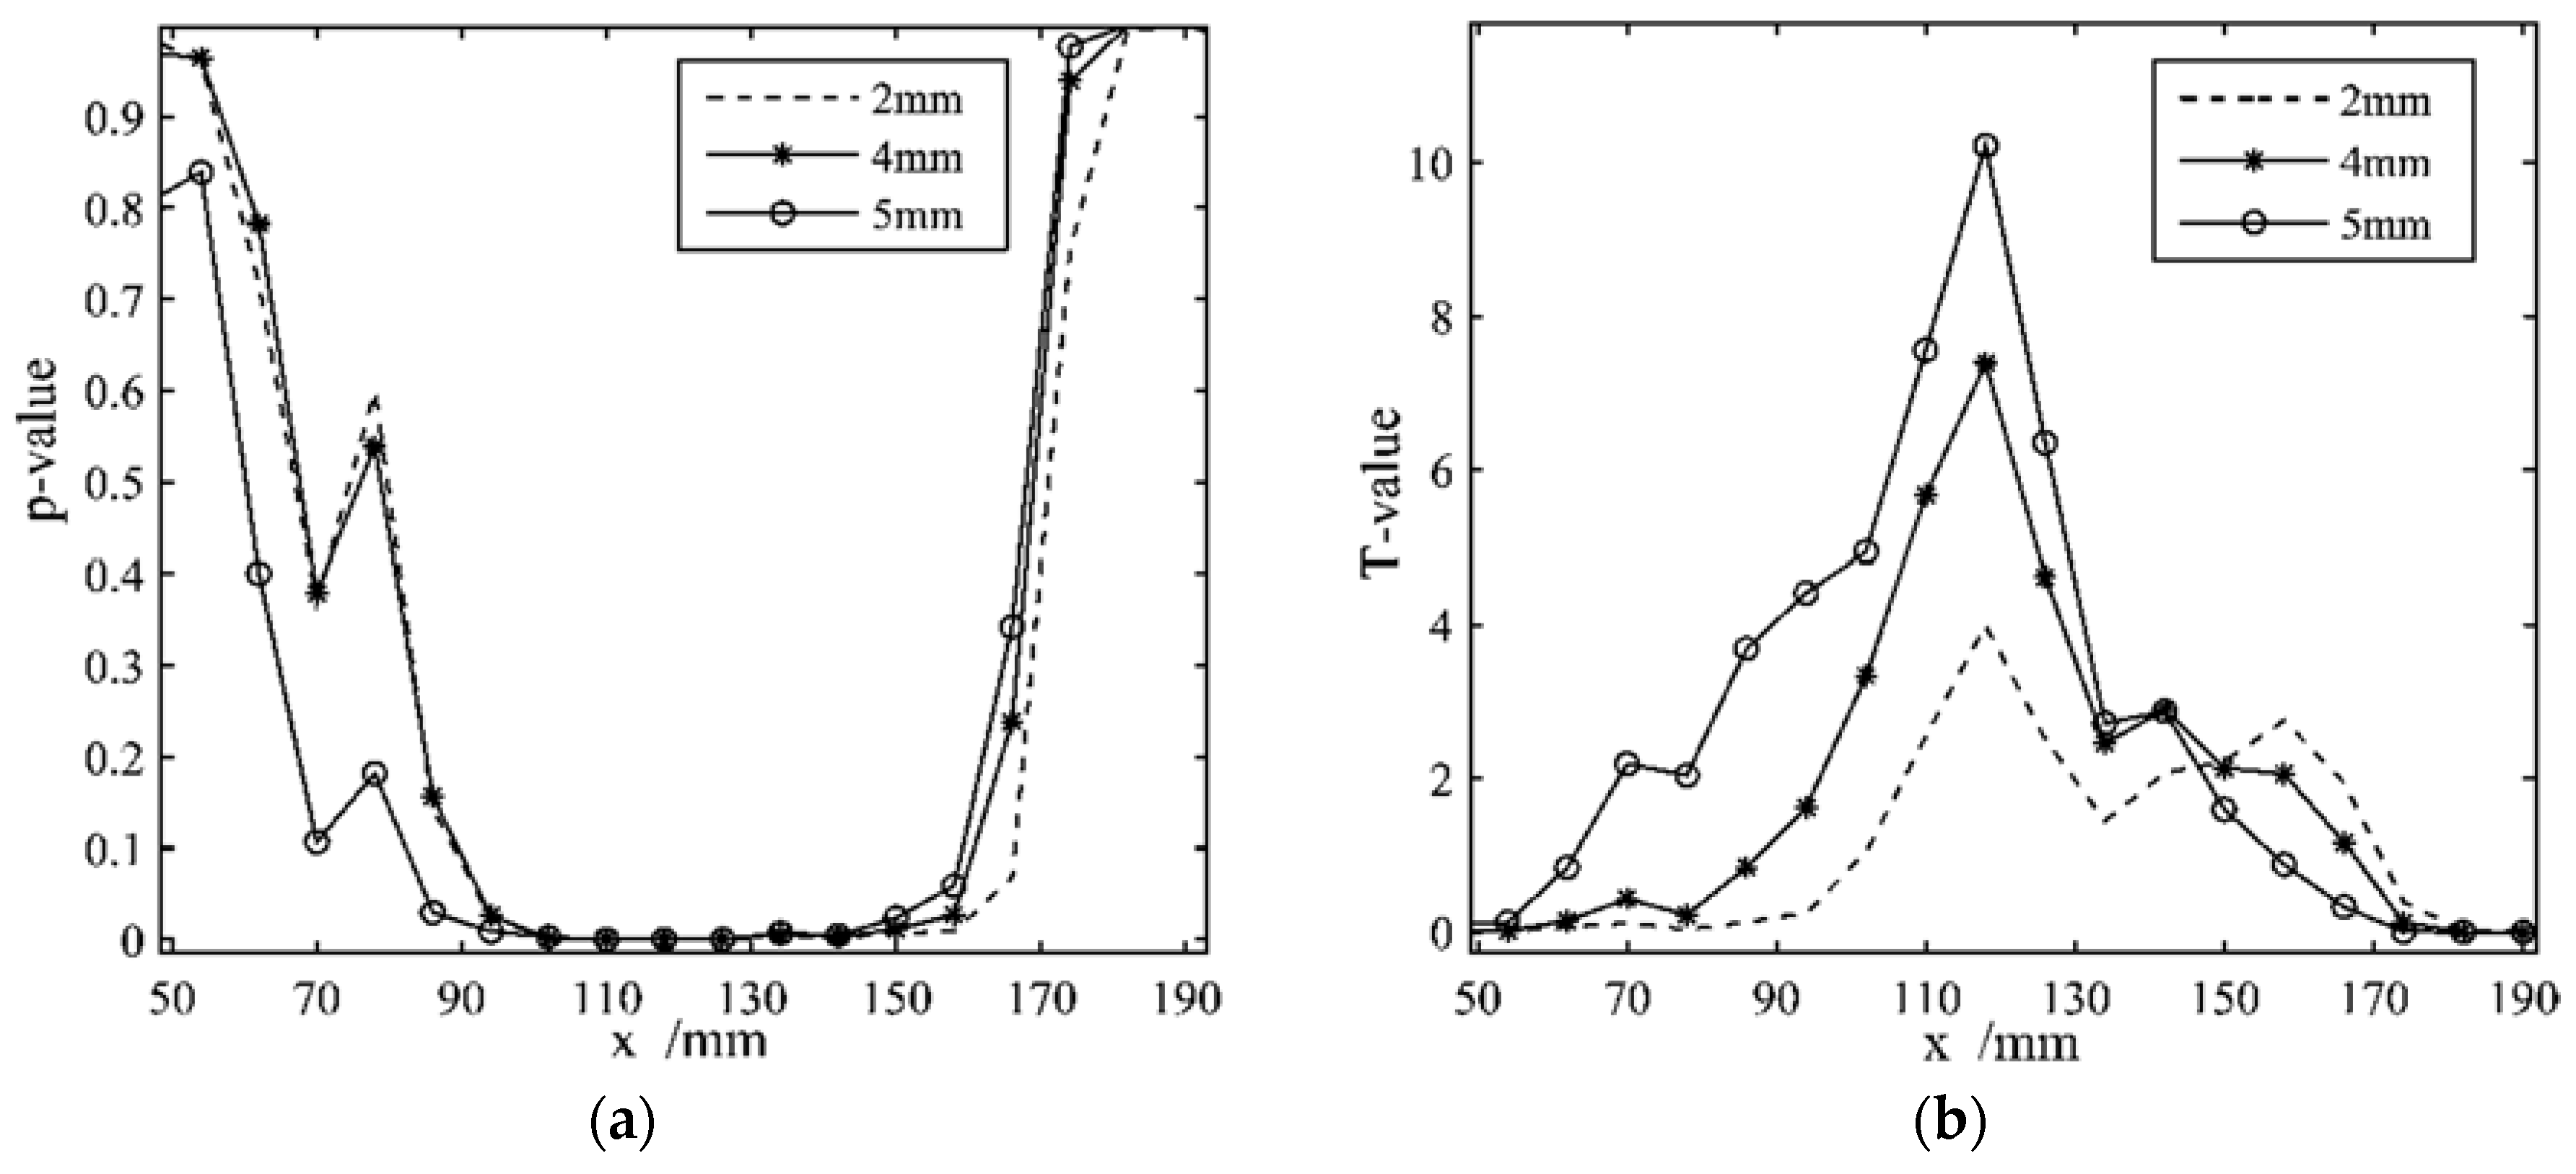
Figure 3a shows the calculated level of significance testing for crack depth of 2, 4, and 5 mm by Equation (4). It could be seen from Figure 3a that the p-value has a much smaller value than 0.1 around the crack region from 90 to 150 mm, which suggests that the imperfect structure of this region is significant. To make the comparisons and analysis clearly, an indicator called deviation level is defined as,
i.e., logarithm transformed p-value, obviously the small T-value indicates little significant probability of crack. The T-value curve of significance testing is shown in Figure 3b. Obviously, the maximum T-value occurs around the position of crack (x = 110 mm) for crack depth of d = 2, 4 and 5 mm, respectively. Furthermore, the maximum T-value increases simultaneously as crack growth, e.g., the maximum T-value is close to 4 when crack depth is 2 mm, and the peak of T-value up to 10 when crack depth equal to 5. This result indicates that the higher level T-value is strongly correlated with the crack depth, which could become an index to exhibit the evolution of crack growth inside materials.
T = −lg(p),
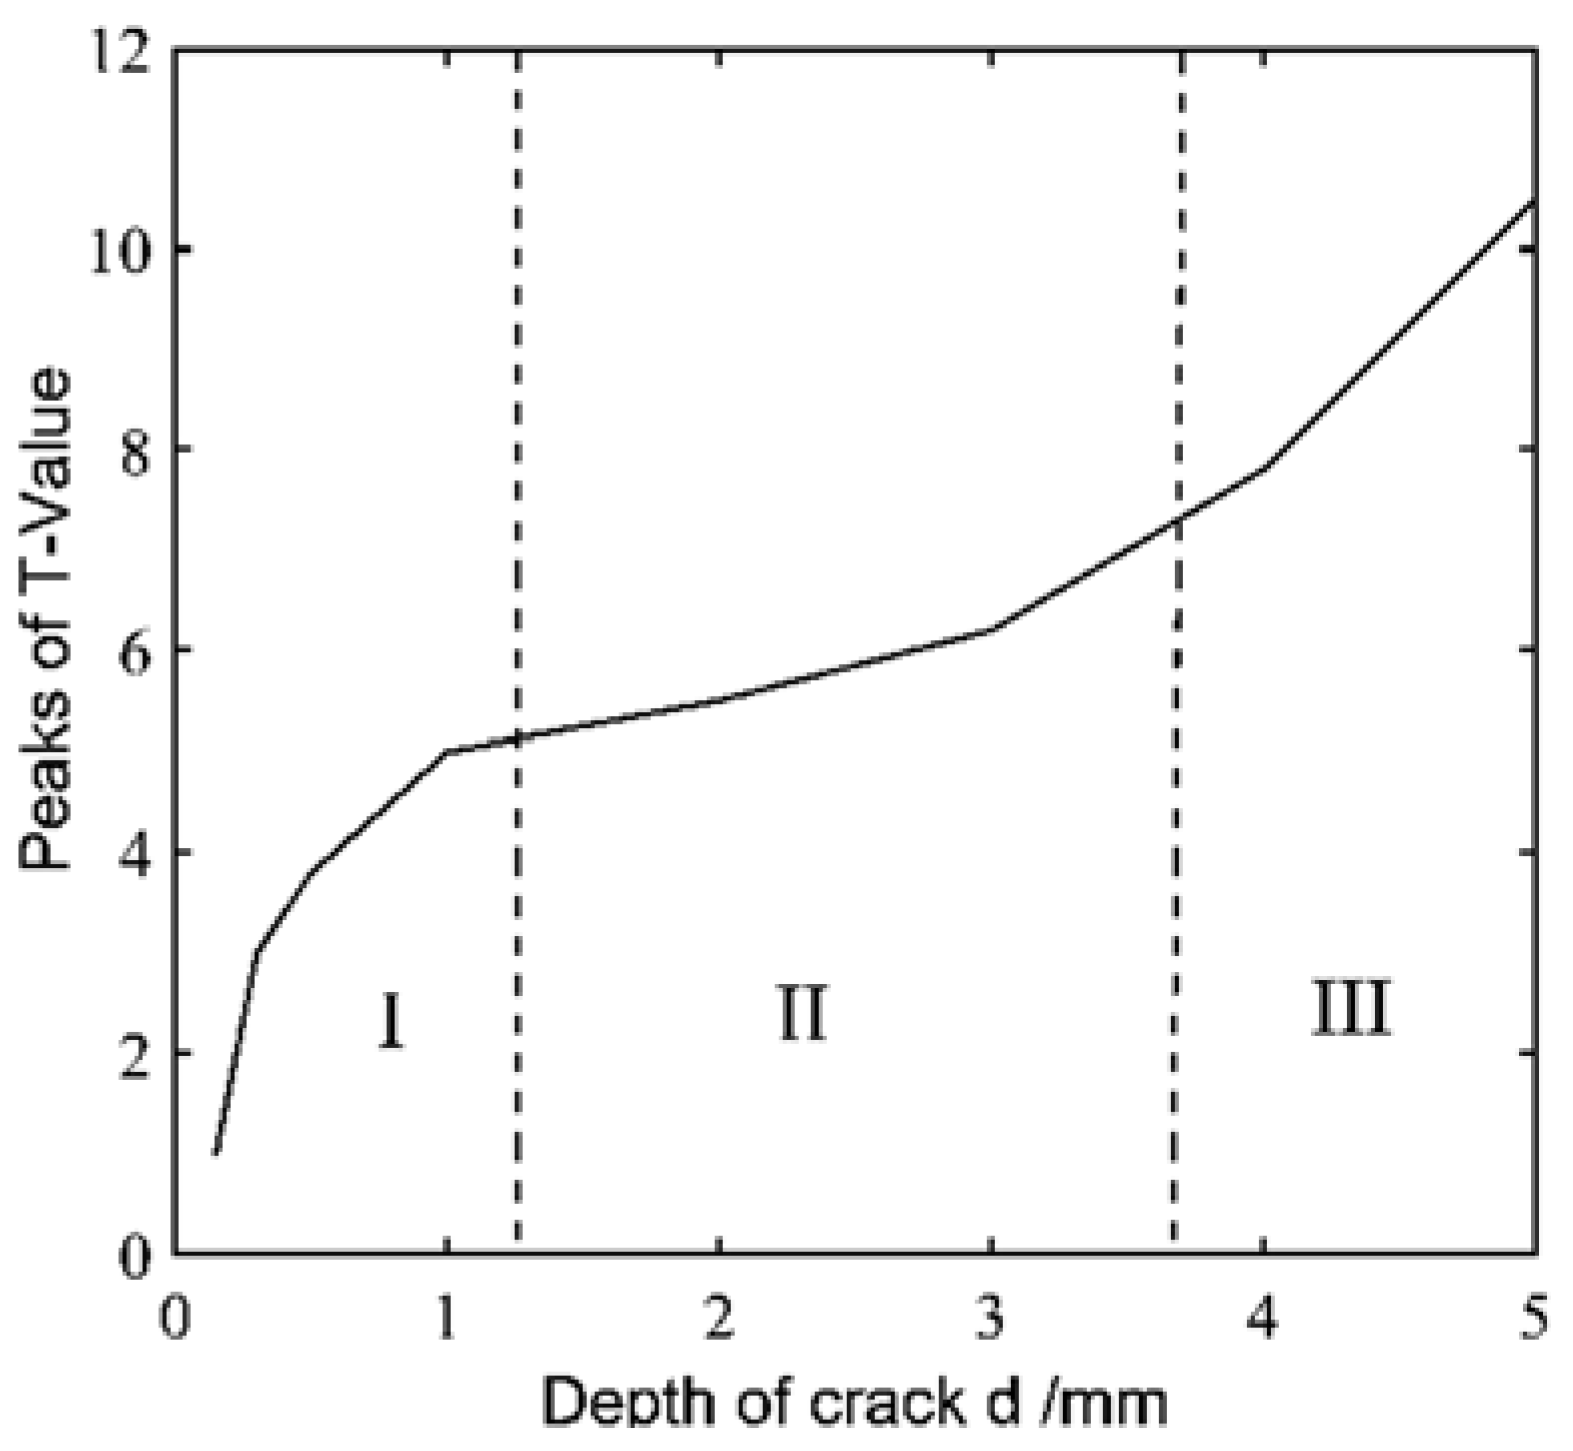
When the crack depth changed from 0 mm to 5 mm, the peaks of T-value around the cracks were obtained and thus the relationship curve between the maximum T-value and crack depth d was plotted, as shown Figure 4. It can be seen that as the crack depth increased from 0 to 1, the slope of the curve sharply increased. When crack depth was less than 1 mm, the T-value was not larger than 5, which is basically considered the formation stage of crack, due to the relative small change of crack depth, thus this phase is called stage I. As the crack depth gradually expanded form 1.5 mm to 3.7 mm, the maximum T-value increased slowly from 5 to 7, at stage II. When crack depth was larger than 4 mm, at stage III, the value of the curve increased rapidly up to 10, and as high as 2 times than that of stage I, which means that the small cracks had already expanded to macro-cracks. Therefore, the peaks of T-value might track the progression of damage and evaluate the evolution of crack growth.
3.2. Experimental Measurement
A specimen made of Q235 (See Table 1) with dimensions 800 mm × 250 mm × 20 mm was used in the experimental measurement, as shown in Figure 5. Four sections embedded with cracks with average depth of 6 mm, 2 mm, 1 mm, and 0.5 mm were manufactured in the specimen, mainly located at 150 mm, 300 mm, 450 mm, and 600 mm, respectively, denoted by B, C, D and E. Additionally, Section A and F represented as undamaged regions located in the two ends of the specimens. A portable TOFD ultrasonic detector (PXUT-920, Nantong Union Digital Tech., China) was used to excite a narrow-pulse acoustic signal with 200 ns in width and stored the echo signals from inspected cracked region. Scanning was manually carried out by a scanner unit with one pair of 5 MHz normal transducer, i.e., the transmitter and the receiver, with 60° wedges for longitudinal waves. Two transducers, spaced 62 mm apart, were located at equidistant over the crack region center, and scanning was done by moving the scanner in the length direction of steel plate parallel to the crack region. The echo signal sampled by the detector, containing 1496 points, was acquired every 0.5 mm along the length direction. After a scanning, a total of 1600 echo signals (A-scan) were obtained and stored in the ultrasonic detector.
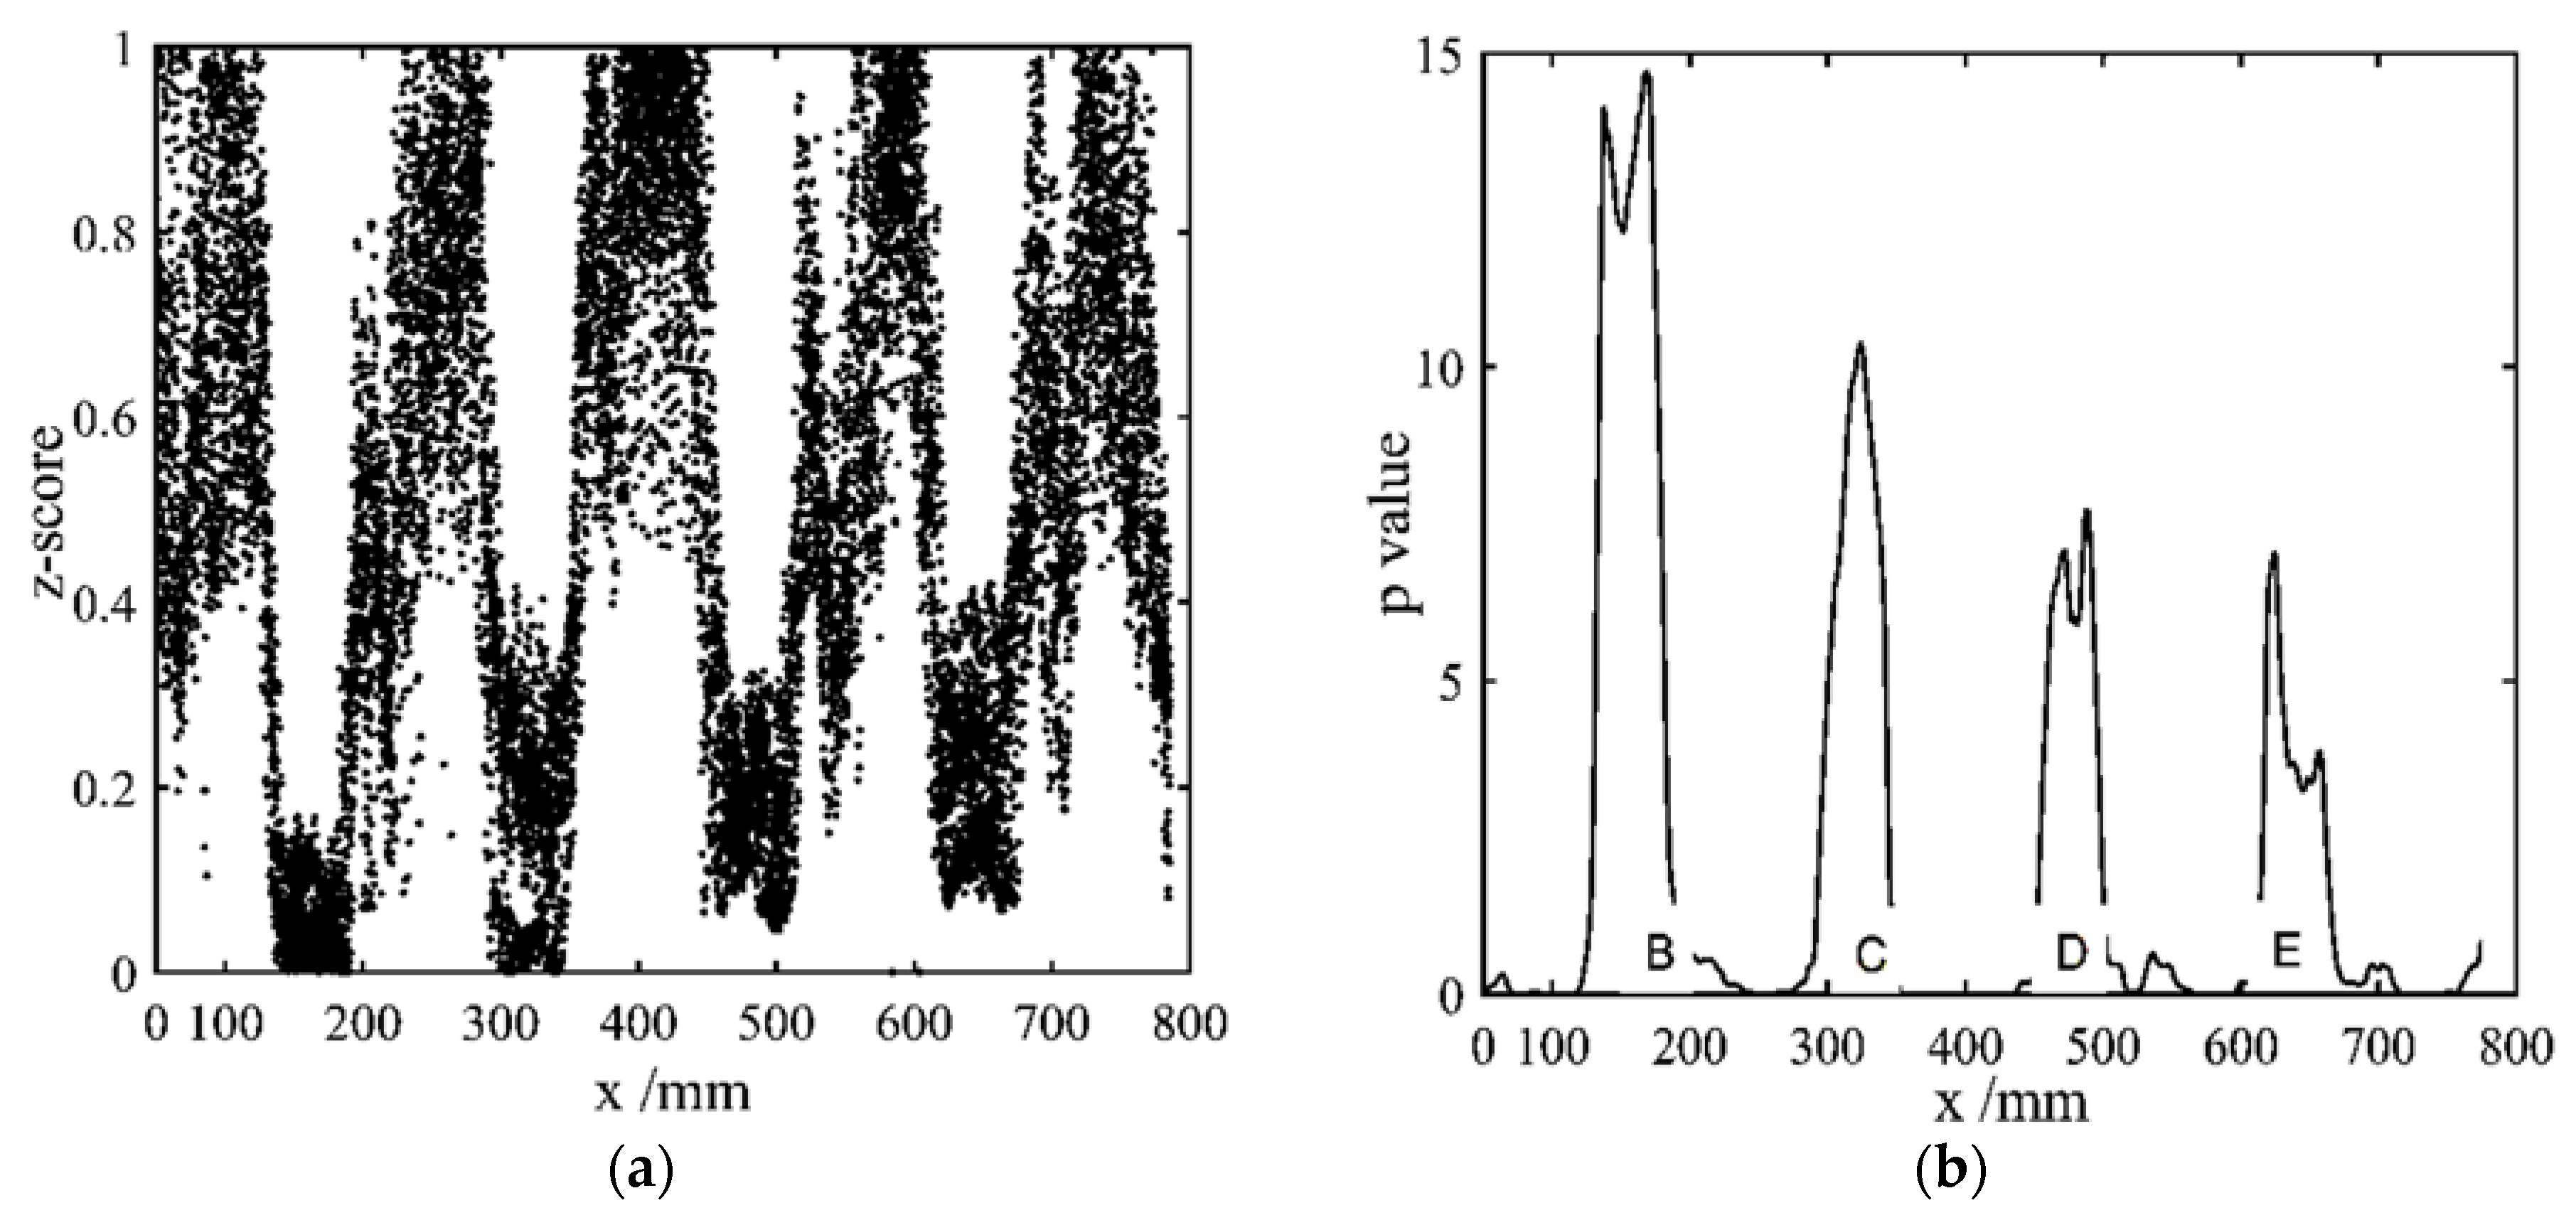
COSMO method was applied to analyze this dataset of echo-signal recorded by TOFD ultrasonic detector. Firstly, the Hellinger distance matrix D was constructed using Equation (1), and the row with minimum sum was chosen in the metric D so that the z-score could be determined using Equation (2). Figure 6a shows the z-score distribution for 30 scanning. It is shown that the z-score in undamaged sections is much larger than those in the region with cracks. For example, the z-score for positions A and F are about 0.4~1, while those for positions B, C, D and E are below 0.4. The results suggest that the z-score is closely related to cracks of specimen, just as the simulated results.
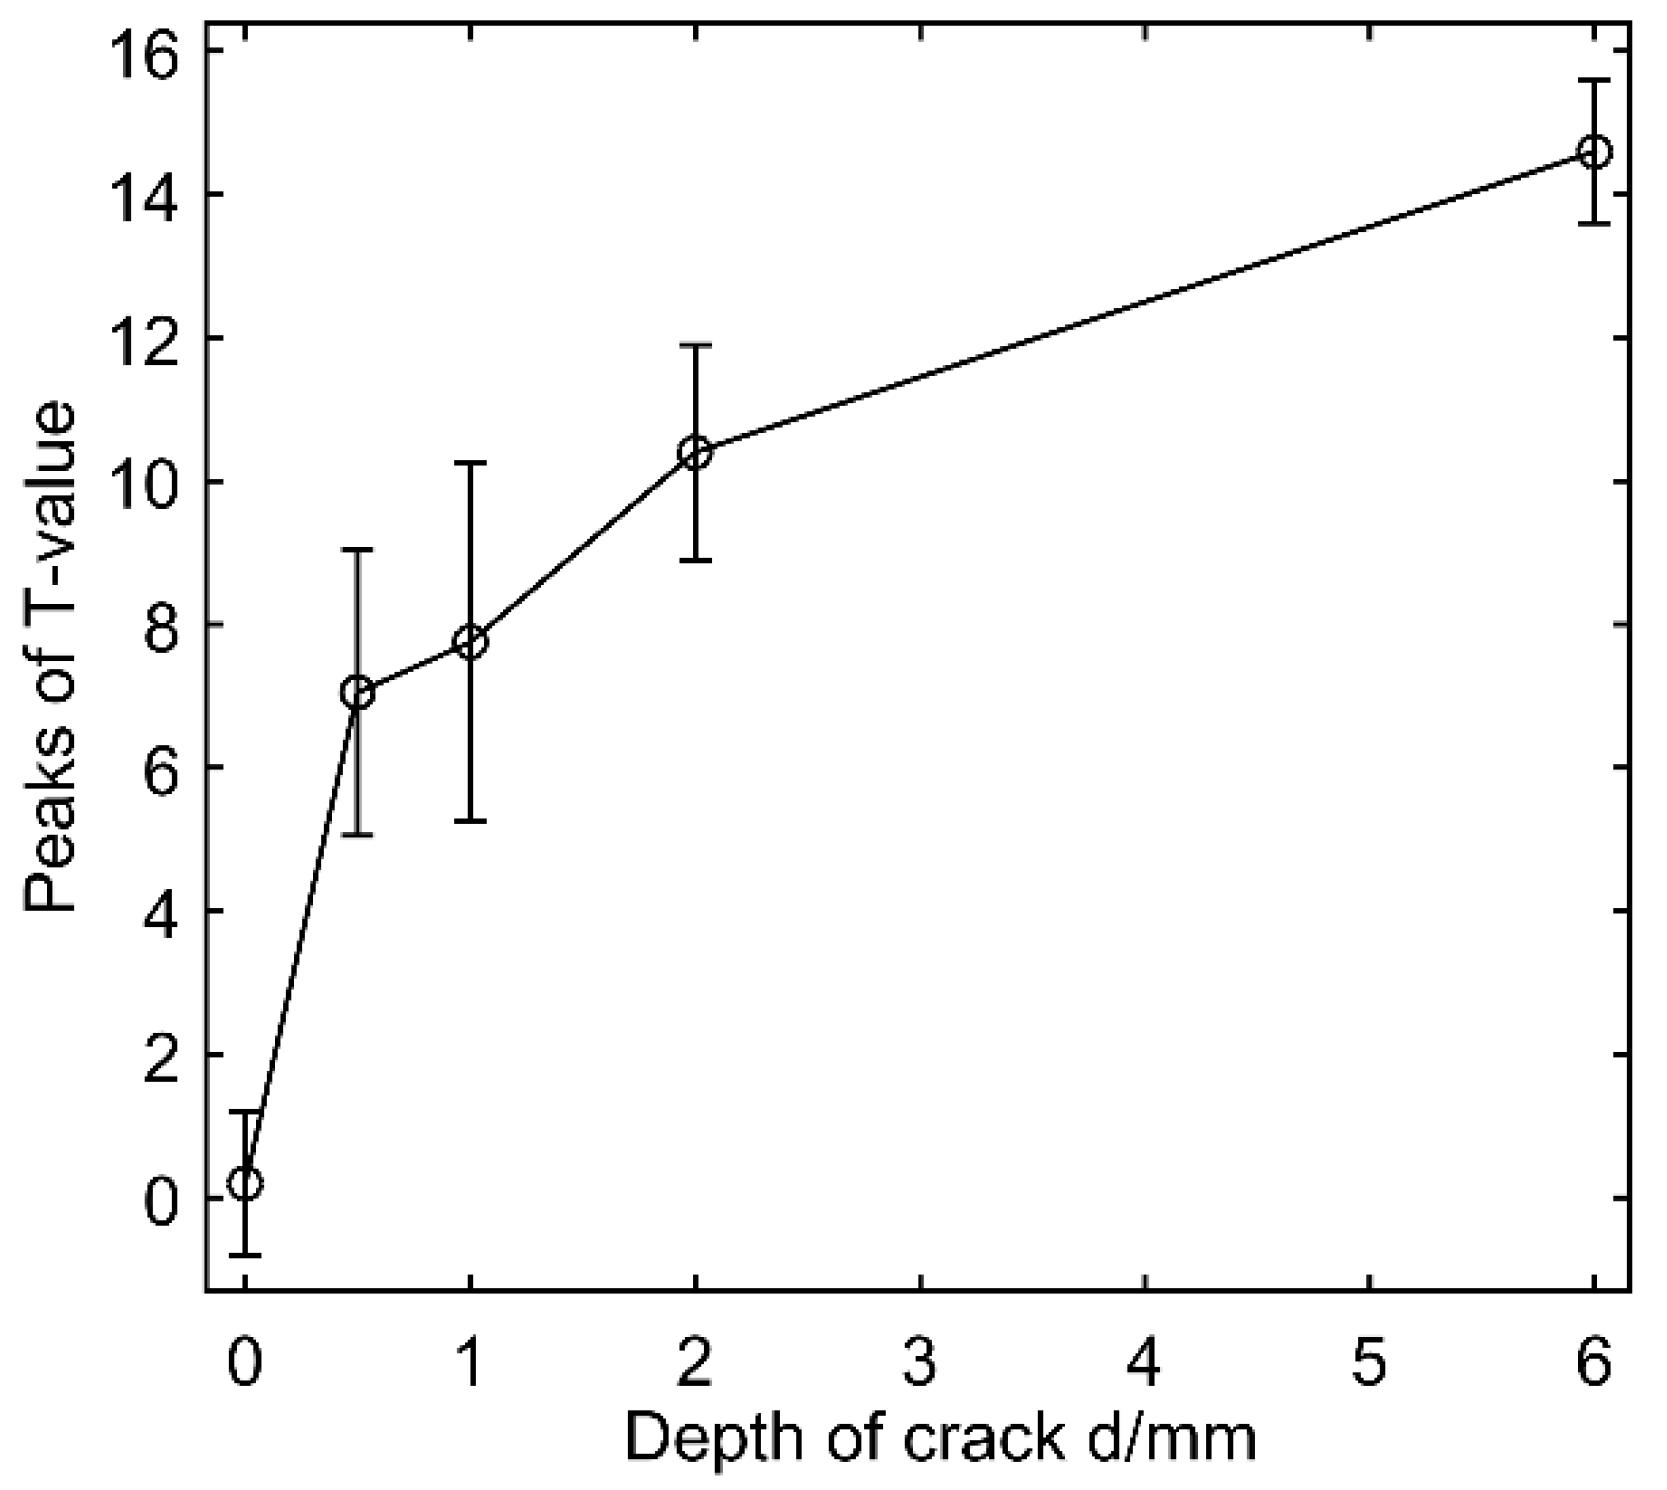
By using Equations (1)~(4) and (5), the deviation level T-Value is calculated to make a significant analysis. It can be observed from Figure 6b that the T-value at B, C, D and E are of high level compared to those in uncracks region. For instance, the T-value at x = 150 up to 13, and T- value at x = 600 sharply increasing from 0 to 7, but T-value of sections without cracks almost equal to 0, far less than T-value at crack region. In addition, T-value increase almost linearly with the depth of cracks. The relationship curve between the peaks of T-value and crack depth is plotted in Figure 7. It is shown that the peak of T value increases with crack growth from 0 to1.5 mm quickly up to 5, which is exactly in stage I. When the crack depth is larger than 2, the slope of curve go slow but still faster than the simulated results. It is worth noting that the change of slope is not distinct enough to easily recognize stage II or III when depth of crack exceeding 1.5 mm, different from the simulated curve, which might attributed to the result of multi-physical mechanisms.
4. Conclusions
Defects or cracks can significantly increase acoustic non-linearity, and the nonlinear acoustical parameters, and thereby can be exploited to evaluate the state of material damage. However, the harmonics are usually too weak to be detected in early fatigue. Therefore, the non-linear ultrasonic technique is rarely used to qualify crack growth. In this work, the COSMO method was applied to compare the spectrum of different positions by ultra-sonic scanning in order to obtain the distribution of z-scores as well as the corresponding significance level in every scanning position. The results show that: (1) the z-scores in the location with cracks are distributed below 0.4, while the z-scores in the location without cracks are above 0.4; (2) the deviation level T - value at locations with crack are much larger than those at locations without cracks, and the T-value would get larger with the increase of crack depth; (3) based on the quantitative relations between the T values and the crack depth, we can evaluate and monitor the online state of the structural health by COSMO model. However, it is noted that the COSMO model is still a simple model that does not consider some other factors, such as the shape and mechanical properties of structure, as well as the requirements on data size. Therefore, the reliability of COSMO needs to be further optimized to reach a solution for non-destructive evaluation in future.
Author Contributions
D.Z., conceived and designed the experiments. X.T., and X.Z., performed the experiments. X.T., X.Z., and Y.F., analyzed the data. X.T., X.Z., and D.Z., wrote the manuscript.
Funding
This research was funded by the National Natural Science Foundation of China (Grant no’s., 81627802, 11674173 and 11874216), QingLan Project, and the Fundamental Research Funds for the Central Universities.
Conflicts of Interest
The authors declare no conflict of interest.
References
- Broda, D.; Staszewski, W.J.; Martowicz, A.; Uhl, T.; Silberschmidt, V.V. Modelling of nonlinear crack–wave interactions for damage detection based on ultrasound—A review. J. Sound Vib. 2014, 333, 1097–1118. [Google Scholar] [CrossRef]
- Novak, A.; Bentahar, M.; Tournat, V.; Guerjouma, R.; Simon, L. Nonlinear acoustic characterization of micro-damaged materials through higher harmonic resonance analysis. NDT E Int. 2012, 45, 1–8. [Google Scholar]
- Donskoy, D.; Sutin, A.; Ekimov, A. Nonlinear acoustic interaction on contact interfaces and its use for nondestructive testing. NDT E Int. 2001, 34, 231–238. [Google Scholar]
- Nagy, P.B. Fatigue damage assessment by nonlinear ultrasonic materials characterization. Ultrasonics 1998, 36, 375–381. [Google Scholar] [CrossRef]
- Dos Santos, S.; Vejvodova, S.; Prevorovsky, Z. Nonlinear signal processing for ultrasonic imaging of material complexity. Proc. Est. Acad. Sci. 2010, 59, 108–117. [Google Scholar] [CrossRef]
- Jhang, K.Y. Nonlinear ultrasonic techniques for nondestructive assessment of micro damage in material: A review. Int. J. Precis. Eng. Manuf. 2009, 10, 123–135. [Google Scholar] [CrossRef]
- Guo, X.; Zhang, D.; Zhang, J. Detection of fatigue-induced micro-cracks in a pipe by using time-reversed nonlinear guidedwaves: A three-dimensional model study. Ultrasonics 2012, 52, 912–919. [Google Scholar] [CrossRef]
- Blanloeuil, P.; Rose, L.F.; Veidt, M.; Wang, C.H. Time reversal invariance for a nonlinear scatterer exhibiting contactacoustic nonlinearity. J. Sound Vib. 2018, 417, 413–431. [Google Scholar] [CrossRef]
- Ostrovsky, L.A.; Johnson, P.A. Dynamic nonlinear elasticity in geomaterials. La Rivista Del Nuovo Cimento 2008, 24, 1–46. [Google Scholar]
- Hall, D.A. Review Nonlinearity in piezoelectric ceramics. J. Mater. Sci. 2001, 36, 4575–4601. [Google Scholar] [CrossRef]
- Zhenggan, Z.; Siming, L. Nonlinear Ultrasonic Techniques Used in Nondestructive Testing: A Review. J. Mech. Eng. 2011, 47, 2–9. [Google Scholar]
- Gang, Q.; Steven, F.W. A Framework of Data-Enabled Science for Evaluation of Material Damage Based on Acoustic Emission. J. Nondestruct. Eval. 2014, 33, 597–615. [Google Scholar]
- Sollier, T.; Blain, C. IRSN preliminary analysis on statistical methods for NDE performances assessment. In Proceedings of the 12th International Conference on Non-Destructive Evaluation in Relation to Structural Integrity for Nuclear and Pressurized Components, Dubrovnik, Croatia, 4–6 October 2016; pp. 1–10. [Google Scholar]
- Keprate, A.; Ratnayake, R.M.C. Probability of Detection as a Metric for Quantifying NDE Reliability: The State of The Art. J. Pipeline Eng. 2015, 14, 199–209. [Google Scholar]
- Schneider, C.R.A.; Rudlin, J.R. Review of statistical methods used in quantifying NDT reliability. Insight-Non-Destruct. Test. Cond. Monit. (INSIGHT) 2004, 46, 77–79. [Google Scholar]
- Lu, C.J.; Meeker, W.Q. Using Degradation Measures to Estimate a Time-to-Failure Distribution. Technometrics 1993, 35, 161–174. [Google Scholar] [CrossRef]
- Wu, S.; Tsai, T. Estimation of time-to-failure distribution derived from a degradation model using fuzzy clustering. Qual. Reliab. Eng. Int. 2015, 16, 261–267. [Google Scholar] [CrossRef]
- Batzel, T.D.; Swanson, D.C. Prognostic Health Management of Aircraft Power Generators. IEEE Trans. Aerosp. Electron. Syst. 2009, 45, 473–482. [Google Scholar] [CrossRef]
- Lakhtakia, A. Transition from Nondestructive Testing (NDT) to Structural Health Monitoring (SHM): Potential and challenges. SPIE Smart Struct. Nondestruct. Eval. 2014, 9055, 90550Z. [Google Scholar]
- Gebraeel, N.Z.; Lawley, M.A.; Li, R. Residual-Life Distributions from Component Degradation Signals: A Bayesian Approach. IIE Trans. 2005, 37, 543–557. [Google Scholar] [CrossRef]
- Zhou, W.; Zh, L.V.; Wang, Y.R. Acoustic Response and Micro-Damage Mechanism of Fiber Composite Materials under Mode-II Delamination. Chin. Phys. Lett. 2015, 32, 046201. [Google Scholar] [CrossRef]
- Kůs, V.; Tláskal, J.; Farová, Z.; Santos, D.S. Signal detection, separation & classification under random noise background. In Proceedings of the 13th Biennial Baltic Electronics Conference, Tallinn, Estonia, 3–5 October 2012; pp. 287–290. [Google Scholar]
- RÖgnvaldsson, T.; Norrman, H.; Byttner, S.; Järpe, E. Estimating p-values for deviation detection. In Proceedings of the IEEE Eighth International Conference on Self-Adaptive and Self-Organizing Systems, London, UK, 8–12 September 2014; pp. 100–109. [Google Scholar]
- Fan, Y.T.; Nowaczyk, S.; RÖgnvaldsson, T. Evaluation of Self-Organized Approach for Predicting Compressor Faults in a City Bus Fleet. Procedia Comput. Sci. 2015, 53, 447–456. [Google Scholar] [CrossRef]
- Teng, X.; Fan, Y.; Nowaczyk, S. Evaluation of micro-flaws in metallic material based on a self-organized data-driven approach. In Proceedings of the 2016 IEEE International Conference on Prognostics and Health Management (ICPHM), Ottawa, ON, Canada, 20–22 June 2016; pp. 1–5. [Google Scholar]
- Kim, J.Y.; Yakovlev, V.A.; Rokhlin, S.I. Parametric modulation mechanism of surface acoustic wave on a partially closed crack. Appl. Phys. Lett. 2003, 82, 3203–3205. [Google Scholar] [CrossRef]
- Krüger, S.E.; Rebello, J.M.A.; Camargo, P.C. Hydrogen damage detection by ultrasonic spectral analysis. NDT E Int. 1999, 32, 275–281. [Google Scholar]
- Hillis, A.J.; Neild, S.A.; Drinkwa, B.W.; Wilcoxter, P.D. Global crack detection using bispectral analysis. Proc. R. Soc. A 2006, 462, 1515–1530. [Google Scholar] [CrossRef] [Green Version]
Figure 1.
Schematic illustration of scanning on a simulated specimen with a single crack.

Figure 2.
(a) Spectrums and (b) z-score distribution of echoes at eight monitoring points (depth of crack d = 2 mm) along x direction.
Figure 2.
(a) Spectrums and (b) z-score distribution of echoes at eight monitoring points (depth of crack d = 2 mm) along x direction.

Figure 3.
The calculated level of significance testing (a) p-value curve and (b) deviation level T-value curve can be plotted for crack depth of 2, 4 and 5 mm by Equations (4) and (5) along x direction on the simulated board.
Figure 3.
The calculated level of significance testing (a) p-value curve and (b) deviation level T-value curve can be plotted for crack depth of 2, 4 and 5 mm by Equations (4) and (5) along x direction on the simulated board.

Figure 4.
Deviation level T-value grows monotonically as depth of crack increases.

Figure 5.
(a) A specimen with four cracks with average depth of (b) 6 mm, (c) 2 mm, (d) 1 mm, and 0.5 mm located at Section B, C, D, E, respectively. Section A and F without cracks.
Figure 5.
(a) A specimen with four cracks with average depth of (b) 6 mm, (c) 2 mm, (d) 1 mm, and 0.5 mm located at Section B, C, D, E, respectively. Section A and F without cracks.

Figure 6.
(a) z-score distribution (b) the curve of T-value of specimen with cracks and along x direction.
Figure 6.
(a) z-score distribution (b) the curve of T-value of specimen with cracks and along x direction.

Figure 7.
The relationship curve of specimen between T-value peaks and crack depth.


Table 1.
Mechanical characteristics of Q235 carbon steel. (Provided by HBO Windpower Equipment Co., Ltd, Nantong, China).
Table 1.
Mechanical characteristics of Q235 carbon steel. (Provided by HBO Windpower Equipment Co., Ltd, Nantong, China).
| Grade | Elements (%) | Yield Strength (MPa) | Tensile Strength (MPa) | Elongation (%) | ||||
|---|---|---|---|---|---|---|---|---|
| C | Mn | Si | P | S | ||||
| Q235A | 0.14~0.22 | 0.30~0.65 | 0.30 | 0.045 | 0.030 | 235 | 375~460 | 21–26 |
© 2018 by the authors. Licensee MDPI, Basel, Switzerland. This article is an open access article distributed under the terms and conditions of the Creative Commons Attribution (CC BY) license (http://creativecommons.org/licenses/by/4.0/).
Share and Cite
MDPI and ACS Style
Teng, X.; Zhang, X.; Fan, Y.; Zhang, D. Evaluation of Cracks in Metallic Material Using a Self-Organized Data-Driven Model of Acoustic Echo-Signal. Appl. Sci. 2019, 9, 95. https://doi.org/10.3390/app9010095
AMA Style
Teng X, Zhang X, Fan Y, Zhang D. Evaluation of Cracks in Metallic Material Using a Self-Organized Data-Driven Model of Acoustic Echo-Signal. Applied Sciences. 2019; 9(1):95. https://doi.org/10.3390/app9010095
Chicago/Turabian StyleTeng, Xudong, Xin Zhang, Yuantao Fan, and Dong Zhang. 2019. "Evaluation of Cracks in Metallic Material Using a Self-Organized Data-Driven Model of Acoustic Echo-Signal" Applied Sciences 9, no. 1: 95. https://doi.org/10.3390/app9010095
Note that from the first issue of 2016, this journal uses article numbers instead of page numbers. See further details here.