Effect of Mix Proportion Parameters on Behaviors of Basalt Fiber RPC Based on Box-Behnken Model

College of Transportation, Jilin University, Changchun 130025, China
*
Author to whom correspondence should be addressed.
Appl. Sci. 2019, 9(10), 2031; https://doi.org/10.3390/app9102031
Submission received: 1 April 2019
/
Revised: 5 May 2019
/
Accepted: 13 May 2019
/
Published: 17 May 2019
(This article belongs to the Special Issue Fiber-Reinforced Concrete)
Abstract
:Basalt fibers are widely used in the modification of concrete materials due to its excellent mechanical properties and corrosion resistance. In this study, the basalt fibers were used to modify reactive powder concrete (RPC). The effect of four mix proportion parameters on the working and mechanical properties of basalt fiber reactive powder concrete (BFRPC) was evaluated by the response surface methodology (RSM). The fluidity, flexural and compressive strength were tested and evaluated. A statistically experimental model indicated that D (the silica fume to cement ratio) was the key of interactions between factors, affecting other factors and controlling properties of BFRPC. The increase in basalt fiber content had a remarkable effect on increasing the flexural and compressive strength when D = 0.2. The addition of basalt fiber obviously improved the mechanical properties of RPC. While when D = 0.4, the decrease of fiber content and the increase of quartz sand content could increase the compressive strength.
1. Introduction
Reactive powder concrete (RPC) is a class of high performance concrete characterized by high strength, long durability and good stability, which was developed in the 1990s [1]. It is characterized by eliminating coarse aggregate to improve matrix homogeneity and optimizing mixture particle gradation to enhance matrix compactness. Silicon-containing materials such as silica fume and fly ash are usually added into RPC as active components. SiO2 in these materials reacts with Ca(OH)2 and calcium silicate hydrate (C–S–H) produced by cement hydration to generate a cementitious substance [2], which can improve the microstructure of matrix [3]. The compressive strength of RPC can reach 200–800 MPa, which has superior mechanical properties compared with traditional concrete materials. However, as the strength increases, the brittleness of RPC also grows. To alleviate this, fibers are usually added to reinforce the toughness [4].
Due to the characteristics of great tensile strength and high extension coefficient elongation of fiber, it can effectively increase the ductility and the flexural strength of concrete [5]. Previous studies have found that organic fibers, inorganic fibers and metal fibers are all used as reinforcing materials in RPC, among which steel fiber is the most commonly used [6,7]. It has shown that the addition of steel fiber with a volume content of 0%–2% can effectively improve the ductility and compressive strength of RPC [8]. Meanwhile, Yin-Wen Chan et al. [9] found that the content of silica fume had an influence on the bonding effect of steel fiber in RPC matrix. The bond performance of steel fiber could be maximized when the silica fume content accounts for 30% of cement. Sukhoon Pyo et al. [10] reported that the Ultra-high performance concrete (UHPC) had a compact microstructure, which could prevent the steel fiber from being corroded by chloride ions. However, there are some problems in steel fiber reinforced concrete, such as increasing dead weight, fiber balling at high dosage, fluidity decrease and high cost. With these concerns in mind, researchers began to replace steel fibers with natural fibers, which have good performance, a low price and are lightweight.
Basalt fiber is a kind of environment-friendly material made of natural basalt ore [11]. In recent years, basalt fiber has been widely used in the reinforcement of concrete materials due to its excellent performance of mechanical characteristics, corrosion resistance, high temperature resistance and electrical insulation [12,13]. It has been confirmed that the enhancing effect of 12 kg/m³ basalt fiber on the strength of concrete is similar to that of 40 kg/m³ steel fiber under the action of bending and impact load [14]. For the 28-day compressive strength of ordinary concrete, the optimal content of 12 mm long basalt fiber is 4 kg/m³ and the optimal content of 36 mm long is 8 kg/m³ [15]. Since basalt fiber performs well in the strength enhancement of ordinary concrete, researchers then apply it to UHPC. Tehmina Ayub et al. [16] reported that when silica fume and kaolin were used instead of 10% cement in UHPC, the highest compressive strength of 84.08 MPa could be obtained at a volume content of 2% basalt fiber. Dehong Wang et al. [17] investigated that the compressive and flexural strength of UHPC could be increased by 14% and 22.8% respectively under the synergetic effect of basalt fiber and polypropylene fiber. However, there are seldom research on adding basalt fiber into RPC as reinforcing material, and most studies take fiber content as a single factor variable. The systematic analysis of the interaction between RPC mix parameters and basalt fiber has not been carried out. Realizing this issue, the goal of this work is to characterize the influence of multiple mix factors and basalt fiber interaction on RPC properties, and provide reference for the mix design methods of basalt fiber reactive powder concrete (BFRPC). In this study, the relationship between four process variables (sand binder ratio, water binder ratio, basalt fiber volume and silica fume to cement ratio) along with workability and mechanical properties of BFRPC were modeled using the response surface method (RSM) [18]. Based on the established models, the influence degree and rule of process variables on material fluidity, flexural strength and compressive strength were determined.
2. Experimental
2.1. Materials and Mixture Proportions
The Portland cement P.II 42.5 produced by Yatai Cement Ltd. (Jilin, China) was used. SF92 silica fume with a mass fraction of 93.3% and specific surface area of 18,100 m2/kg was sourced from Si’ao Technology Ltd. (Changchun, China). The chemical compositions of the Portland cement and silica fume are shown in Table 1. The basalt fiber used was 22 mm length and 23 μm diameter produced by Haining Anjie Composite Material Ltd. (Haining, China) with a tensile strength of 2836 MPa and elastic modulus of 62 GPa as shown in Table 2.
Quartz sand with three particle sizes was used in this study: 20–40, 40–80 and 80–120 mesh, produced by Zhenxing Quartz Sand factory in Luoyang. A screening test on three kinds of quartz sand was carried out first to divide into two particle levels: Medium sand, which includes particle sizes above 0.3 mm and fine sand, which includes particle sizes below 0.3 mm. The mix proportion of medium and fine sand was 1.6:1. The ultrafine quartz powder with a particle size of 400 mesh was added as a micro filler aggregate in this study with its ratio to cement was 0.32. The chemical compositions of the quartz sand is shown in Table 3. The HRWR-Q8011 polycarboxylic superplasticizer with a water reducing rate of 25% was sourced from Qinfen Building Materials Ltd., the mix content of which was 5%. The proportions of mixtures are shown in Table 4.
2.2. Fabrication of BFRPC
All the mixture were produced using a planetary cement mortar mixer with a capacity of 5 L (JJ-5). The properties of BFRPC have suffered from the dispersal uniformity of basalt fiber, so the performance of the specimen can be effectively improved if the fiber can be evenly dispersed. Firstly, the quartz sand was added to a mix with basalt fiber for 2 min, the friction between sand particles could disperse the fiber evenly [19]. Then cement, silica fume and quartz powder were added and mixed for 3 min to ensure all dry materials were evenly mixed. The full amount of the superplasticizer was dissolved into water, half of the superplasticizer solution was added to the mixture firstly and mixed for 2 min. Afterwards the remaining solution was added and continued stirring for 3 min. The step-by-step addition could more effectively play the role of the superplasticizer [20,21].
For each mix proportion, three specimens with a size of 40 mm × 40 mm × 160 mm were cast. Due to the good fluidity of the mixture, it could be casted by layers tamping without using the vibration table. Therefore, all specimens were cast in two layers. After filling half of the mold with the mixture, tamped it clockwise 10–20 times to make the mixture evenly cover the mold, and then filled the other half of the mold in the same way. After being cast, all the concrete specimens were wrapped with plastic cloth to avoid moisture loss and placed in a moist room for 24 ± 2 h, then demolded. Afterwards, all the specimens were stored in the 90 °C steam curing device for 48 h heat curing [22,23,24].
2.3. Experimental Method
Fluidity—the fluidity test was performed immediately after the mixture was stirred completely, and it had to be done within 6 min. The jumping table method was used to measure the fluidity of the mixture according to the cement mortar test standard (JTG E30-2005) [25]. The mixture was divided into two layers and loaded into the mold successively. Each layer was tamped clockwise 10–15 times and then received 25 times for table vibration. After vibration, the spreading dimensions of the mixture in three directions were measured with a ruler, and the average value was taken as the fluidity value.
Flexural strength—the flexural strength was determined by the center loading method described in the standard GB/T 17671-1999 [26]. Three specimens of 40 mm × 40 mm × 160 mm were made for each group for testing. The specimen was put, molding side up, into the testing machine with a loading speed set at 50 N/s and constantly loaded until it broke off. The mean value of three measurements was determined as the flexural strength.
Compressive strength—the compressive strength was determined in accordance with the standard GB/T 17671-1999 [26]. The fracture blocks obtained after the flexural test (six for each group) were used for the compression test. Before putting the specimen into the fixture, removed debris from the surface of it. Two sides of the specimen were used as compression surfaces, and the loading speed was set at 2.5 kN/s. The arithmetic average of the six test results was accepted as the compressive strength.
2.4. Box-Behnken Design (BBD)
The Box-Behnken method (BBD) is a response surface design, which can evaluate the non-linear relation between indexes and factors. It does not need to carry out repeated tests. With the same number of experimental factors, it is more economical and efficient because it requires less times of experiment [27]. The number of experiments () required by BBD method is determined by Equation (1).
where is the number of factors and is the number of center points.
Through the BBD method, a quantitative mathematical relationship (linear equation of quadratic polynomial) can be obtained to accurately reflect the relationship between process variables and response variables, Equation (2).
where is the response variable, , are the process variables, where , represent code values corresponding to different factors, is the number of process variables, is the intercept, is the linear coefficient of -th factor, is quadratic coefficient of -th factor, is interaction coefficient of -th and -th factors and is a random error [28].
In this paper, Box-Behnken design was established by using Design-expert 8® software. Four factors were taken as process variables: Sand binder ratio (A), water binder ratio (B), basalt fiber content (C) and silica fume to cement ratio (D). The fluidity (R1), flexural strength (R2) and compressive strength (R3) of the mixture were set as response variables. The response surface model with 29 experimental points composed of 24 factorial and five center points was established. The model concept diagram is shown in Figure 1.
Table 5 shows the levels of experimental factors, and the corresponding code values. The low and high levels of each factor were respectively encoded as −1 and +1 while the central points were encoded as 0. The mix proportions and corresponding response results of the 29 experimental groups in this paper are shown in Table 6, in which B25–B29 is the five central experimental groups used to evaluate the stability of the model.
3. Results and Discussion
3.1. Establishment and Verification of Response Surface Model
The response surface model was established by using a multiple regression analysis method in the Design Expert 8® software. The accuracy of the regression model and the significance of influencing factors were tested by an analysis of variance (ANOVA). Statistical parameters were used to verify the accuracy of the model, the specific parameters are shown in Table 7. For data with non-normal distribution of response variables, the Box-Cox transformation method was adopted to determine the optimal transformation mode for dependent variables, as shown in Table 7 [29].
R2 is the coefficient of determination whose value can judge the degree of model fitting. The closer that R2 value approaches 1, the better the model fitting degree will be. The R values of the three response models in this study are all above 0.85, indicating a good correlation between model predictions and measurement data. The F value represents the ratio of mean square and residual mean square, which can test whether the variance is due to the model or noise [30]. As shown in Table 7, F values of the three models were 26.3, 19.32 and 14.83, respectively, indicating that all three models were significant.
The p value is the probability value that is associated with the F value, which is used to test whether the result of F value is statistically significant. Small probabilities (p < 0.05) indicate that there is a significant model effect, large values (p > 0.1) suggest no significant effect [31]. It can be seen from Table 3 that the p values of models were all less than 0.05, which proved that the model had statistical significance. In the process of modeling, non-significant variables were judged and removed from the model according to the p value. In these models, A, B, D, AD and BD were significant model terms of fluidity (R1); A, B, C, D, CD, C2 and D2 were significant model terms of the flexural strength (R2); A, B, C, D, AD, BC, BD and CD were significant model terms of the compressive strength (R3).
In addition, lack of fit can further measure how well the model fits the data. Strong lack of fit (p < 0.05) indicates that the model does not fit the data well. It is desirable to have non-significant lack of fit (p > 0.1). As shown in Table 7, the p values of lack of fit in the three models were all greater than 0.1 and implied the lack of fit was not significant relative to the pure error. In other words, the established models could well reflect the relationship between experimental variables and response values.
The final equations were developed in terms of actual factors for the fluidity (R1, cm), flexural strength (R2, MPa) and compressive strength (R3, MPa) as follows:
R1 = 6.75 − 48.67·A + 336.67·B − 3.58·D + 127.5·A·D + 675·B·D
Ln (R2) = 4.14 − 0.166·A − 4.3·B − 1.007·C − 0.61·D − 6.6·C·D + 7.21·C2 + 2.728·D2
(R3)2 = 774.04 − 38373.37·A + 173679·B + 161764·C + 23425.17·D + 125313·A·D − 520259·B·C − 505066·B·D − 198720·C·D
In order to further verify the accuracy of the models, the statistical parameters of data were analyzed, and the predicted-to-measured values were compared. The ANOVA results of the models are shown in Table 8. The square root of the residual mean square (std. dev.), which is often referred to as RMSE that means the root mean square of point error between the predicted values and measured values. The coefficient of variation is the error expressed as a percentage of the mean. It is determined by Equation (4). The repeatability of the models is good when the coefficient of variation is less than 10%. It can be seen from Table 8 that the coefficient of variance (COV) of three response models were all less than 10%, indicating that the models were reliable and highly repeatable [32].
COV = 100 * (std. dev.)/(mean)
The adeq precision is a measure of the range in the predicted response relative to its associated error, in other words the signal to noise ratio. Its desired value is four or more. As shown in Table 8, ratio of all models is greater than four, indicating an adequate signal. The models can be used to navigate the design space.
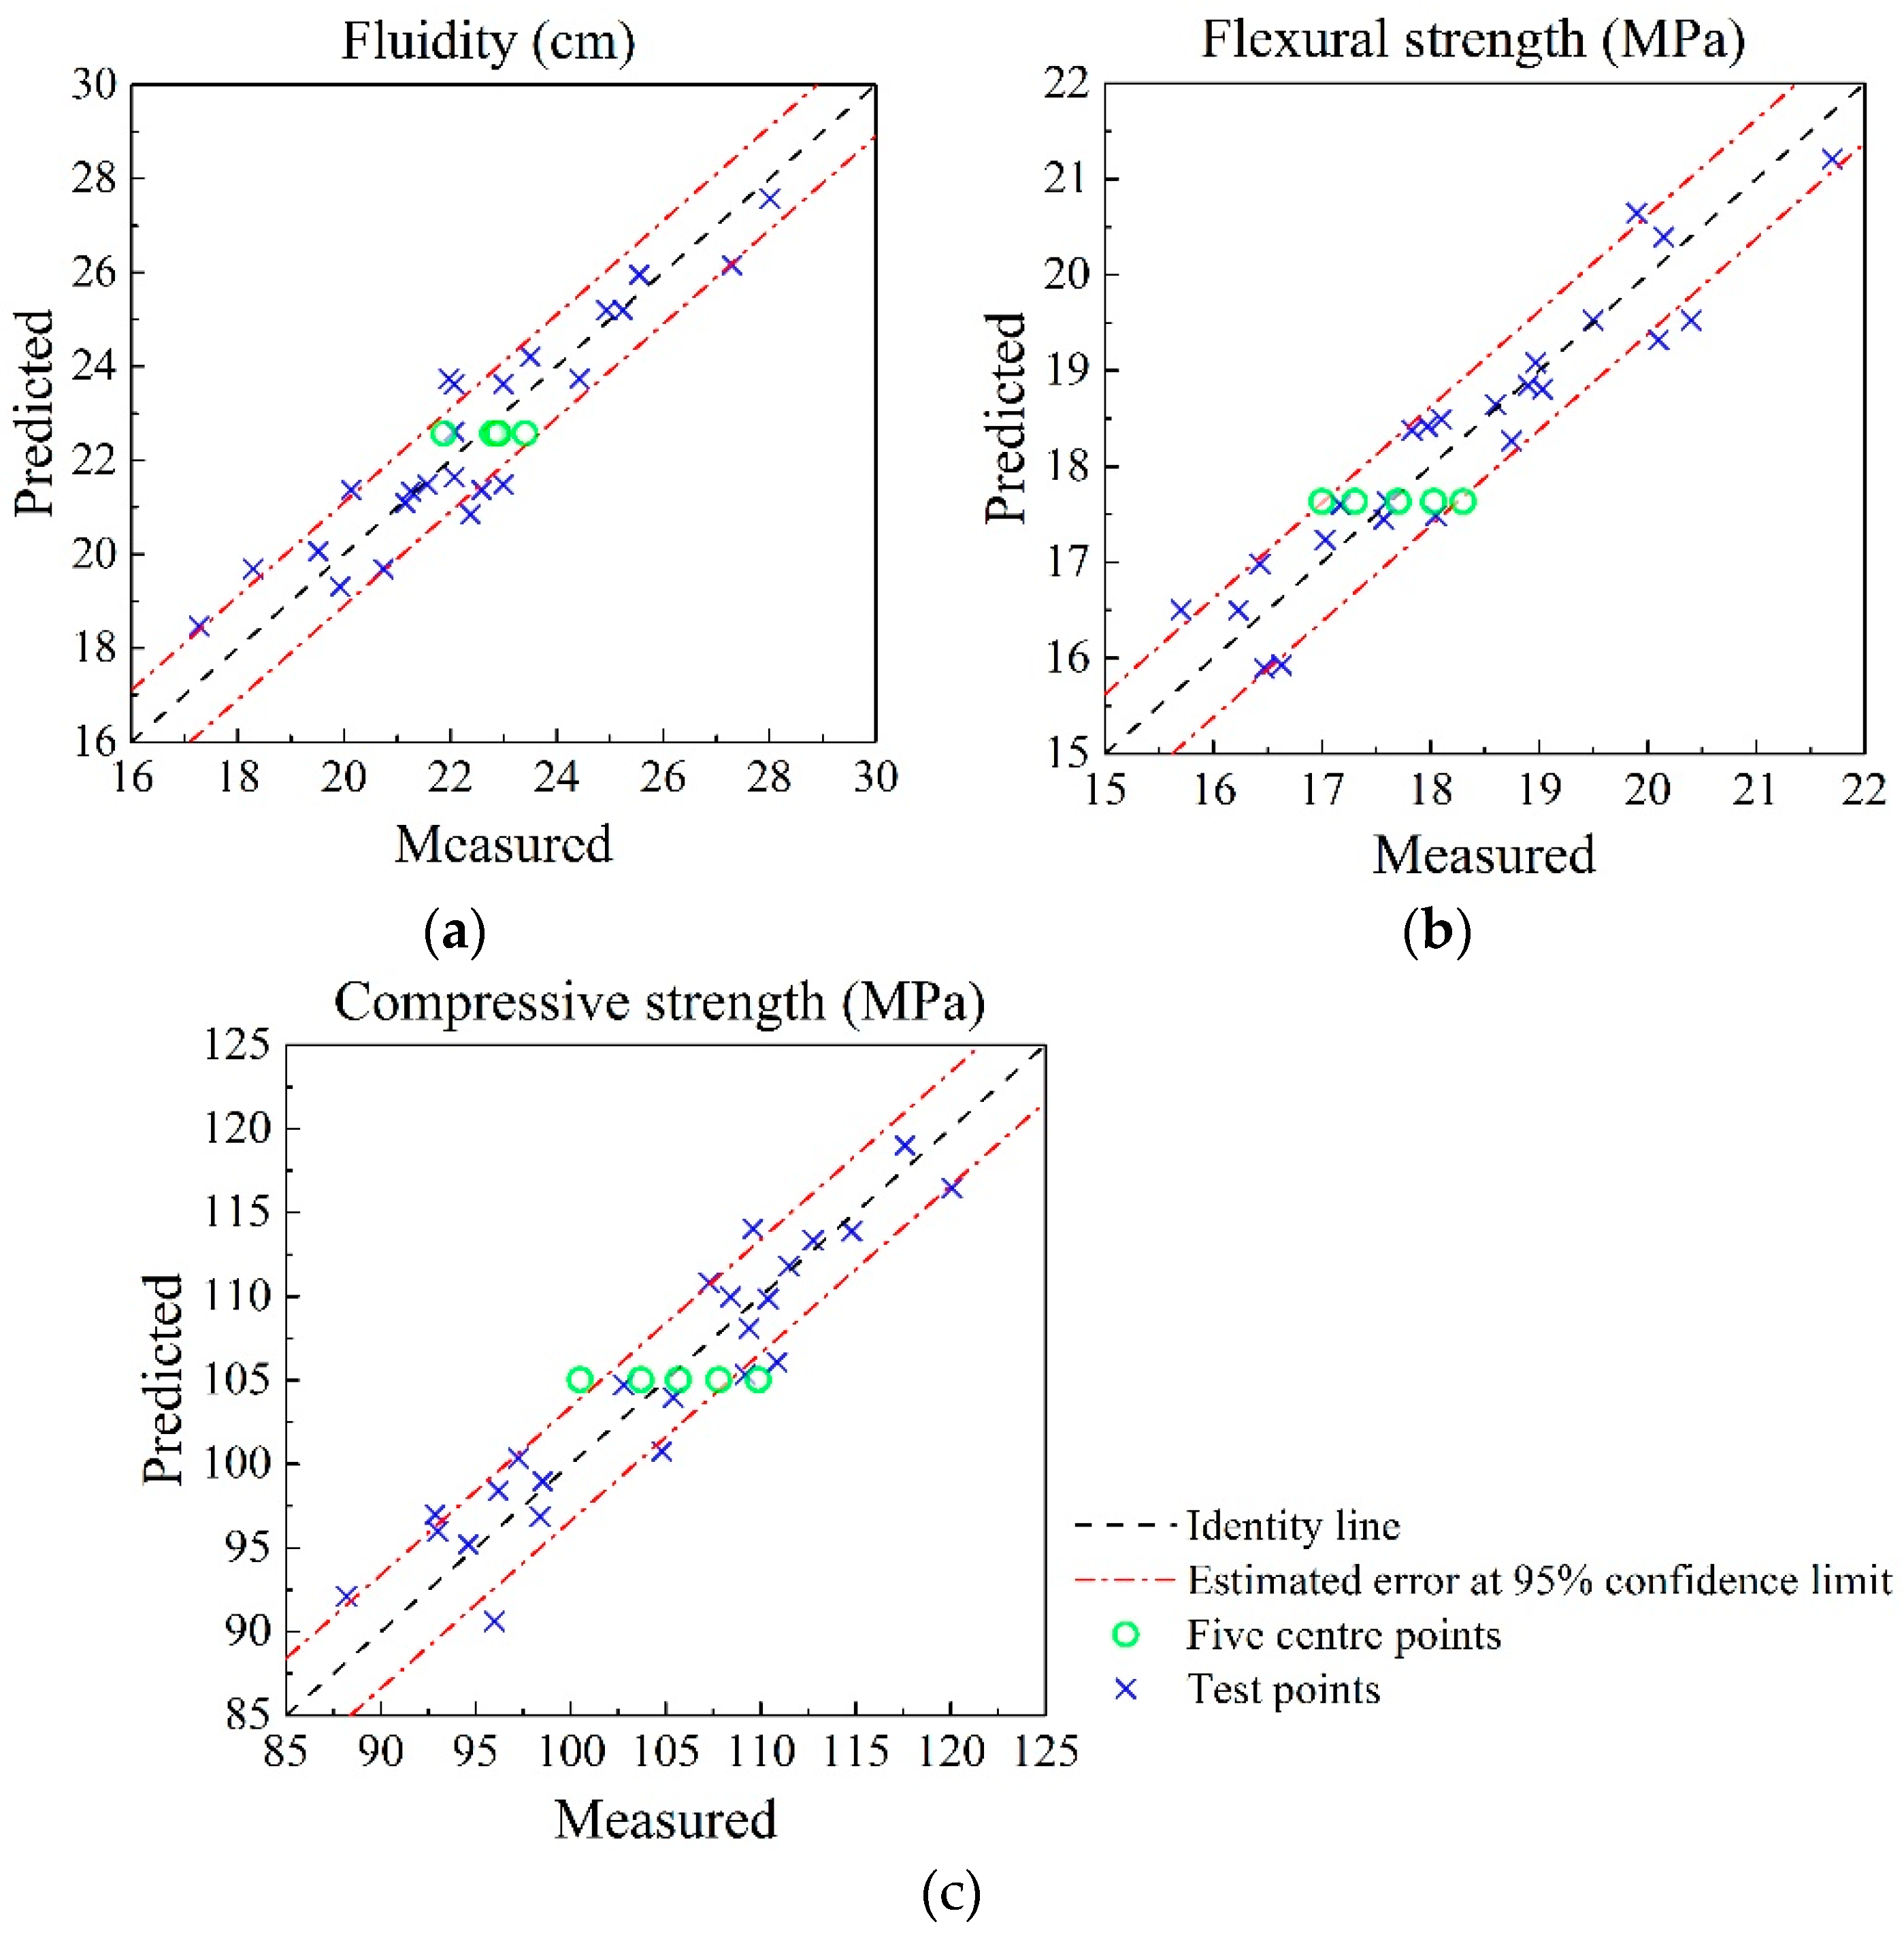
The predicted and measured values of fluidity, flexural strength and compressive strength for 29 experimental groups are shown in Figure 2. The green dots represent five central points. The error lines are drawn according to the estimated error value of the 95% confidence interval listed in Table 8. Points above the identity line (line of equality between predicted and measured values) indicated that the predicted value was larger than the measured value, while the points below the identity line indicated that the predicted value was less than measured value. As the distribution of data points was mostly within the 95% confidence interval band, it can be seen that the statistical model was of good accuracy.
3.2. Influence of Parameters on the Performance of BFRPC
3.2.1. Fluidity
The fluidity prediction model obtained by BBD method is reported in Table 7 and is given by Equation (1). According to the p values of various factors obtained from ANOVA, it could be seen that the influence degree of factors on fluidity was: B > D > A > BD > AD.
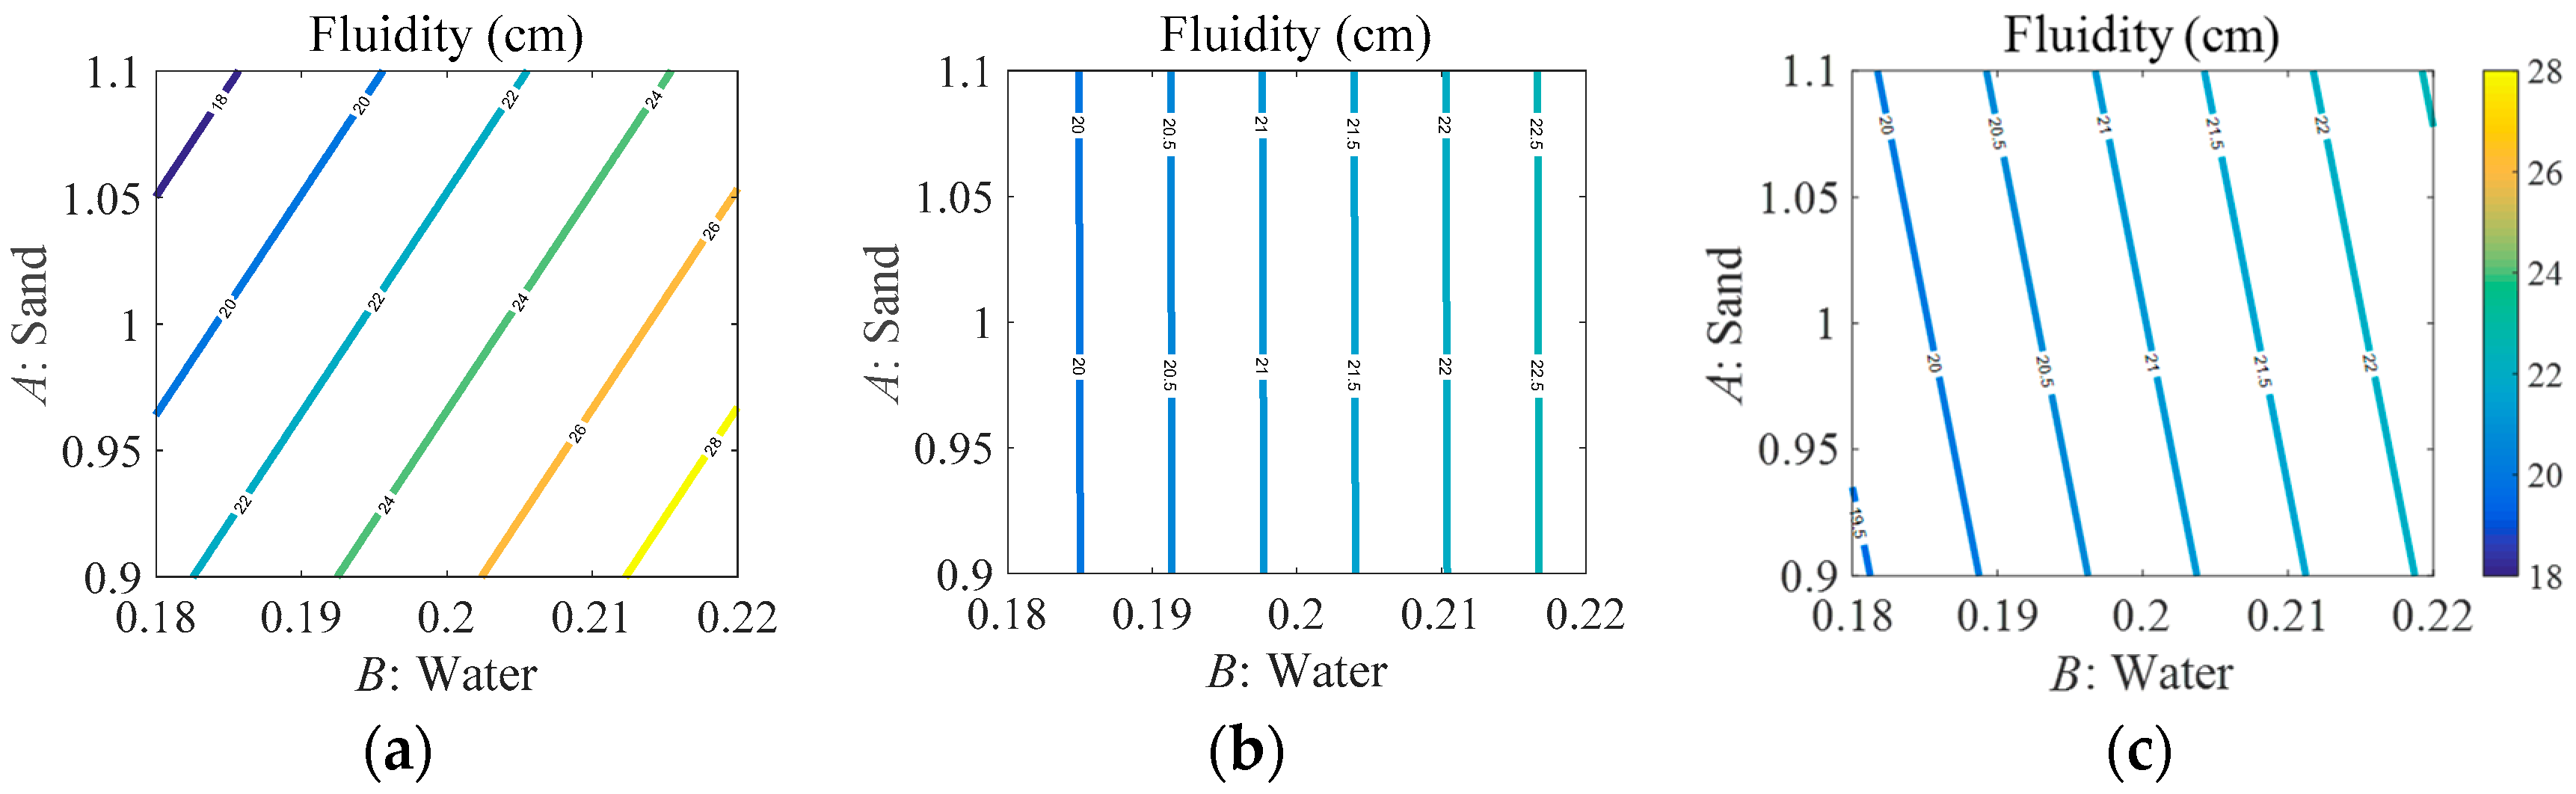
The effect of water/binder ratio (B) and sand/binder ratio (A) on fluidity (R1) of the mixture under the condition of different silica fume content, is shown in Figure 3. It was found that B had the most effect on the fluidity according to the results of ANOVA. It always showed a positive proportional linear relationship between the w/b ratio and fluidity as can be seen from the contour line in Figure 3. Obviously, the more water added into the mixture, the more free water there was, so the fluidity of mixture increased.
Meanwhile, there were interactions of BD and AD. By controlling D as a variable, three contour plots of AB could be obtained as Figure 3 shows. It was observed that the influence of A and B on fluidity was linear, but the linear trend gradually changed with the variation of silica fume content (D). As shown in Figure 3a, when the silica fume content (D) was less than 0.38, a decrease of the sand/binder ratio (A) led to an increase of fluidity values. As the critical point, when silica fume content (D) approached 0.38, the fluidity of the mixture would no longer be affected by the sand volume (A; Figure 3b). When the silica fume content was greater than 0.38, the fluidity of the mixture improved with the increase of the sand volume (A) as illustrated in Figure 3c. Meanwhile, with the increase of D, the fluidity of the mixture presented an overall downward trend. The fluidity of mixture will affect the construction workability of concrete, but its mechanical properties should be considered comprehensively to carry out the mix design.
3.2.2. Flexural Strength
The predicted model on the flexural strength designed according to the BBD method is presented in Table 7 and given by Equation (2). According to the p values of various factors obtained from ANOVA, it could be seen that the influence degree of factors on the flexural strength was: B = D > C² > CD > C > D² > A. It was obvious that B and D were the most significant model terms, while A was the weakest term, and there was interaction between C and D.
The effect of sand/binder ratio (A) and water/binder ratio (B) on flexural strength (R2) of the mixture is shown in Figure 4. The contour plots of AB showed that both A and B had a linear relationship with the flexural strength, regardless of the value of C, D. The flexural strength of specimens decreased with the increase of both A and B, but the w/b ratio (B) was the most significant factor, while the effect of sand volume (A) on the flexural strength is weak. When the content of quartz sand increased, the structural space of aggregate in the mixture became larger, which led to the poor compactness of aggregate and cementitious materials, forming a weak area at the interface and leading to a decline in the flexural strength of the specimen. It could be seen that when both A and B achieved a minimum value (i.e., A = 0.9, B = 0.18), the maximum flexural strength could be obtained.
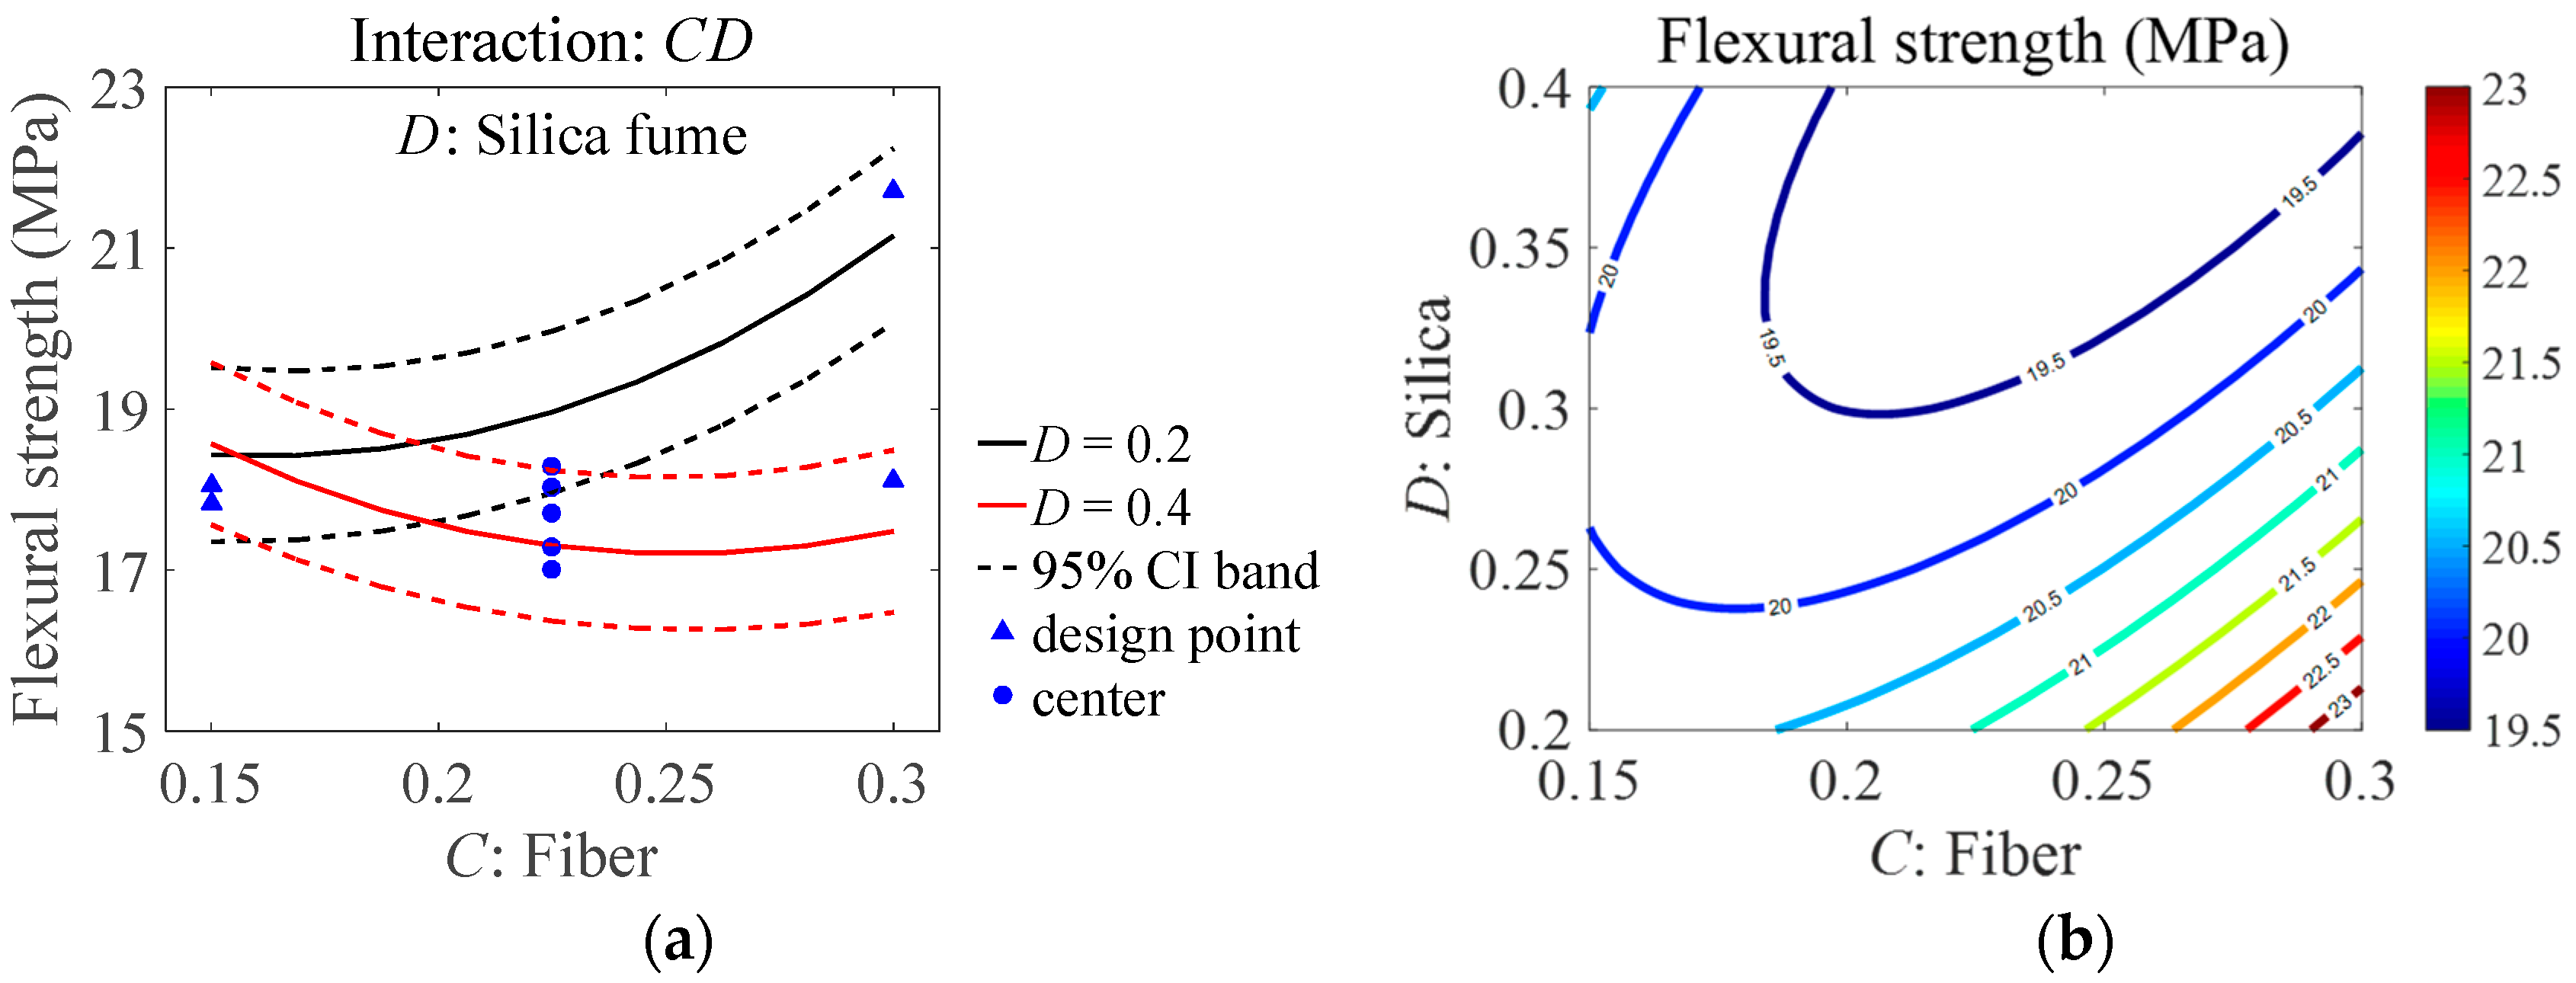
The interaction of CD is shown in Figure 5a, which indicates that the relationship between flexural strength and basalt fiber content (C) shows different changing tendency under different silica fume content (D). When D = 0.2, as shown in the black curve, with the increase of fiber content (C), the flexural strength of specimens also increased. When D = 0.4, as shown in the red curve, the relationship between flexural strength and fiber content (C) presents a negative quadratic curve. The maximum flexural strength was obtained at the two endpoints of the curve (i.e., when C = 0.15, D = 0.4 and C = 0.3, D = 0.2). However, it can be seen that the flexural strength at D = 0.4 was lower than that at D = 0.2, indicating that 0.2 was the optimal value of silica fume to cement ratio. Meanwhile, according to the trend of the curves, it could be judged that the strengthening effect of basalt fiber on RPC flexural strength was determined by the composition of cementitious materials. Based on the above conclusions, under the condition of A = 0.9 and B = 0.18, the contour diagram of CD and R2 is shown in Figure 5b. It can be found that the maximum flexural strength can be obtained when C = 0.3 and D = 0.2.
3.2.3. Compressive Strength
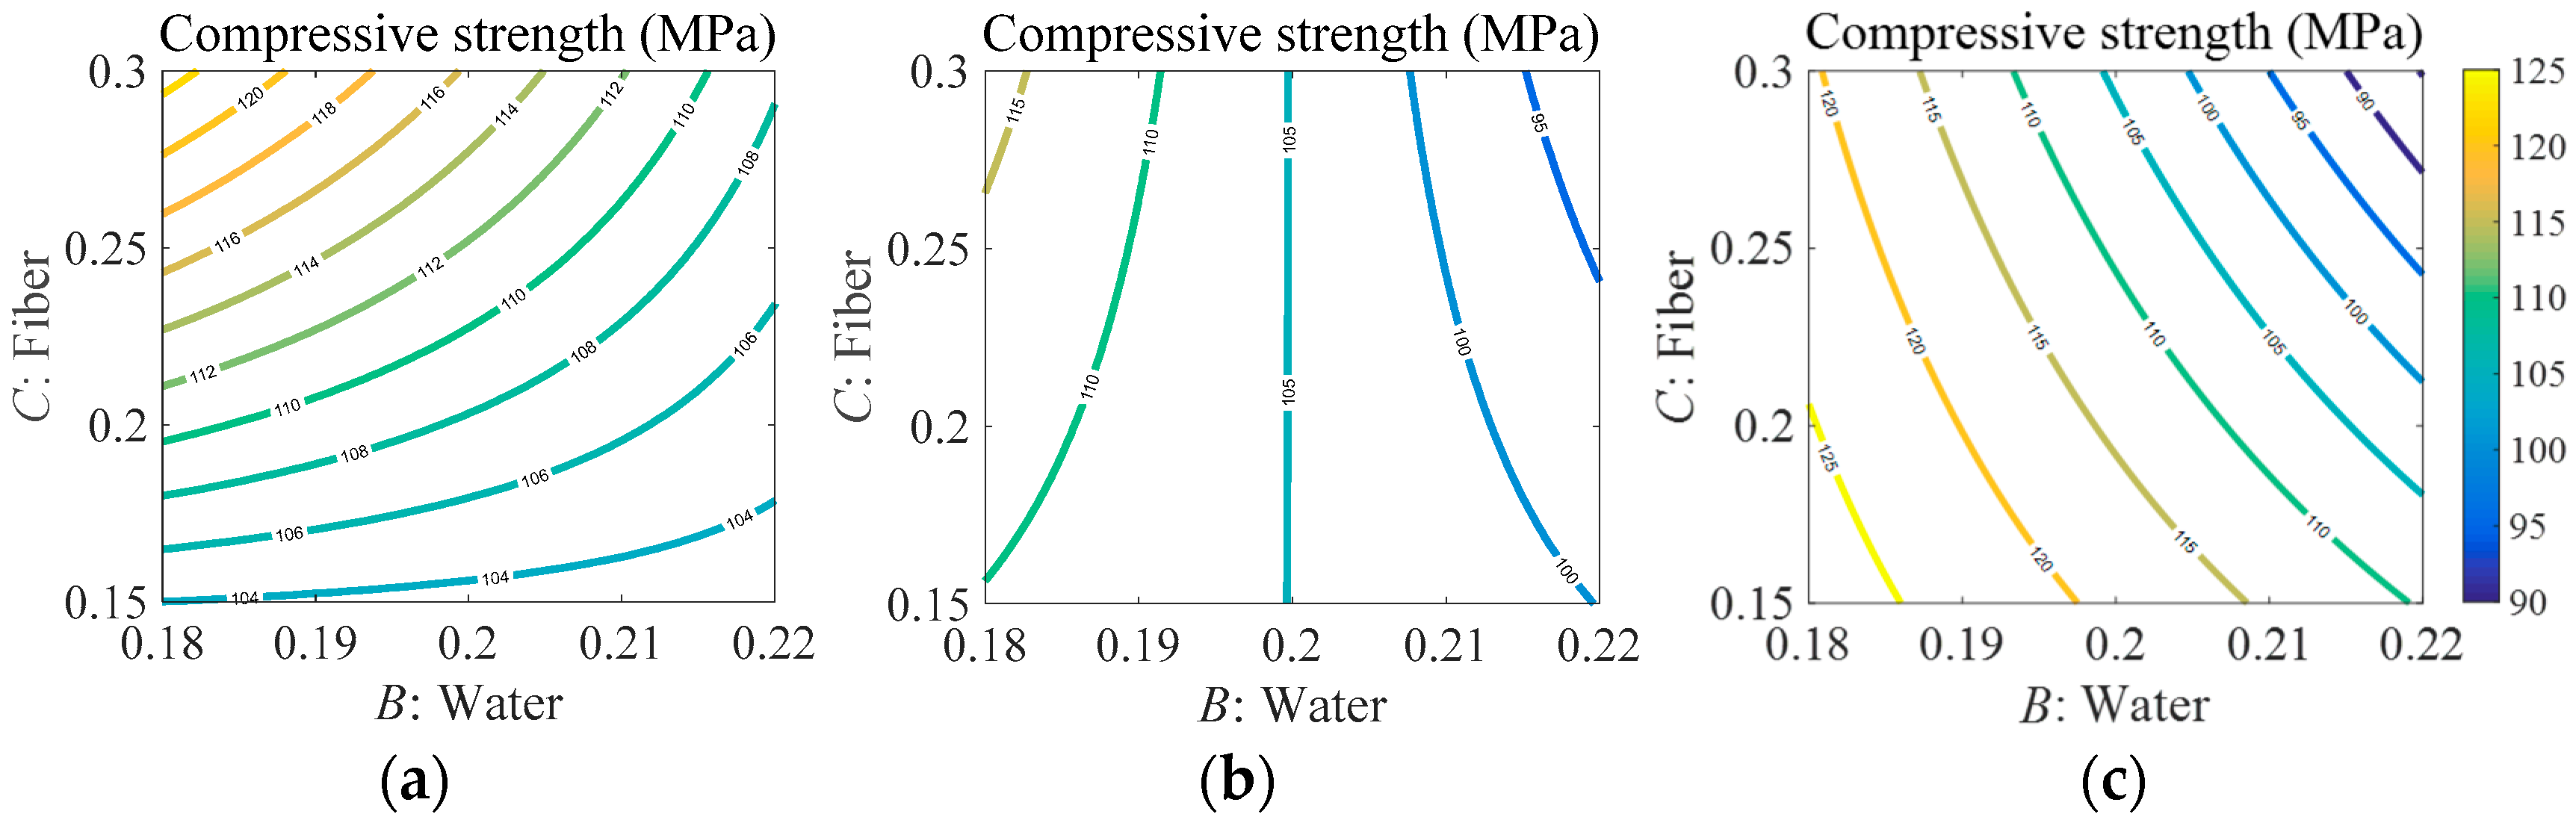
The variance analysis results of the compressive strength model based on the BBD design are shown in Table 7, and the model equation is given by Equation (3). According to the p value of parameters listed in Table 7, it can be seen that the influence degree of different factors on compressive strength is: B > CD > AD > BD > BC. Among them, the most significant factor is the w/b ratio (B), followed by CD and AD. As can be seen from the contour line in Figure 6 the w/b ratio is always inversely proportional to the compressive strength. In other words, the compressive strength decreases with the increase of the w/b ratio. Since the silica fume to cement ratio (D) has an interactive relationship with both A, B and C, it can be seen that silica fume, as a component of cementing material, has a great influence on the compressive strength of the specimen.
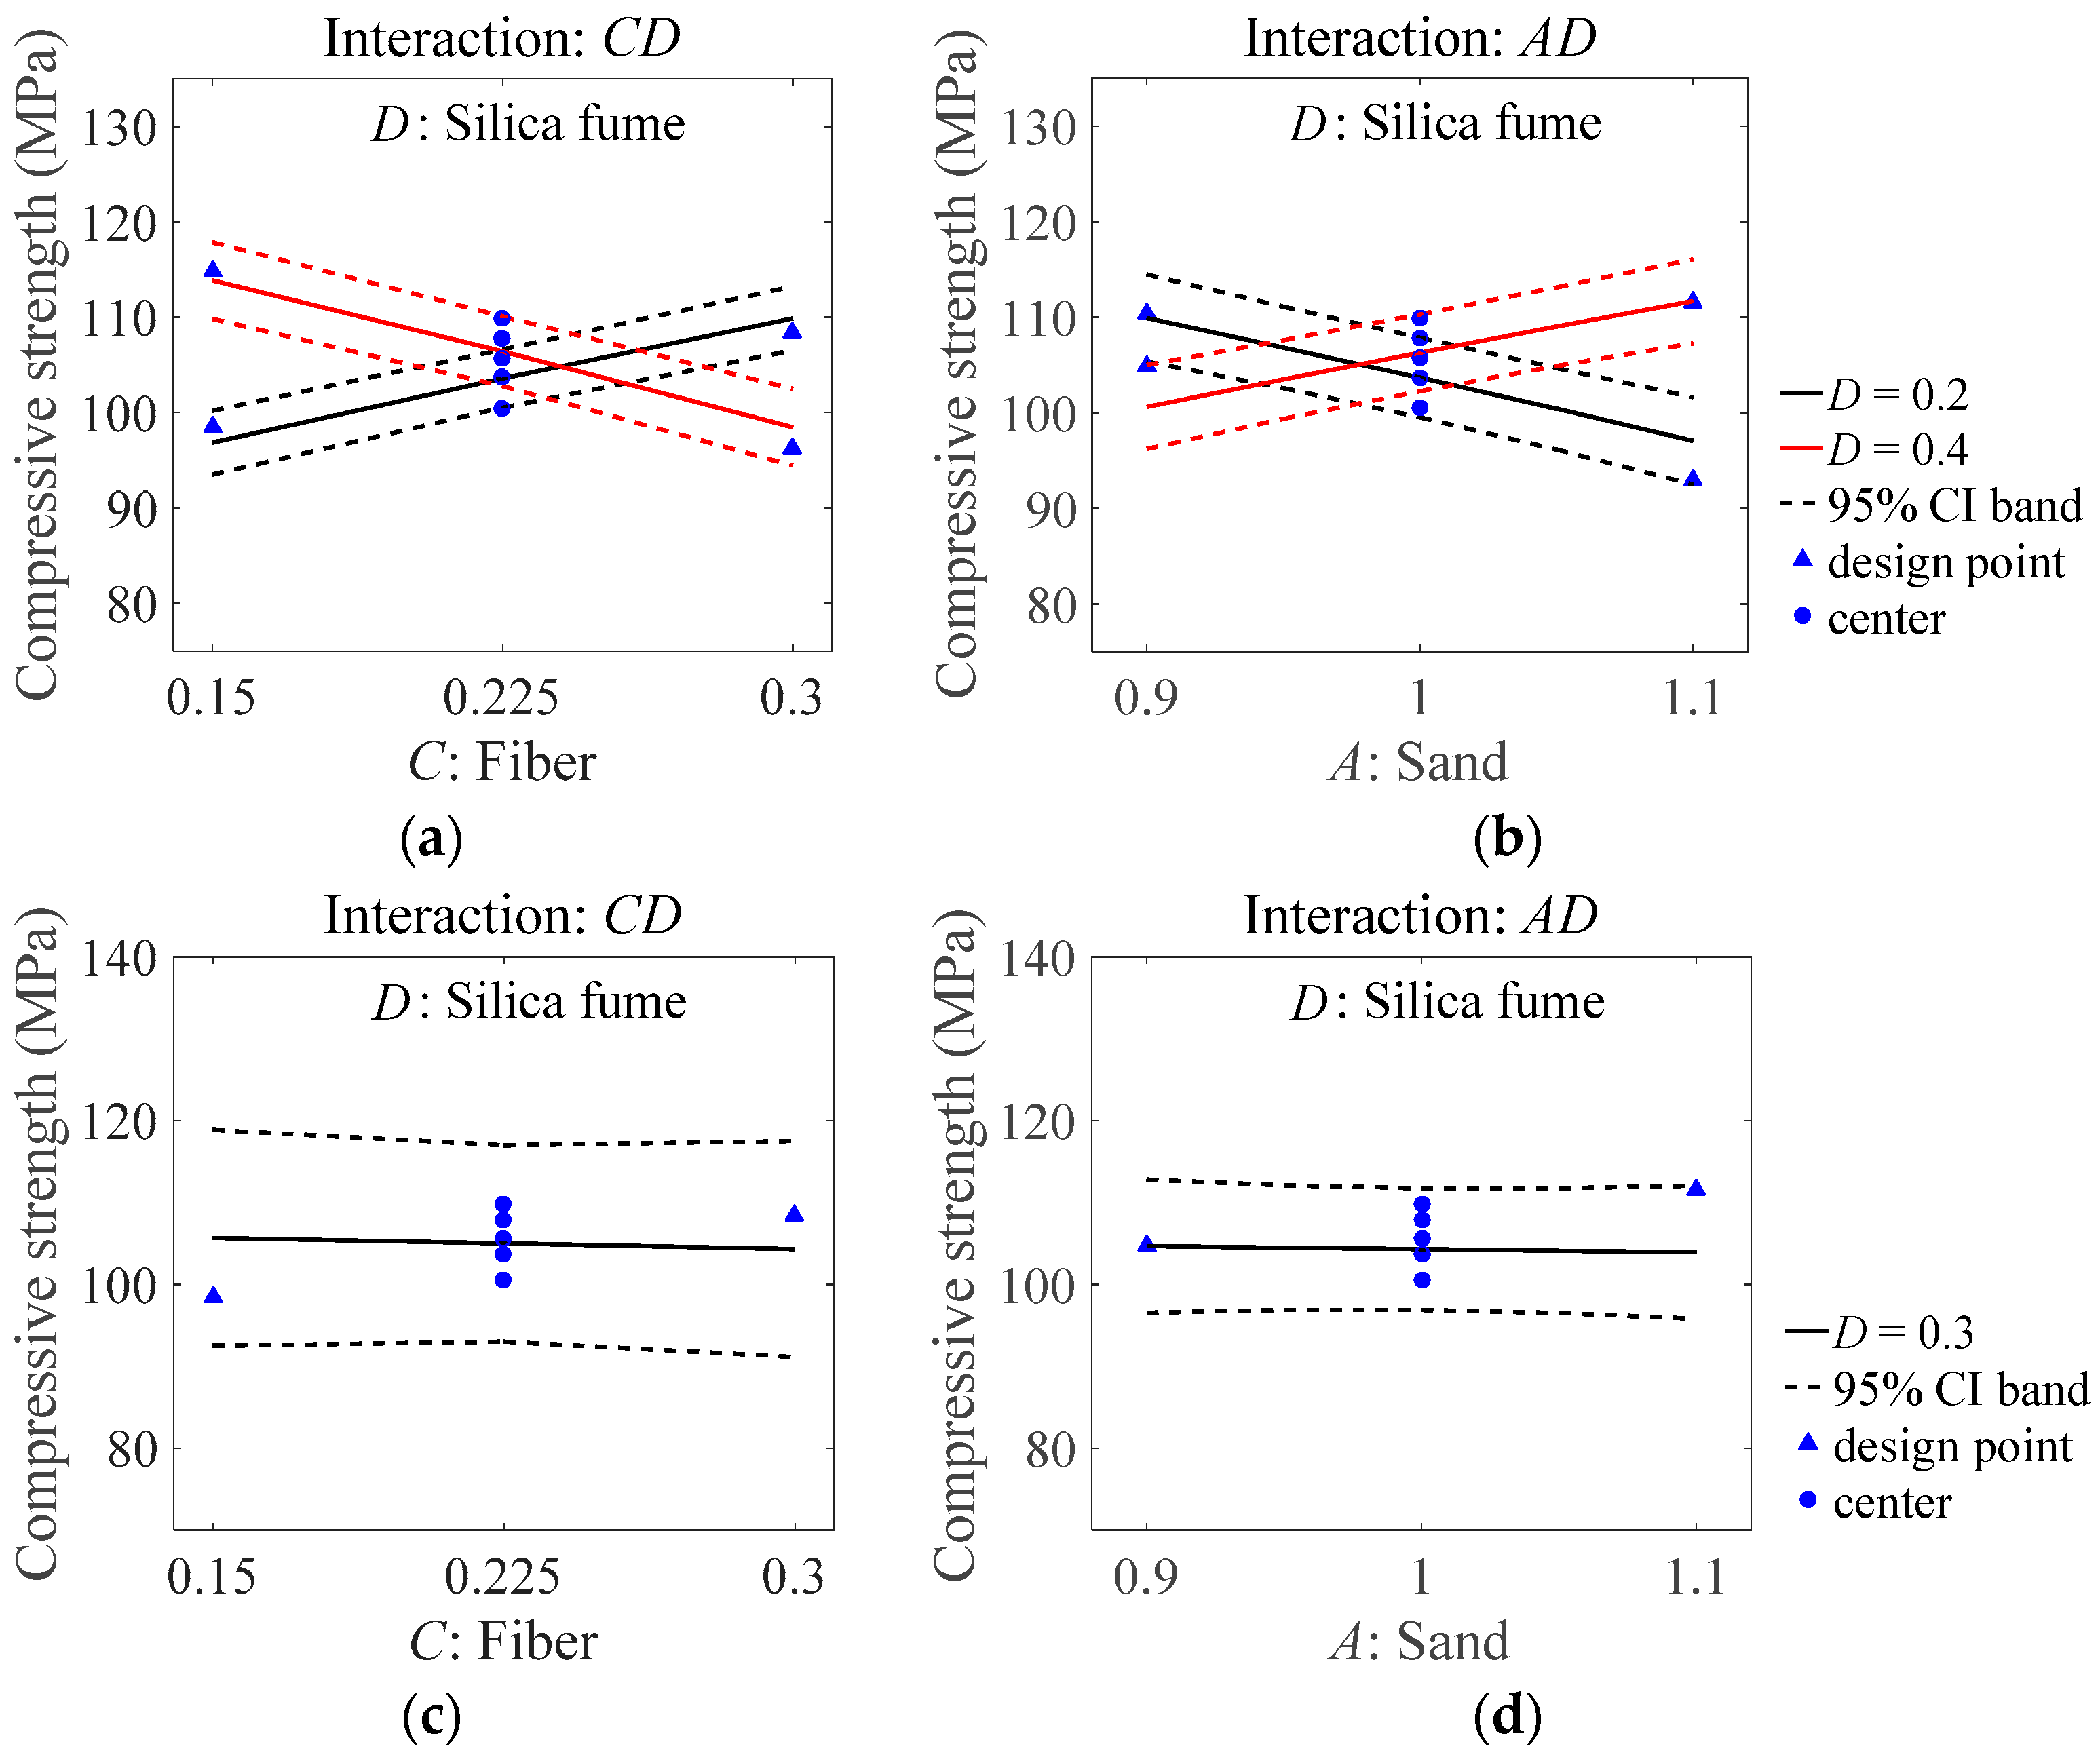
As significant model terms, the influence of CD and AD on the compressive strength of the specimen is shown in Figure 7. It can be seen from Figure 7a,b, the influence of the sand/binder ratio (A) and basalt fiber content (C) on the compressive strength presented different trends in the case of a change in silica fume/cement ratio (D). When D = 0.2, the compressive strength increased with the increase of fiber content and decreased with the increase of the quartz sand content. When D = 0.4, the compressive strength decreased with the increase of fiber content and increased with the increase of quartz sand content. Figure 7c,d shows that D = 0.3 is a critical value. Under this condition, the changes of A and C have only a small impact on the compressive strength. Silica fume and cement were components of cementitious materials, the ratio between them had an impact on the bonding performance of cementitious materials, aggregate and fiber, leading to the change of concrete density and thereby affecting the compressive strength of specimens. According to the comprehensive analysis of the above figures, the optimal compressive strength can be obtained when A = 0.9, D = 0.2 or A = 1.1, D = 0.4.
Refer to the above analysis, the contour diagram of compressive strength under the influence of BC is shown in Figure 7. Under the optimal conditions of A = 0.9 and D = 0.2, it can be seen from Figure 7a that the maximum compressive strength can be obtained when the fiber content C = 0.3, indicating that the addition of fiber plays a positive role in promoting the compressive strength of the specimen. When the silica fume to cement ratio reaches the critical value of 0.3 (Figure 7b), the water/binder ratio becomes the only effect of compressive strength, which shows an inverse proportional relationship. In the case of another optimal value (A = 1.1, D = 0.4, Figure 7c), the increase of fiber content causes a certain degree of loss in compressive strength, but it is not significant and remains at a high strength level.
4. Conclusions
The effects of four process parameters (sand/binder ratio (A), water/binder ratio (B), basalt fiber content (C), silica fume to cement ratio(D)) on the fluidity, compressive strength and flexural strength of BFRPC were investigated by the BBD experimental design method, the following conclusions can be drawn:
(1) Three calculation models of fluidity, flexural strength and compressive strength were established through the Box-Behnken method. An analysis of variance (ANOVA) was performed to prove that the three models had enough precision to provide certain reference for the design of basalt fiber reactive powder concrete.
(2) The three models established by an ANOVA showed that water/binder ratio (B) and silica fume to cement ratio (D) had significant influences on all the three reaction variables. Among them, the water/binder ratio (B) was the most important model item on the performance of BFRPC. The fluidity of the mixture was positively correlated with the water/binder ratio, but the flexural and compressive strength decreased with the increase of the water/binder ratio. In addition, the flexural strength of specimens was significantly affected by the basalt fiber content (C). For compressive strength, the four process variables in this study all caused the varying degree to it.
(3) The analysis of the influence of parameters on response variables revealed that the silica fume to cement ratio (D) was a remarkable factor for BFRPC, which had interaction with other factors. It was established that the enhancement of basalt fiber on RPC was affected by the silica fume to cement ratio. For the flexural test, when D = 0.2, the addition of basalt fiber could significantly improve the flexural strength; when D = 0.4, the increase of basalt fiber content was not conducive to the flexural strength. For the compression test, the silica fume to cement ratio (D) interacted with both quartz sand content (A) and basalt fiber content (C). The optimal compressive strength could be obtained at A = 0.9, B = 0.18, C = 0.15, D = 0.2 or A = 1.1, B = 0.18, C = 0.3, D = 0.4.
Author Contributions
H.L. conceived of and designed the experiments. S.L. analyzed the data and wrote the paper. S.W. investigation. X.G. performed the experiment. Y.G. audited the content.
Funding
This research was funded by the Industrial Technology Research & Development Special Project of Jilin Province (2018C042-1); the Transportation Science and Technology Program of Jilin Province (2018-1-9); and the Science Technology Development Program of Jilin Province (20180201026SF).
Acknowledgments
The authors would like to appreciate anonymous reviewers for their constructive suggestions and comments to improve the quality of the paper.
Conflicts of Interest
The authors declare no conflict interest.
References
- Richard, P.; Cheyrezy, M. Composition of reactive powder concretes. Cem. Concr. Res. 1995, 25, 1501–1511. [Google Scholar] [CrossRef]
- Zdeb, T. Ultra-high performance concrete—Properties and technology. Bull. Pol. Acad. Sci. Tech. Sci. 2013, 61, 183–193. [Google Scholar] [CrossRef]
- Mostofinejad, D.; Nikoo, M.R.; Hosseini, S.A. Determination of optimized mix design and curing conditions of reactive powder concrete (RPC). Constr. Build. Mater. 2016, 123, 754–767. [Google Scholar] [CrossRef]
- Afroughsabet, V.; Biolzi, L.; Ozbakkaloglu, T. High-performance fiber-reinforced concrete: A review. J. Mater. Sci. 2016, 51, 6517–6551. [Google Scholar] [CrossRef]
- Wille, K.; Naaman, A.E.; El-Tawil, S.; Parra-Montesinos, G.J. Ultra-high performance concrete and fiber reinforced concrete: Achieving strength and ductility without heat curing. Mater. Struct. 2011, 45, 309–324. [Google Scholar] [CrossRef]
- Meng, W.; Khayat, K.H. Mechanical properties of ultra-high-performance concrete enhanced with graphite nanoplatelets and carbon nanofibers. Compos. Part. B Eng. 2016, 107, 113–122. [Google Scholar] [CrossRef]
- Tayeh, B.A.; Bakar, B.H.A.; Johari, M.A.M.; Voo, Y.L. Utilization of Ultra-high Performance Fibre Concrete (UHPFC) for Rehabilitation—A Review. Procedia Eng. 2013, 54, 525–538. [Google Scholar] [CrossRef]
- Bae, B.-I.; Choi, H.-K.; Lee, B.-S.; Bang, C.-H. Compressive Behavior and Mechanical Characteristics and Their Application to Stress-Strain Relationship of Steel Fiber-Reinforced Reactive Powder Concrete. Adv. Mater. Sci. Eng. 2016, 2016, 1–11. [Google Scholar] [CrossRef]
- Chan, Y.-W.; Chu, S.-H. Effect of silica fume on steel fiber bond characteristics in reactive powder concrete. Cem. Concr. Res. 2004, 34, 1167–1172. [Google Scholar] [CrossRef]
- Pyo, S.; Tafesse, M.; Kim, H.; Kim, H.-K. Effect of chloride content on mechanical properties of ultra high performance concrete. Cem. Concr. Compos. 2017, 84, 175–187. [Google Scholar] [CrossRef]
- Sim, J.; Park, C.; Moon, D.Y. Characteristics of basalt fiber as a strengthening material for concrete structures. Compos. Part. B Eng. 2005, 36, 504–512. [Google Scholar] [CrossRef]
- Lipatov, Y.V.; Gutnikov, S.I.; Manylov, M.S.; Zhukovskaya, E.S.; Lazoryak, B.I. High alkali-resistant basalt fiber for reinforcing concrete. Mater. Des. 2015, 73, 60–66. [Google Scholar] [CrossRef]
- Militký, J.; Kovačič, V.; Rubnerova, J. Influence of thermal treatment on tensile failure of basalt fibers. Eng. Fract. Mech. 2002, 69, 1025–1033. [Google Scholar] [CrossRef]
- Branston, J.; Das, S.; Kenno, S.Y.; Taylor, C. Mechanical behaviour of basalt fibre reinforced concrete. Constr. Build. Mater. 2016, 124, 878–886. [Google Scholar] [CrossRef]
- Iyer, P.; Kenno, S.Y.; Das, S. Mechanical properties of fiber-reinforced concrete made with basalt filament fibers. J. Mater. Civ. Eng. 2015, 27. [Google Scholar] [CrossRef]
- Ayub, T.; Shafiq, N.; Nuruddin, M.F. Mechanical Properties of High-performance Concrete Reinforced with Basalt Fibers. Procedia Eng. 2014, 77, 131–139. [Google Scholar] [CrossRef] [Green Version]
- Wang, D.; Ju, Y.; Shen, H.; Xu, L. Mechanical properties of high performance concrete reinforced with basalt fiber and polypropylene fiber. Constr. Build. Mater. 2019, 197, 464–473. [Google Scholar] [CrossRef]
- Sakr, M.; Hanafi, R.; Fouad, M.; Al-Easa, H.; El-Moghazy, S. Design and optimization of a luminescent Samarium complex of isoprenaline: A chemometric approach based on Factorial design and Box-Behnken response surface methodology. Spectrochim. Acta A Mol. Biomol. Spectrosc. 2019, 208, 114–123. [Google Scholar] [CrossRef] [PubMed]
- Ipek, M.; Yilmaz, K.; Sümer, M.; Saribiyik, M. Effect of pre-setting pressure applied to mechanical behaviours of reactive powder concrete during setting phase. Constr. Build. Mater. 2011, 25, 61–68. [Google Scholar] [CrossRef]
- Tam, C.M.; Tam, V.W.Y.; Ng, K.M. Assessing drying shrinkage and water permeability of reactive powder concrete produced in Hong Kong. Constr. Build. Mater. 2012, 26, 79–89. [Google Scholar] [CrossRef]
- Wille, K.; Boisvert-Cotulio, C. Material efficiency in the design of ultra-high performance concrete. Constr. Build. Mater. 2015, 86, 33–43. [Google Scholar] [CrossRef]
- Cwirzen, A.; Penttala, V.; Vornanen, C. Reactive powder based concretes: Mechanical properties, durability and hybrid use with OPC. Cem. Concr. Res. 2008, 38, 1217–1226. [Google Scholar] [CrossRef]
- Yunsheng, Z.; Wei, S.; Sifeng, L.; Chujie, J.; Jianzhong, L. Preparation of C200 green reactive powder concrete and its static–dynamic behaviors. Cem. Concr. Compos. 2008, 30, 831–838. [Google Scholar] [CrossRef]
- Peng, Y.; Zhang, J.; Liu, J.; Ke, J.; Wang, F. Properties and microstructure of reactive powder concrete having a high content of phosphorous slag powder and silica fume. Constr. Build. Mater. 2015, 101, 482–487. [Google Scholar] [CrossRef]
- National Standard of the People’s Republic of China. Method of Testing Cements–Determination of Strength (GB/T 17671-1999); Quality and Technology Supervision Bureau of the People’s Republic of China: Beijing, China, 1999.
- National Standard of the People’s Republic of China. Test. Methods for Cement and Concrete for Highway Engineering (JTG E30-2005); Ministry of Transport of the People’s Republic of China: Beijing, China, 2006.
- Al-Amoudi, R.H.; Taylan, O.; Kutlu, G.; Can, A.M.; Sagdic, O.; Dertli, E.; Yilmaz, M.T. Characterization of chemical, molecular, thermal and rheological properties of medlar pectin extracted at optimum conditions as determined by Box-Behnken and ANFIS models. Food Chem. 2019, 271, 650–662. [Google Scholar] [CrossRef]
- Rumky, J.; Ncibi, M.C.; Burgos-Castillo, R.C.; Deb, A.; Sillanpaa, M. Optimization of integrated ultrasonic-Fenton system for metal removal and dewatering of anaerobically digested sludge by Box-Behnken design. Sci. Total Environ. 2018, 645, 573–584. [Google Scholar] [CrossRef]
- Muthukumar, M.; Mohan, D.; Rajendran, M. Optimization of mix proportions of mineral aggregates using Box Behnken design of experiments. Cem. Concr. Compos. 2003, 25, 751–758. [Google Scholar] [CrossRef]
- Şimşek, B.; İç, Y.T.; Şimşek, E.H.A. RSM-Based Multi-Response Optimization Application for Determining Optimal Mix Proportions of Standard Ready-Mixed Concrete. Arab. J. Sci. Eng. 2015, 41, 1435–1450. [Google Scholar] [CrossRef]
- Asadzadeh, S.; Khoshbayan, S. Multi-objective optimization of influential factors on production process of foamed concrete using Box-Behnken approach. Constr. Build. Mater. 2018, 170, 101–110. [Google Scholar] [CrossRef]
- Shengli, S.; Junping, L.; Qi, L.; Fangru, N.; Jia, F.; Shulian, X. Optimized preparation of Phragmites australis activated carbon using the Box-Behnken method and desirability function to remove hydroquinone. Ecotoxicol. Environ. Saf. 2018, 165, 411–422. [Google Scholar] [CrossRef]
Figure 1.
The model concept diagram of the Box-Behnken design (BBD).

Figure 2.
Predicted and measured values of experimental properties. (a) Fluidity; (b) flexural strength and (c) compressive strength.
Figure 2.
Predicted and measured values of experimental properties. (a) Fluidity; (b) flexural strength and (c) compressive strength.

Figure 3.
Contour plots of the s/b ratio (A) and w/b ratio (B) on fluidity. (a) D = 0.2; (b) D = 0.38 and (c) D = 0.4.
Figure 3.
Contour plots of the s/b ratio (A) and w/b ratio (B) on fluidity. (a) D = 0.2; (b) D = 0.38 and (c) D = 0.4.

Figure 4.
Contour plots of the s/b ratio (A) and w/b ratio (B) on flexural strength. (a) C = 0.225, D = 0.4 and (b) C = 0.3, D = 0.2.
Figure 4.
Contour plots of the s/b ratio (A) and w/b ratio (B) on flexural strength. (a) C = 0.225, D = 0.4 and (b) C = 0.3, D = 0.2.

Figure 5.
Influence of basalt fiber content (C) and silica fume/cement ratio (D) on flexural strength. (a) Interaction of C and D and (b) contour plot of CD on flexural strength.
Figure 5.
Influence of basalt fiber content (C) and silica fume/cement ratio (D) on flexural strength. (a) Interaction of C and D and (b) contour plot of CD on flexural strength.

Figure 6.
Contour plots of the w/b ratio (B) and basalt fiber content (C) on compressive strength. (a) A = 0.9, D = 0.2; (b) A = 1, D = 0.3 and (c) A = 1.1, D = 0.4.
Figure 6.
Contour plots of the w/b ratio (B) and basalt fiber content (C) on compressive strength. (a) A = 0.9, D = 0.2; (b) A = 1, D = 0.3 and (c) A = 1.1, D = 0.4.

Figure 7.
Influence of CD and AD on compressive strength. (a) Interaction of C and D, D = 0.2, D = 0.4; (b) interaction of A and D, D = 0.2, D = 0.4; (c) interaction of C and D, D = 0.3 and (d) interaction of A and D, D = 0.3.
Figure 7.
Influence of CD and AD on compressive strength. (a) Interaction of C and D, D = 0.2, D = 0.4; (b) interaction of A and D, D = 0.2, D = 0.4; (c) interaction of C and D, D = 0.3 and (d) interaction of A and D, D = 0.3.


Table 1.
Chemical compositions of Portland cement and silica fume.
| Materials | Chemical Compositions (%) | |||||
|---|---|---|---|---|---|---|
| SiO2 | Al2O3 | CaO | MgO | Fe2O3 | SO3 | |
| Cement | 22.6 | 5.6 | 62.7 | 1.7 | 4.3 | 2.5 |
| Silica fume | 93.3 | 0.73 | 0.85 | 1.21 | 0.49 | 1.02 |
Table 2.
Properties of basalt fibers.
| Fiber Type | Length (mm) | Diameter (μm) | Linear Density (tex) | Tensile Strength (MPa) | Elastic Modulus (GPa) | Breaking Strength (N/tex) | Elongation (%) |
|---|---|---|---|---|---|---|---|
| Basalt fiber | 22 | 23 | 2392 | 2836 | 62 | 0.69 | 3 |
Table 3.
Chemical compositions of quartz sand.
| Mineral Compositions | SiO2 | Fe | Al2O3 | K2O | Na2O | H2O |
|---|---|---|---|---|---|---|
| Content (%) | 99.68 | 0.0062 | 0.0122 | 0.0011 | 0.002 | 0.02 |
Table 4.
The mix proportions of basalt fiber reactive powder concrete (BFRPC).
| Mix | Cement (kg) | Silica Fume (kg) | Quartz Sand (kg) | Quartz Powder (kg) | Basalt Fiber (kg) | Water (kg) | Water Reducer (kg) | |
|---|---|---|---|---|---|---|---|---|
| 0.15–0.3 (mm) | 0.3–0.6 (mm) | |||||||
| B-1 | 826.72 | 248.02 | 372.02 | 595.24 | 264.55 | 6 | 154.76 | 53.74 |
| B-2 | 761.27 | 228.38 | 418.70 | 669.91 | 243.61 | 6 | 142.51 | 49.48 |
| B-3 | 812.74 | 243.82 | 365.73 | 585.18 | 260.08 | 6 | 185.96 | 52.83 |
| B-4 | 749.40 | 224.82 | 412.17 | 659.47 | 239.81 | 6 | 171.46 | 48.71 |
| B-5 | 844.59 | 168.92 | 389.81 | 623.70 | 270.27 | 4 | 162.16 | 50.68 |
| B-6 | 844.59 | 168.92 | 389.81 | 623.70 | 270.27 | 8 | 162.16 | 50.68 |
| B-7 | 735.29 | 294.12 | 395.93 | 633.48 | 235.29 | 4 | 164.71 | 51.47 |
| B-8 | 735.29 | 294.12 | 395.93 | 633.48 | 235.29 | 8 | 164.71 | 51.47 |
| B-9 | 880.28 | 176.06 | 365.66 | 585.05 | 281.69 | 6 | 169.01 | 52.82 |
| B-10 | 811.69 | 162.34 | 412.09 | 659.34 | 259.74 | 6 | 155.84 | 48.70 |
| B-11 | 766.87 | 306.75 | 371.64 | 594.62 | 245.40 | 6 | 171.78 | 53.68 |
| B-12 | 706.21 | 282.49 | 418.30 | 669.27 | 225.99 | 6 | 158.19 | 49.44 |
| B-13 | 792.64 | 237.79 | 396.32 | 634.12 | 253.65 | 4 | 148.38 | 51.52 |
| B-14 | 779.79 | 233.94 | 389.89 | 623.83 | 249.53 | 4 | 178.42 | 50.69 |
| B-15 | 792.64 | 237.79 | 396.32 | 634.12 | 253.65 | 8 | 148.38 | 51.52 |
| B-16 | 779.79 | 233.94 | 389.89 | 623.83 | 249.53 | 8 | 178.42 | 50.69 |
| B-17 | 819.67 | 245.90 | 368.85 | 590.16 | 262.30 | 4 | 170.49 | 53.28 |
| B-18 | 755.29 | 226.59 | 415.41 | 664.65 | 241.69 | 4 | 157.10 | 49.09 |
| B-19 | 819.67 | 245.90 | 368.85 | 590.16 | 262.30 | 8 | 170.49 | 53.28 |
| B-20 | 755.29 | 226.59 | 415.41 | 664.65 | 241.69 | 8 | 157.10 | 49.09 |
| B-21 | 851.50 | 170.30 | 393.00 | 628.80 | 272.48 | 6 | 147.14 | 51.09 |
| B-22 | 837.80 | 167.56 | 386.68 | 618.68 | 268.10 | 6 | 176.94 | 50.27 |
| B-23 | 741.40 | 296.56 | 399.22 | 638.74 | 237.25 | 6 | 149.47 | 51.90 |
| B-24 | 729.29 | 291.72 | 392.69 | 628.31 | 233.37 | 6 | 179.70 | 51.05 |
| B-25 | 786.16 | 235.85 | 393.08 | 628.93 | 251.57 | 6 | 163.52 | 51.10 |
| B-26 | 786.16 | 235.85 | 393.08 | 628.93 | 251.57 | 6 | 163.52 | 51.10 |
| B-27 | 786.16 | 235.85 | 393.08 | 628.93 | 251.57 | 6 | 163.52 | 51.10 |
| B-28 | 786.16 | 235.85 | 393.08 | 628.93 | 251.57 | 6 | 163.52 | 51.10 |
| B-29 | 786.16 | 235.85 | 393.08 | 628.93 | 251.57 | 6 | 163.52 | 51.10 |
Table 5.
Levels of experimental factors, given in actual and code values.
| Symbol | Factors | Actual Values | Code Values | |||||
|---|---|---|---|---|---|---|---|---|
| A | Quartz sand/binder ratio | 0.9 | 1 | 1.1 | −1 | 0 | 1 | |
| B | Water/binder ratio | 0.18 | 0.2 | 0.22 | −1 | 0 | 1 | |
| C | Basalt fiber | By weight (kg/m3) | 4 | 6 | 8 | −1 | 0 | 1 |
| By volume (%) | 0.15 | 0.225 | 0.3 | |||||
| D | Silica fume/cement ratio | 0.2 | 0.3 | 0.4 | −1 | 0 | 1 | |
Table 6.
Experimental factors and response results of the BBD matrix design.
| Mix Number | Code Level of Variables | Response Values | |||||
|---|---|---|---|---|---|---|---|
| A | B | C | D | R1: Fluidity (cm) | R2: Flexural Strength (MPa) | R3: Compressive Strength (MPa) | |
| B-1 | −1 | −1 | 0 | 0 | 22.0 | 19.5 | 109.6 |
| B-2 | 1 | −1 | 0 | 0 | 17.0 | 18.9 | 112.8 |
| B-3 | −1 | 1 | 0 | 0 | 26.8 | 15.7 | 93.0 |
| B-4 | 1 | 1 | 0 | 0 | 23.1 | 16.6 | 94.6 |
| B-5 | 0 | 0 | −1 | −1 | 24.0 | 17.8 | 98.4 |
| B-6 | 0 | 0 | 1 | −1 | 21.6 | 21.7 | 108.4 |
| B-7 | 0 | 0 | −1 | 1 | 22.2 | 18.1 | 114.8 |
| B-8 | 0 | 0 | 1 | 1 | 19.8 | 18.1 | 96.2 |
| B-9 | −1 | 0 | 0 | −1 | 25.1 | 20.1 | 110.4 |
| B-10 | 1 | 0 | 0 | −1 | 20.9 | 18.6 | 92.9 |
| B-11 | −1 | 0 | 0 | 1 | 20.8 | 17.2 | 104.8 |
| B-12 | 1 | 0 | 0 | 1 | 21.7 | 16.4 | 111.5 |
| B-13 | 0 | −1 | −1 | 0 | 18.0 | 20.4 | 107.3 |
| B-14 | 0 | 1 | −1 | 0 | 24.5 | 16.2 | 97.2 |
| B-15 | 0 | −1 | 1 | 0 | 20.4 | 20.2 | 120.1 |
| B-16 | 0 | 1 | 1 | 0 | 24.8 | 17.0 | 96.0 |
| B-17 | −1 | 0 | −1 | 0 | 22.6 | 18.8 | 110.9 |
| B-18 | 1 | 0 | −1 | 0 | 21.2 | 17.6 | 109.2 |
| B-19 | −1 | 0 | 1 | 0 | 21.7 | 19.0 | 102.8 |
| B-20 | 1 | 0 | 1 | 0 | 22.6 | 18.0 | 105.4 |
| B-21 | 0 | −1 | 0 | −1 | 19.6 | 19.9 | 109.4 |
| B-22 | 0 | 1 | 0 | −1 | 27.5 | 17.6 | 98.5 |
| B-23 | 0 | −1 | 0 | 1 | 19.2 | 19.0 | 117.6 |
| B-24 | 0 | 1 | 0 | 1 | 21.7 | 16.5 | 88.2 |
| B-25 | 0 | 0 | 0 | 0 | 23.0 | 17.3 | 109.9 |
| B-26 | 0 | 0 | 0 | 0 | 22.5 | 17.0 | 100.5 |
| B-27 | 0 | 0 | 0 | 0 | 22.4 | 17.7 | 103.7 |
| B-28 | 0 | 0 | 0 | 0 | 21.5 | 18.3 | 107.8 |
| B-29 | 0 | 0 | 0 | 0 | 22.5 | 18.0 | 105.7 |
Table 7.
Parameter estimation and ANOVA of response surface model.
| Property | R1: Fluidity | R2: Flexural Strength | R3: Compressive Strength | ||||||
|---|---|---|---|---|---|---|---|---|---|
| Transformation | None | Ln (R2) | (R3)² | ||||||
| R² | 0.85 | 0.87 | 0.86 | ||||||
| Estimated Coefficient | F Value | p Value | Estimated Coefficient | F Value | p Value | Estimated Coefficient | F Value | p Value | |
| Intercept | 6.75 | − | − | 4.14 | − | − | 774.04 | − | − |
| A | −48.67 | 13.38 | 0.0013 | −0.166 | 3.03 | 0.0962 | −38373.37 | 0.13 | 0.72 |
| B | 336.67 | 88.79 | <0.0001 | −4.3 | 80.98 | <0.0001 | 173,679 | 77.82 | <0.0001 |
| C | NS | NS | NS | −1.007 | 4.82 | 0.0394 | 161,764 | 0.44 | 0.51 |
| D | −3.58 | 15.15 | 0.0007 | −0.61 | 23.8 | <0.0001 | 23425.17 | 1.59 | 0.22 |
| AD | 127.5 | 6.68 | 0.0166 | NS | NS | NS | 125,313 | 11.13 | 0.0033 |
| BC | NS | NS | NS | NS | NS | NS | −520,259 | 4.37 | 0.0495 |
| BD | 675 | 7.49 | 0.0117 | NS | NS | NS | −505,066 | 7.23 | 0.0141 |
| CD | NS | NS | NS | −6.6 | 9.03 | 0.0067 | −198,720 | 15.95 | 0.0007 |
| C² | NS | NS | NS | 7.21 | 10.6 | 0.0038 | NS | NS | NS |
| D² | NS | NS | NS | 2.728 | 4.68 | 0.0423 | NS | NS | NS |
| Model | − | 26.30 | <0.0001 | − | 19.32 | <0.0001 | − | 14.83 | <0.0001 |
| Lack of fit | − | 3.76 | 0.1040 | − | 1.28 | 0.4465 | − | 0.96 | 0.5831 |
Where factor A is the sand/binder ratio, B is the water/binder ratio, C is the fiber volume and D is the silica fume/cement ratio. NS means non-significant effect.
Table 8.
Statistical analysis of the experimental results.
| Statistical Parameters | Fluidity (cm) | Flexural Strength (MPa) | Compressive Strength (MPa) |
|---|---|---|---|
| Std. Dev. | 0.99 | 0.03 | 738.06 |
| Mean | 22.09 | 2.90 | 11031.73 |
| Coefficient of Variation (COV, %) | 3.98 | 0.92 | 5.56 |
| Adeq Precision | 19.76 | 17.48 | 14.48 |
| E95%CI | 1.19 | 0.64 | 3.49 |
Where E95%CI is the estimate error of the 95% confidence interval.
© 2019 by the authors. Licensee MDPI, Basel, Switzerland. This article is an open access article distributed under the terms and conditions of the Creative Commons Attribution (CC BY) license (http://creativecommons.org/licenses/by/4.0/).
Share and Cite
MDPI and ACS Style
Liu, H.; Liu, S.; Wang, S.; Gao, X.; Gong, Y. Effect of Mix Proportion Parameters on Behaviors of Basalt Fiber RPC Based on Box-Behnken Model. Appl. Sci. 2019, 9, 2031. https://doi.org/10.3390/app9102031
AMA Style
Liu H, Liu S, Wang S, Gao X, Gong Y. Effect of Mix Proportion Parameters on Behaviors of Basalt Fiber RPC Based on Box-Behnken Model. Applied Sciences. 2019; 9(10):2031. https://doi.org/10.3390/app9102031
Chicago/Turabian StyleLiu, Hanbing, Shiqi Liu, Shurong Wang, Xin Gao, and Yafeng Gong. 2019. "Effect of Mix Proportion Parameters on Behaviors of Basalt Fiber RPC Based on Box-Behnken Model" Applied Sciences 9, no. 10: 2031. https://doi.org/10.3390/app9102031
Note that from the first issue of 2016, this journal uses article numbers instead of page numbers. See further details here.