


Abstract
This study focuses on evaluating the effects of the fineness of fly ash on the strength, fracture toughness, and fracture resistance of concrete. Three fineness levels of fly ash that respectively pass sieves—no. 175, no. 250, and no. 32—were used. In addition to the control concrete mixture without fly ash, two fly ash replacement levels of 10% and 20% by weight of the cementitious material were selected for the concrete mixture. The experimental results indicate that the compressive strength of the fly ash concrete decreases with the increase in the replacement ratio of fly ash but increases in conjunction with the fineness level of fly ash. The presence of finer fly ash can have beneficial effects on the fracture energy (GF) of concrete at an early age (14 days) and attain a higher increment of GF at a later age (56 days). The concrete containing finer fly ash was found to present larger critical stress intensity factors (KSIC) at various ages, and the KSIC also increases in conjunction with the fineness levels of fly ash.
1. Introduction
Incorporating fly ash in concrete may affect the rate of hydration reaction and improve its microstructure [1,2]. The improvement in microstructure occurs due to grain and pore refinements, especially in the interfacial transition zone (ITZ) [3]. The improved microstructure can cause enhancement in the mechanical and durability-related properties of concrete. For the replacement amounts normally used, most fly ashes tend to reduce the early strength up to 28 days but increase the long term strength [4].
It is generally recognized that the use of finer fly ash may increase the properties of concrete [5] Mehta [6] reported that the majority of the reactive particles in fly ash are actually less than 10 micrometers in diameter. Studies [3,4,5,6] showed that increasing the fineness of fly ash by grinding improves the reactivity to some extent and increases the strength of the concrete, but eventually leads to increased water demand. Obla et al. [7] tested ultra-fine fly ash with a mean particle diameter of about 3 μm and found that significant improvements in the concrete strength and durability without loss in workability could be achieved with a commercially available ultra-fine fly ash. It could be primarily concluded that increasing the fineness of fly ash may increase the strength of concrete attributed to the micro-cracking resistance of cement paste, particularly in the ITZ.
The interfacial transition zone in concrete, which is often considered to be a three-phase material, is represented as the third phase [8,9]. Existing as a thin shell around the larger aggregate, the ITZ is generally weaker than either of the two main components of the concrete, which are the hydrated cement paste and the aggregate. The ITZ has less crack resistance, leading to the preferential occurrence of cracking. A major factor responsible for the poor strength of the ITZ is the presence of micro-cracks. Much of the physical nature of the response of concrete under loading can be described in terms of micro-cracks that can be observed at relatively low magnification. Cracking in concrete is mostly due to the tensile stress that occurs under load or environmental changes. As such, the failure of concrete in tension is governed by micro-cracks, which are associated particularly with the ITZ [10,11].
The tensile strength of concrete is a very essential property. Not only the tensile strength but also the behavior at the tensile fracture is of importance, particularly the fracture toughness. When concrete fails in tension, its behavior is characterized by both the peak stress and the energy required to fully generate a crack. Fracture mechanics can, in principle, be a suitable basis for analyzing the fracture toughness of concrete [12].
The defects and stress concentrations are the main factors causing failure. Concrete with defects or stress concentrations is more prone to cracking, which results in reduced strength. A structure made with high-strength concrete may fail under critical stress when small cracks simultaneously occur. It is essential, therefore, to determine fracture behavior and toughness for the widely used high-strength high-performance concretes that normally contain fly ash or furnace slag [13,14].
Due to the non-homogeneous characteristics of concrete, its fracture behavior is quite complicated. It has been proved that the methods developed in conventional fracture mechanics are unsuitable for the analysis of the influence of fracture toughness on the behavior of concrete structures [15,16]. Many theoretical models have been developed to make such an analysis possible. Among them, three well-known models are the fictitious crack model, the crack band model, and the two-parameter fracture model. By means of numerical techniques, for example, the finite element method, it is possible to use these models to make a theoretical analysis for the development of the damage zone and the complete behavior of the structure. As for the fracture mechanics of concrete, The International Union of Laboratories and Experts in Construction Materials, Systems and Structures (RILEM, from the name in French) [17] has provided a proposal of several methods for determining the fracture properties and parameters of concrete with a three-point bend test on a notched beam. Hillerborg [12] determined the fracture energy according to the fictitious crack model. Shah and Jenq [18] used the two-parameter fracture model to determine the critical stress intensity factor.
To investigate the effects of the fineness of fly ash on the strength and fracture toughness of concrete, this study adopted the three-point bend test to analyze the fracture energy and the critical stress intensity factor for evaluating the fracture toughness and fracture resistance of fly ash concrete.
2. Research Significance
Laboratory investigations have shown that when the fly ash particle size is reduced, its mechanical performance in concrete is improved. This study additionally confirms the comprehensive results that significant improvements in concrete strength and fracture toughness without loss in workability can be achieved with fine fly ashes, whose particle size passes through no. 250 and no. 325 sieves. Furthermore, the finer the fly ash is, the higher the enhancement of the strength, fracture energy, and critical stress intensity factor of the concrete will be.
3. Experimental Details
Concrete beam specimens were tested to determine the relationship between compressive strength, fracture energy, and stress intensity factor as a function of the cement replacement ratio of fly ash and the fineness of fly ash. The water-cementitious ratio (w/cm) used was 0.35 for all concrete mixtures. Three cement replacement ratios of 0%, 10%, and 20%, and three particle sizes of fly ash that pass through no. 175 (90 μm), no. 250 (63 μm), and no. 325 (45 μm) sieves were selected for the mixtures. The three-point bend test on notched beams was used to determine the load-deflection relations, and the maximum load for calculating the fracture energy (GF) and the critical stress intensity factor (KSIC).
3.1. Materials
Materials used for preparing the concrete mixtures included a Type I Portland cement (Table 1), river sand, crushed coarse aggregate with a maximum size of 10 mm, a naphthalene-sulfurate based superplasticizer, and fly ashes with three levels of fineness. Class F fly ash from the Taichung Power Station in Taiwan was used. The fly ash complied with the requirement of ASTM C168. Table 1 lists its chemical and physical properties. The fly ash was classified using the method of sieving and consisted of three lots:
Table 1.
Mixture proportions of fresh concrete.
- F175: fly ash passed sieve no. 175 (90 µm);
- F250: fly ash passed sieve no. 250 (63 µm);
- F325: fly ash passed sieve no. 325 (45 µm).
3.2. Mixture Proportions
In the experimental program, the control mixture (R0) without adding fly ash was designed to have a target compressive strength at 28 days of 63 MPa. The fly ash concrete mixtures designated as F1R1, F1R2, F2R1, F2R2, F3R1, and F3R2 were prepared using varying amounts of F175, F250, and F325 fly ash. F1, F2, and F3 referred to F175, F250, and F325, respectively, and R1 and R2 referred to the replacement ratio of 10% and 20%, respectively. The dosage of the superplasticizer was adjusted to produce the desired slump of 250 ± 25 mm and a slump-flow of 600 ± 50 mm. The mixture proportions and the slump test results are shown in Table 2 and Table 3, respectively.
Table 2.
Mixture proportions of concrete.
Table 3.
The slump test results of fresh concrete.
3.3. Preparation and Casting of Test Specimens
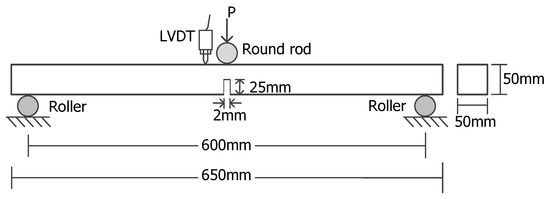
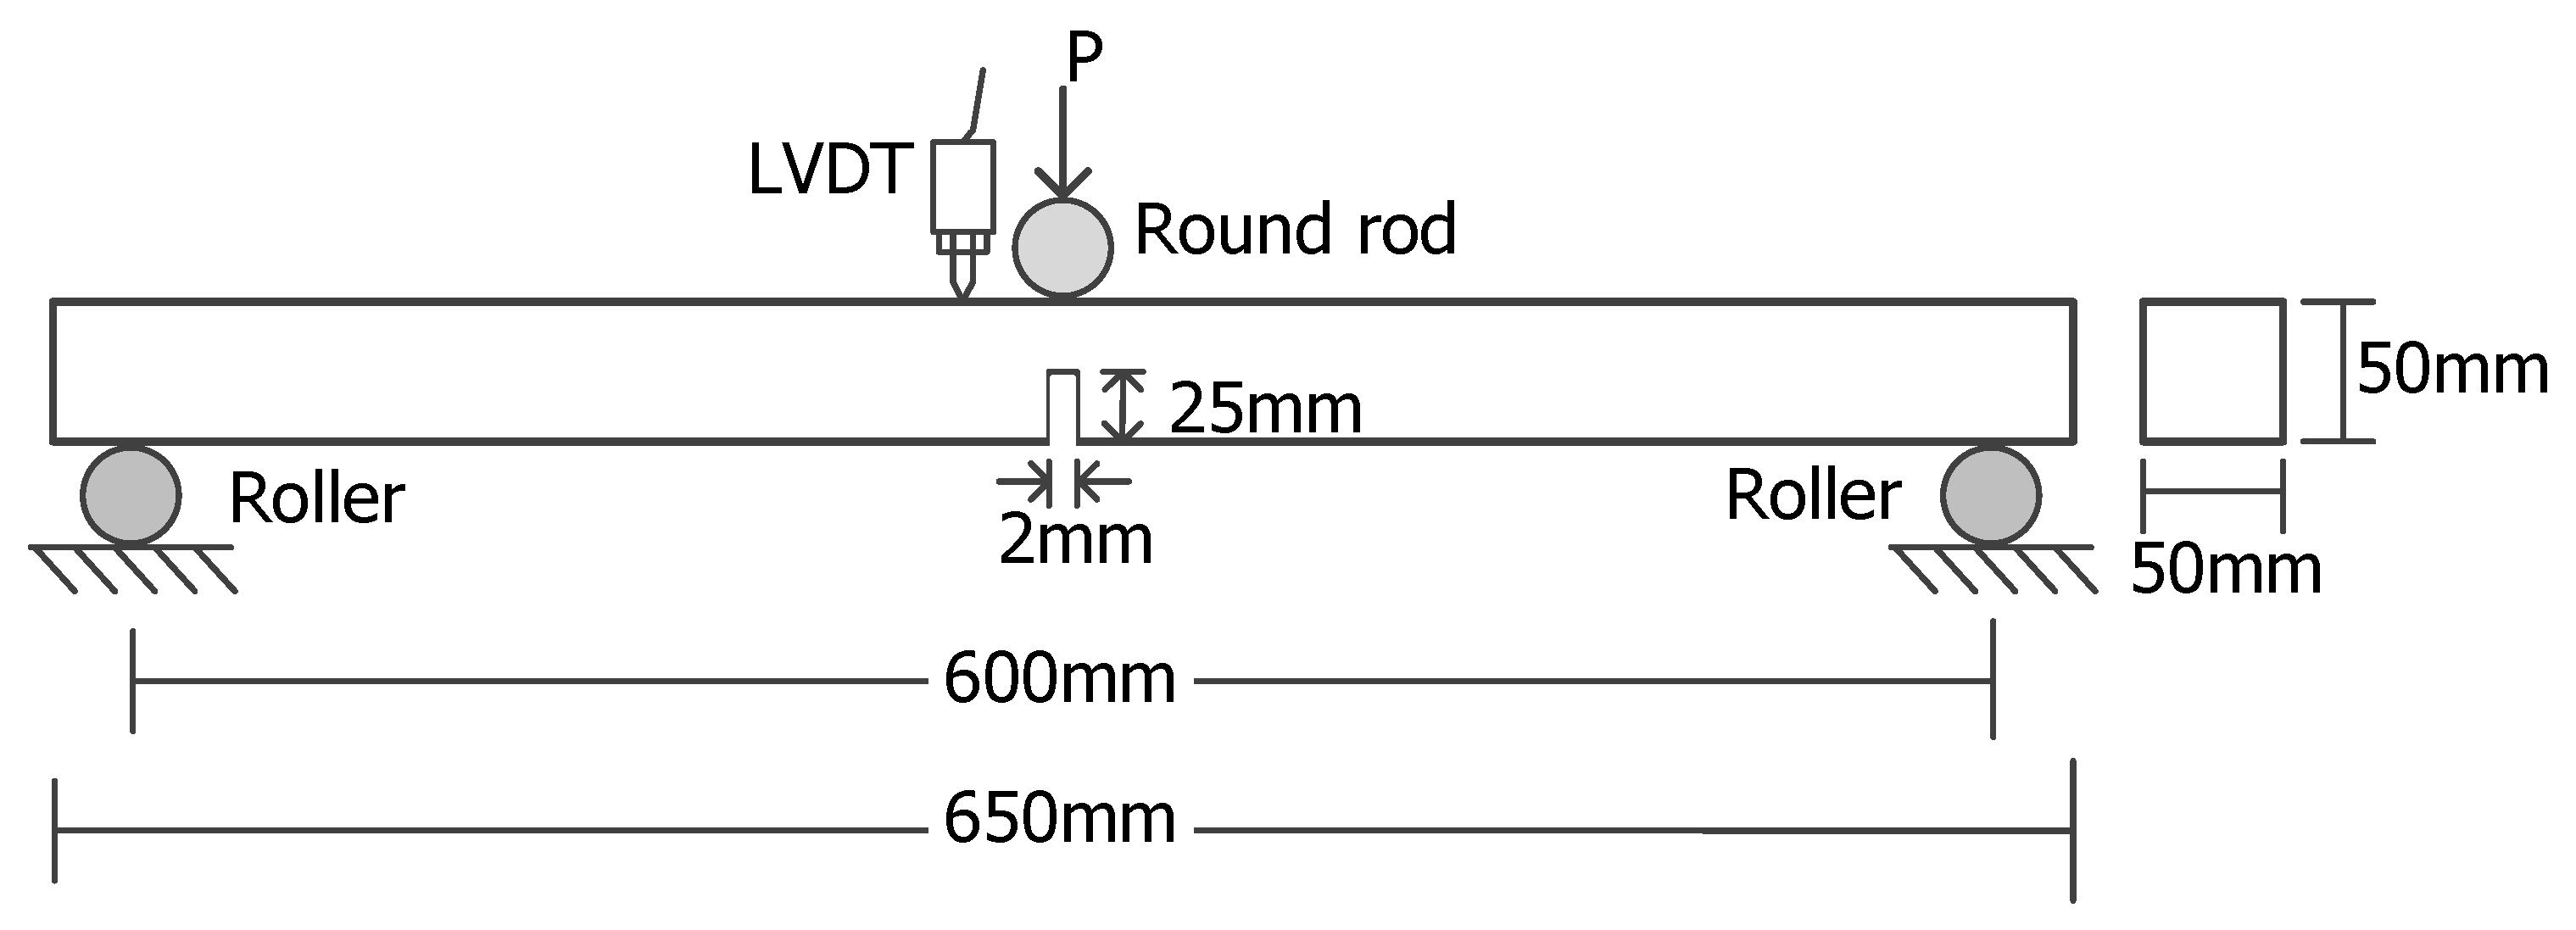
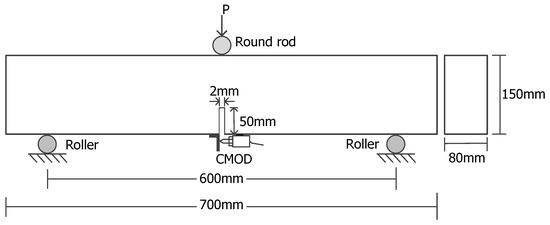
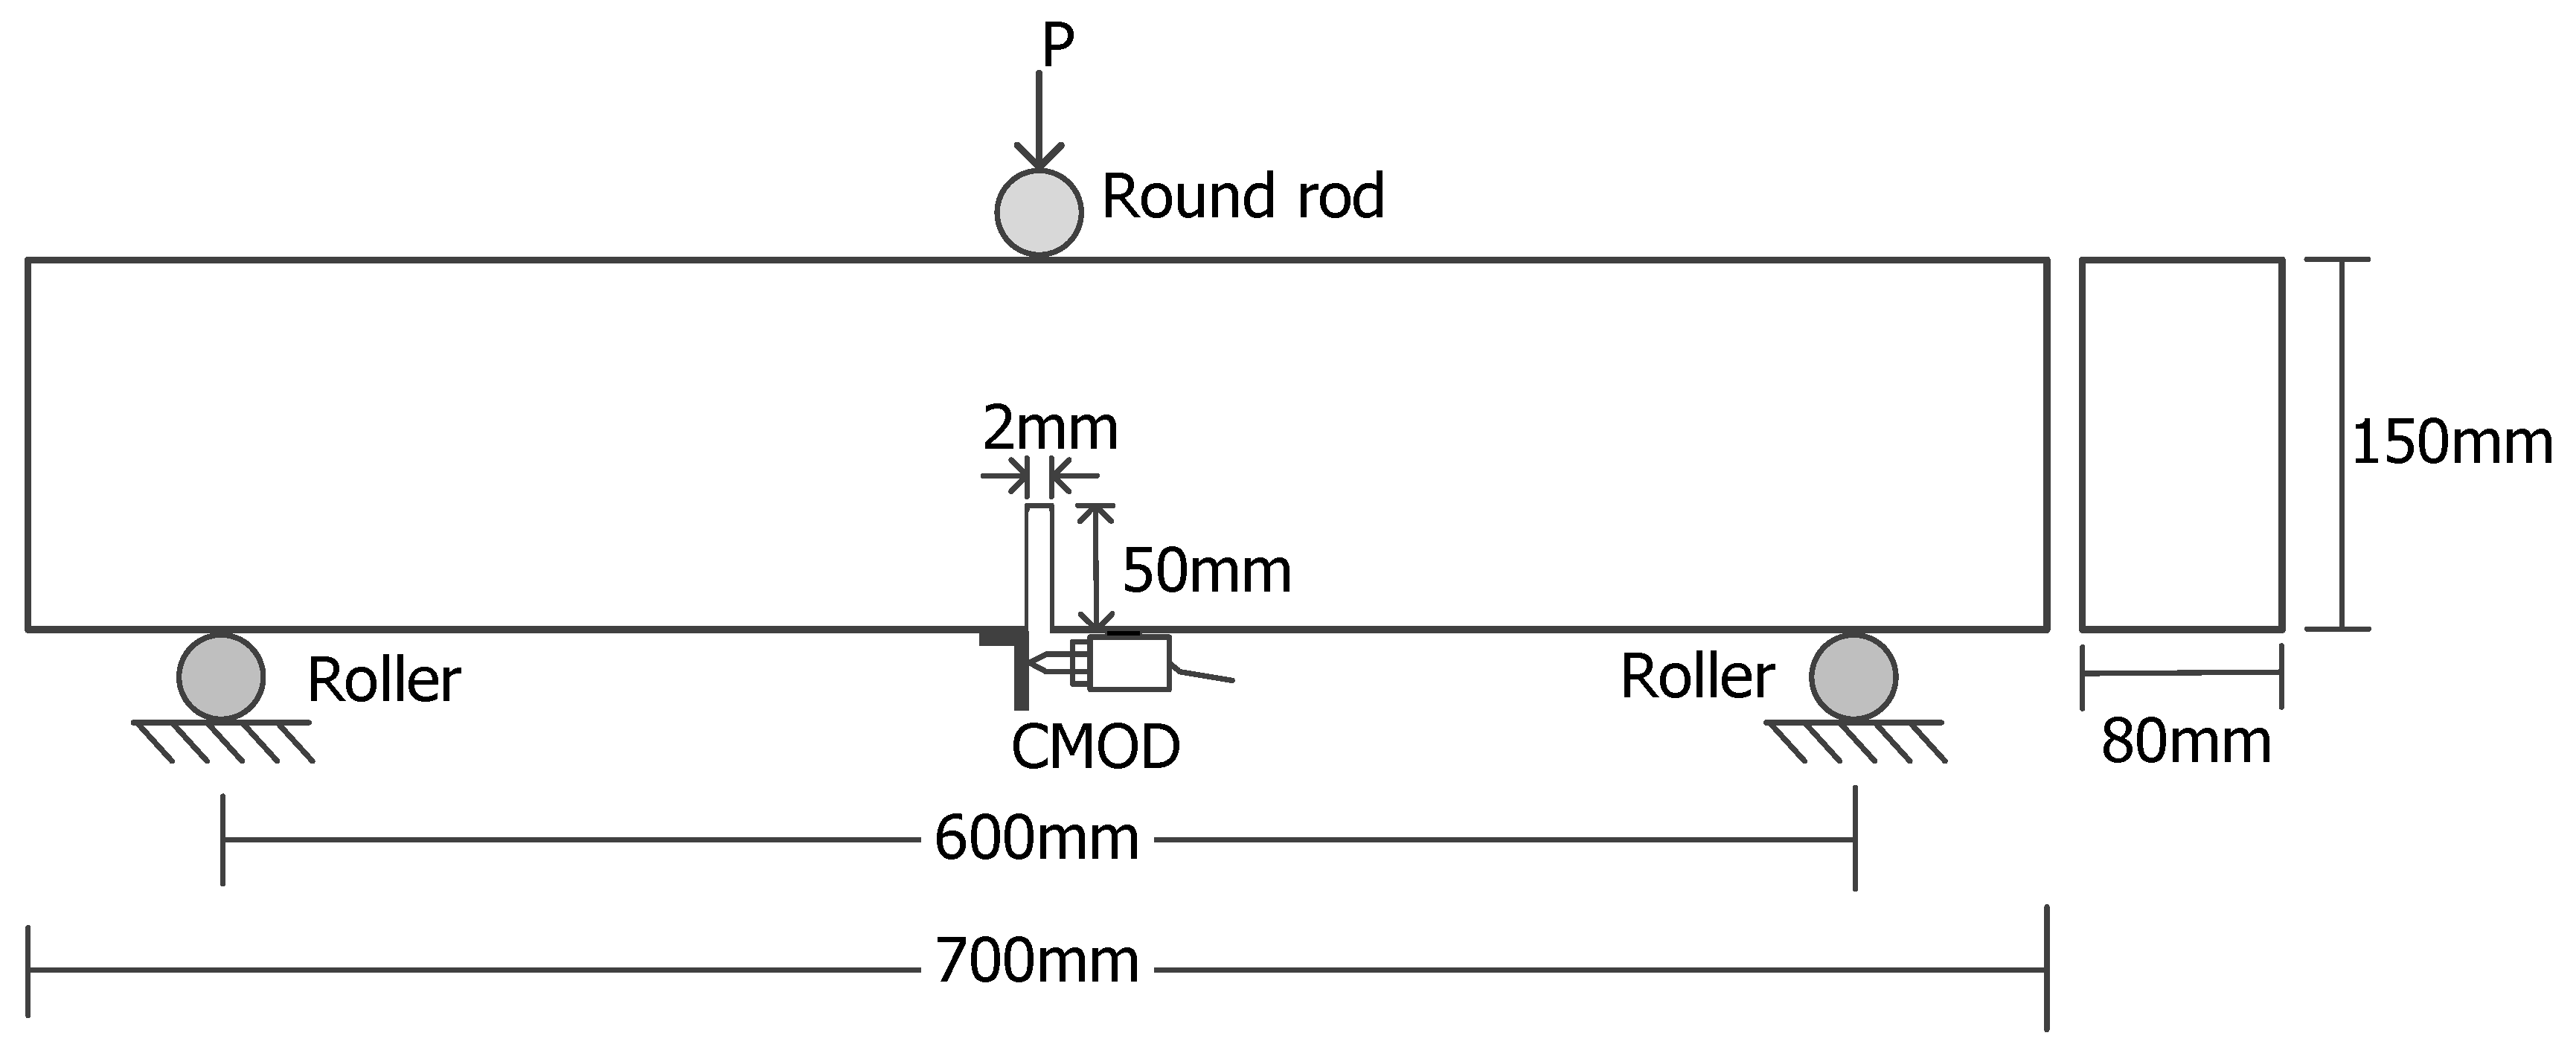
Cylinder specimens (100 × 200 mm) were cast from each mixture for compression tests, three cylinders each for testing at five ages. Flexure specimens with dimensions of 50 × 50 × 650 mm and 80 × 150 × 700 mm were cast for the determination of GF and KSIC, respectively. Four specimens were fabricated for each mixture for the testing of each two specimens at two stages of 14 and 56 days. The specimens were prepared in accordance with ASTM C192. After casting, test specimens were covered with a plastic sheet for 24 hours. Then, they were demolded and put into a 100% relative humidity (RH) moist-curing room at about 23 °C until the time of testing. At least 24 hours before the specimens were tested, the fracture energy specimens and the critical stress intensity factor specimens, as shown in Figure 1 and Figure 2, were prepared by cutting a 25 mm deep by 2 mm width notch and a 50 mm by 2 mm notch, respectively, on one side at midspan.
Figure 1.
Set-up of the three-point bending test for the determination of the fracture energy of concrete. LVDT is the linear variable differential transformer and P is the load.
Figure 2.
Set-up of the three-point bending test for the determination of the critical stress intensity factor of concrete. CMOD is the crack mouth opening displacement.
3.4. Testing of Specimens
A compression test was carried out in accordance with ASTM C39. The three-point bend test was performed on the notched beam as follows to determine the GF and KSIC:
1. Test for determining GF.
The fracture energy test followed the guidelines established by RILEM [17] using a closed-loop testing machine. The testing arrangement is shown in Figure 1. A linear variable differential transformer (LVDT) was installed at midspan of the beam to measure the deflection. The loading velocity was chosen so that the maximum load was reached 30 s after the loading started. The loading rate selected was 0.25 mm/min. A load-deflection (F-δ) curve was then plotted, with the energy “W0” representing the area under the curve. The fracture energy (GF) according to this work of fracture method can be calculated as [12,18]:
where W0 = area under the load-deflection curve (N/m); mg = weight of the specimen (kg); g = acceleration due to gravity; δ0 = maximum deflection recorded (m); and A = cross-sectional area of the beam above the notch (m2).
2. Test for determining KSIC.
The test for the determination of KSIC followed the test method suggested by Shah and Jenq [18] using a closed-loop testing machine under the crack mouth opening displacement (CMOD) control. The test set-up is shown in Figure 2. A clip gauge was used to measure the CMOD. The CMOD and the applied load were recorded continuously during the test. The test procedure included loading and unloading. The test was started from loading until the peak load was reached, and then the applied load was manually reduced (also termed unloading) when the load passed the maximum load and was at about 95% of the peak load. When the applied load was reduced to zero, the specimen was reloaded. Each loading and unloading cycle was finished in about one min. Only one cycle of loading-unloading was required for the test. The KSIC was calculated using the following Equation:
in which
where Pmax = the measured maximum load (N); S = the span of the beam (m); b = beam width (m); d = beam depth (m); L = beam length (m); W’ = self-weight of the beam (N); αc = critical effective crack length (m); and α = αc/d.
4. Results and Discussion
4.1. Compressive Strength
Compressive strengths were determined at five ages of 7, 14, 28, 56, and 91 days on concrete stored under moist-curing conditions. The results are given in Table 4. As can be seen in Table 3, the slump values of all concrete mixtures were in the range of 240–260 mm, and similarly, the slump-flow fell in the range of 550–640 mm. This indicated that all mixtures had quite similar workability. In addition, all mixtures were proportioned to have an equivalent target strength of 63 MPa at the age of 28 days. This was generally achieved, except for mixture F1R2. In this case, the strength equivalence was achieved later, at the age of 56 days.
Table 4.
Compressive strength of concrete cylinders.
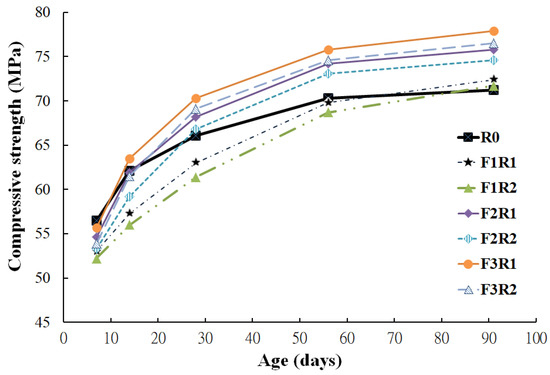
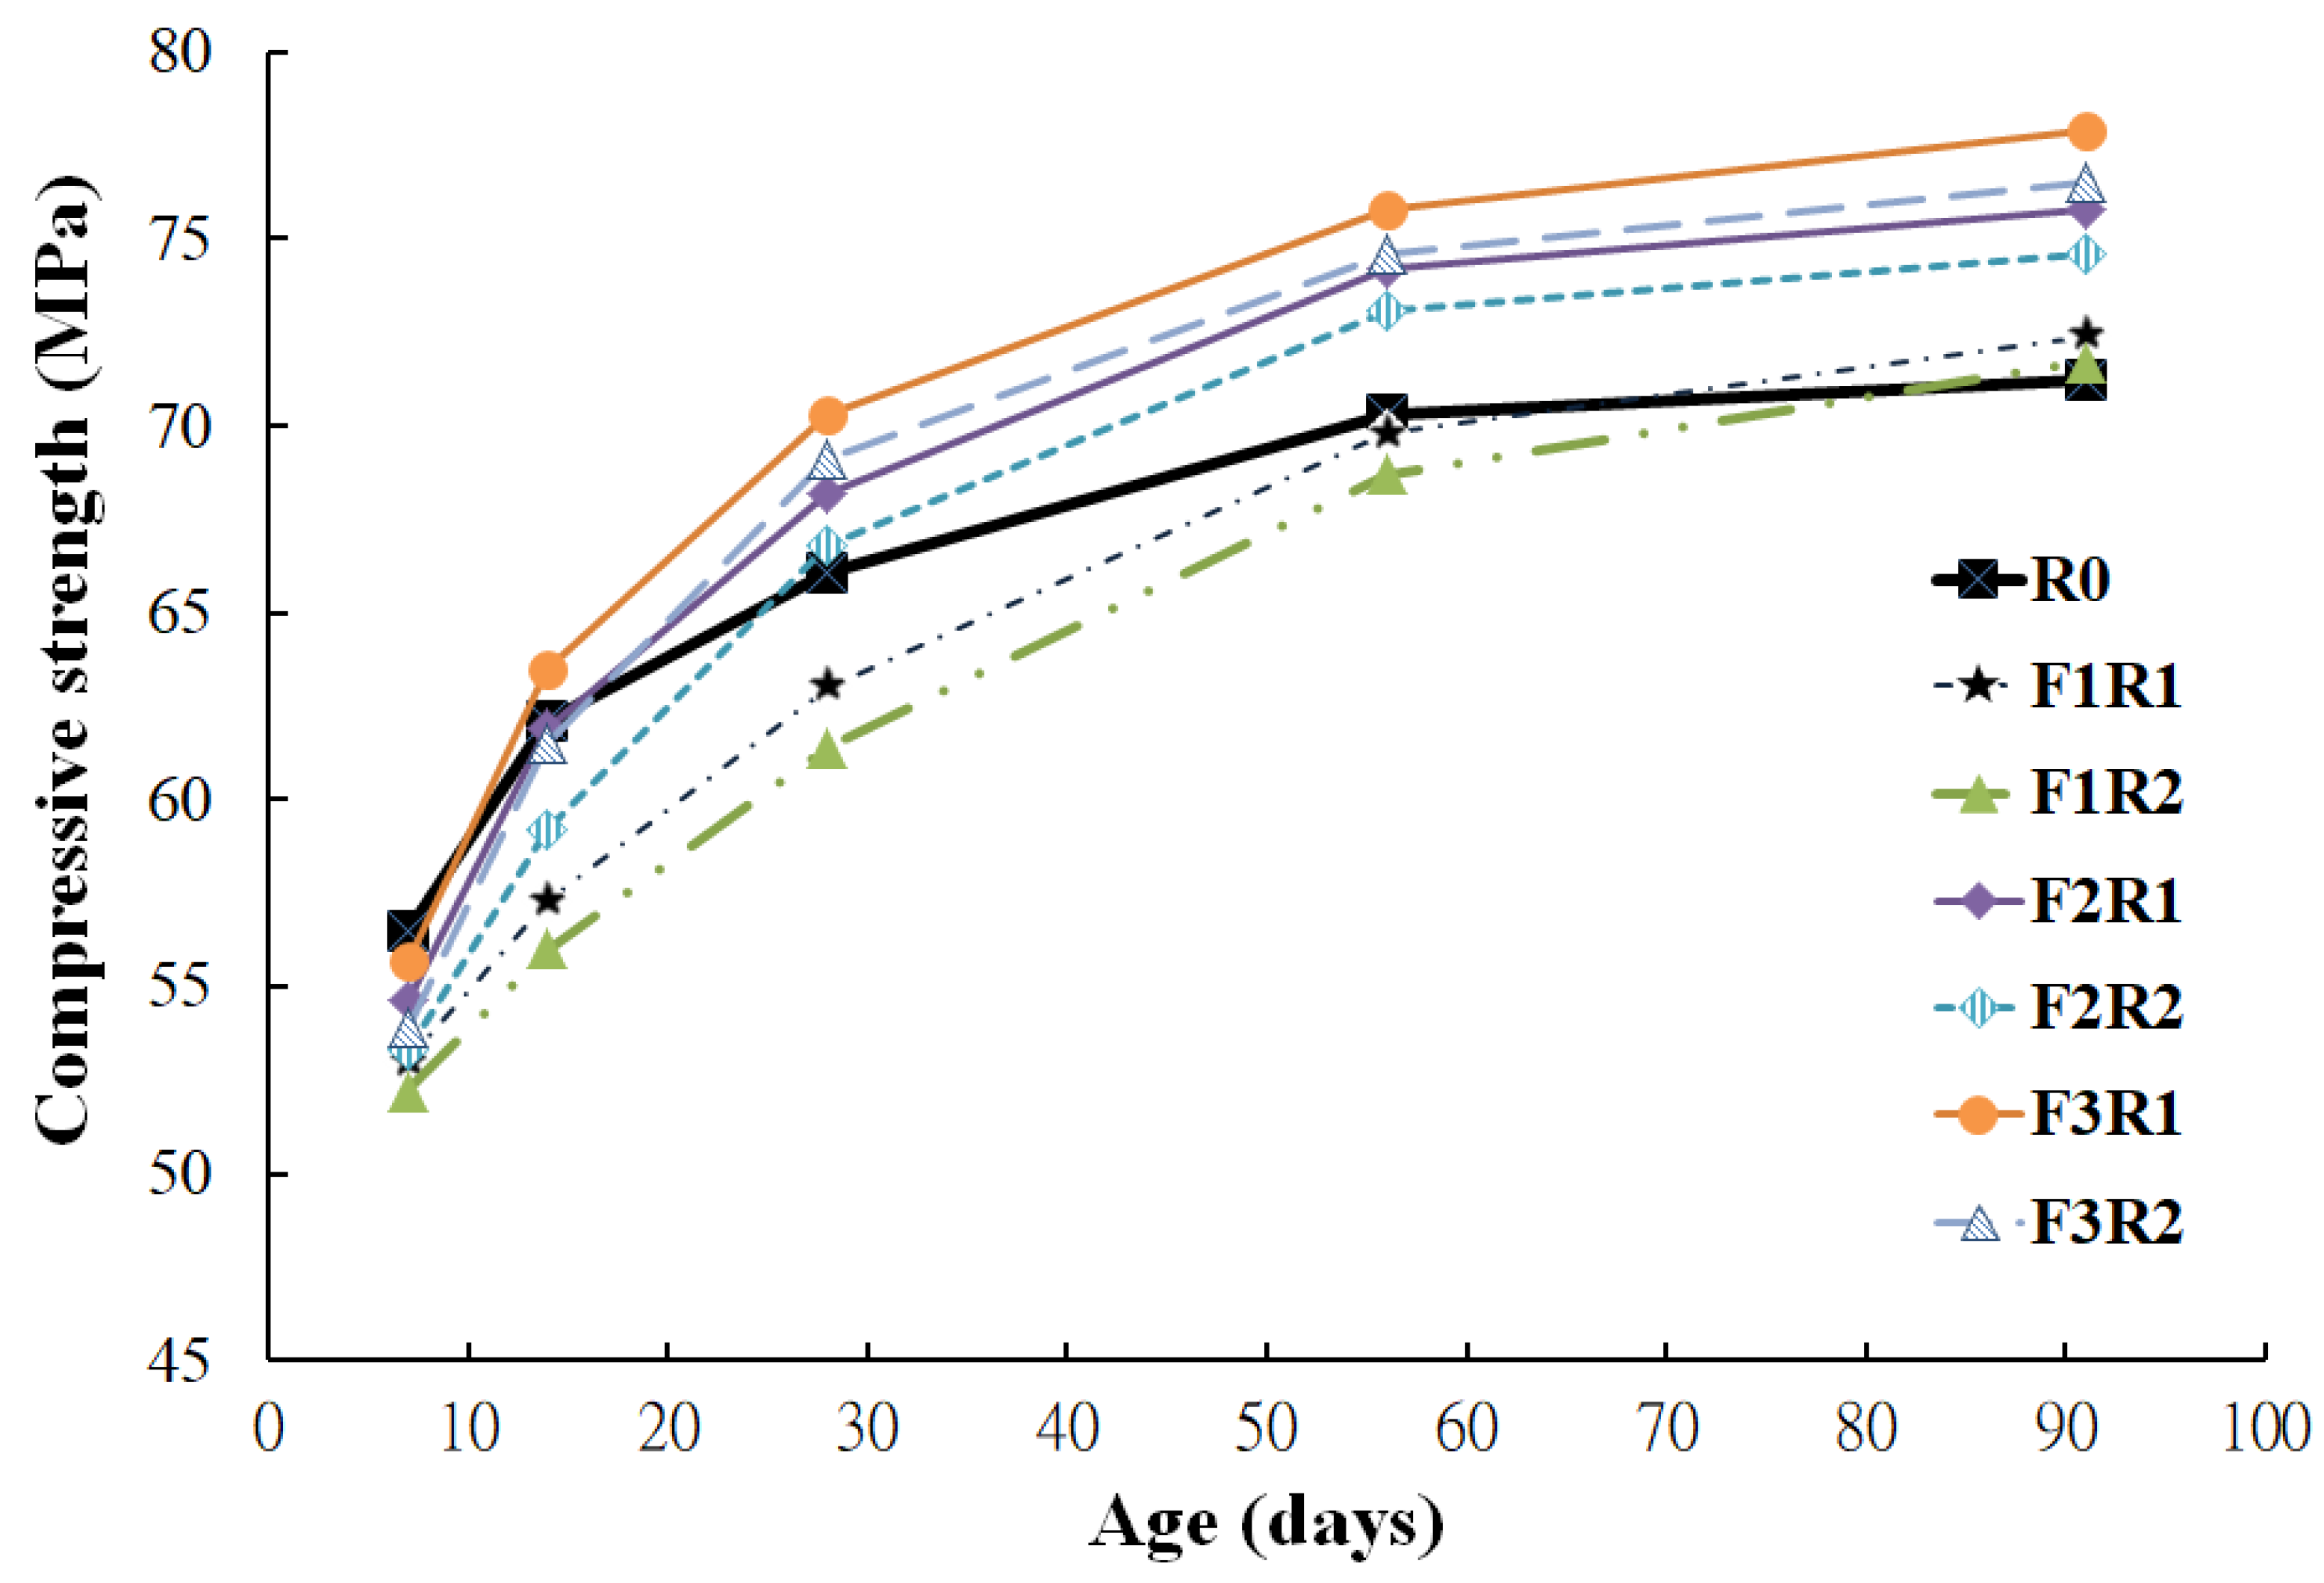
Figure 3 shows the strength development for each concrete mixture. At an early age (7 days), as expected, the control mixture (R0) without fly ash displayed higher strength than the other fly ash mixtures. The early strength gain of the control mixture was superior to that of the fly ash mixtures, indicating that replacing any amount of cement with fly ash of various fineness may reduce the strength gain of the concrete. In addition, the concrete incorporating more fly ash (20%) presented lower strength than that with lower fly ash content (10%). Nevertheless, the curve slope of the fly ash mixtures in Figure 3 tended to be steeper than that of the control mixture at later ages. In other words, the strength increment versus age for the fly ash mixture was larger than that of the control mixture. Consequently, the strength of each fly ash mixture exceeded that of the control mixture at later ages.
Figure 3.
Compressive strength development for cylindrical specimens.
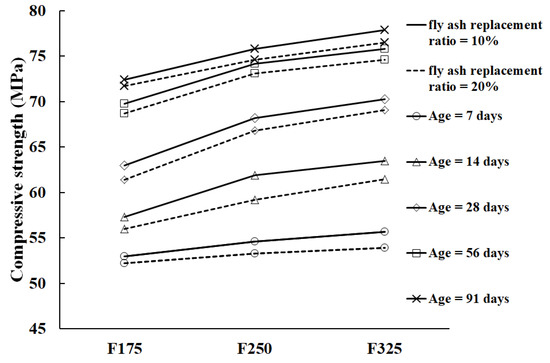
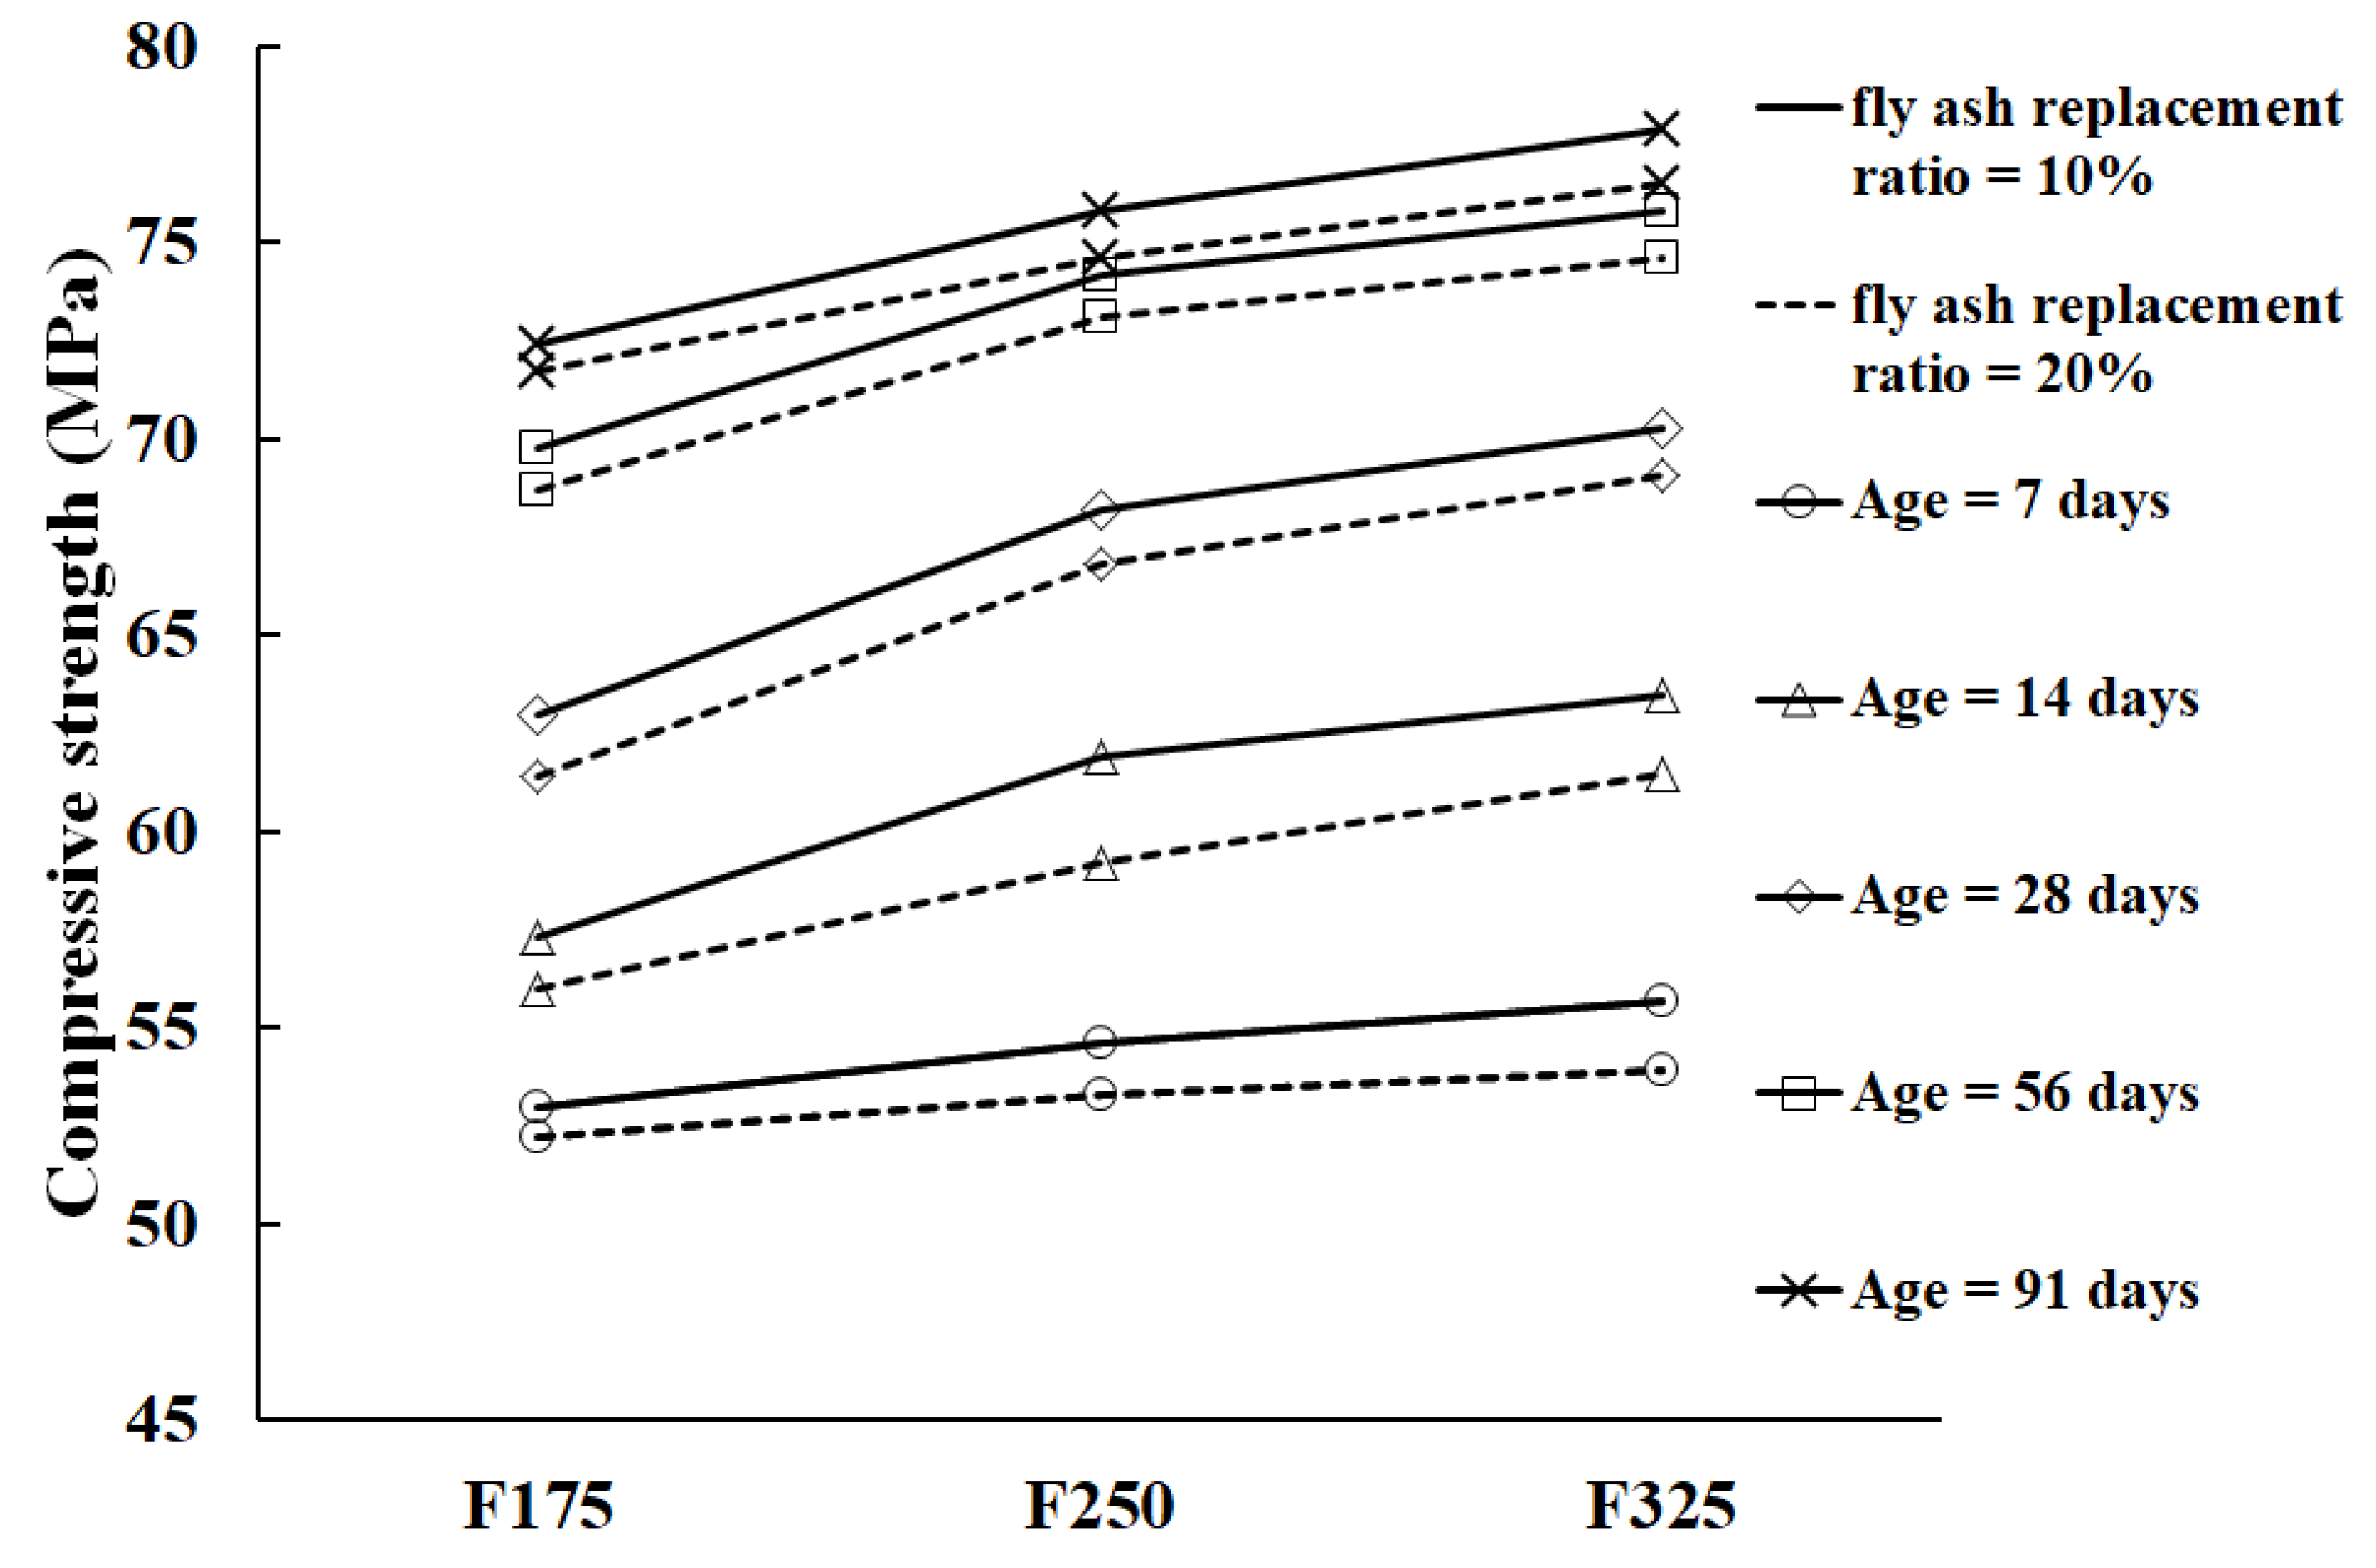
On the other hand, it can be seen in Table 4 that for the same replacement ratio (20%) of fly ash, mixture F3R2, had the highest strength at an early age (7 days), followed by F2R2, and the F1R2 had the lowest. This revealed that incorporating finer fly ash in concrete may fill the micro-voids much better and produce higher packing density, resulting in a larger strength enhancement. In addition, a beneficial effect of the fineness of fly ash on the concrete strength can be seen in Figure 4; the compressive strength of fly ash concrete increased in accordance with the enhancement of the fineness level of fly ash for each age and various fly ash replacement ratios.
Figure 4.
Compressive strength of fly ash concrete versus the particle size of fly ash.
Moreover, as seen in Table 4, there was a significant strength gain from 7 to 28 days, and again from 28 days to 91 days for the mixtures containing finer fly ash. For example, the strength increment of the mixtures F2R1 and F3R1, which contained finer fly ash, displayed an increased rate from 100% at 7 days to 125% and 126% at 28 days, respectively, and 139% and 140% at 91 days, respectively, which were obviously larger than those of the corresponding mixtures F1R1 that increased from 100% at 7 days to 119% at 28 days and 137% at 91 days. At 28 days, the strengths of the finer fly ash mixtures of F2R1, F2R2, F3R1, and F3R2 were shown to consistently exceed that of the control mixture. This was particularly significant considering that the cement replacement of finer fly ash in each case was only 10–20%. In addition, the highest strength achieved at 91 days was 76.5 MPa for the mixture F3R2 with 20% F325 fly ash replacement, while the strength obtained for the corresponding control concrete (R0) was the relatively lower value of 71.2 MPa.
4.2. Fracture Energy
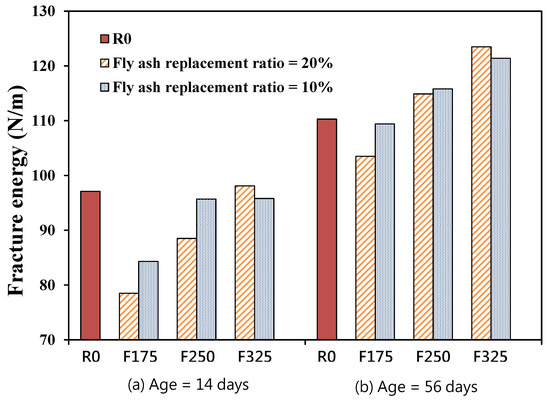
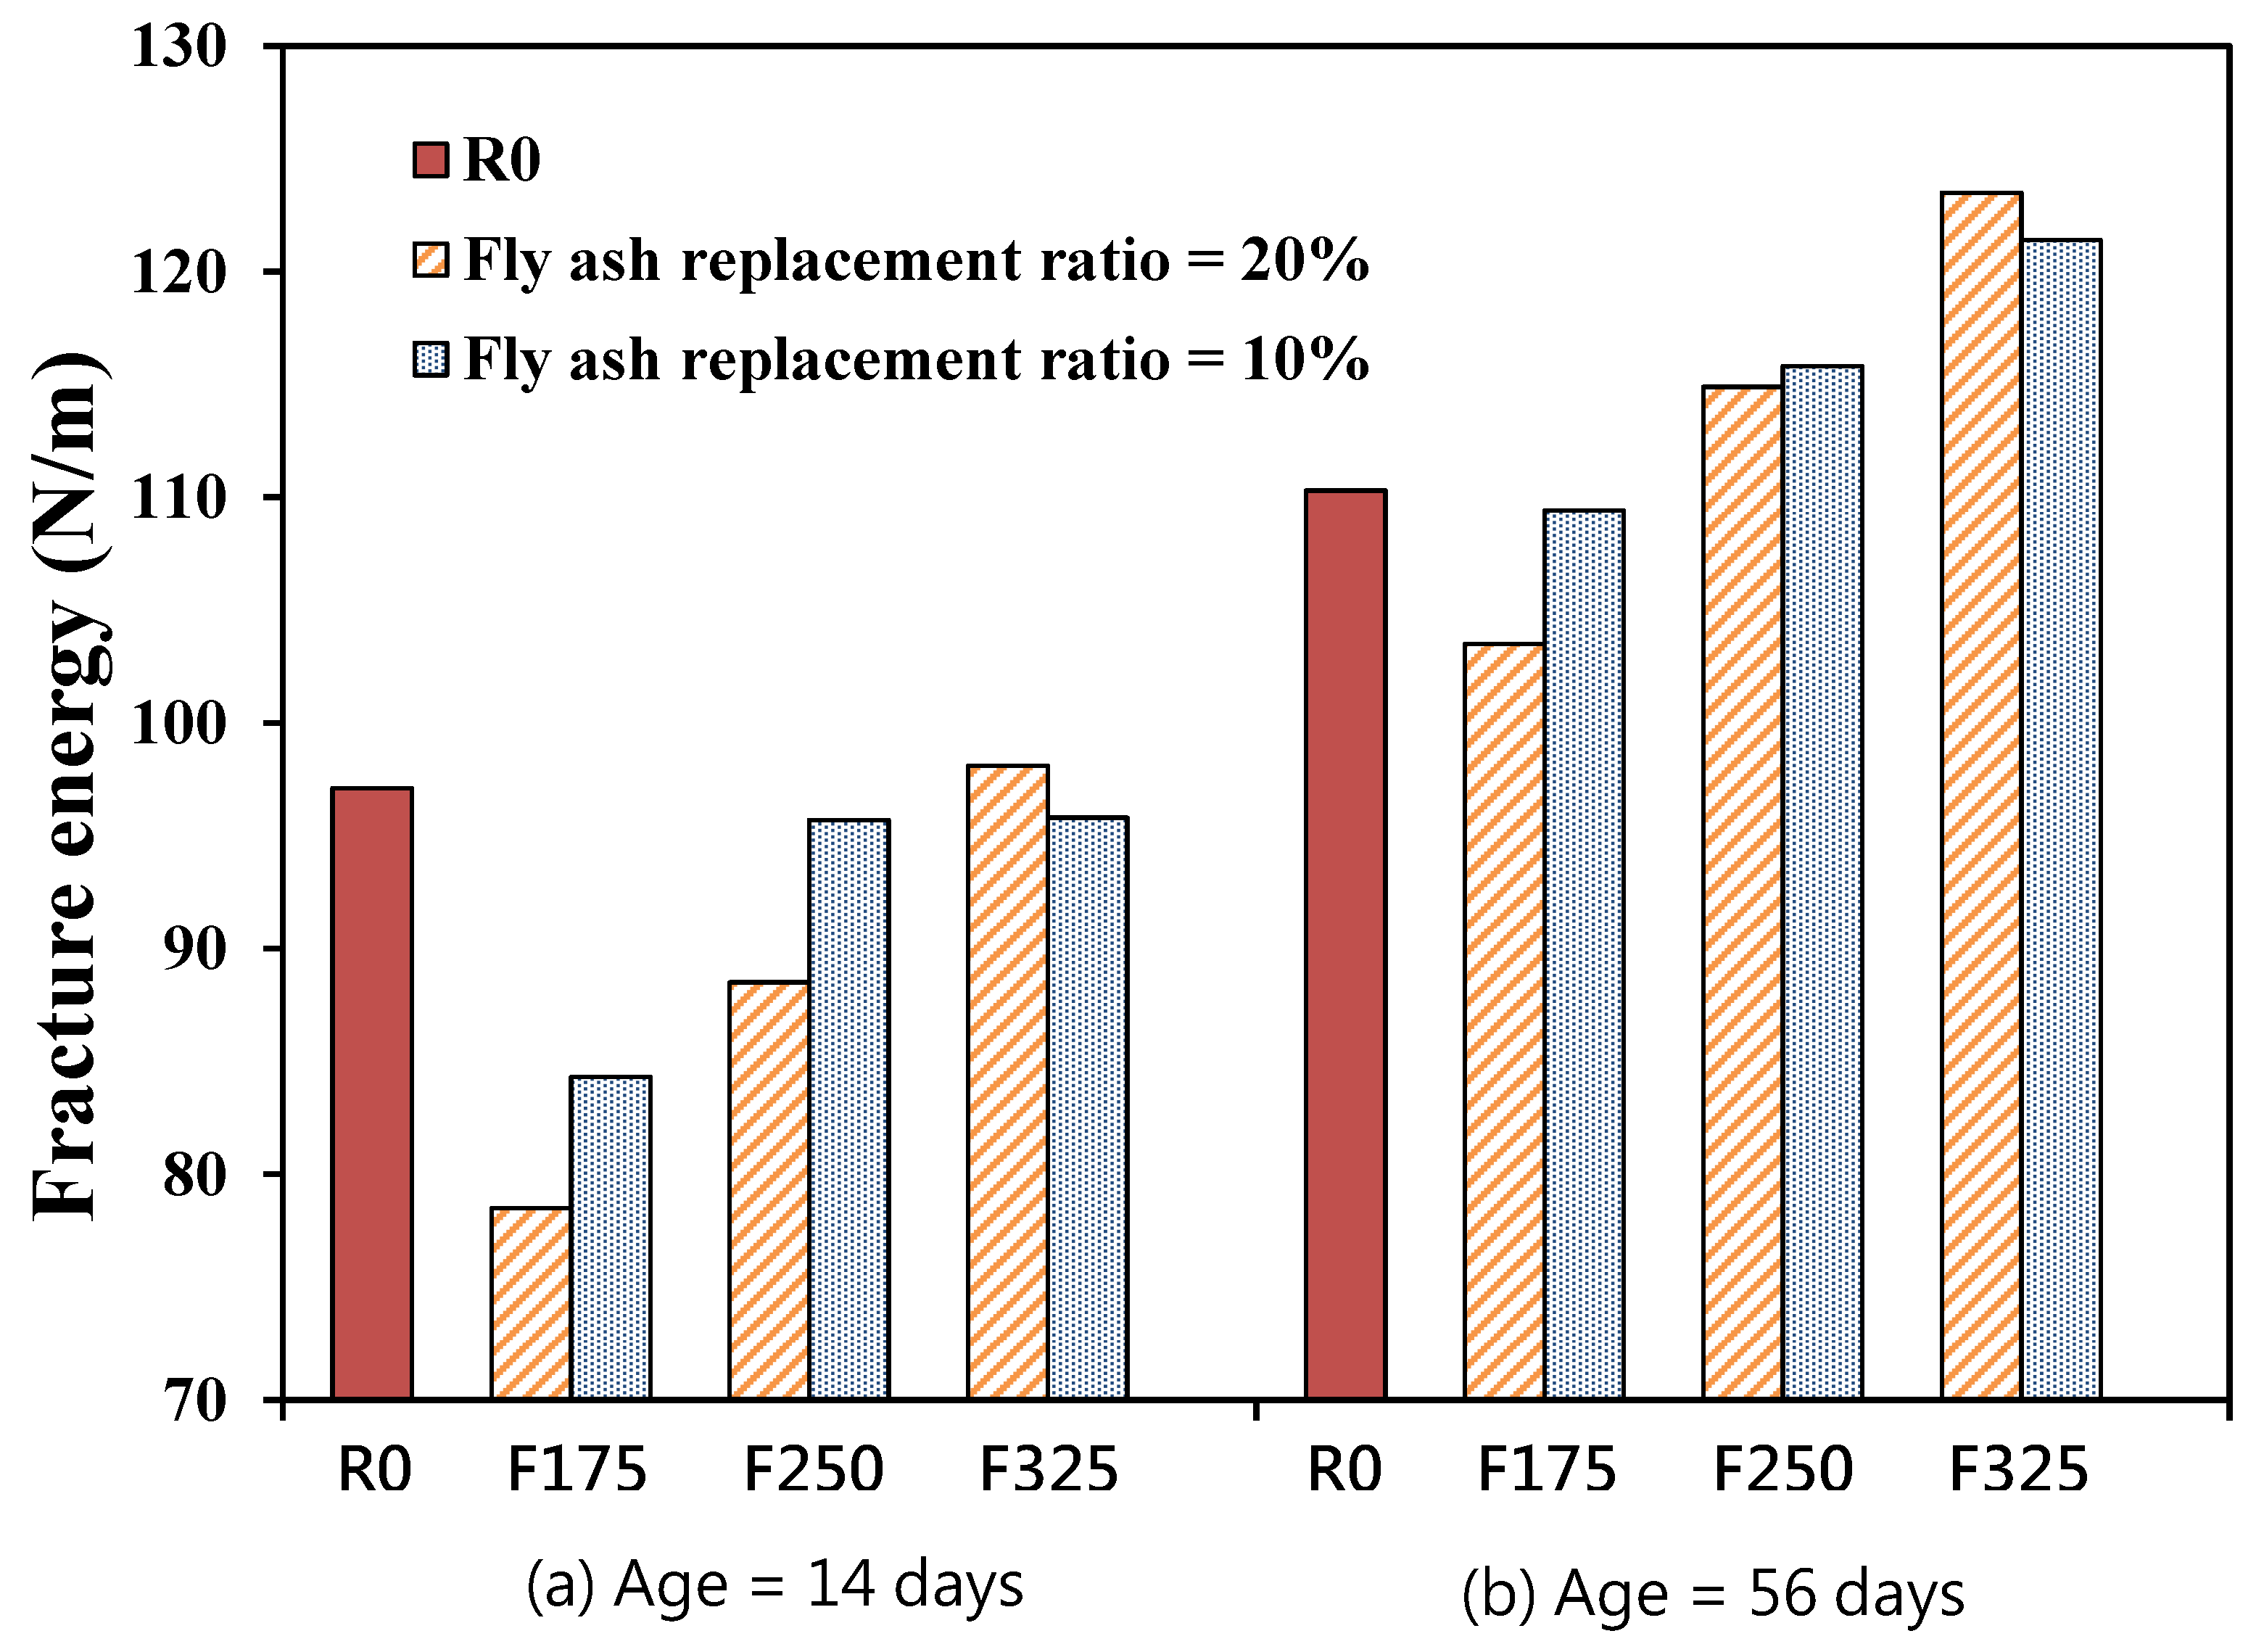
Fracture energy (GF) is the energy dissipated per unit area during the formation of a crack. In this research, GF was determined using a notched beam in a three-point bending test. Load-deflection curves were plotted from the tests. The energy absorbed in the test to the point of failure was represented by the area below the load-deflection curve for the specimen. This area represented the fracture energy per unit area of the fracture surface. The GF was calculated using Equation (1). Concrete specimens were tested at 14 and 56 days. Table 5 lists the test results. It shows that, at early ages, the GF values of all fly ash concrete were lower than that of control concrete without fly ash (R0), except for the fly ash mixture F3R2. Nevertheless, the presence of the finer fly ash had a beneficial effect on the GF of concrete. As shown in Figure 5, when the fineness level of the fly ash increased, the GF value of the concrete increased. Even at the earlier age of 14 days, the GF value of the mixture with finer fly ash (F3R2) was in turn higher than those of the mixtures F2R2 and F1R2 for the similar fly ash replacement ratio of 20%; furthermore, the GF of the mixture F3R1 was higher than those of F2R1 and F1R1. This implies that although the pozzolanic reaction had not yet occurred at the early ages, the superior filling effects of the finer fly ash could increase the denseness of the concrete, resulting in increased fracture toughness. After 56 days, the GF values of the fly ash concrete mixtures all exceeded that of the control mixture, except for the mixture F1R2. In addition, it was also found that the increment of the fracture energy for each fly ash concrete from 14 days to 56 days was attained by 21–31%, which was much higher than that of the control concrete (13.6%). This signifies that, during this period, the pozzolanic reaction of fly ash became active, which together with the filling effect, enhanced the fracture toughness of the fly ash concrete.
Table 5.
Fracture energy of concrete.
Figure 5.
Fracture energy of concretes with various fineness levels and the replacement ratios of fly ash.
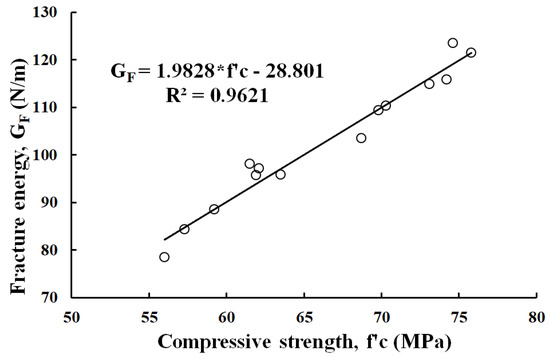
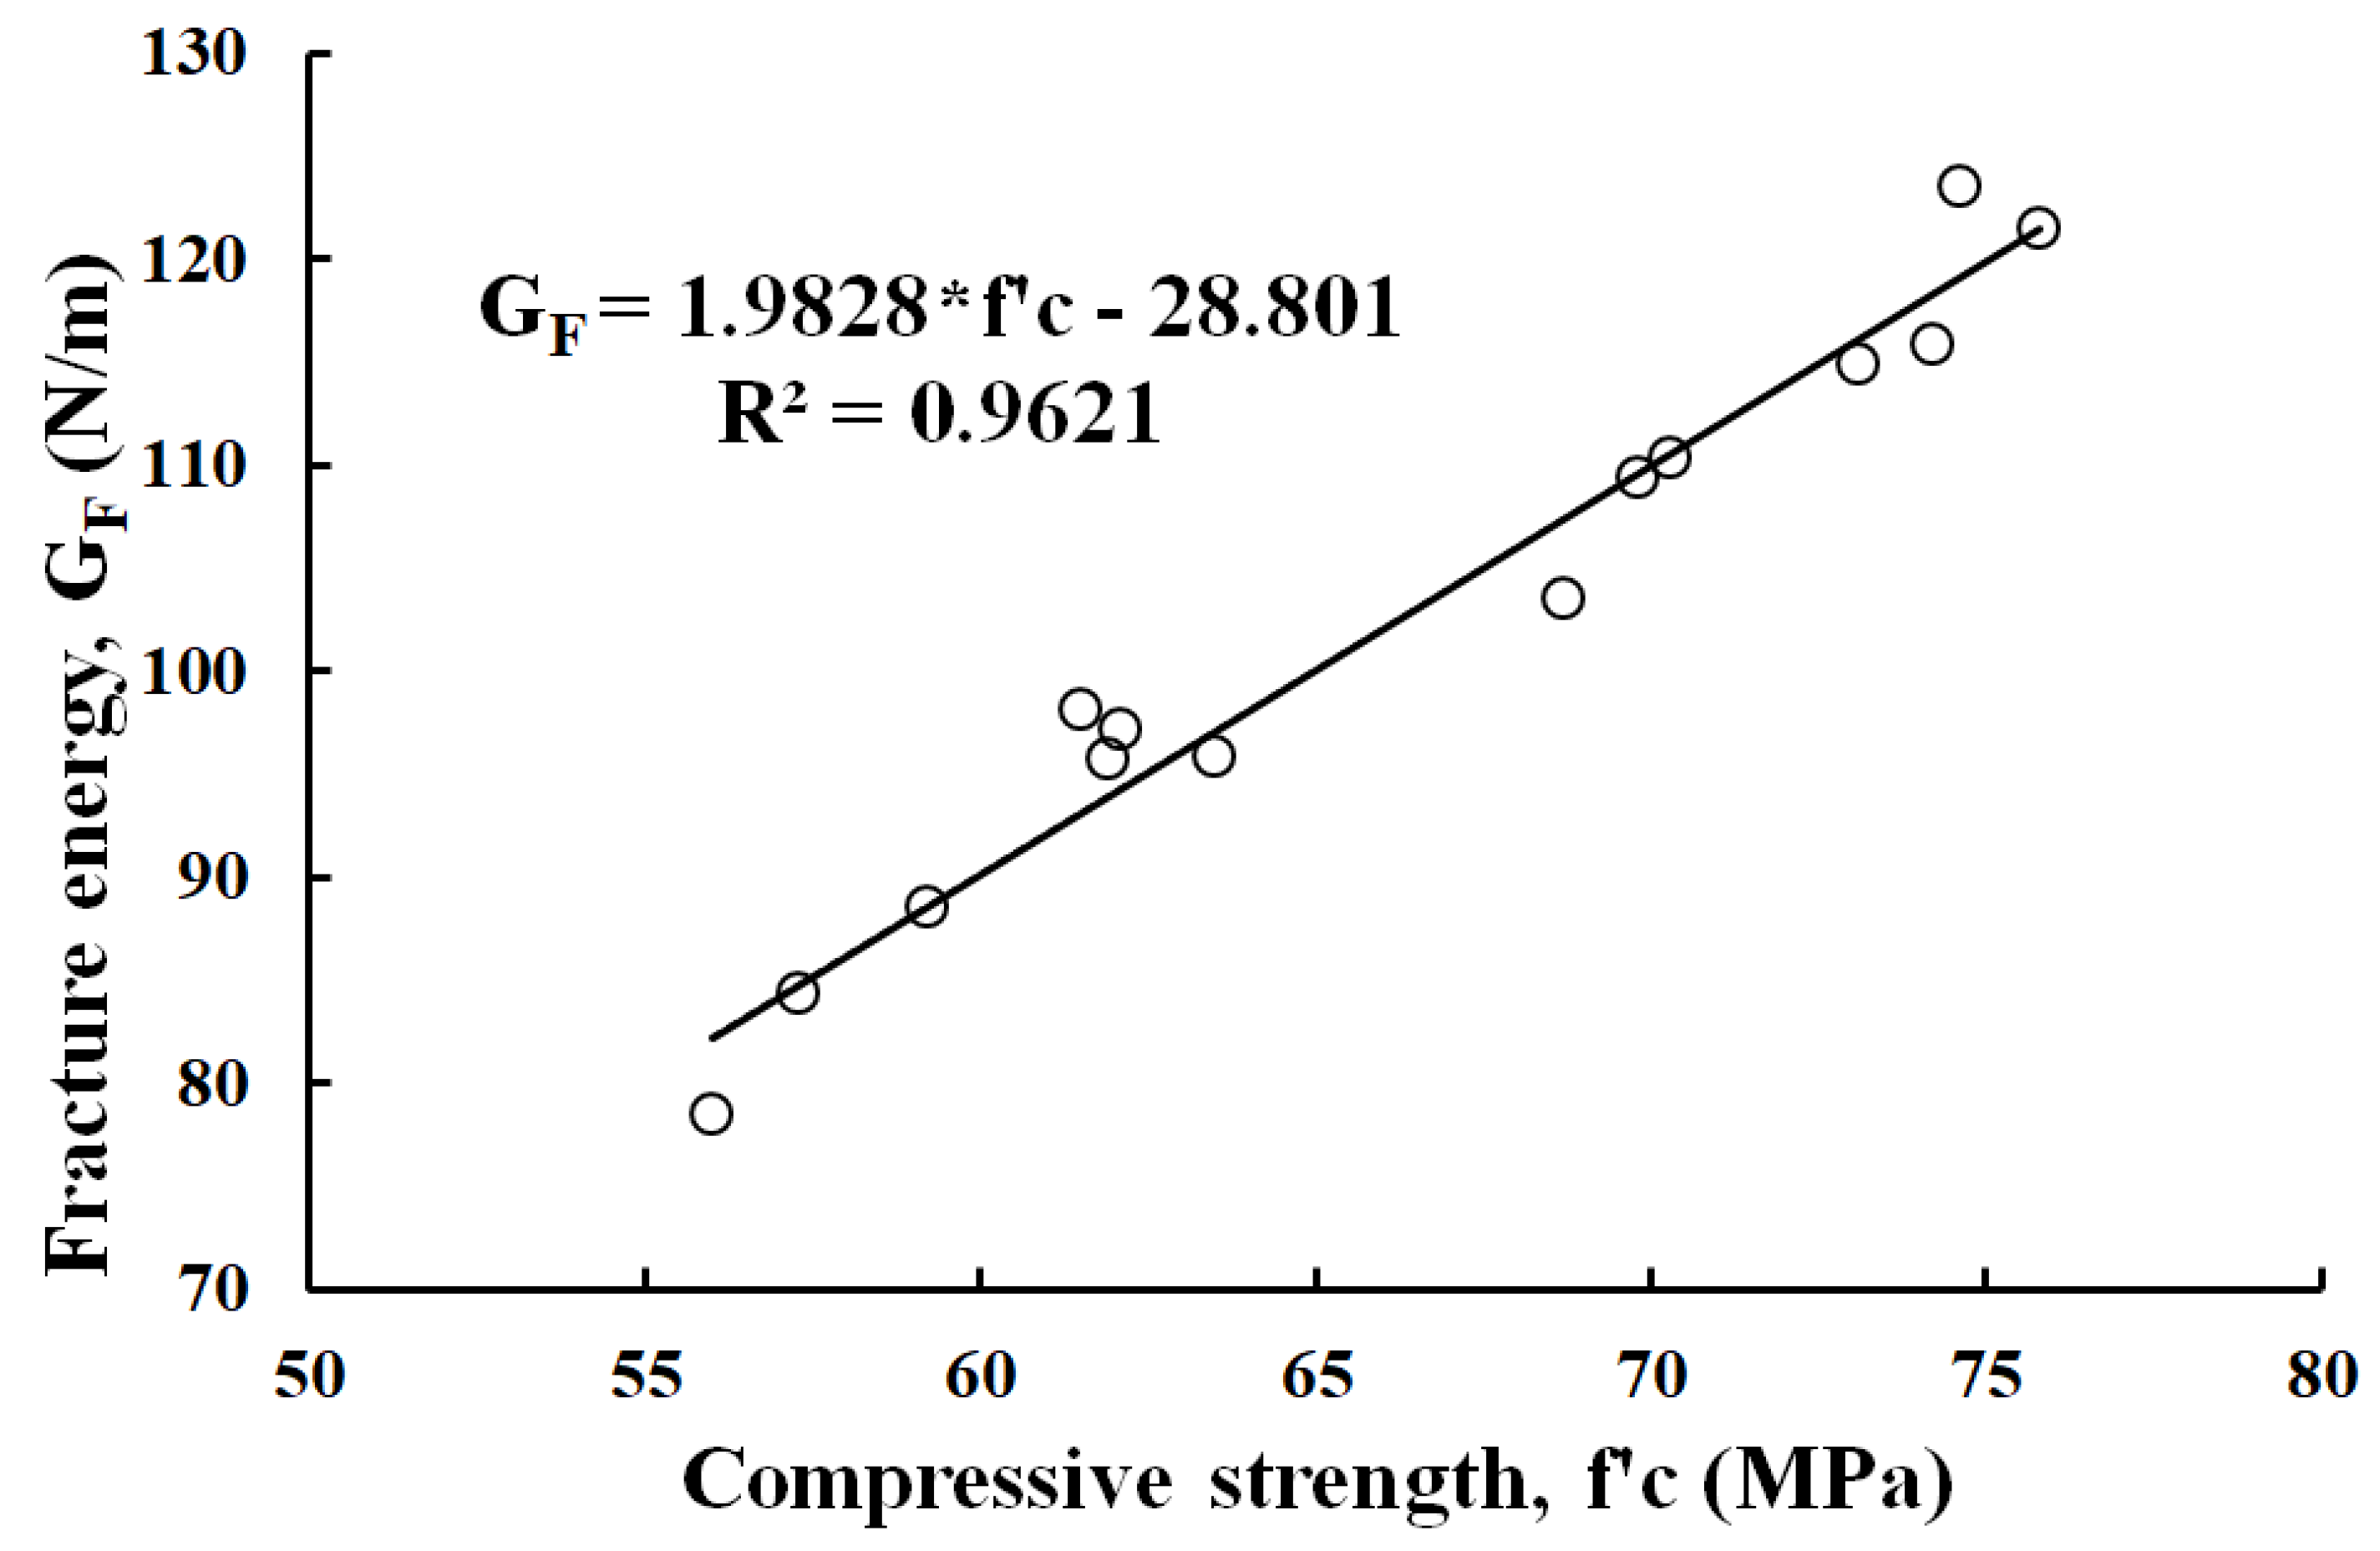
Figure 6 compares the fracture energy, and the compressive strength of all fly ash concretes in the study. The GF was found to increase in conjunction with the compressive strength. This trend compares favorably with the research of Gettu [19], Giaccio [20], and Xie [21]. Nevertheless, these researchers observed smaller increases in GF with increases in compressive strength of high strength concrete. Gettu et al. [19] found that an increase in compressive strength of 160% resulted in an increase in GF of only 12%. Giaccio et al. [20] observed that GF increased as compressive strength increased, but only at a fraction of the rate. Xie et al. [21] found that increases in compressive strength of 29–35% resulted in a GF increase of only 11–13%. In this study, an increase in compressive strength of 10% resulted in a larger increase in GF of around 14% (~13–15%) when the compressive strength varied between 50 and 80 MPa. This demonstrates the unique effects of using finer fly ash on the enhancement of the fracture toughness of high-strength concrete.
Figure 6.
Fracture energy versus compressive strength of fly ash concrete.
4.3. Critical Stress Intensity Factor
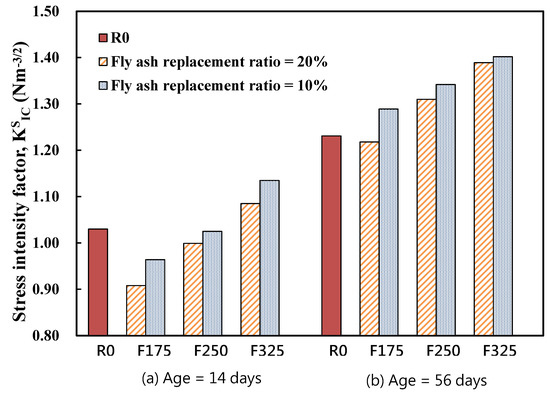
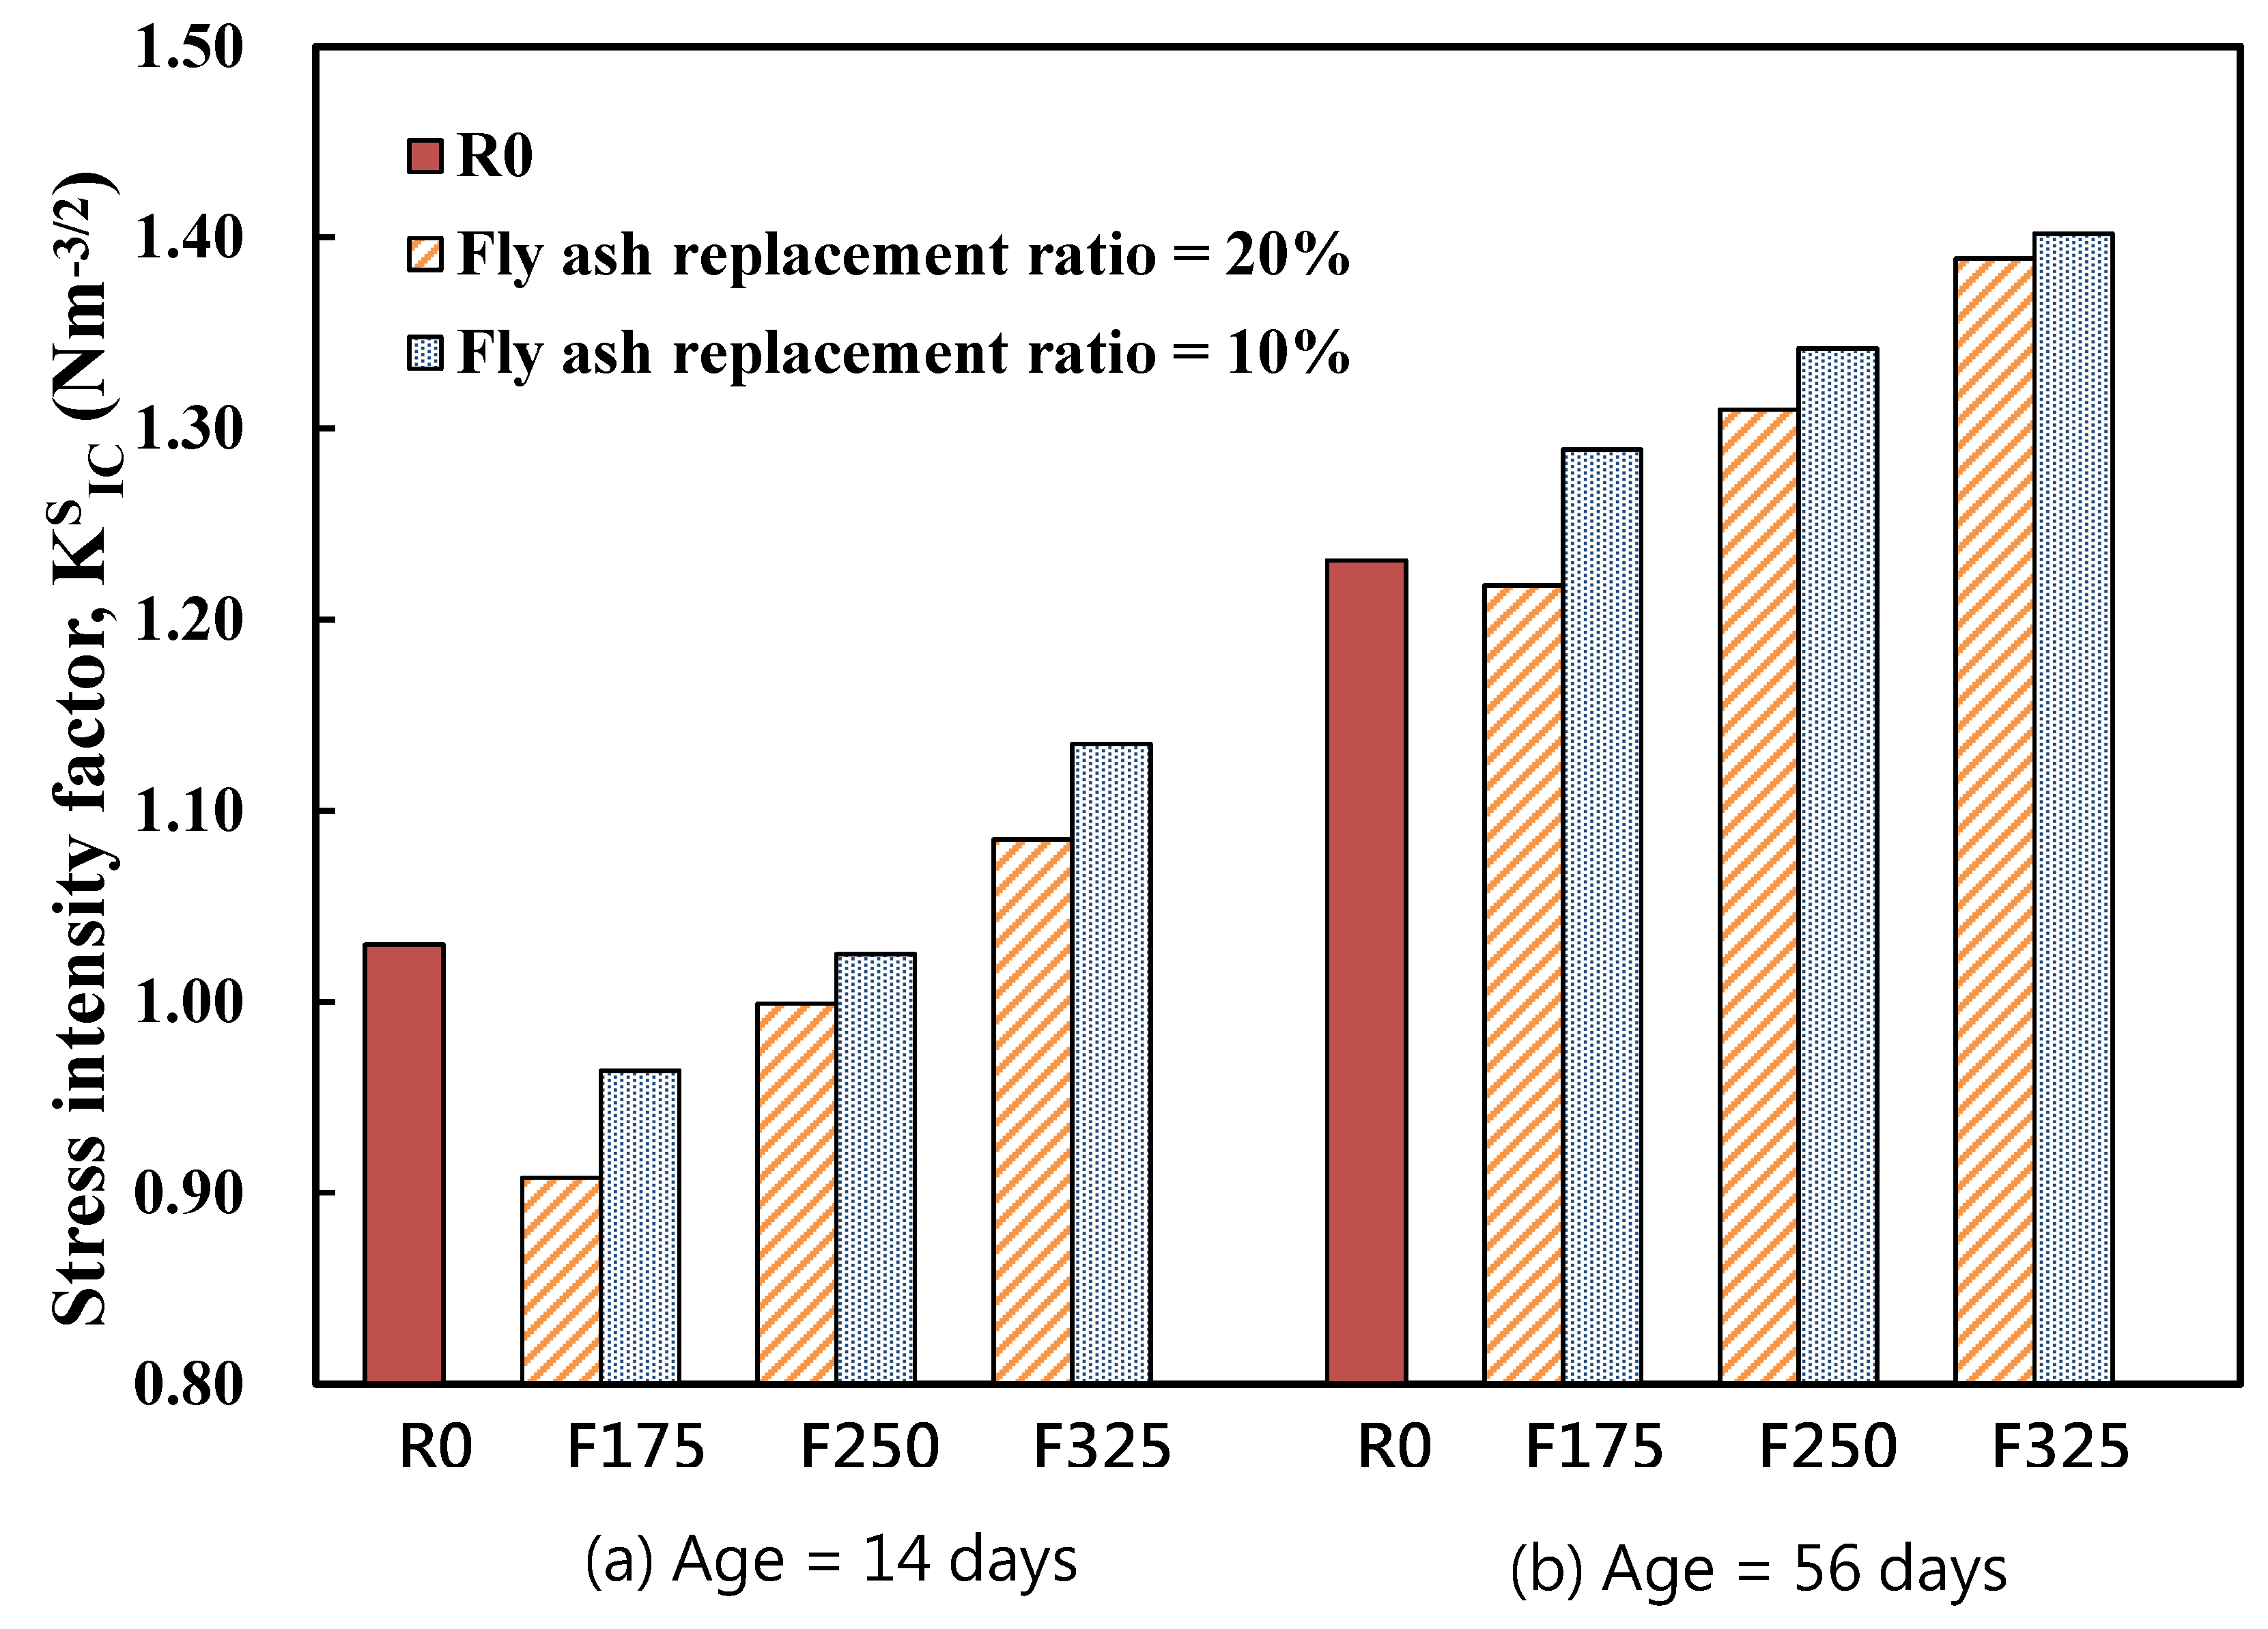
The critical stress intensity factor (KSIC) is the stress intensity factor calculated at the critical effective crack tip, using the measured maximum load. In this research, the KSIC was determined with a notched beam in a three-point bend test, using a closed-loop testing machine under the crack mouth opening displacement control. Load-CMOD curves were plotted from the tests. The KSIC was calculated using Equation (2). Concrete specimens were tested at 14 and 56 days. As seen in Table 6, results showed that the related tendency of the KSIC of concrete was similar to that of the GF. At an early age (14 days), most of the KSIC values of the fly ash concrete were lower than that of the control concrete (R0) but exceeded that of R0 after 56 days. This implies that the additional pozzolanic reaction of fly ash with Ca(OH)2 in the concrete became active during the period between 14 and 56 days, which led to the enhancement of KSIC of the fly ash concrete.
Table 6.
Critical stress intensity factor of concrete.
It was also found that concrete containing finer fly ash presented larger KSIC values. This can be observed in Figure 7, which shows that the increase in the fineness level of fly ash led to an increase in the KSIC values of concrete at various ages. In other words, the KSIC of the mixture F3R2 with finer fly ash was in turn higher than that of F2R2 and F1R2, for the same fly ash replacement ratio of 20%. Furthermore, the KSIC of F3R1 > F2R1 > F1R1 for a similar fly ash replacement ratio of 10%. The reason for attaining this result is that the finer fly ash particle had a larger surface area, exhibiting a more active pozzolanic reaction, and thus resulting in an increase in the strength and fracture resistance (KSIC).
Figure 7.
Stress intensity factor of concrete with various fineness levels, and the replacement ratio of fly ash.
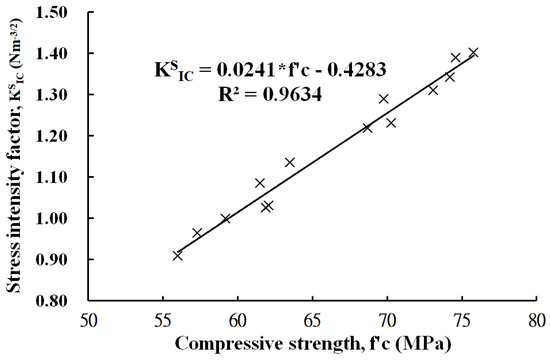
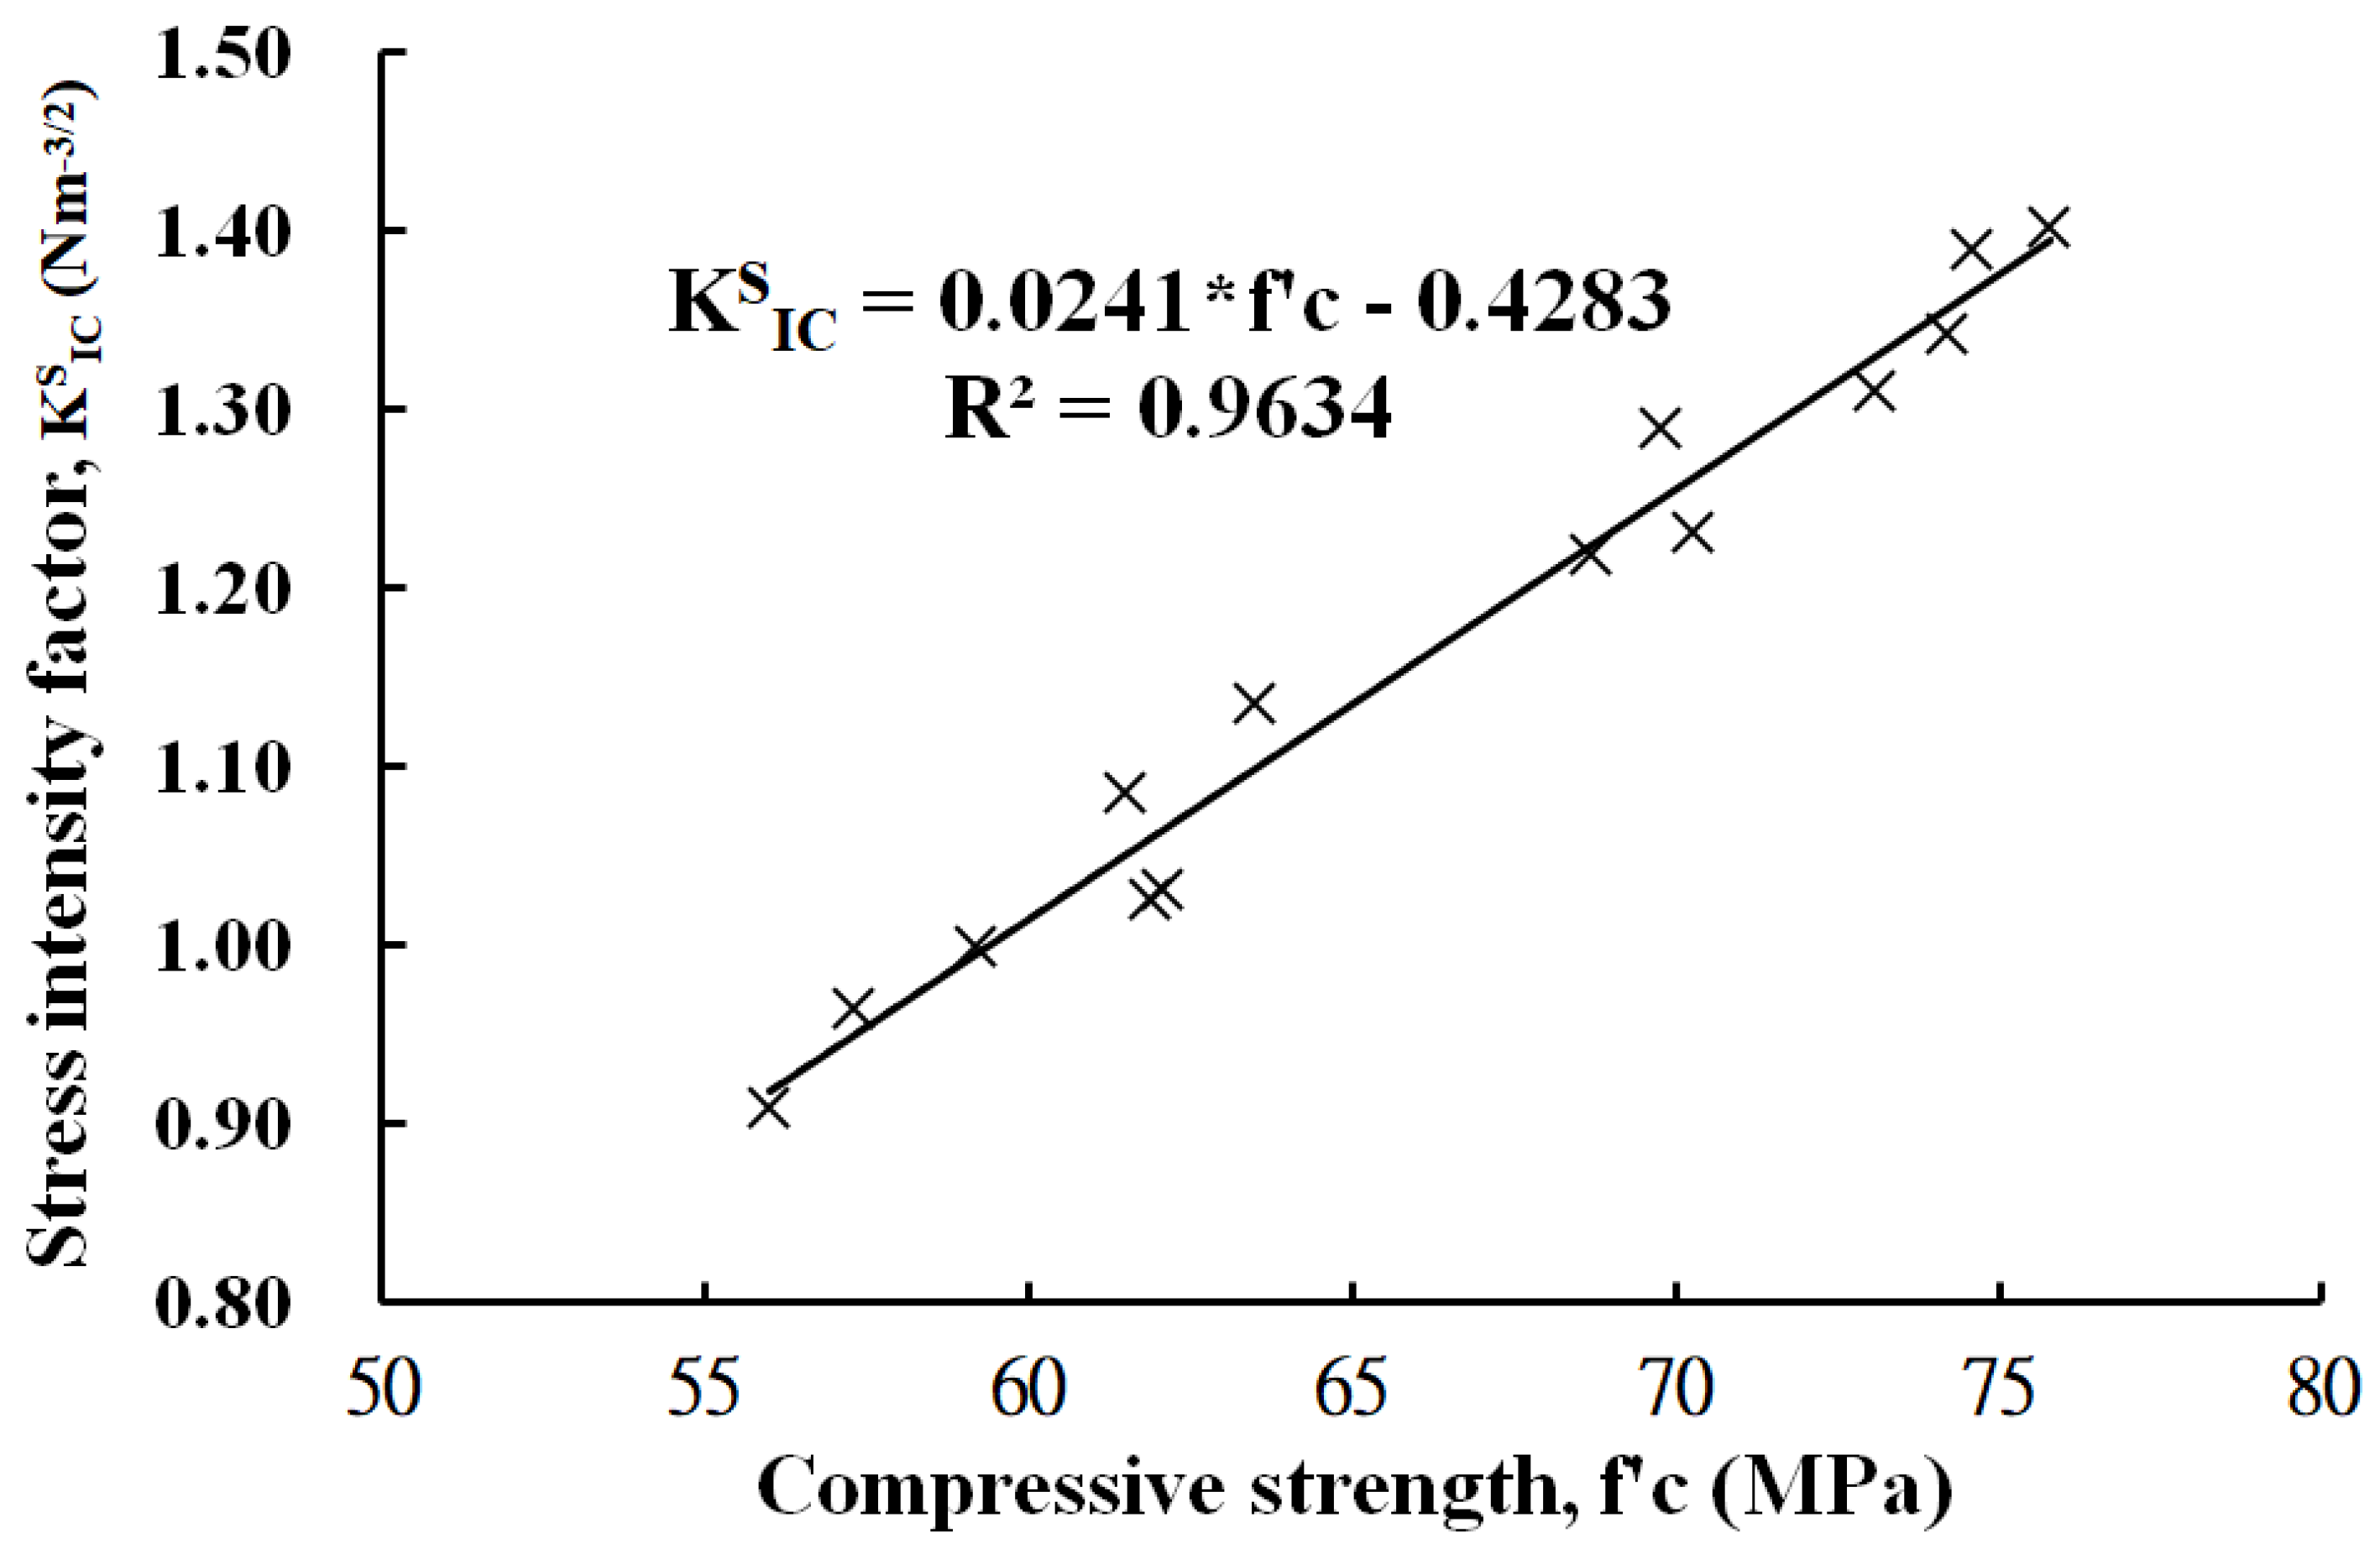
The stress intensity factors of fly ash concrete in the fracture test were compared to compressive strength, as seen in Figure 8. As shown in the figure, the two values of stress were nearly linearly related. The relationships shown in Figure 8 are of some importance because based on the close relationship between the particle size of fly ash and the compressive strength (Figure 4), the stress intensity factor increases with the increase of the fineness level of fly ash.
Figure 8.
Stress intensity factor versus compressive strength of fly ash concrete.
5. Conclusions
Based on the tests and evaluations presented in this study, the following conclusion can be reached:
- Incorporating finer fly ash into concrete may fill the micro-voids much better and produce higher packing density, resulting in larger strength enhancement. The compressive strength of fly ash concrete increases in conjunction with the fineness level of fly ash presented in the mixtures for each age and various fly ash replacement ratios.
- Use of finer fly ash has beneficial effects on the fracture energy (GF) of concrete, even at an early age (14 days). The finer fly ash used, the greater the fracture energy of the concrete exhibited.
- The increment of the fracture energy of all the fly ash concrete measured in this study from 14 days to 56 days was attained by 21–31%, which was much higher than that of control concrete (13.6%), such that the GF of the fly ash mixtures at 56 days almost exceeded that of the control concrete.
- An increase in fly ash concrete compressive strength of 10% resulted in an increase in the GF value of around 14% when the compressive strength varied between 50 and 80 MPa. This rate of increase is significantly higher than that found in normal concrete, indicating that the use of finer fly ash can have unique effects on the enhancement of the fracture toughness of high-strength concrete.
- Similar to the trend of development of the fracture energy, at an early age (14 days), most of the stress intensity factor (KSIC) of the fly ash concrete was lower than that of the control concrete (R0), but exceeded that of the R0 after 56 days.
- Concrete containing finer fly ash exhibited larger KSIC value for various ages, and the stress intensity factor increased in conjunction with the fineness level of fly ash. This also implicates an increase in the fracture resistance of concrete.
Author Contributions
Conceptualization—C.-H.H. and T.Y.; Methodology—C.-H.H.; Validation—C.-H.W., C.-H.H., and Y.-C.K.; Formal Analysis—C.-H.W. and C.-H.H.; Investigation—C.-H.W. and C.-H.H.; Resources—C.-H.H.; Data Curation—C.-H.W. and C.-H.H.; Writing and Original Draft Preparation—C.-H.W., C.-H.H. and T.Y.; Writing, Review, and Editing—C.-H.H. and T.Y.; Visualization—C.-H.H. and Y.-C.K.; Supervision—T.Y.; Project Administration—C.-H.H.
Funding
This research received no external funding.
Conflicts of Interest
The authors declare no conflict of interest.
References
- Pejman, K.D.; Savas, E.; Marva, A.B. Physico-mechanical, microstructural and dynamic properties of newly developed artificial fly ash based lightweight aggregate—Rubber concrete composite. Compos. Part B Eng. 2015, 79, 451–455. [Google Scholar]
- Sukumar, B.; Rani, M.U.; Silvac, P.J. Micro-structural characteristics of self-compacting concrete with high volume fly ash. Int. J. Appl. Eng. Res. 2015, 10, 10265–10277. [Google Scholar]
- Rahimah, E.; Andri, K.; Nasir, S.; Muhd, F.N. Strength and microstructural properties of fly ash based geopolymer concrete containing high-calcium and water-absorptive aggregate. J. Clean. Prod. 2016, 112, 816–822. [Google Scholar]
- Huang, C.H.; Lin, S.K.; Chang, C.S.; Chen, H.J. Mix proportions and mechanical properties of concrete containing very high-volume of Class F fly ash. Constr. Build. Mater. 2013, 46, 71–78. [Google Scholar] [CrossRef] [Scilit]
- Bagheri, A.; Zanganeh, H.; Alizadeh, H.; Shakerinia, M.; Marian, M.A.S. Comparing the performance of fine fly ash and silica fume in enhancing the properties of concretes containing fly ash. Constr. Build. Mater. 2013, 47, 1402–1408. [Google Scholar] [CrossRef] [Scilit]
- Mehta, P.K. Influence of Fly Ash Characteristics on the Strength of Portland-Fly Ash Mixtures. Cem. Concr. Res. 1985, 15, 669–674. [Google Scholar] [CrossRef] [Scilit]
- Obla, K.H.; Hill, R.L.; Thomas, M.D.A.; Shashiprakash, S.G.; Perebatova, O. Properties of Concrete Containing Ultra-Fine Fly Ash. ACI Mater. J. 2003, 100, 426–433. [Google Scholar]
- Xiao, J.H.; Li, W.; Corr, D.J.; Shah, S.P. Effects of interfacial transition zones on the stress–strain behavior of modeled recycled aggregate concrete. Cem. Concr. Res. 2013, 52, 82–99. [Google Scholar] [CrossRef] [Scilit]
- Xie, Y.; Corr, D.J.; Jin, F.; Zhou, H.; Shah, S.P. Experimental study of the interfacial transition zone (ITZ) of model rock-filled concrete (RFC). Cem. Concr. Compos. 2015, 55, 223–231. [Google Scholar] [CrossRef] [Scilit]
- Alberti, M.G.; Enfedaque, A.; Gálvez, J.C. Fracture mechanics of polyolefin fibre reinforced concrete: Study of the influence of the concrete properties, casting procedures, the fibre length and specimen size. Eng. Fract. Mech. 2016, 154, 225–244. [Google Scholar] [CrossRef] [Scilit]
- Rezaie, F.; Farnam, S.M. Fracture mechanics analysis of pre-stressed concrete sleepers via investigating crack initiation length. Eng. Fail. Anal. 2015, 58, 267–280. [Google Scholar] [CrossRef] [Scilit]
- Hillerborg, A. The Theoretical Basis of a Method to Determine the Fracture Energy GF of Concrete. Mater. Struct. 1985, 18, 291–296. [Google Scholar] [CrossRef] [Scilit]
- Rao, G.A.; Raghu Prasad, B.K. Size effect and Fracture Properties of HPC. In Proceedings of the 14th Engineering Mechanics International Conference (ASCE), Austin, TX, USA, 21–24 May 2000; Volume 104, pp. 21–24. [Google Scholar]
- Appa Rao, G.; Raghu Prasad, B.K. Fracture energy and softening behavior of high-strength concrete. Cem. Concr. Res. 2002, 32, 247–252. [Google Scholar]
- Golewski, G.L.; Sadowski, T. An analysis of shear fracture toughness KIIc and microstructure in concretes containing fly-ash. Constr. Build. Mater. 2014, 51, 207–214. [Google Scholar] [CrossRef] [Scilit]
- Teng, S.; Liu, Y.; Yang, T.; Lim, D. Determination of fracture energy of ultra-high strength concrete. Eng. Fract. Mech. 2014, 131, 602–615. [Google Scholar] [CrossRef] [Scilit]
- RILEM Technical Committee 50-FMC, Proposed RILEM Recommendation. Determination of The Fracture Energy of Mortar and Concrete by Means of Three-Point Bend Tests on Notched Beams. Mater. Struct. 1985, 18, 285–290. [Google Scholar]
- Shah, S.P.; Jenq, Y.S. Determination of Fracture Parameters (KSIC and CTODC) of Plain Concrete Using Three-Point Bend Tests. Final Report of RILEM Committee 89-FMT Fracture Mechanics of Concrete: Test Method. Mater. Struct. 1988, 23, 457–460. [Google Scholar] [CrossRef] [Scilit]
- Gettu, R.; Bazant, Z.P.; Karr, M.E. Fracture properties and brittleness of high-strength concrete. ACI Mater. J. 1990, 87, 608–617. [Google Scholar]
- Giaccio, G.; Rocco, C.; Zerbino, R. The fracture energy of high strength concretes. Mater. Struct. 1993, 26, 381–386. [Google Scholar] [CrossRef] [Scilit]
- Xie, J.; Elwi, A.E.; MacGregor, J.G. Mechanical properties of three high-strength concretes containing silica fume. ACI Mater. J. 1995, 92, 135–145. [Google Scholar]

© 2019 by the authors. Licensee MDPI, Basel, Switzerland. This article is an open access article distributed under the terms and conditions of the Creative Commons Attribution (CC BY) license (http://creativecommons.org/licenses/by/4.0/).