Article

Detection and Treatment Methods for Perfluorinated Compounds in Wastewater Treatment Plants

1
Department of Environmental Engineering, Yeungnam University, Gyeongsan 38541, Korea
2
Daisung Green Tech, Seongnam, Gyenggi 13216, Korea
3
Department of Health Management, Uiduk University, Gyeongju 38004, Korea
*
Author to whom correspondence should be addressed.
Appl. Sci. 2019, 9(12), 2500; https://doi.org/10.3390/app9122500
Submission received: 8 May 2019 / Revised: 8 June 2019 / Accepted: 13 June 2019 / Published: 19 June 2019
(This article belongs to the Special Issue Environmental Fate of Emerging Organic Micro-Contaminants)

Abstract

:
We surveyed the variation in perfluorinated compound (PFC) concentrations entering urban wastewater treatment plants and then designed an optimal PFCs treatment method based on a pilot test. The PFCs influent concentration was found to be affected by the types of industries and operating rate. The concentration of PFCs in the wastewater treatment effluent was slightly lower than that of the influent. Thus, PFCs had not been adequately removed by the existing biological treatments. The pilot test results showed that about 10% of PFCs was removed by coagulation and precipitation, and the ozone and chlorine test showed that few, if any, PFCs were removed regardless of the oxidant dose. The activated carbon adsorption test showed that the removal significantly increased with empty bed contact time, with about a 60% removal in five minutes and over 90% removal in over 15 minutes. Therefore, a more stable and higher PFCs removal would result from continuous oxidation processes, such as ozone and adsorption processes involving activated carbon, rather than a single biological treatment.

1. Introduction

Perfluorinated compounds (PFCs) do not easily degrade biologically in the natural environment due to their extremely stable covalent bonds. Artificially synthesized and produced, PFCs are used in manufacturing various household goods and are detected consistently in water [1]. There has been much research interest in PFCs as they have been reported to affect the natural water system, causing disturbances to the ecosystem [1,2]. Since the mid-2000s, the European Union (EU), Canada, and the USA, among others, have started regulating PFCs. At the fourth Stockholm Treaty Conference of the Parties in May 2009, it was agreed that some of these PFCs would be included in the target compounds of the treaty [3,4,5]. The most well-known PFCs are used in industry and broader daily life for waterproof materials, lubricants, paint, ink, paper, fiber, carpet, ovens, cooking equipment, electronic products, packaging materials, metal coating, cleaning products, semi-conductors, and firefighting products [2]. However, since many household products use PFCs as additives, it is difficult to calculate their amount of usage and the amounts released into the environment. Whereas the residual concentration of PFCs in the environment is small, at the ng/L (ppt) level or below, the effects on the ecosystem cannot be disregarded if the ecosystem then is exposed long-term to PFCs [6,7,8].
The pathways of PFCs to the environment are numerous; most of them enter via wastewater treatment plants. However, little has been known about the mechanisms through which these persistenct and toxic PFCs are removed. Therefore, it is difficult to improve the removal of the small amount of PFCs with existing wastewater treatment methods [9,10].
In this study, we aimed to investigate PFCs concentration in the influent and effluent of an actual wastewater treatment plant, which is the source of perfluorocarbons in large industrial complexes and highly populated areas. The distribution properties of PFCs were investigated from the influent wastewater treatment plant and an optimal treatment plan was designed through a pilot test, which may eventually serve as data for future surface water management plans.

2. Research Content and Method

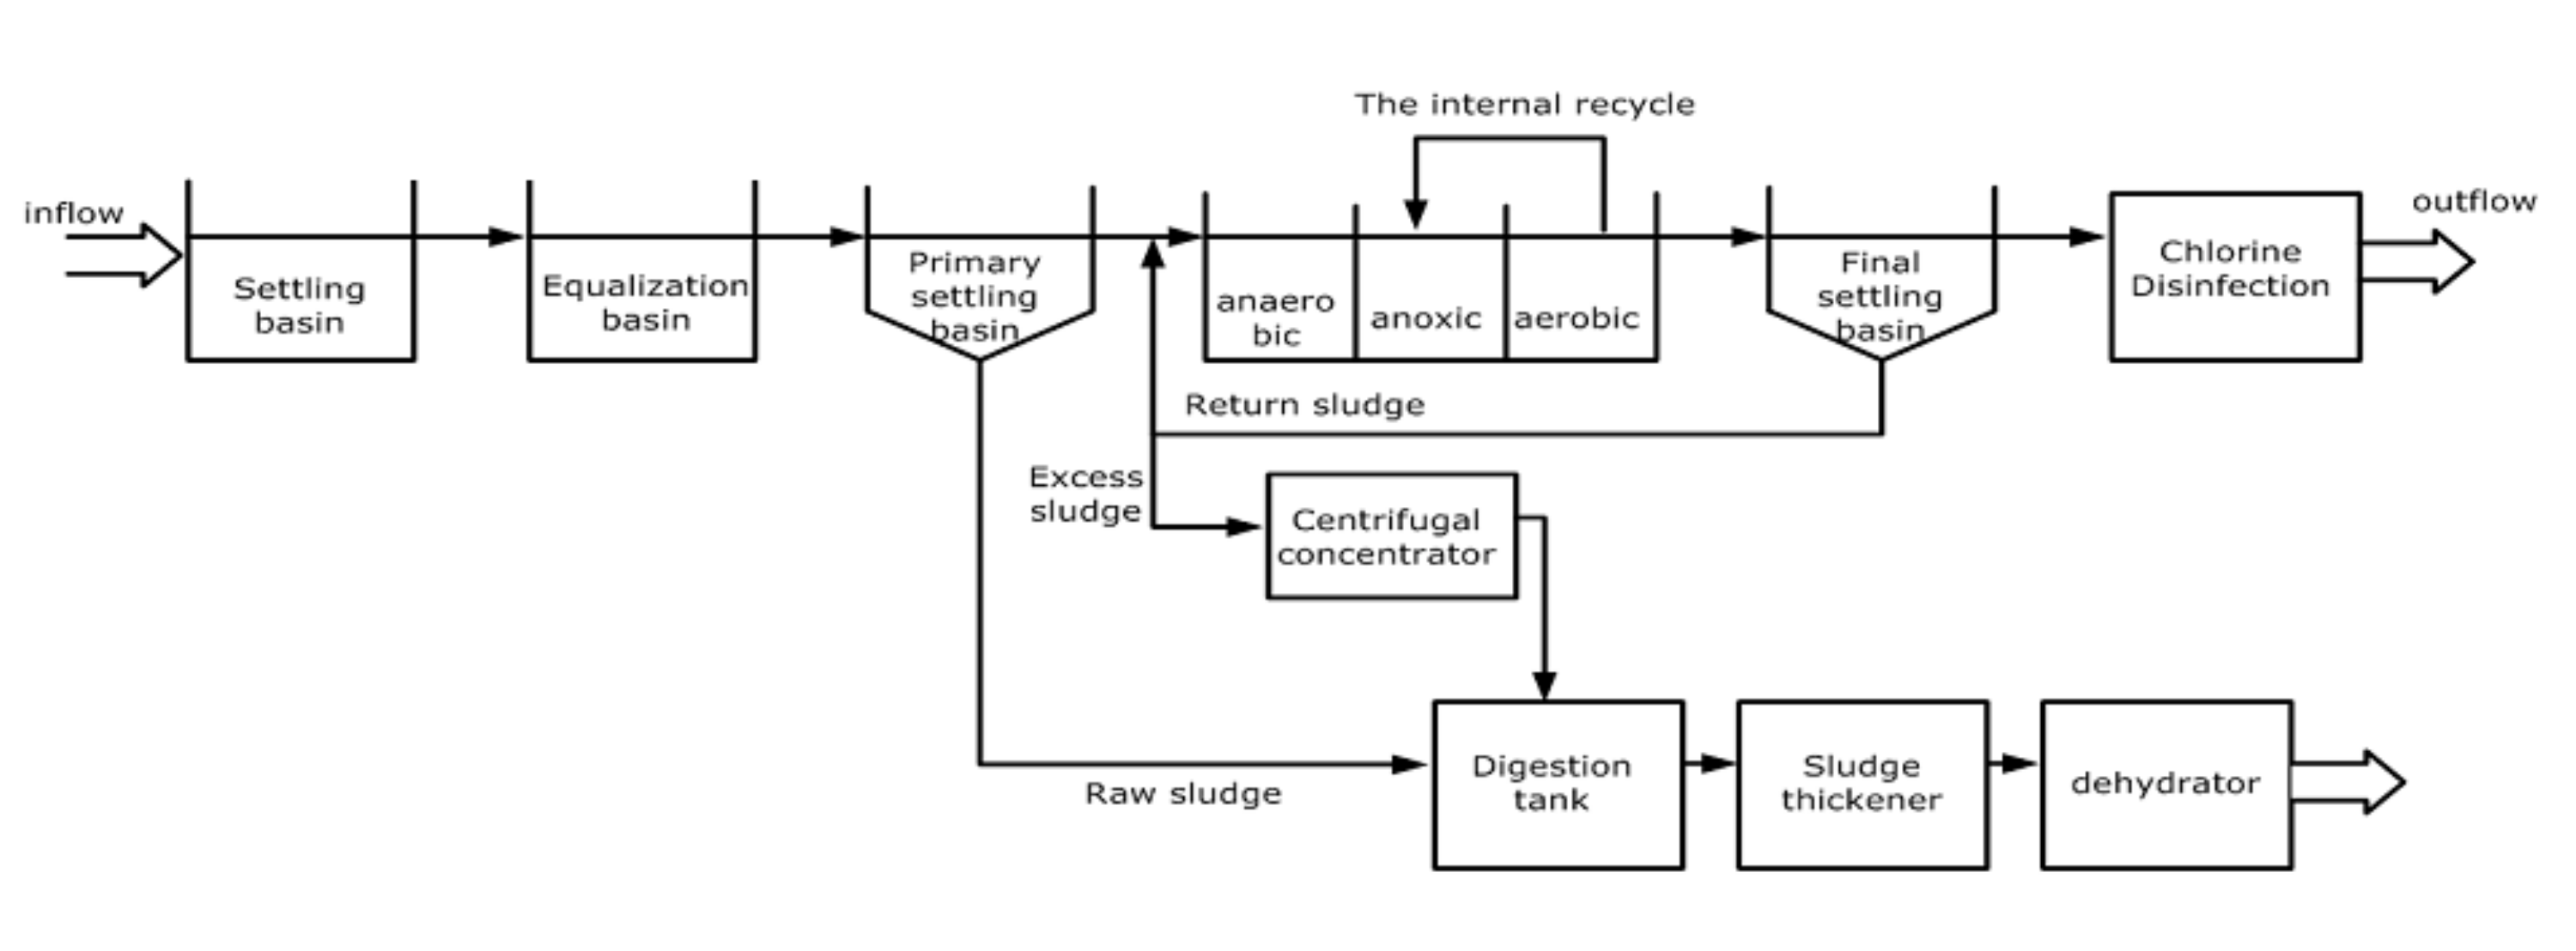
2.1. Current Status of Wastewater Treatment Plants

2.1.1. Survey Area

The major business types in the survey area are fabric manufacturing, metal, coating, and rubber, and the fabric manufacturers produce the largest amounts of PFCs emissions [9]. The public wastewater treatment plant implements the anaerobic-anoxic-oxic (A2/O) method, and the reaction tank consists of an anaerobic tank, an anoxic tank, and an aerobic tank, as well as internal and external returners. The treatment efficiency for organic compounds like BOD and SS is over 90%, that for TN is between 40% and 70%, and that for TP is 60%. Figure 1 shows the process flowchart of the wastewater treatment plants in city K.

2.1.2. Analysis of PFCs

The PFCs analysis was conducted on five compounds: perfluorooctanoic acid (PFOA), perfluoro-n-pentanoic acid (PFPeA), perfluorohexane sulfonate (PFHxS), perfluorohexanoic acid (PFHxA), and perfluorononanoic acid (PFNA). The pre-treatment and analysis conditions are provided in Table 1. The pre-treatment for the analysis of PFCs involves the use of solid-phase extraction (SPE) to complete a four-stage solid phase extraction, and the conditioning stage uses methanol as the solvent. The loading and washing stages used 10.0 mL of de-ionized water, and the elution stage used 2.0 mL of methanol. After the solid phase extraction stage, the concentration stage used 40 °C nitrogen gas to concentrate the PFCs so that their final volume was reduced to 500 μL. After the concentration stage, an analysis was conducted with LC-MS [11].

2.1.3. Pilot Test

To determine the concentration change by coagulation-sedimentation, we injected the coagulator using Alum at regular intervals of 10, 20, 30, 40, and 50 mg/L. After fixing the pH to 7, we conducted rapid spinning (67 rpm) for one minute, slow spinning (31 rpm) for 10 minutes, and then sedimentation for 30 minutes. The supernatant was then sampled and analyzed. The PFCs removal efficiency by ozone oxidation was determined during an ozone contact test. The ozone contact test was performed by determining the ozone dose by potassium iodide titration and injecting the ozone to the water in the Ozone Demand Flask in rising concentrations of 5, 10, 15, 20, 25, and 30 mg O3/L. The volume of the Demand Flask was 1.5 L, and after injecting ozone, the Demand Flask was sufficiently shaken for 20 minutes to maximize the ozone contract efficiency before carrying out the analysis. By measuring the effective chlorine of the hypochlorous acid sodium solution in the inflow water to the treatment plant, the corresponding chlorine dose was calculated and injected. The injection doses of chlorine were 5, 10, 15, and 20 mg/L at regular intervals, based on the guidelines for the sewage treatment facilities. For the activated carbon adsorption of PFCs, we placed clearly washed and dried granular activated carbon into a column with an internal diameter of 20 mm and length of 350 mm. The influent wastewater was injected into this column using a controlled volume pump, and the treated sample was then analyzed. For the test conditions, the empty bed contact time (EBCT) was varied to 5, 10, and 15 minutes.

3. Results and Discussion

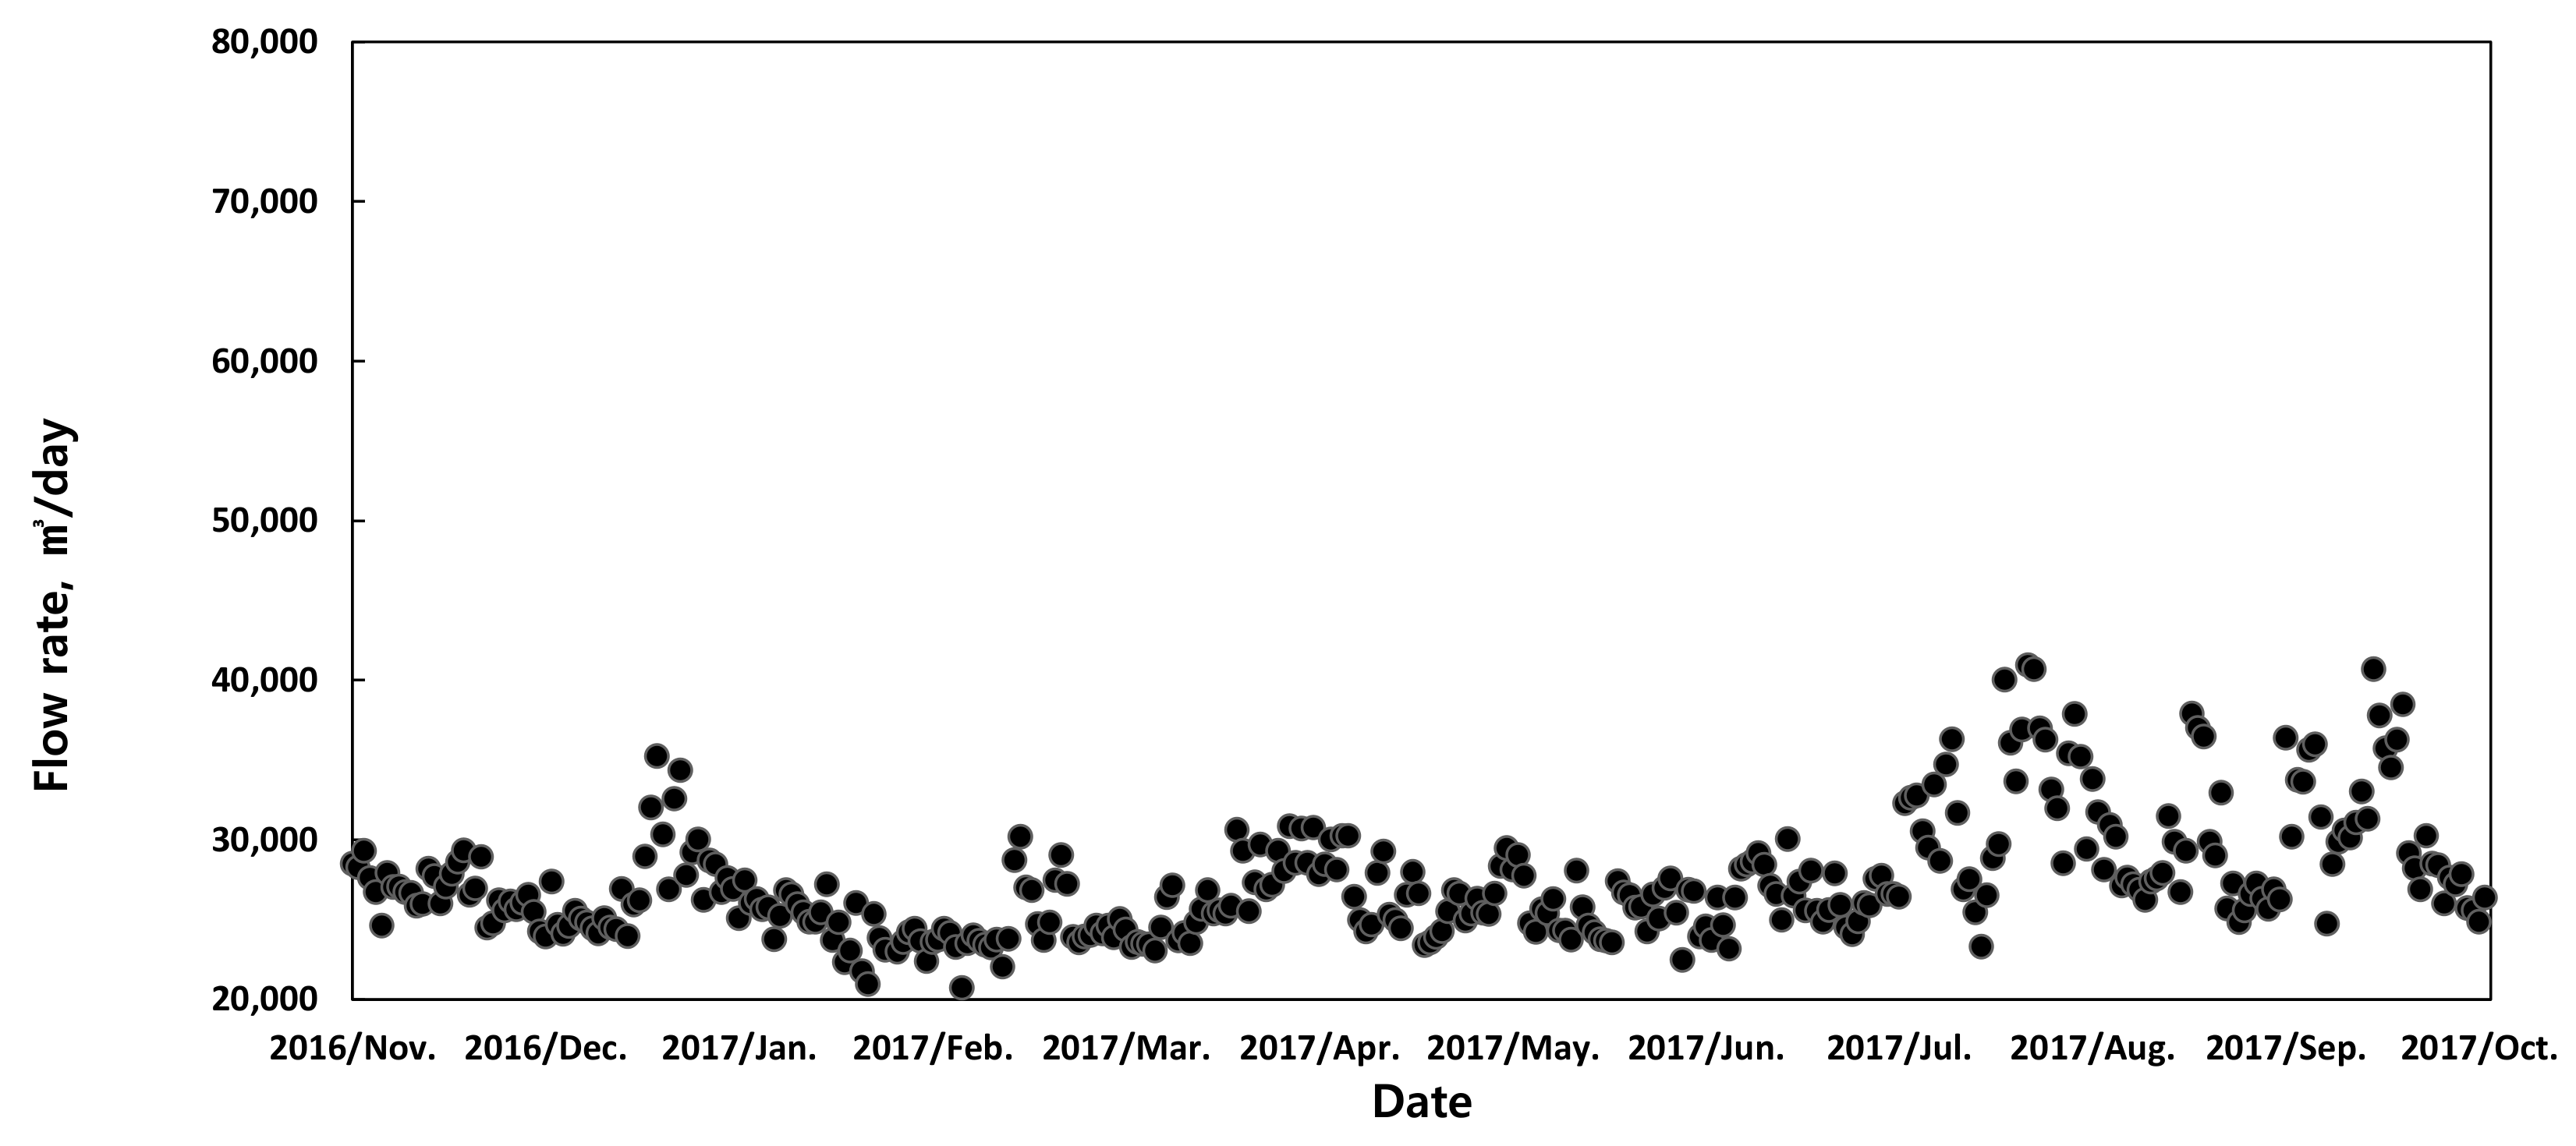
3.1. Variation in Amount of Inflow Water

Figure 2 sows the amount of influent flow to the treatment plant. The daily average influent flow was 27,335 m3/day, 40,948 m3/day at the highest level, and 19,506 m3/day at the lowest level. Due to the precipitation in August 2017, the inflow water between the August 13 and 17 was the highest. The amount of influent flow partially changes due to business operational rates.

3.2. Monthly PFCs Concentration Change

The average PFOA in the influent was 11.7 ng/L, and that in the effluent was 11.0 ng/L. The PFOA removal was very low. The average PFHxA in the influent was 11.9 ng/L and that in the effluent was 11.1 ng/L, showing the minimal removal. The average PFNA in the influent was 4.1 ng/L, but that in the effluent was 2.9 ng/L, showing an average PFNA removal of 27.2%. The average PFPeA in the influent was 3.2 ng/L and the effluent was 2.7 ng/L, which is 7.8% removal. The average PFHxS in the influent was 1.0 ng/L, and that in the effluent was 0.8 ng/L.
The concentration distribution of these substances tended to be somewhat higher in the dry winter season. PFHxS is frequently used as a fire extinguisher material and so its concentration tended to be higher in the fall and winter when more fires occur. In addition, PFCs are shown to be largely affected by business operational ratios, and thus, for efficient management, a detailed and continuous emissions survey would be required in industry-concentrated regions. Finally, whereas some compounds were removed by the existing treatments, most of the compounds were shown to be poorly treated.

3.3. Correlation of PFCs between Cities

The correlation of PFCs with other cities with similar wastewater characteristics was compared. As shown in Table 2, correlational coefficients between 0.000 and 0.200 were considered to have no relation and are marked as xx, whereas those between 0.210 and 0.400 were considered to be low and are marked as x. A correlational coefficient between 0.410 and 0.600 was considered to have some relation and is marked as △.
The correlation coefficient between PFOA and PFHxS was 0.486, showing some correlation. That between PFHxA and PFNA or PFPeA was 0.516 or 0.583, respectively, showing some correlation. All the other compounds had low or little correlation. The correlation among PFCs showed that PFOA, PFHxA, and PFNA have the –COOH group, so that were highly correlated with PFCs with the same reaction group [3]. Ahrens et al. also showed that the correlation coefficient between PFO and PFNA was highest at 0.752 [12]. However, So et al. reported that whereas PFCs in the –COOH group had a relatively higher correlation, the correlation coefficient between PFOA and PFNA was low at 0.375 [13]. This occurred because there are various emission sources for PFCs, and the outflow water from the wastewater treatment plants are known to be key point pollution sources [3]. Therefore, effluent flow to the water system reflects regional characteristics and determines the correlation of the substances in actual streams, producing these regional differences [3].
The correlational study among PFCs was significant in determining the concentration level of PFCs through the concentration of some PFCs among those with high correlation. However, those data are still lacking in representability; therefore, further research is necessary.

3.4. PFCs Removal Efficiency Through Pilot Test

We conducted a pilot test on the influent to the treatment plant to determine the removal efficiency. In particular, we examined the changes in the removal by coagulation-sedimentation, ozone oxidization, chlorine injection, and activated carbon adsorption.

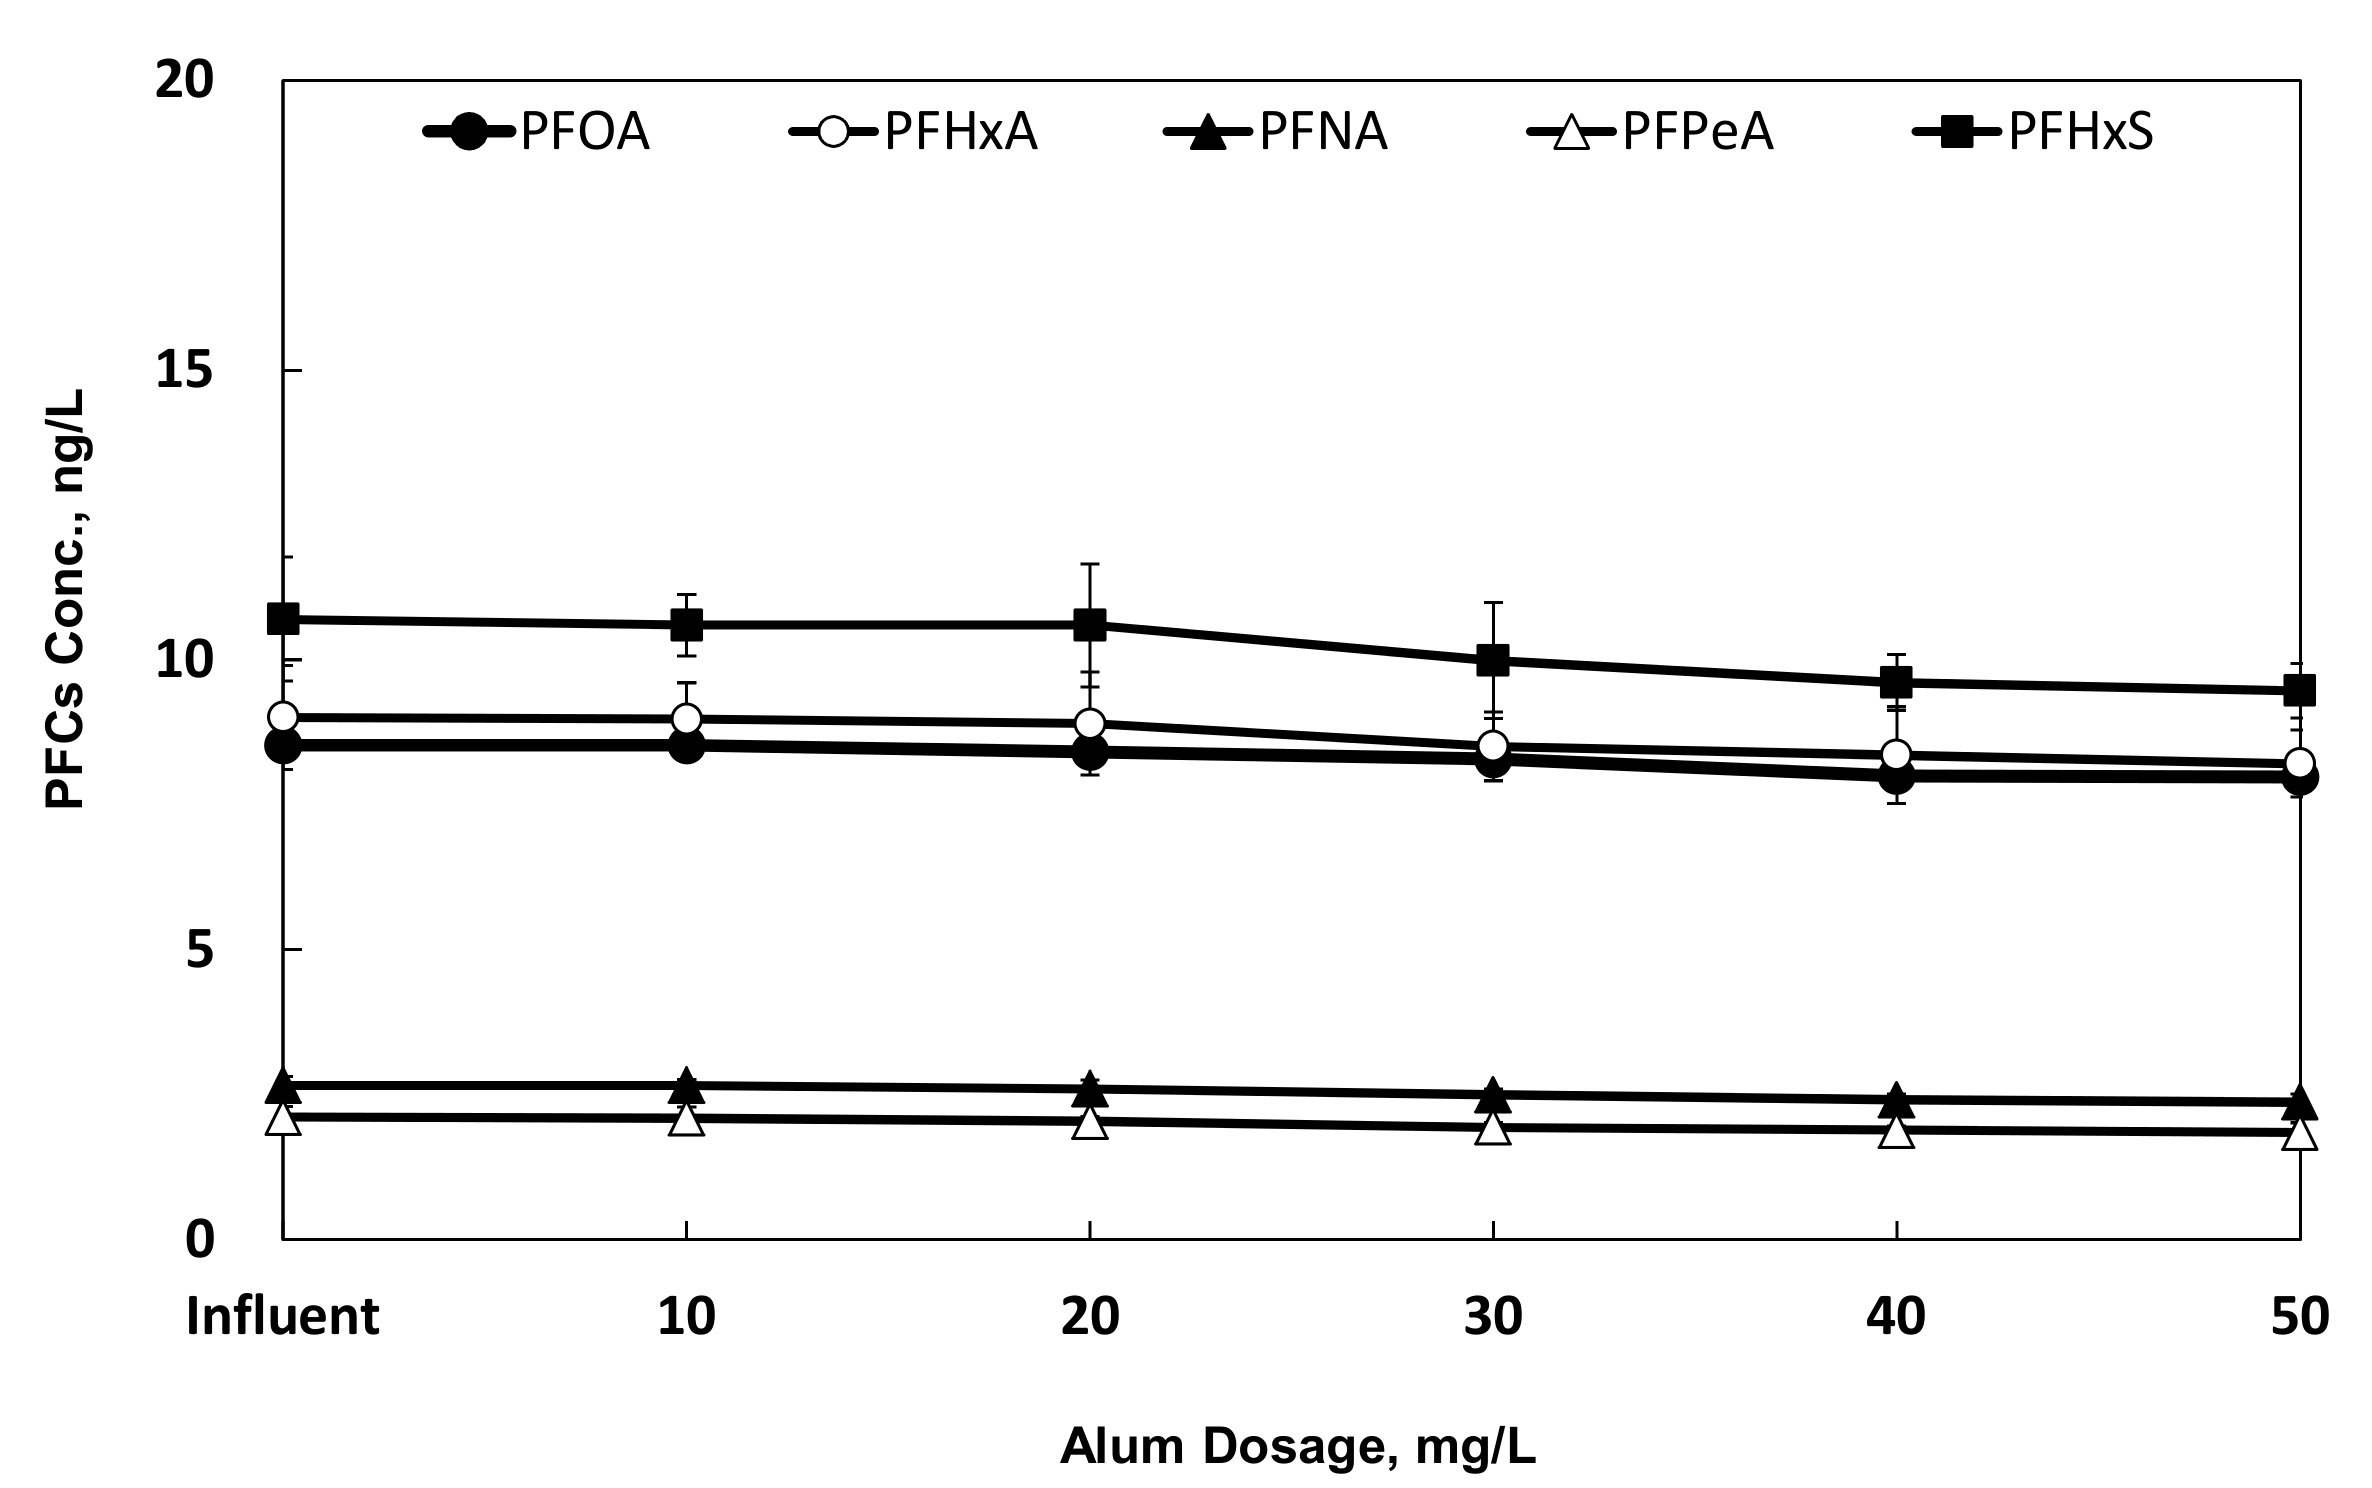
3.4.1. Removal Variation by Coagulation-Sedimentation

As shown in Figure 3, the PFCs in the coagulation-sedimentation test showed a phased concentration decrease. However, overall, the removal did not increase despite the additional injection of the coagulator of more than 40–50 mg/L. When 40–50 mg/L of coagulator was injected, the removal of PFPeA was highest at 12.3%, followed by PFHxS at 11.5%, PFNA at 10.9%, PFHxA at 8.9%, and PFOA at 6.4%.
The overall removal of PFCs was about 10%, demonstrating that they were somewhat removed by coagulation-sedimentation treatment. However, the effect was shown to be negligible and that it would be limited in removing non-degradable PFCs.

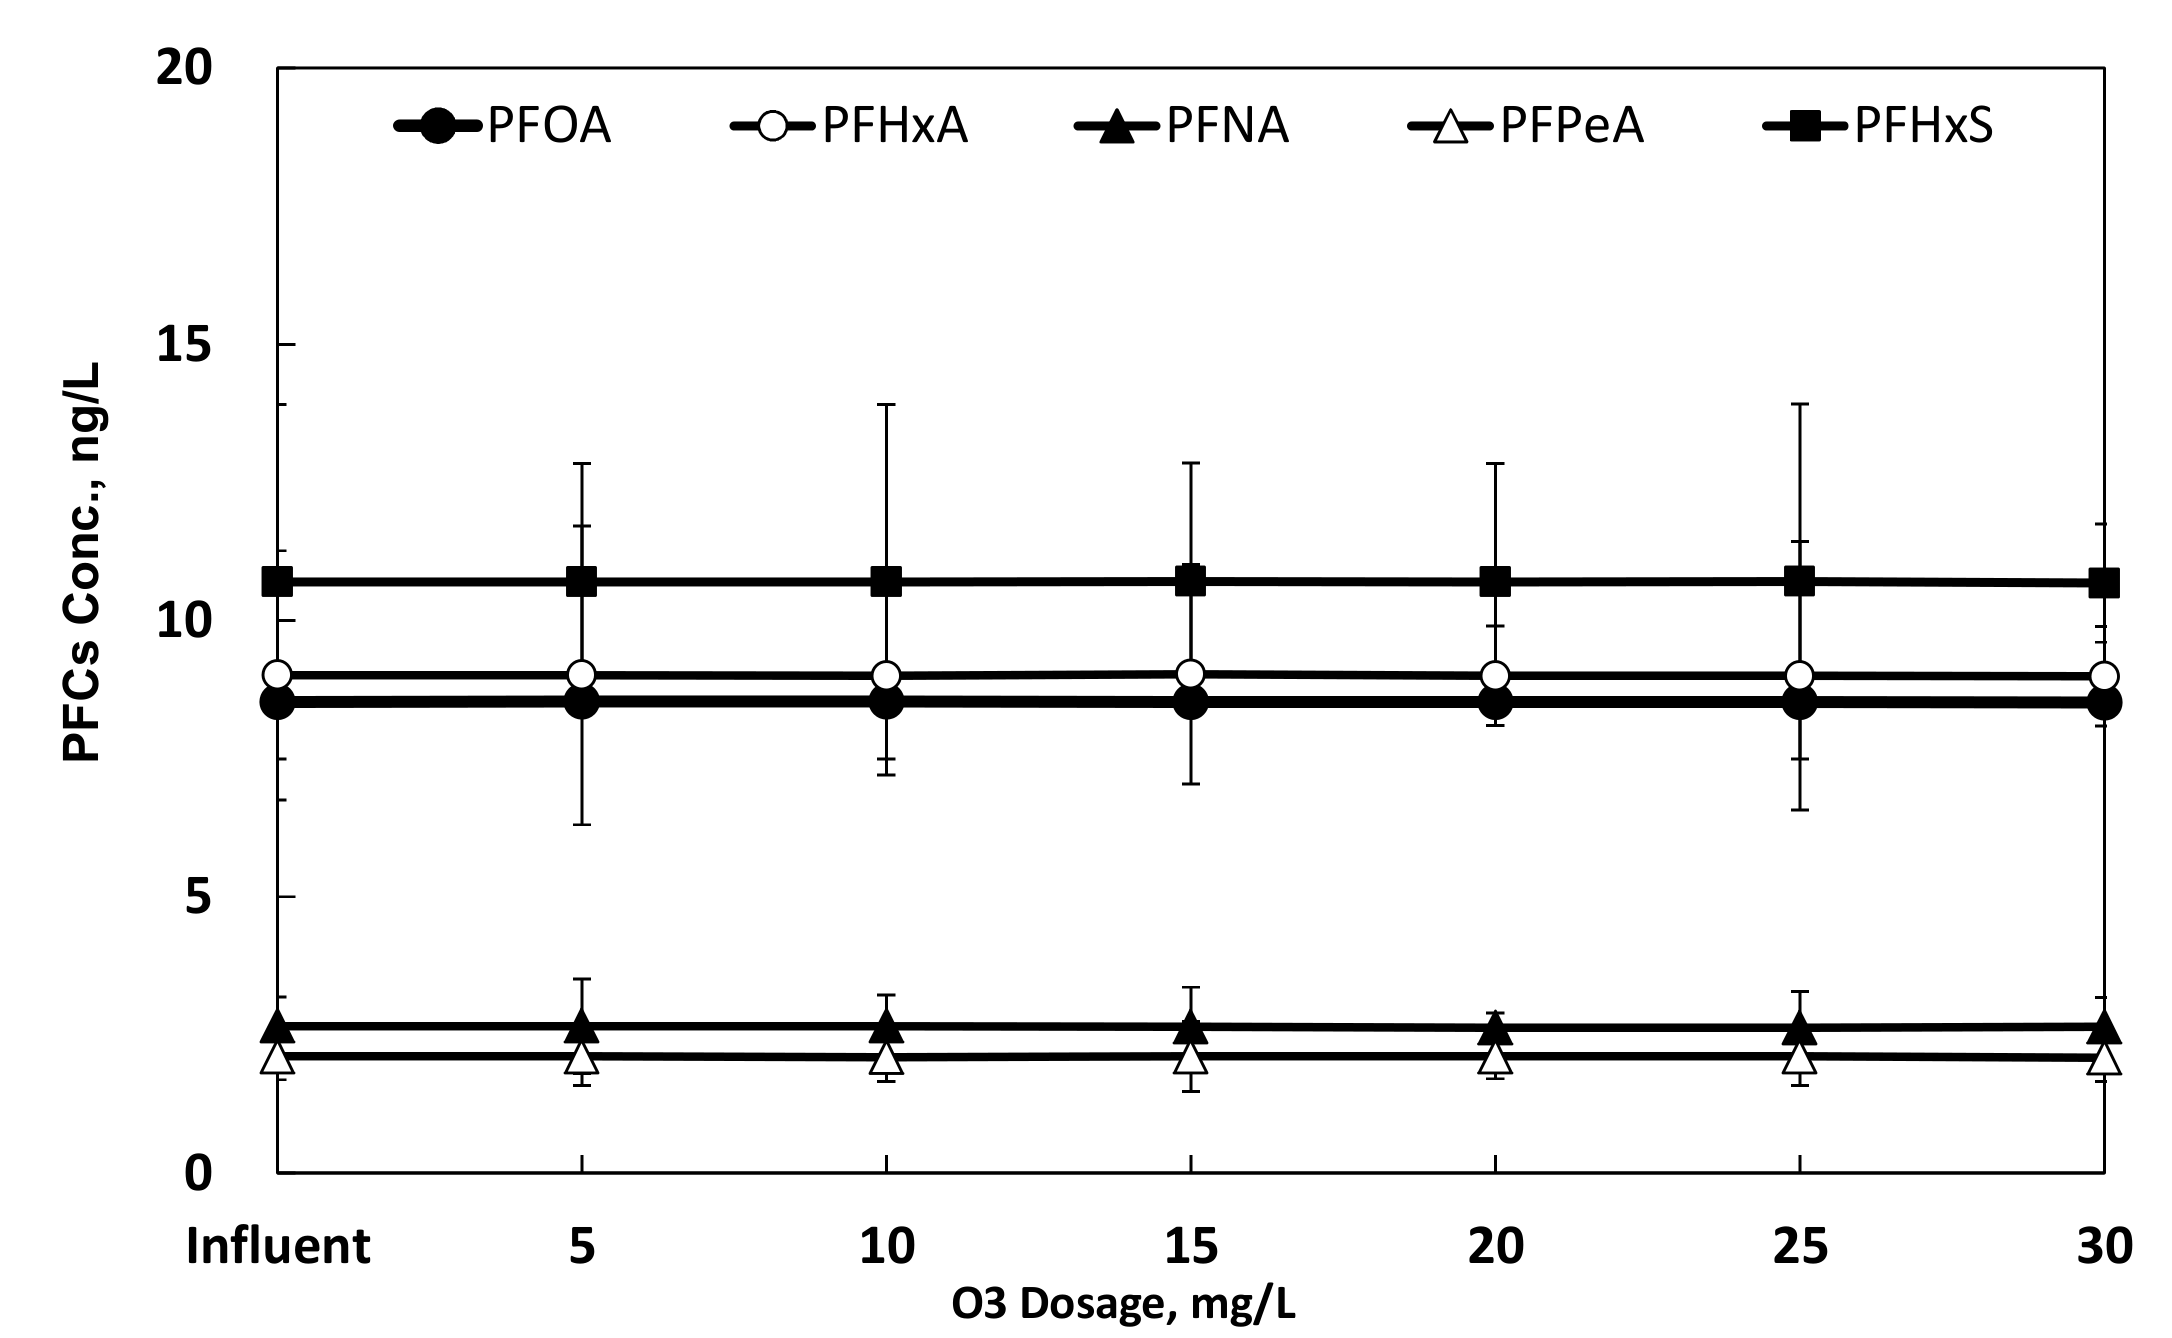
3.4.2. Removal Variation by Ozone Oxidation

The ozone contact test results in Figure 4 show that, in all compounds from PFOA to PFHxA, PFNA, PFPeA, and PFHxS, the removal was 5% or lower. Thus, regardless of the change in the ozone dose, the removal was negligible. Previous research showed that the PFOA removal was between 10% and 20%, but the removal by ozone oxidization was difficult [9].
Due to the highly stable structure, PFCs are difficult to remove through existing biochemical or oxidization processes. We also determined that PFCs removal by ozone oxidization would be difficult. Therefore, to remove them effectively, other additional treatment methods are required.

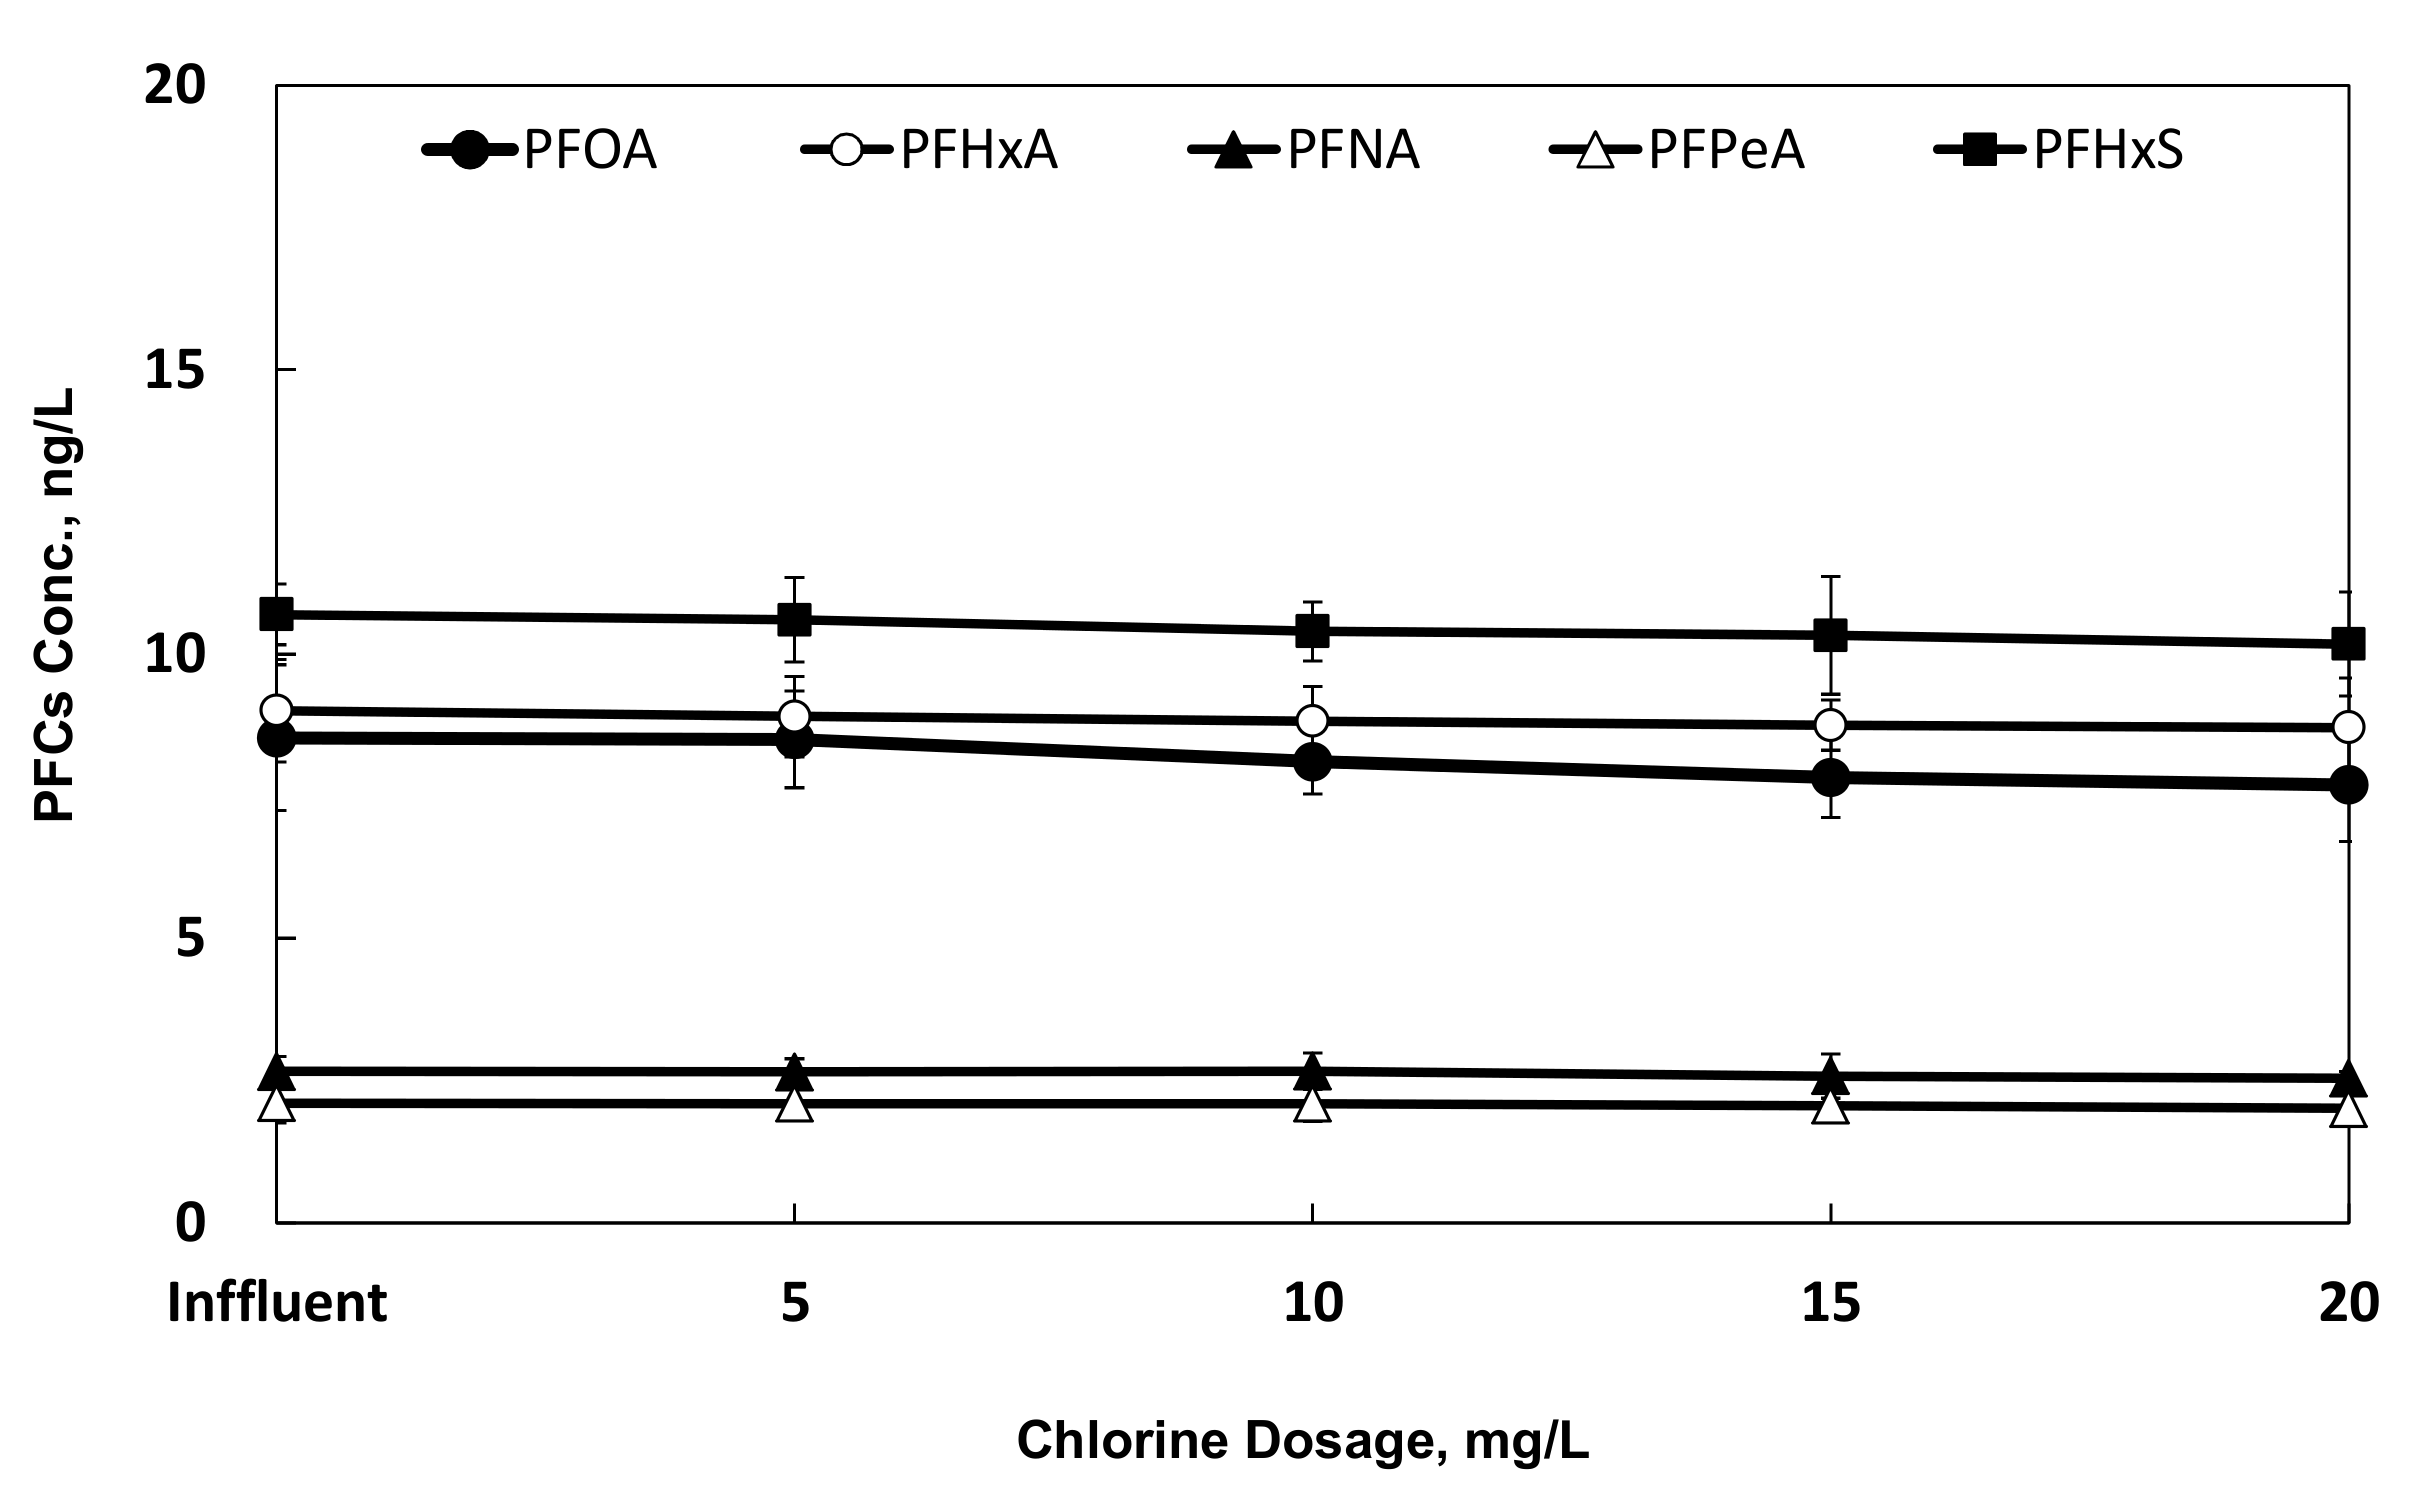
3.4.3. Removal Change by Chlorine Injection

As shown in Figure 5, the highest amounts of PFOA were removed, at 9.7% with 20 mg/L of the injection, which was found to be negligible. The PFHxA removal was 3.33%, which means little to no removal, and the PFNA removal was 4.6% and its concentration somewhat increased with 10 mg/L of the injection and then again decreased. The other compounds, PFPeA and PFHxS, showed a removal of 5% or lower, which was negligible. Previous research result showed little to no effect of the chlorine injection on the PFCs removal regardless of the oxidant dose [9], which was similar to the results of this study.
Since PFCs are stable and non-degradable, the use of a single chlorine disinfection process would not effectively remove them.

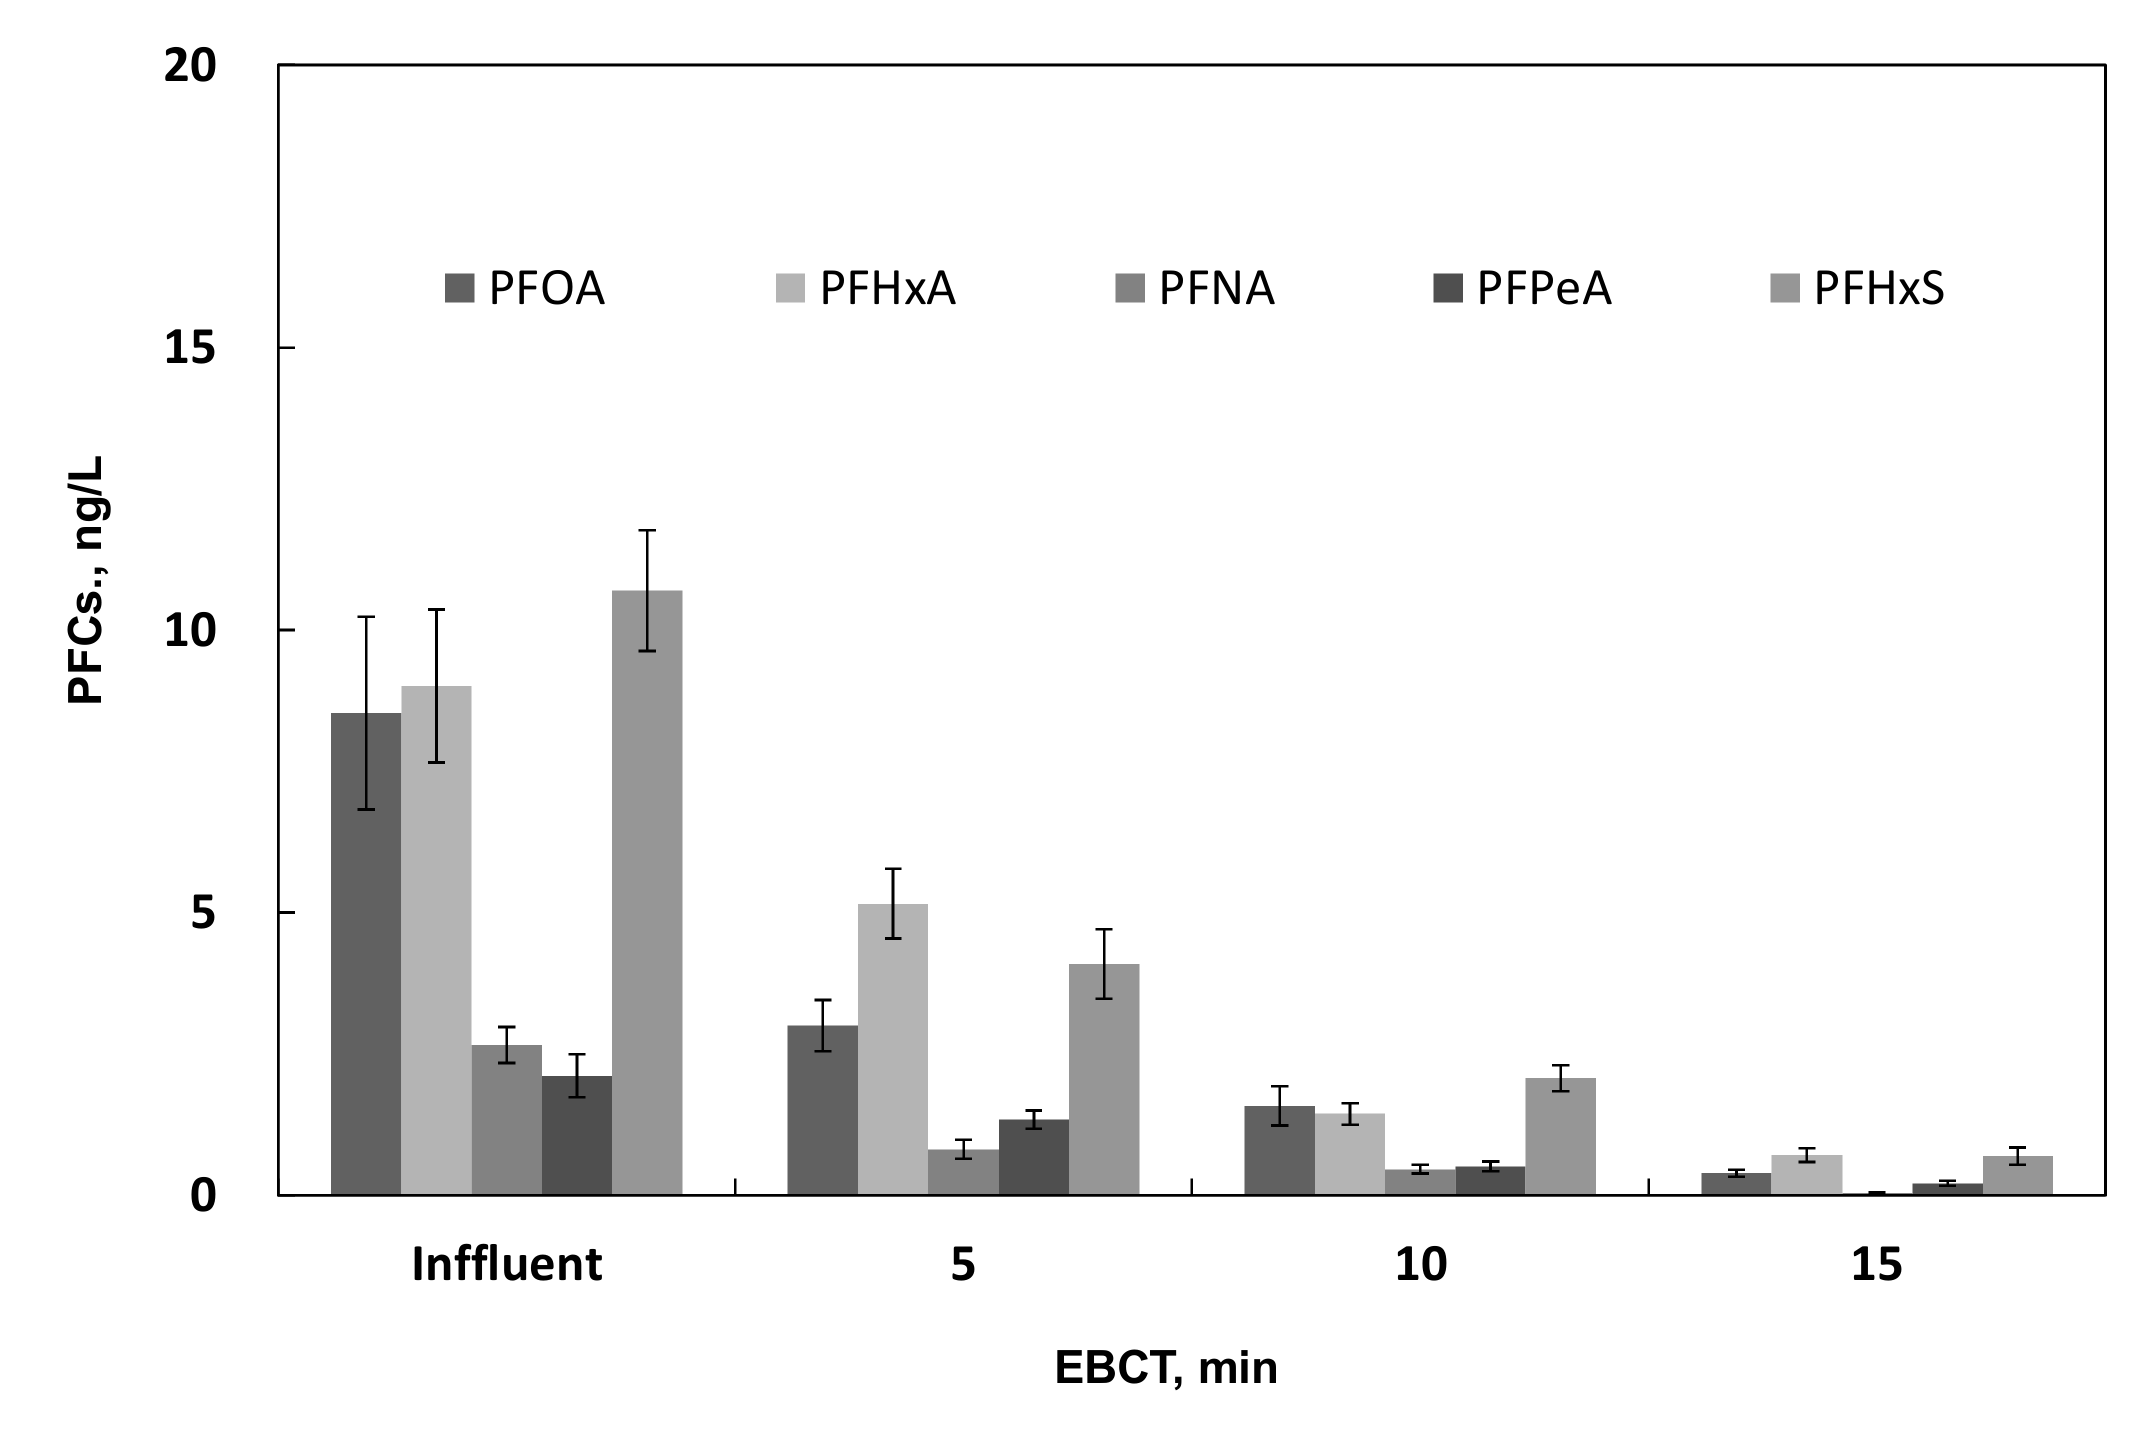
3.4.4. Removal Variation by Activated Carbon Adsorption

As shown in Figure 6, the PFNA removal at five minutes was 69.55%, which was the highest, 98.55%, at 15 min. The PFPeA removal at five minutes was 36.49%, which rose to the lowest (90.1%) at 15 min. The PFHxS removal at five minutes was 61.8%, which rose to 93.6% at 15 min. PFOA and PFHxA showed a 64.8% and 42.73% removal at 5 min of EBCT, which increased to 95.43% and 92.12% at 15 min of EBCT, respectively.
We found that 50% to 60% of PFCs was removed by five minutes of EBCT, and over 90% was removed after 15 min. PFNA showed the highest removal at 98.5%, and PFPeA showed the lowest at 90.1%. Previous research reported that the longer the length of the carbon ring in PFCs, the greater the increase in the adsorption force to the activated carbon. When the lengths of the carbon ring are identical, the adsorption force of the activated carbon to sulfone substituent would be stronger than that to carboxyl substituent [14]. In this study, the removal of PFNA, which has a large number of carbons, was highest. For PFHxA and PFHxS in which the number of carbons was identical, more of PFHxS, which has a sulfone substituent, would be removed.
The activated carbon adsorption test showed relatively higher removal, and since the surface of the activated carbon is hydrophobic, it is useful for removing hydrophobic PFCs.

3.5. Proposal of an Optimal PFCs Treatment Process

Based on the analysis results of each unit process and the pilot test effluent, we reviewed an efficient treatment process for removing PFCs and list the PFCs process efficiencies and cumulative removal efficiencies in Table 3. PFCs are hard to degrade and remove through the existing biological treatment methods and are thus considered non-degradable [9].
For the activated carbon adsorption, the longer the length of the carbon ring of the PFCs, the more the adsorption force of the activated carbon increases. If the lengths of the carbon rings are identical, the adsorption force of the activated carbon is stronger with the sulfone substituent than with the carboxyl substituent [14] As for the adsorption and removal of PFCs using zeolite, the higher the Si content in zeolite, the more the PFCs adsorption capacity increases. However, this treatment is reported to have a smaller adsorption capacity than treatment with activated carbon [15]
Activated carbon adsorption showed a relatively higher PFCs removal than the other treatments. Therefore, it would be effective for PFCs removal in the wastewater treatment process. The PFHxS removal in the single ozone process or the single activated carbon process was low, but improved with the continuous ozone treatment process followed by the activated carbon process. Accordingly, the implementation of an oxidization process, such as the ozone process followed by an adsorption process using activated carbon, for example, is considered to be the most desirable process with a higher chance of removal.

4. Conclusions

We surveyed the PFCs pollution sources, targeting the influent and effluent of wastewater treatment plants, and conducted a pilot test with influent to review whether PFCs could be removed using physiochemical methods. This study produced the following results.
(1)
The influent/effluent removal of the existing biological treatment process was able to remove some PFNA, PFPeA, and PFHxS, but most of the other compounds could not be removed through biological treatment.
(2)
The correlational analysis results showed that there was a high correlation in the wastewater among PFOA, PFHxA, and PFNA, which contain carboxyl groups. The PFCs correlational research did not produce data that could be representative. Thus, further research is required.
(3)
The pilot batch test with the influent to the treatment plant showed that about 10% of PFCs was removed by an injection of 40 to 50 mg/L of Alum in the coagulation-sedimentation test. For the pilot continuous test, the removal in the ozone test and chlorine injection test was negligible regardless of the oxidant dose. The activated carbon adsorption test showed that about 60% to 70% of PFCs was removed after EBCT 5 min, and removing over 90% of PFCs after 15 min EBCT was found to be possible.
(4)
The pilot test results showed that PFHxS removal in single ozone or activated carbon process was low. However, it improved in the continuous ozone process followed by the activated carbon process. This demonstrated that ozone oxidization would promote the removal during the next process. Therefore, the continuous oxidization process, such as the ozone process, followed by an adsorption process using activated carbon, would be a desirable process enabling high removal.

Author Contributions

Conceptualization, S.-h.L.; Methodology, S.-h.L.; Validation, S.-h.L. and Y.-j.C.; Formal analysis, Y.-j.C.; Investigation, S.-h.L.; Writing—original draft preparation, B.-D.L.; Writing—review and editing, B.-D.L.; Visualization, M.L.; Supervision, S.-h.L.; Project administration, S.-h.L.; Funding acquisition, M.L.

Funding

This work was supported by the Korea Environment Industry & Technology Institute (KEITI) through Public Technology Program based on Environmental Policy, funded by Korea Ministry of Environment (MOE) (2016000200008).

Conflicts of Interest

The authors declare no conflict of interest.

References

  1. Cho, C.R.; Eom, I.C.; Kim, E.J.; Kim, S.J.; Choi, K.H.; Cho, H.S.; Yoon, J.H. Evaluation of the level of PFOS and PFOA in environmental media from industrial area and four major river basin. J. Kor. Soc. Environ. Anal. 2009, 12, 296–306. [Google Scholar]
  2. Cho, C.; Cho, J.-G.; Eom, I.-C.; Lee, B.-C.; Kim, S.-J.; Choi, K.; Yoon, J. Bioconcentration of perfluorinated compounds in fish from Gulpo stream. Environ. Health Toxicol. 2010, 25, 229–240. [Google Scholar]
  3. Cho, C.R.; Lee, D.H.; Lee, B.C.; Kim, S.J.; Choi, K.H.; Yoon, J.H. Residual concentrations of perfluorinated compounds in water samples of Anseong and Gyeongan streams and their spectroscopic characteristics. J. Kor. Soc. Environ. Anal. 2010, 13, 226–236. [Google Scholar]
  4. Hardell, E.; Kärrman, A.; van Bavel, B.; Bao, J.; Carlberg, M.; Hardell, L. Case–control study on perfluorinated alkyl acids (PFAAs) and the risk of prostate cancer. Environ. Int. 2014, 63, 35–39. [Google Scholar]
  5. United Nations Environmental Programme; UNEP/POPS/COP.4/38; United Nations: New York, NY, USA, 2009.
  6. Ding, G.H.; Frmel, T.; van den Brandhof, E.J.; Baerselman, R.; Peijnenburg, W.J. Acute toxicity of poly- and perfluorinated compounds to two cladocerans, Daphnia magna and Chydorus sphaericus. Environ. Toxicol. Chem. 2012, 31, 605–610. [Google Scholar] [CrossRef] [PubMed]
  7. Wang, Y.; Niu, J.; Zhang, L.; Shi, J. Toxicity assessment of perfluorinated carboxylic acids (PFCAs) towards the rotifer Brachionus calyciflorus. Sci. Total Environ. 2014, 491–492, 266–270. [Google Scholar] [CrossRef] [PubMed]
  8. Stahl, L.L.; Snyder, B.D.; Olsen, A.R.; Kincaid, T.M.; Wathen, J.B.; McCarty, H.B. Perfluorinated compounds in fish from U.S. urban rivers and the Great Lakes. Sci. Total Environ. 2014, 499, 185–195. [Google Scholar] [CrossRef] [PubMed]
  9. Park, C.-G. Study on concentration distribution and removal characteristics of micro-pollutants in the middle Nakdong river basin. Ph.D. Thesis, Yeungnam University, Gyeongsan, Korea, 2013. [Google Scholar]
  10. Roth, N.; Wilks, M.F. Neurodevelopmental and neurobehavioural effects of polybrominated and perfluorinated chemicals: A systematic review of the epidemiological literature using a quality assessment scheme. Toxicol. Lett. 2014, 230, 271–281. [Google Scholar] [CrossRef] [PubMed]
  11. Shin, M.Y.; Im, J.K.; Kho, Y.L.; Choi, K.S.; Zoh, K.D. Quantitative determination of PFOA and PFOS in the effluent of sewage treatment plants and in Han river. J. Environ. Health Sci. 2009, 35, 334–342. [Google Scholar] [CrossRef]
  12. Ahrens, L.; Barber, J.L.; Xie, Z.; Ebinshaus, R. Longitudinal and latitudinal distribution of perfluoroalkaly compounds in surface water of the Atlantic ocean. Environ. Sci. Technol. 2009, 43, 3122–3127. [Google Scholar] [CrossRef] [PubMed]
  13. So, M.K.; Miyake, Y. Perfluorinated compounds in the Pearl river and Yangtze river of China. Chemosphere 2007, 68, 2085–2095. [Google Scholar] [CrossRef] [PubMed]
  14. Du, Z.; Deng, S.; Bei, Y.; Huang, Q.; Wang, B.; Huang, J.; Yu, G. Adsorption behavior and mechanism of perfluorinated compounds on various adsorbents-a review. J. Hazard Mater. 2014, 274, 443–454. [Google Scholar] [CrossRef] [PubMed]
  15. Ochoa-Herrera, V.; Sierra-Alvarez, R. Removal of perfluorinated surfactants by sorption onto granular activated carbon, Zeolite and sludge. Chemosphere 2008, 72, 1588–1593. [Google Scholar] [CrossRef] [PubMed]
Figure 1. The process flowchart of the wastewater treatment plants in city K.
Applsci 09 02500 g001
Figure 2. Flow variations of a wastewater treatment plant in city K.
Applsci 09 02500 g002
Figure 3. Variations in PFCs concentrations with Alum dosages.
Applsci 09 02500 g003
Figure 4. Variations of PFCs concentration by O3 dosages.
Applsci 09 02500 g004
Figure 5. Variations in PFCs concentration with different chlorine dosages.
Applsci 09 02500 g005
Figure 6. Variations in PFCs concentration by granular activated carbon (GAC) EBCT.
Applsci 09 02500 g006
Table 1. Analytical condition of perfluorinated compounds (LC: Liquid chromatography; MS: mass spectrometer).
ParameterConditions
LCWaters, ACQUITY, HPLC
MSSCIEX, API-4000, Q-Trap
ColumnWaters, BEH C18, 2.1 × 50 mm, 1.7μm
Mobile phaseA: 10 mM ammonium acetate in water
B: Acetonitrile
GradientTime (min)
Solvent B (%)
Flow rate270 μL/min
Injection volume5 μL
Column temp.40 °C
Ionization modeNegative
Curtain Gas40
Collision Gas8
Ion Spray Voltage−4500 V
Table 2. Comparison of correlation coefficients of PFCs with other cities with similar populations and industries (xx: 0-0.2; x: 0.21-0.4; △: 0.41-0.6; PFOA: perfluorooctanoic acid; PFPeA: perfluoro-n-pentanoic acid; PFHxS: perfluorohexane sulfonate; PFHxA: perfluorohexanoic acid; PFNA: perfluorononanoic acid).
R2Other Cities
CompoundsPFOAPFHxAPFNAPFPeAPFHxS
PFOA1-0.050xx0.013xx0.141xx0.486
PFHxA--1-0.5160.5830.090xx
PFNA----1-0.160xx0.019xx
PFPeA------1-0.098xx
PFHxS--------1-
Table 3. Summary of PFCs applicability by various treatments.
ProcessPFCs
PFOAPFHxAPFNAPFPeAPFHxS
Bat *Conti **BatContiBatContiBatContiBatConti
BioreactorXXXXXX
Coagulation-SedimentationXX
OzonationXXXXX
Activated carbon treatmentEBCT 5 minOOOOO
EBCT 15 min
ChlorinationXXXXX
Note: X: removal efficiency <10%, △: removal efficiency 10–40%, O: removal efficiency 40–70%, ◎: removal efficiency >70%; *: Batch process; **: Continuous process.

