Plasma-Derived Reactive Species Shape a Differentiation Profile in Human Monocytes
by
 , and
, and
Eric Freund
1,2 ,
,
Juliane Moritz
1,
Matthias Stope
3,
Christian Seebauer
4,
Anke Schmidt
1 and
Sander Bekeschus
1,* 1
ZIK plasmatis, Leibniz Institute for Plasma Science and Technology (INP Greifswald), Felix Hausdorff Str. 2, 17489 Greifswald, Germany
2
Department of General, Visceral, Thoracic and Vascular Surgery, University Medicine Greifswald, Ferdinand-Sauerbruch-Str., 17475 Greifswald, Germany
3
Department of Urology, University Medicine Greifswald, Ferdinand-Sauerbruch-Str., 17475 Greifswald, Germany
4
Department of Oral and Maxillofacial Surgery, University Medicine Greifswald, Ferdinand-Sauerbruch-Str., 17475 Greifswald, Germany
*
Author to whom correspondence should be addressed.
Appl. Sci. 2019, 9(12), 2530; https://doi.org/10.3390/app9122530
Submission received: 9 April 2019
/
Revised: 13 June 2019
/
Accepted: 15 June 2019
/
Published: 21 June 2019
(This article belongs to the Special Issue Plasma Medicine Technologies)
Abstract
:Background: Monocyte-derived macrophages are key regulators and producers of reactive oxygen and nitrogen species (ROS/RNS). Pre-clinical and clinical studies suggest that cold physical plasma may be beneficial in the treatment of inflammatory conditions via the release of ROS/RNS. However, it is unknown how plasma treatment affects monocytes and their differentiation profile. Methods: Naïve or phorbol-12-myristate-13-acetate (PMA)-pulsed THP-1 monocytes were exposed to cold physical plasma. The cells were analyzed regarding their metabolic activity as well as flow cytometry (analysis of viability, oxidation, surface marker expression and cytokine secretion) and high content imaging (quantitative analysis of morphology. Results: The plasma treatment affected THP-1 metabolisms, viability, and morphology. Furthermore, a significant modulation CD55, CD69, CD271 surface-expression and increase of inflammatory IL1β, IL6, IL8, and MCP1 secretion was observed upon plasma treatment. Distinct phenotypical changes in THP-1 cells arguing for a differentiation profile were validated in primary monocytes from donor blood. As a functional outcome, plasma-treated monocytes decreased the viability of co-cultured melanoma cells to a greater extent than their non-treated counterparts. Conclusions: Our results suggest plasma-derived ROS/RNS shaped a differentiation profile in human monocytes as evidenced by their increased inflammatory profile (surface marker and cytokines) as well as functional outcome (tumor toxicity).
1. Introduction
In cancer, the infiltration of pro-inflammatory immune cells can be a major prognostic factor in patient survival [1,2]. Among others, macrophages are given an outstanding role in this process. Macrophages stem from monocytes, which stream into the target tissue from the blood by diapedesis prior to differentiation [3]. Their main role is the regulation of inflammation [4]. For example, they recognize and clear pathogens, phagocytose apoptotic and necrotic cells, and attract or repel other leucocyte populations or stromal cells by releasing a number of cytokines and chemokines. By doing so, macrophages play a central role in tissue hemostasis and disease, for example, in non-healing wounds and cancer [5]. This includes the development [6] as well as the progression of cancer [7] as circulating monocytes frequently enter the tumor bed [8]. However, education of macrophages through the tumor can enhance tumor-growth and complications, as metastasis [9,10]. For example, it has been reported that colorectal cancer can polarize monocytes to macrophages via tumor-microvesicles [11]. On the other hand, driving the differentiation of monocytes to a more pro-immunogenic phenotype can reverse the effect and reveal an anti-cancer activity [7,12,13]. This makes tumor associated macrophages a promising target for immune therapies [14,15] as hot (inflamed) tumors are often associated with a better prognosis [16,17].
A body of evidence points to an important role of reactive oxygen and nitrogen species in these processes [18]. In tissues, monocytes and macrophages are often exposed to reactive oxygen and/or nitrogen species (ROS/RNS) released under inflammatory conditions mainly from other myeloid cells [19]. Moreover, the activation of macrophages and the subsequent oxidative environment has been a topic in recent research [20,21]. Together with local cytokines and chemokines provided by the inflamed microenvironment, phenotypic differentiation takes place [22]. In general, ROS/RNS readily react with membranes and protein-thiols redox-signaling oxidative changes to unleash appropriate transcriptional responses [23,24,25]. It has been hypothesized that this signaling system can be exploited by technical generation of ROS/RNS.
Therapeutic ROS/RNS are generated with cold physical plasma devices. Cold physical plasma, from hereon named plasma, is a partially ionized gas at body temperature [26]. This multi-component system is releasing a variety of ROS/RNS, such as, nitric oxide, superoxide, and singlet oxygen [27,28,29]. At present, three medical plasmas have received accreditation as medical devices [30]. Plasmas are antimicrobial and suggested to support healing of chronic-wounds and ulcers in pre-clinical and clinical studies [31,32,33,34,35,36]. Furthermore, cold plasmas have successfully eradicated tumors in mice [37,38,39,40,41], and first cancer patients have benefited from plasma therapy [42]. Hence, plasma treatment is performed in wounds and topical cancer, both being active sites of monocyte influx. To investigate how plasma treatment may affect these cells regarding activity, differentiation, and function, human monocytes (either naïve or pre-stimulated as would be the case when approaching inflammatory sites) were plasma-treated in vitro and investigated regarding their activity and phenotype. Our results suggested that ROS/RNS derived from plasma shape a differentiation profile in human monocytes.
2. Materials and Methods
2.1. Cell Culture and Preparation
Human monocyte THP-1 cells (ATCC Tib-202, Manassas, VA, USA), human A375 melanoma cells (ATCC CRL-1619, Manassas, VA, USA), and primary monocytes from human blood were cultured in Roswell Park Memorial (RPMI) media supplemented with 10% fetal bovine serum, 2% glutamine, and 1% penicillin/streptomycin (all Sigma, St. Louis, MO, USA). The primary cells were isolated from peripheral blood mononuclear cells (PBMCs) of healthy human donors via magnet bead separation (BioLegend, San Diego, CA, USA). The purity of the isolated CD14 positive fraction was assessed with flow cytometry. For treatment, 20,000 cells were added per well in 100 µL of fully supplemented cell culture media with or without phorbol-12-myristate-13-acetate (PMA; Sigma, St. Louis, MO, USA) at a final concentration of 12.5 ng/mL. The immune-stimulatory PMA was used as the control for the induction of differentiation pathways in monocytes [43]. The treatment with plasma or hydrogen peroxide (used in some control experiments; Sigma, St. Louis, MO, USA) was performed within 1 h after seeding of the cells. The specialized flat-bottom 96-well plates (Eppendorf, Hamburg, Germany) with a water reservoir around all wells were used to prevent excessive evaporation during long culture conditions up to four days.
2.2. Cold Physical Plasma and Treatment of Cells
For plasma treatment, the atmospheric pressure argon plasma jet kINPen (neoplas tools, Greifswald, Germany) was utilized. It is similar to the kINPen MED in construction, geometry, and reactive species output [30]. A detailed description on the physics and reactive species output has been published recently [44]. The source is operated with argon (Air Liquide, Paris, France) as feed gas, and two standard-liters per minute were used to generate the plasma for the treatment of cells. Several safety studies investigated the possibility of a mutagenic or genotoxic effects through physical plasma, and found no increase of micronuclei, as well as mutagenic properties in animals that had undergone frequent plasma-treatments [45,46,47]. For treatment of 96-well plates, a computer program was written that guided the plasma jet, which was mounted to a computer-driven xyz-table (CNC-Step, Geldem, Germany), to be positioned over the center of the well for a preconfigured amount of time. The evaporation inevitably present during plasma treatment was compensated for directly after the treatment by the addition of a pre-determined amount of double-distilled water. The total plasma treatment time of 20,000 cells per well was either 20 s or 120 s for THP-1 cells or 10 s and 20 s for the treatment of the more sensitive primary monocytes. The amount of hydrogen peroxide in plasma-treated medium was determined using the Amplex ultra red assay (Thermo Scientific, Waltham, MA, USA) according to the manufacturer’s instructions, yielding a working concentration of 100 µM. For the control experiments, the treatment was carried out using hydrogen peroxide at a concentration matched on the concentration that was generated with the plasma treatment of liquid. In all experiments, four technical replicates were used for each treatment condition and biological replicate. The treated cells were utilized for further downstream analysis. An overview about the experimental procedures is stated in the upper left corner of every figure legend.
2.3. Cytosolic and Mitochondrial Oxidation
THP-1 cells and primary monocytes were stained with dihydrorhodamine 123 (DHR123) and Mitotracker Orange (MTO) at a final concentration of 1 µM each (both Thermo Scientific, Waltham, MA, USA) according to the manufacturer’s protocol. Directly after plasma treatment, the cells were subjected to flow cytometric analysis (CytoFLEX S, Beckman-Coulter, Brea, CA, USA). The mean fluorescent intensities of the live (DAPI-negative) population for DHR123 (λex 488 nm and λem 525 nm) and MTO (λex 561 nm and λem 575 nm) were retrieved using Kaluza 2.1 flow cytometric analysis software (Beckman-Coulter, Brea, CA, USA) from more than 1000 single flow cytometry measurements. The sample data were normalized to untreated controls.
2.4. Metabolic Activity and Cell Counts
Directly after plasma treatment of THP-1 cells and primary monocytes, resazurin (Alfa Aesar, Haverhill, MA, USA) was added to the cells at a final concentration of 100 µM. Only metabolically active cells transformed non-fluorescent resazurin to highly fluorescent resorufin via NADPH. After 4 h of incubation, fluorescence was measured in a multimode plate reader (Tecan, Männedorf, Switzerland) at λex 535 nm and λem 590 nm. The data were normalized to untreated controls. Subsequently, DAPI was added to all wells, and the plate was analyzed by a flow cytometer (CytoFlex; Beckman-Coulter, Brea, CA, USA) capable of determining absolute particle concentrations per microliter to quantify the number of viable cells per well. In control wells, the cells were incubated with N-acetylcysteine (NAC, 1 mM) as quencher for ROS.
2.5. Live Cell Imaging
The cells were seeded and treated as described above. Using a high content imaging system (Operetta CLS; PerkinElmer, Waltham, USA), 25 fields of views per well were imaged with a 20 × air objective at 6 h (d0), 48 h (d2), and 96 h (d4) after plasma treatment. Image quantification approaches were performed using Harmony software (PerkinElmer, Waltham, MA, USA) to assess cell roundness and total cytosolic area. Approximately 16,000 images were used for quantitative analysis. For co-culture experiments, A375 cells were labeled with cell trace red (life technologies) and 5000 cells were added to THP-1 cells that had been incubated for 4 days untreated or plasma-treated in the presence or absence of PMA. DAPI was added, and the plate was imaged after 1–8 h. Quantification was performed by measuring the mean fluorescent intensity of the cell trace red-positive cells. Approximately 6000–10,000 cells were analyzed in total per condition.
2.6. Cell Surface Marker Analysis
THP-1 cells and primary monocytes were plasma-treated and incubated for 96 h. Subsequently, cells were washed, harvested with accutase (BioLegend, San Diego, CA, USA) and pooled into V-bottom 96-well plates (Corning, Corning, NY, USA). After washing of the well plate, the cells were stained with fluorochrome-conjugated antibodies (all Becton Dickinson, Franklin Lakes, NJ, USA) targeted against CD11b (APC-Cy7), CD11c (BV421), CD15s (PerCP-Cy5.5), CD33 (BV510), CD41 (Pacific Blue), CD45RA (PE-Dazzle), CD49d (FITC), CD55 (PE-Cy5), CD63 (PE), CD66b (AF700), CD69 (BV650), CD80 (FITC) CD154 (APC-Cy7), CD163 (APC), CD206 (PE) CD271 (PE-Cy7) and HLA-ABC (APC). After two additional washing procedures, the mean fluorescence intensity (MFI) of each cell surface markers was analyzed by flow cytometry. The compensation of the 12-marker panel was carried out using compensation beads (Becton Dickinson, Franklin Lakes, NJ, USA) yielding a compensation matrix (Supplementary Figure S1b) calculated via the CytExpert 2.2 flow cytometry acquisition software (Beckman-Coulter, Brea, CA, USA). The flow data were normalized to untreated controls (without PMA).
2.7. Cell Culture Supernatant Analysis
Cell culture supernatants of THP-1 monocytes incubated for 96 h post-treatment were harvested, pooled from four technical replicates, spun to dispose of residual cells, and frozen for longitudinal analysis. The concentration of 13 different cytokines or chemokines (IL1β, IFNα, IFNγ, TNFα, MCP1, IL6, IL8, IL10, IL12p70, IL17A, IL18, IL23, and IL33) was assessed using LegendPlex (BioLegend, San Diego, CA, USA) according to the manufacturer’s instruction. Target quantification was performed using dedicated software (VigeneTech, Carlisle, MA, USA).
2.8. Real-Time PCR Analysis
After 4 days of incubation, THP-1 cells were harvested into 1.5 mL tubes (Eppendorf, Hamburg, Germany). After pelleting and suspending the cells in lysis buffer, RNA isolation was performed according to the protocol of the RNA isolation kit (RNA Mini Kit; Bio&SELL, Feucht, Germany). The RNA concentration of each sample was measured by using the NanoDrop2000C (Thermo, Waltham, MA, USA) device. For quantitative polymerase chain reaction (qPCR), 1 µg of RNA was synthesized into cDNA, according to the manufacturer’s instructions (ThermoFisher, Waltham, MA, USA) using a thermocycler (Biometra, Goettingen, Germany). qPCR was performed in white 96-well V-bottom plates with Sybr Green (BioRad, Munich, Germany) labeled targets over 50-cycles using a Light Cycler 480 machine (Roche, Mannheim, Germany). Fold changes in expression were calculated using the 2−ΔΔCt method, and normalized against glyceraldehyde 3-phosphate dehydrogenase (gapdh).
2.9. Statistical Analysis
All data are from 3–8 independent experiments with at least four technical replicates for each treatment condition. Graphing and statistical analysis was done with prism 8.1 software (GraphPad, San Diego, CA, USA) using a t test, or one-way or two-way analysis of variances (anova) where appropriate. The levels of significance were indicated as follows: α = 0.05 (*), α = 0.001 (**), α = 0.001 (***).
3. Results
3.1. Plasma Treatment Oxidized THP-1 Monocytes while Being of Modest Toxicity
Physical plasma is able to generate a broad spectrum of short living reactive species that can be retained as more stable mediators like hydrogen peroxide (H2O2) in treated liquids. Exposing RPMI cell culture medium to the effluent of the kINPen argon plasma-jet (Figure 1a) generated different amounts of H2O2 in a time-dependent manner that can be described with a polynomial (quadratic) function (Figure 1b). Whereas 20 s of plasma-treatment corresponded to 75 µM H2O2, 120 s generated 300 µM of this oxidative molecule. These regimens were used for treatment of THP-1 monocytes either stimulated with phorbol-12-myristate-13-acetate (PMA) or left unstimulated (no PMA). Redox-sensitive dyes are practical tools to assess intracellular redox state, and two dyes with different emission spectra were used to investigate the cytosolic (DHR123, Figure 1c) and mitochondrial (MTO, Figure 1e) oxidation. For quantification, normalization was done against the control cells that have not received PMA. The treatment with PMA itself did not elicit intracellular oxidation with either dye when compared to the untreated control (Figure 1d,f). By contrast, plasma treatment mediated a significant increase with both probes and independent of PMA stimulation. This suggested plasma-generated ROS reaching the cells and leading to intracellular oxidative reactions, while the change in cytosolic oxidations was more profound compared to mitochondrial reactions.
The next question was whether plasma treatment compromised THP-1 cell viability. Four hours following exposure to plasma, the metabolic activity of THP-1 monocytes was measured per well. Quantification revealed only a minor decrease in metabolic activity in non-PMA-pulsed cells (Figure 1g). Similar to oxidation, there was no difference between untreated control and untreated PMA-pulsed cells. Subsequently, absolute cell counts were performed. There was a significant reduction in the total number of viable cells in non-PMA-stimulated THP-1 cells (Figure 1h). In contrast, the viable cell counts of PMA-stimulated cells were largely similar but overall lower compared to non-stimulated cells. Calculating the metabolic activity per cell by dividing the total resorufin fluorescence (Figure 1g) by the total number of viable cells (Figure 1h) did not reveal a difference in PMA-treated samples. By contrast, non-stimulated cells (no PMA) showed a significant tendency towards a higher metabolism per cell with 120 s of plasma treatment. Taken together, these results show that plasma was of only modest toxicity and may introduce metabolic alterations through oxidation in the cytosolic and mitochondrial compartments, yielding a higher turnover per cell similar to PMA-treated cells.
3.2. Plasma Treatment Oxidized Primary Human Monocytes and the Effect Can be Quenched via Antioxidants
To validate these findings in primary cells, human monocytes were isolated from peripheral blood mononuclear cells (PBMCs). Experimentally added, H2O2 was used as positive control for plasma. The amount of H2O2 was matched to the concentration that was detected after 10 s or 20 s plasma-treatment (Figure 1b). The ROS-scavenger N-acetylcysteine (NAC) served as additional control. With both the redox-sensitive dyes DHR123 (Figure 2a) and MTO (Figure 2b), an oxidizing effect in the cytosol and mitochondrial compartments was observed after exposure to either plasma or H2O2 (Figure 2c,d). This effect was abrogated with the addition of NAC prior to treatment with plasma or H2O2. It was observed that the cells’ autofluorescence was changed when incubating them with NAC (even when left untreated) so that for all quantifications, the samples were normalized on their respective condition control with or without NAC. Subsequently, the influence of NAC on the metabolic activity of plasma-treated THP-1 cells and primary monocytes was investigated. Validating the hypothesis that the decrease in metabolic activity is due to the activity of ROS, only a modest reduction in metabolism of the cells that had received NAC and plasma treatment was observed (Supplementary Figure S1a,c). As observed before in THP-1 monocytes, primary cells stimulated with PMA showed a much lower decrease in metabolic activity after plasma treatment when compared to cells without PMA (Supplementary Figure S1c). Interestingly, the primary cells behaved differently compared to their THP-1 counterpart, because even short treatment times of 10 s led to a strong decrease in metabolic activity.
3.3. Plasma Treatment Induced Morphological Changes in THP-1 Monocytes
The next step was to see whether one of the treatment regimens was able to induce differentiation. Upon differentiation into macrophages, monocytes flatten up onto the surface, becoming more irregularly shaped. This can be quantified by analyzing high content microscopy images (Figure 3a) that aids in identifying and segmenting the cells to assess their relative cell roundness score using computer algorithms. Upon PMA-treatment, monocytes changed their shape compared to non-PMA controls (Figure 3b). The roundness of cells exposed to plasma (120 s) decreased as well to similar levels to that of PMA at day 2 and 4 post treatment (Figure 3b). Naïve but not PMA-stimulated THP-1 monocytes tend to aggregate in prolonged culture when left undisturbed. Interestingly, plasma treatment reverted this feature in naïve cells (Figure 3c). These results suggest a similar phenotypic behavior of plasma-treated naïve THP-1 monocytes compared to those stimulated chemically with PMA to induce monocyte-to-macrophage differentiation.
3.4. Plasma Treatment Altered Surface Marker Expression in THP-1 Cells and Primary Monocytes
To characterize the cellular phenotype induced with plasma treatment in more detail, the authors screened the membrane expression levels of 14 different surface cell markers and the release of 13 different molecules into the cell culture supernatant. The data summary of changes in the surface marker expression in THP-1 monocytes is given in the form of a heat-map (Figure 4a). The fold change compared to the untreated control samples is shown. As expected, striking changes were found for PMA versus naïve cells, for example, a prominent increase in CD11b, CD11c, CD45RA, CD55, CD63, and CD69 as well as a decrease in CD49d expression. In PMA-pulsed cells, especially CD11b, CD55, CD63, and CD69 were significantly modulated with plasma treatment. In non-stimulated (naïve) cells, 120 s of plasma treatment gave a significant increase in CD11c as well as CD55, CD271, and HLA-ABC (Figure 4b–g). Membrane CD55 (Figure 4b) is upregulated through plasma exposure to a level close to the PMA-stimulated group (Figure 4e), while CD271 expression (Figure 4c) even exceeded that with PMA-stimulated samples (Figure 4f). The increase of HLA-ABC (Figure 4d) was generally modest but significant, also in PMA-treated cells (Figure 4g). In primary monocytes, a subset of markers partially different from THP-1 monocytes is described in the literature to monitor activity. Plasma treatment of naïve cells did not significantly increase (as in THP-1 cells) but decreased expression levels of CD11c at day 4 (Figure 4h). While levels of CD11b and CD206 were unchanged, a treatment time-dependent and significant increase of CD80 and CD163 was observed. The addition of NAC was demotivated by its ability to change metabolic activity and surface marker profiles of primary monocytes (Supplementary Figure S1c–h).
3.5. Plasma Treatment Altered Cytokine and Gene Expression Profile in THP-1 Monocytes
Monocyte-to-macrophage differentiation comes with an altered secretory and transcription profile. Accordingly, levels of 13 different cytokines in supernatants of THP-1 monocyte samples (Figure 5a). IFNα, IFNγ, IL12p70, IL17A, IL23, and IL33 were not detectable in any condition of our experimental setup (data not shown), while PMA led up to 100-fold increase in cytokine production. Plasma-treated, naïve THP-1 cells showed a significant increase for IL8 and MCP-1. Plasma-treated, PMA-stimulated THP-1 cells showed a significant increase for IL1β, IL6, and IL8. Moreover, both HLA-DR (an M1 macrophage marker) and fibronectin (and M2 macrophage marker) were upregulated with plasma treatment but not H2O2 in a ROS-dependent fashion (Figure 5b,c).
3.6. Plasma Treatment Increased Tumor-Toxic Activity in THP-1 Monocytes
Four days after plasma treatment of THP-1 cells, fluorescently labeled human A375 melanoma cells were added, and an interaction was visible (Figure 6a). The quantification of DAPI+ (terminally dead) melanoma cells 8 h after the start of co-culture showed a significant increase in conditions with plasma-treated cells well over containing THP-1 monocytes that had not been plasma treated (Figure 6b). This was significant for non-PMA conditions.
4. Discussion
Monocytes and macrophages are important regulators of inflammation. As these cells are both a source and target of ROS, this study strived to investigate how a mixture of exogenous ROS—generated with a novel medical technology—affected inflammatory and phenotypic traits important for monocyte-to-macrophage differentiation.
Our data suggested that THP-1 monocytes showed cellular differentiation in response to cold physical plasma-derived ROS. This was reflected by the surface marker profile in response to plasma. CD55 was reported before to be important in the differentiation of myeloid cells [48]. The largest increase was seen with CD271 (p75 NGF receptor) that is frequently used as a stem cell marker [49,50,51,52] and a target in melanoma treatment [53]. It was previously found to be upregulated in primary monocytes/macrophages deprived of endogenously produced NGF after LPS stimulation [54]. Further, an increase of HLA-ABC was seen in plasma-treated THP-1. Upregulation of this molecule is associated with mature dendritic cells [55], mature macrophages [56], and monocyte-to-macrophage differentiation upon GM-CSF and IL4 stimuli [57] independent of the M1 or M2 phenotype [58]. This study also found CD11c, a marker for mature monocytes and macrophages [59,60], to be upregulated in plasma-treated THP-1 cells. Likewise, CD69 was identified as an activation marker in U-937 monocytes in response to LPS [61]. Using primary monocytes from healthy human donors, a specific pattern of ROS-modulated surface marker expression was found that differed from that of THP-1 monocytes. The origin of the THP-1 cell line, a commonly used model for immune modulation, is the blood of a patient with acute monozygotic leukemia [62]. Apart from major similarities, both cells have distinct characteristics. THP-1 cells are immortal, (in contrast to primary monocytes) highly proliferative, and have higher intrinsic phagocytic capacities [63]. Naturally, gene expression [63], surface markers [64], as well as the sensitivity towards LPS [65] and the associated cytokine response [66] varies between THP-1 cells and primary monocytes. These factors could be responsible for the slightly different ROS-induced differentiation patterns observed in both cell types, despite the fact that the treatment varied by a factor of 6 to 12, owing to the increased robustness of THP-1 cells towards ROS-induced cell death [67]. In primary monocytes, the authors observed an increase of CD80 being a stimulatory receptor for T cell activation [68] and CD163, a receptor for the hemoglobin-haptoglobin complex and M2 macrophage marker [68] with plasma treatment. The mannose receptor and M2 macrophage marker CD206 was not changed in plasma treated primary monocytes, partly arguing against such M2 phenotype upon ROS-induced differentiation. This view is supported by an increase in HLA-DR expression (an M1 macrophage marker) [69] in plasma-treated primary monocytes and counteracted by an increase of fibronectin (an M2 macrophage marker) [70]. Hence, plasma-derived ROS were able to induce monocyte-to-macrophage maturation but did not favor a specific phenotype in these cells.
Underlining the notion of ROS-induced differentiation, plasma treatment significantly spurred the release of inflammatory chemokines/cytokines (IL1β, IL6, IL8, and MCP1) [71,72,73] in both non-PMA and PMA-pulsed cells. MCP1 leads to migration and adhesion of THP-1 [74] and peripheral blood monocytes [75] as first step of their activation. MCP1 was also reported to alter THP-1 morphology by increasing the number of cells with elongated pseudopodia [76]. In our experiments, some cells were spreading pseudopodia essential for realizing their phagocytic function in the tissue microenvironment [77]. The authors also identified other phenotypic changes in response to plasma treatment such as decreasing cell roundness as typical features of monocyte activation [78]. Another observation was made in detecting the cellular cluster area, which was reduced via PMA or plasma. Peritoneal macrophages are able to adhere and cluster via the chemokine-receptor system CCL1/CCR8 [79], and this system is mainly utilized by cells of the M2 phenotype [80], pointing to a rather pro-inflammatory ROS-induced phenotype.
Plasma treatment led to intracellular oxidation in the cytosol and mitochondria. This corroborates previous findings with leucocyte populations and other cell types [81,82,83]. Oxidation of the cytosolic compartments seemed greater than mitochondrial oxidation. This could be due to intrinsic properties of the dyes or the cells’ own antioxidant defense system scavenging ROS/RNS on their way through the cell to the mitochondria. NAC is known to act as a radical scavenger [84,85] and has successfully abolished the oxidative effects of plasma treatment. However, other studies showed that NAC boosts the effect of anti-inflammatory drugs and leads to decreased monocytes activation via suppression of the formation of arachidonic acids [86]. This and its interference with cellular metabolism and surface marker expression demotivated its long-term use in our experiments. H2O2 metabolism (likely to be altered with NAC and changes in thiol-groups of redox proteins) is important for monocyte maturation into macrophages [87]. A change of redox-protein expression was previously described in THP-1 monocytes also in response to plasma [88].
ROS-stimulated THP-1 cells exerted stronger toxic effects in tumor cells compared to non-stimulated THP-1 cells. A similar finding was made with RAW264.7 macrophages with plasma treatment and was linked to TNFα release [89], which was not the case in our study, as TNFα was not found in supernatants of non-PMA-treated THP-1 cells at day 4. The tumor-toxicity of murine macrophages was previously shown to be independent of nitric oxide [90], suggesting a low contribution of inducible nitric oxide synthase in killing. Although the NLRP3 inflammasome—also active in THP-1 monocytes after recognition of damage-associated molecular patterns [91]—was suggested to be important in the antitumor myeloid and immune responses [92], this was probably not the case with our results as no secretion of IL1β and IL18 was found in tumor toxic culture conditions (with plasma, without PMA).
A potential caveat of our study is that the authors did not directly compare the effect of H2O2 to plasma-derived oxidants on long-term activating effects in monocytes. However, this was done in previous studies. Bundscherer and colleagues have shown that longer plasma treatment times, but not a concentration-matched amount of H2O2, induces ERK-phosphorylation in primary monocytes [93]. Plasma-mediated ERK-phosphorylation was also found in THP-1 cells [94]. However, in both primary cells and the cell line, this was only true for long plasma treatment times, coming with significant caspase 3 activation and JNK phosphorylation, and hence cell death. In addition, observations were made within 24 h and not 96 h, as in our study. Moreover, the authors utilized much milder conditions and a different setup (cells in 96-well plate and lower feed-gas flux of the plasma jet).
Altogether, our findings conclude that plasma-derived ROS shape a differentiation profile in THP-1 monocytes. In plasma treated tumor tissue, this could potentially lead to a more inflammatory, pro-immunogenic myeloid phenotype among monocytes that may render the tumor microenvironment in favor of the patient.
5. Conclusions
Reactive species are important in pathophysiological conditions and the physiology of myeloid cells. Monocytes and monocyte-derived macrophages play a significant role in a wide spectrum of disease and in cancer. Using cold physical plasma as a tool to generate various reactive oxygen and nitrogen species simultaneously, this study identified phenotypic alterations and an increased inflammatory profile in human THP-1 and primary monocytes. The observed changes in maturational surface markers, cytokine response, and tumor cell demise upon co-culture with monocytes help to refine our understanding of the monocytes physiology in response to oxidative therapies such as physical plasma treatment. Altogether, these findings grant exogenous ROS functional consequences in the activation of myeloid cells that may affect their differentiation phenotype and, hence the disease outcome.
Supplementary Materials
The following are available online at https://www.mdpi.com/2076-3417/9/12/2530/s1. Figure S1. Supplementary information regarding 12-marker flow analysis and plasma effect modulation through antioxidant N-acetylcysteine (NAC). (a) Metabolic activity of untreated, or 20 s or 120 s plasma-treated THP-1 cells incubated with n-acetylcysteine (NAC) or PMA 4 h after initial treatment. (b) Compensation matrix with % substraction of intensity values for FL1 (λ = 520/540-488 nm; FITC), FL2 (λ = 690/650-488 nm; PerCP-Cy5.5v), FL3 (λ = 660/620-638 nm; APC), FL4 (λ = 712/725-638 nm; AF700), FL5 (λ = 780/780-638 nm; APC-Cy7), FL6 (λ = 450/445-405 nm; Pacific Blue), FL7 (λ = 525/540-405 nm; BV510), FL9 (λ = 660/620-405 nm; BV650), FL10 (λ = 585/542-561 nm; PE), FL11 (λ = 610/620-561 nm; PE-Dazzle), FL12 (λ = 690/50-561 nm; PE-Cy5) and FL13 (λ = 780/60-561 nm; PE-Cy7). (c) The metabolic activity of untreated, or 10 s or 20 s plasma-treated primary monocytes incubated with NAC or PMA 4 h after treatment. (d–h) The modulation of the expression of (d) CD11b, (e) CD11c, (f) CD80, (g) CD163 and (h) CD206 in primary monocytes incubated with or without NAC. The data (a,c) are representatives out of three independent experiments and are displayed as the mean + SEM, (d–h) are individual values and the mean (red line) of duplicates measured in three independent experiments. Seconds (s) indicate plasma treatment time, ctrl = control.
Author Contributions
S.B. designed the experiment; J.M. and E.F. carried out experiments; M.S. and C.S. contributed specific assays and reagents; S.B. and E.F. wrote the manuscript; all authors reviewed the manuscript.
Funding
Funding was received by the German Federal Ministry of Education and Research (BMBF; grant number 03Z22DN11).
Acknowledgments
The authors gratefully acknowledge technical support of Can Pascal Wulf, Kan-Kau Chow, and Felix Niessner.
Conflicts of Interest
The authors declare no conflicts of interest.
References
- Van Berckelaer, C.; Rypens, C.; Van Dam, P.; Pouillon, L.; Parizel, M.; Schats, K.; Kockx, M.; Tjalma, W.; Vermeulen, P.; van Laere, S. Infiltrating stromal immune cells in inflammatory breast cancer are associated with an improved outcome and increased PD-L1 expression. Breast Cancer Res. 2019, 21, 28. [Google Scholar] [CrossRef] [PubMed]
- Leivonen, S.-K.; Pollari, M.; Brück, O.; Pellinen, T.; Autio, M.; Karjalainen-Lindsberg, M.-L.; Mannisto, S.; Kellokumpu-Lehtinen, P.-L.; Kallioniemi, O.; Mustjoki, S. T-cell inflamed tumor microenvironment predicts favorable prognosis in primary testicular lymphoma. Haematologica 2019, 104, 338–346. [Google Scholar] [CrossRef] [PubMed]
- Geissmann, F.; Manz, M.G.; Jung, S.; Sieweke, M.H.; Merad, M.; Ley, K. Development of monocytes, macrophages, and dendritic cells. Science 2010, 327, 656–661. [Google Scholar] [CrossRef] [PubMed]
- Parihar, A.; Eubank, T.D.; Doseff, A.I. Monocytes and macrophages regulate immunity through dynamic networks of survival and cell death. J. Innate Immun. 2010, 2, 204–215. [Google Scholar] [CrossRef] [PubMed]
- Fujiwara, N.; Kobayashi, K. Macrophages in inflammation. Curr. Drug Targets Inflamm. Allergy 2005, 4, 281–286. [Google Scholar] [CrossRef] [PubMed]
- Coussens, L.M.; Werb, Z. Inflammation and cancer. Nature 2002, 420, 860–867. [Google Scholar] [CrossRef] [PubMed]
- Caso, R.; Miller, G. Role of tumor associated macrophages in regulating pancreatic cancer progression. World J. Immunol. 2016, 6. [Google Scholar] [CrossRef]
- Mantovani, A.; Schioppa, T.; Porta, C.; Allavena, P.; Sica, A. Role of tumor-associated macrophages in tumor progression and invasion. Cancer Metastasis Rev. 2006, 25, 315–322. [Google Scholar] [CrossRef]
- Pollard, J.W. Tumour-educated macrophages promote tumour progression and metastasis. Nat. Rev. Cancer 2004, 4, 71. [Google Scholar] [CrossRef]
- Menen, R.S.; Hassanein, M.K.; Momiyama, M.; Suetsugu, A.; Moossa, A.R.; Hoffman, R.M.; Bouvet, M. Tumor-educated macrophages promote tumor growth and peritoneal metastasis in an orthotopic nude mouse model of human pancreatic cancer. In Vivo 2012, 26, 565–569. [Google Scholar]
- Baj-Krzyworzeka, M.; Mytar, B.; Szatanek, R.; Surmiak, M.; Weglarczyk, K.; Baran, J.; Siedlar, M. Colorectal cancer-derived microvesicles modulate differentiation of human monocytes to macrophages. J. Transl. Med. 2016, 14, 36. [Google Scholar] [CrossRef] [PubMed]
- Allavena, P.; Garlanda, C.; Borrello, M.G.; Sica, A.; Mantovani, A. Pathways connecting inflammation and cancer. Curr. Opin. Genet. Dev. 2008, 18, 3–10. [Google Scholar] [CrossRef] [PubMed]
- Brown, B.N.; Ratner, B.D.; Goodman, S.B.; Amar, S.; Badylak, S.F. Macrophage polarization: An opportunity for improved outcomes in biomaterials and regenerative medicine. Biomaterials 2012, 33, 3792–3802. [Google Scholar] [CrossRef] [PubMed] [Green Version]
- Mantovani, A.; Marchesi, F.; Malesci, A.; Laghi, L.; Allavena, P. Tumour-associated macrophages as treatment targets in oncology. Nat. Rev. Clin. Oncol. 2017, 14, 399–416. [Google Scholar] [CrossRef] [PubMed]
- Cassetta, L.; Kitamura, T. Macrophage targeting: Opening new possibilities for cancer immunotherapy. Immunology 2018, 155, 285–293. [Google Scholar] [CrossRef]
- Sevenich, L. Turning ‘cold’ into ‘hot’ tumors—Opportunities and challenges for radio-immunotherapy against primary and metastatic brain cancers. Front. Oncol. 2019, 9, 163. [Google Scholar] [CrossRef] [PubMed]
- Binnewies, M.; Roberts, E.W.; Kersten, K.; Chan, V.; Fearon, D.F.; Merad, M.; Coussens, L.M.; Gabrilovich, D.I.; Ostrand-Rosenberg, S.; Hedrick, C.C.; et al. Understanding the tumor immune microenvironment (time) for effective therapy. Nat. Med. 2018, 24, 541–550. [Google Scholar] [CrossRef]
- Covarrubias, A.; Byles, V.; Horng, T. Ros sets the stage for macrophage differentiation. Cell Res. 2013, 23, 984–985. [Google Scholar] [CrossRef]
- Laskin, D.L.; Sunil, V.R.; Gardner, C.R.; Laskin, J.D. Macrophages and tissue injury: Agents of defense or destruction? Annu. Rev. Pharmacol. Toxicol. 2011, 51, 267–288. [Google Scholar] [CrossRef]
- Albina, J.E.; Henry, W.L., Jr.; Mastrofrancesco, B.; Martin, B.A.; Reichner, J.S. Macrophage activation by culture in an anoxic environment. J. Immunol. 1995, 155, 4391–4396. [Google Scholar]
- Brune, B.; Dehne, N.; Grossmann, N.; Jung, M.; Namgaladze, D.; Schmid, T.; von Knethen, A.; Weigert, A. Redox control of inflammation in macrophages. Antioxid. Redox Signal. 2013, 19, 595–637. [Google Scholar] [CrossRef] [PubMed]
- Mantovani, A.; Sica, A.; Sozzani, S.; Allavena, P.; Vecchi, A.; Locati, M. The chemokine system in diverse forms of macrophage activation and polarization. Trends Immunol. 2004, 25, 677–686. [Google Scholar] [CrossRef] [PubMed]
- Winterbourn, C.C. Reconciling the chemistry and biology of reactive oxygen species. Nat. Chem. Biol. 2008, 4, 278–286. [Google Scholar] [CrossRef] [PubMed]
- Kansanen, E.; Jyrkkanen, H.K.; Levonen, A.L. Activation of stress signaling pathways by electrophilic oxidized and nitrated lipids. Free Radic. Biol. Med. 2012, 52, 973–982. [Google Scholar] [CrossRef] [PubMed]
- Li, X.; Chen, Y.; Zhao, J.; Shi, J.; Wang, M.; Qiu, S.; Hu, Y.; Xu, Y.; Cui, Y.; Liu, C. The specific inhibition of sod1 selectively promotes apoptosis of cancer cells via regulation of the ros signaling network. Oxid. Med. Cell. Longev. 2019, 2019. [Google Scholar] [CrossRef] [PubMed]
- Weltmann, K.D.; von Woedtke, T. Plasma medicine—Current state of research and medical application. Plasma Phys. Control. Fusion 2017, 59, 014031. [Google Scholar] [CrossRef]
- Arjunan, K.P.; Clyne, A.M. A nitric oxide producing pin-to-hole spark discharge plasma enhances endothelial cell proliferation and migration. Plasma Med. 2011, 1, 279–293. [Google Scholar] [CrossRef]
- Uchiyama, H.; Zhao, Q.L.; Hassan, M.A.; Andocs, G.; Nojima, N.; Takeda, K.; Ishikawa, K.; Hori, M.; Kondo, T. Epr-spin trapping and flow cytometric studies of free radicals generated using cold atmospheric argon plasma and x-ray irradiation in aqueous solutions and intracellular milieu. PLoS ONE 2015, 10, e0136956. [Google Scholar] [CrossRef]
- Sousa, J.S.; Niemi, K.; Cox, L.J.; Algwari, Q.T.; Gans, T.; O’Connell, D. Cold atmospheric pressure plasma jets as sources of singlet delta oxygen for biomedical applications. J. Appl. Phys. 2011, 109, 123302. [Google Scholar] [CrossRef] [Green Version]
- Bekeschus, S.; Schmidt, A.; Weltmann, K.-D.; von Woedtke, T. The plasma jet kinpen—A powerful tool for wound healing. Clin. Plasma Med. 2016, 4, 19–28. [Google Scholar] [CrossRef]
- Yu, Y.; Tan, M.; Chen, H.; Wu, Z.; Xu, L.; Li, J.; Cao, J.; Yang, Y.; Xiao, X.; Lian, X.; et al. Non-thermal plasma suppresses bacterial colonization on skin wound and promotes wound healing in mice. J. Huazhong Univ. Sci. Technol. Med. Sci. 2011, 31, 390–394. [Google Scholar] [CrossRef] [PubMed]
- Schmidt, A.; Bekeschus, S.; Wende, K.; Vollmar, B.; von Woedtke, T. A cold plasma jet accelerates wound healing in a murine model of full-thickness skin wounds. Exp. Dermatol. 2017, 26, 156–162. [Google Scholar] [CrossRef] [PubMed]
- Ngo Thi, M.-H.; Shao, P.-L.; Liao, J.-D.; Lin, C.-C.K.; Yip, H.-K. Enhancement of angiogenesis and epithelialization processes in mice with burn wounds through ros/rns signals generated by non-thermal n2/ar micro-plasma. Plasma Process. Polym. 2014, 11, 1076–1088. [Google Scholar] [CrossRef]
- Hartwig, S.; Doll, C.; Voss, J.O.; Hertel, M.; Preissner, S.; Raguse, J.D. Treatment of wound healing disorders of radial forearm free flap donor sites using cold atmospheric plasma: A proof of concept. J. Oral Maxillofac. Surg. 2017, 75, 429–435. [Google Scholar] [CrossRef] [PubMed]
- Isbary, G.; Heinlin, J.; Shimizu, T.; Zimmermann, J.L.; Morfill, G.; Schmidt, H.U.; Monetti, R.; Steffes, B.; Bunk, W.; Li, Y.; et al. Successful and safe use of 2 min cold atmospheric argon plasma in chronic wounds: Results of a randomized controlled trial. Br. J. Dermatol. 2012, 167, 404–410. [Google Scholar] [CrossRef] [PubMed]
- Brehmer, F.; Haenssle, H.A.; Daeschlein, G.; Ahmed, R.; Pfeiffer, S.; Gorlitz, A.; Simon, D.; Schon, M.P.; Wandke, D.; Emmert, S. Alleviation of chronic venous leg ulcers with a hand-held dielectric barrier discharge plasma generator (plasmaderm((r)) vu-2010): Results of a monocentric, two-armed, open, prospective, randomized and controlled trial (nct01415622). J. Eur. Acad. Dermatol. Venereol. 2015, 29, 148–155. [Google Scholar] [CrossRef] [PubMed]
- Brulle, L.; Vandamme, M.; Ries, D.; Martel, E.; Robert, E.; Lerondel, S.; Trichet, V.; Richard, S.; Pouvesle, J.M.; Le Pape, A. Effects of a non thermal plasma treatment alone or in combination with gemcitabine in a mia paca2-luc orthotopic pancreatic carcinoma model. PLoS ONE 2012, 7, e52653. [Google Scholar] [CrossRef]
- Daeschlein, G.; Scholz, S.; Lutze, S.; Arnold, A.; von Podewils, S.; Kiefer, T.; Tueting, T.; Hardt, O.; Haase, H.; Grisk, O.; et al. Comparison between cold plasma, electrochemotherapy and combined therapy in a melanoma mouse model. Exp. Dermatol. 2013, 22, 582–586. [Google Scholar] [CrossRef]
- Lupu, A.R.; Georgescu, N.; Calugaru, A.; Cremer, L.; Szegli, G.; Kerek, F. The effects of cold atmospheric plasma jets on b16 and colo320 tumoral cells. Roum. Arch. Microbiol. Immunol. 2009, 68, 136–144. [Google Scholar]
- Utsumi, F.; Kajiyama, H.; Nakamura, K.; Tanaka, H.; Mizuno, M.; Ishikawa, K.; Kondo, H.; Kano, H.; Hori, M.; Kikkawa, F. Effect of indirect nonequilibrium atmospheric pressure plasma on anti-proliferative activity against chronic chemo-resistant ovarian cancer cells in vitro and in vivo. PLoS ONE 2013, 8, e81576. [Google Scholar] [CrossRef]
- Yajima, I.; Iida, M.; Kumasaka, M.Y.; Omata, Y.; Ohgami, N.; Chang, J.; Ichihara, S.; Hori, M.; Kato, M. Non-equilibrium atmospheric pressure plasmas modulate cell cycle-related gene expressions in melanocytic tumors of ret-transgenic mice. Exp. Dermatol. 2014, 23, 424–425. [Google Scholar] [CrossRef] [PubMed]
- Metelmann, H.-R.; Seebauer, C.; Miller, V.; Fridman, A.; Bauer, G.; Graves, D.B.; Pouvesle, J.-M.; Rutkowski, R.; Schuster, M.; Bekeschus, S.; et al. Clinical experience with cold plasma in the treatment of locally advanced head and neck cancer. Clin. Plasma Med. 2018, 9, 6–13. [Google Scholar] [CrossRef]
- Daigneault, M.; Preston, J.A.; Marriott, H.M.; Whyte, M.K.; Dockrell, D.H. The identification of markers of macrophage differentiation in pma-stimulated THP-1 cells and monocyte-derived macrophages. PLoS ONE 2010, 5, e8668. [Google Scholar] [CrossRef] [PubMed]
- Reuter, S.; von Woedtke, T.; Weltmann, K.-D. The kinpen—A review on physics and chemistry of the atmospheric pressure plasma jet and its applications. J. Phys. D Appl. Phys. 2018, 51. [Google Scholar] [CrossRef]
- Wende, K.; Bekeschus, S.; Schmidt, A.; Jatsch, L.; Hasse, S.; Weltmann, K.D.; Masur, K.; von Woedtke, T. Risk assessment of a cold argon plasma jet in respect to its mutagenicity. Mutat. Res. Genet. Toxicol. Environ. Mutagen. 2016, 798–799, 48–54. [Google Scholar] [CrossRef] [PubMed]
- Kluge, S.; Bekeschus, S.; Bender, C.; Benkhai, H.; Sckell, A.; Below, H.; Stope, M.B.; Kramer, A. Investigating the mutagenicity of a cold argon-plasma jet in an het-mn model. PLoS ONE 2016, 11, e0160667. [Google Scholar] [CrossRef]
- Schmidt, A.; Woedtke, T.V.; Stenzel, J.; Lindner, T.; Polei, S.; Vollmar, B.; Bekeschus, S. One year follow-up risk assessment in skh-1 mice and wounds treated with an argon plasma jet. Int. J. Mol. Sci. 2017, 18, 868. [Google Scholar] [CrossRef]
- Terstappen, L.W.; Nguyen, M.; Lazarus, H.M.; Medof, M.E. Expression of the DAF (CD55) and CD59 antigens during normal hematopoietic cell differentiation. J. Leukoc. Biol. 1992, 52, 652–660. [Google Scholar] [CrossRef]
- Das, B.; Kashino, S.S.; Pulu, I.; Kalita, D.; Swami, V.; Yeger, H.; Felsher, D.W.; Campos-Neto, A. CD271+ bone marrow mesenchymal stem cells may provide a niche for dormant mycobacterium tuberculosis. Sci. Transl. Med. 2013, 5, 170ra113. [Google Scholar] [CrossRef]
- Battula, V.L.; Le, P.M.; Sun, J.C.; Nguyen, K.; Yuan, B.; Zhou, X.; Sonnylal, S.; McQueen, T.; Ruvolo, V.; Michel, K.A.; et al. Aml-induced osteogenic differentiation in mesenchymal stromal cells supports leukemia growth. JCI Insight 2017, 2. [Google Scholar] [CrossRef]
- Naglah, A.M.; Shinwari, Z.; Bhat, M.A.; Al-Tahhan, M.; Al-Omar, M.A.; Al-Dhfyan, A. Targeting leukemic side population cells by isatin derivatives of nicotinic acid amide. J. Biol. Regul. Homeost. Agents 2016, 30, 353–363. [Google Scholar] [PubMed]
- Huang, S.D.; Yuan, Y.; Tang, H.; Liu, X.H.; Fu, C.G.; Cheng, H.Z.; Bi, J.W.; Yu, Y.W.; Gong, D.J.; Zhang, W.; et al. Tumor cells positive and negative for the common cancer stem cell markers are capable of initiating tumor growth and generating both progenies. PLoS ONE 2013, 8, e54579. [Google Scholar] [CrossRef] [PubMed]
- Ngo, M.; Han, A.; Lakatos, A.; Sahoo, D.; Hachey, S.J.; Weiskopf, K.; Beck, A.H.; Weissman, I.L.; Boiko, A.D. Antibody therapy targeting cd47 and cd271 effectively suppresses melanoma metastasis in patient-derived xenografts. Cell Rep. 2016, 16, 1701–1716. [Google Scholar] [CrossRef] [PubMed]
- Caroleo, M.C.; Costa, N.; Bracci-Laudiero, L.; Aloe, L. Human monocyte/macrophages activate by exposure to lps overexpress ngf and ngf receptors. J. Neuroimmunol. 2001, 113, 193–201. [Google Scholar] [CrossRef]
- Czernek, L.; Chworos, A.; Duechler, M. The uptake of extracellular vesicles is affected by the differentiation status of myeloid cells. Scand. J. Immunol. 2015, 82, 506–514. [Google Scholar] [CrossRef] [PubMed]
- Mitani, H.; Katayama, N.; Araki, H.; Ohishi, K.; Kobayashi, K.; Suzuki, H.; Nishii, K.; Masuya, M.; Yasukawa, K.; Minami, N.; et al. Activity of interleukin 6 in the differentiation of monocytes to macrophages and dendritic cells. Br. J. Haematol. 2000, 109, 288–295. [Google Scholar] [CrossRef]
- Woltman, A.M. Rapamycin induces apoptosis in monocyte- and cd34-derived dendritic cells but not in monocytes and macrophages. Blood 2001, 98, 174–180. [Google Scholar] [CrossRef]
- Rey-Giraud, F.; Hafner, M.; Ries, C.H. In vitro generation of monocyte-derived macrophages under serum-free conditions improves their tumor promoting functions. PLoS ONE 2012, 7, e42656. [Google Scholar] [CrossRef]
- Lu, R.; Pitha, P.M. Monocyte differentiation to macrophage requires interferon regulatory factor 7. J. Biol. Chem. 2001, 276, 45491–45496. [Google Scholar] [CrossRef]
- Riddy, D.M.; Goy, E.; Delerive, P.; Summers, R.J.; Sexton, P.M.; Langmead, C.J. Comparative genotypic and phenotypic analysis of human peripheral blood monocytes and surrogate monocyte-like cell lines commonly used in metabolic disease research. PLoS ONE 2018, 13, e0197177. [Google Scholar] [CrossRef]
- Baek, Y.S.; Haas, S.; Hackstein, H.; Bein, G.; Hernandez-Santana, M.; Lehrach, H.; Sauer, S.; Seitz, H. Identification of novel transcriptional regulators involved in macrophage differentiation and activation in u937 cells. BMC Immunol. 2009, 10, 18. [Google Scholar] [CrossRef] [PubMed]
- Tsuchiya, S.; Yamabe, M.; Yamaguchi, Y.; Kobayashi, Y.; Konno, T.; Tada, K. Establishment and characterization of a human acute monocytic leukemia cell line (THP-1). Int. J. Cancer 1980, 26, 171–176. [Google Scholar] [CrossRef] [PubMed]
- Chanput, W.; Mes, J.J.; Wichers, H.J. THP-1 cell line: An in vitro cell model for immune modulation approach. Int. Immunopharmacol. 2014, 23, 37–45. [Google Scholar] [CrossRef] [PubMed]
- Sakamoto, H.; Aikawa, M.; Hill, C.C.; Weiss, D.; Taylor, W.R.; Libby, P.; Lee, R.T. Biomechanical strain induces class a scavenger receptor expression in human monocyte/macrophages and THP-1 cells. Circulation 2001, 104, 109–114. [Google Scholar] [CrossRef] [PubMed]
- Park, E.K.; Jung, H.S.; Yang, H.I.; Yoo, M.C.; Kim, C.; Kim, K.S. Optimized THP-1 differentiation is required for the detection of responses to weak stimuli. Inflamm. Res. 2007, 56, 45–50. [Google Scholar] [CrossRef] [PubMed]
- Schildberger, A.; Rossmanith, E.; Eichhorn, T.; Strassl, K.; Weber, V. Monocytes, peripheral blood mononuclear cells, and THP-1 cells exhibit different cytokine expression patterns following stimulation with lipopolysaccharide. Mediat. Inflamm. 2013, 2013, 697972. [Google Scholar] [CrossRef] [PubMed]
- Bundscherer, L.; Bekeschus, S.; Tresp, H.; Hasse, S.; Reuter, S.; Weltmann, K.-D.; Lindequist, U.; Masur, K. Viability of human blood leukocytes compared with their respective cell lines after plasma treatment. Plasma Med. 2013, 3, 71–80. [Google Scholar] [CrossRef]
- Costantini, A.; Viola, N.; Berretta, A.; Galeazzi, R.; Matacchione, G.; Sabbatinelli, J.; Storci, G.; De Matteis, S.; Butini, L.; Rippo, M.R. Age-related m1/m2 phenotype changes in circulating monocytes from healthy/unhealthy individuals. Inflammation 2018, 14, 15. [Google Scholar] [CrossRef] [PubMed]
- Becker, S. Interferons as modulators of human monocyte-macrophage differentiation. I. Interferon-gamma increases hla-dr expression and inhibits phagocytosis of zymosan. J. Immunol. 1984, 132, 1249–1254. [Google Scholar] [PubMed]
- Gratchev, A.; Guillot, P.; Hakiy, N.; Politz, O.; Orfanos, C.E.; Schledzewski, K.; Goerdt, S. Alternatively activated macrophages differentially express fibronectin and its splice variants and the extracellular matrix protein betaig-h3. Scand. J. Immunol. 2001, 53, 386–392. [Google Scholar] [CrossRef]
- Jovanovic, D.V.; Di Battista, J.A.; Martel-Pelletier, J.; Jolicoeur, F.C.; He, Y.; Zhang, M.; Mineau, F.; Pelletier, J.P. Il-17 stimulates the production and expression of proinflammatory cytokines, il-beta and tnf-alpha, by human macrophages. J. Immunol. 1998, 160, 3513–3521. [Google Scholar] [PubMed]
- Lin, W.W.; Karin, M. A cytokine-mediated link between innate immunity, inflammation, and cancer. J. Clin. Investig. 2007, 117, 1175–1183. [Google Scholar] [CrossRef] [PubMed]
- Dinarello, C.A. Il-18: A th1-inducing, proinflammatory cytokine and new member of the il-1 family. J. Allergy Clin. Immunol. 1999, 103, 11–24. [Google Scholar] [CrossRef]
- Chuang, S.Y.; Yang, S.H.; Pang, J.H. Cilostazol reduces MCP-1-induced chemotaxis and adhesion of THP-1 monocytes by inhibiting CCR2 gene expression. Biochem. Biophys. Res. Commun. 2011, 411, 402–408. [Google Scholar] [CrossRef] [PubMed]
- Green, S.R.; Han, K.H.; Chen, Y.; Almazan, F.; Charo, I.F.; Miller, Y.I.; Quehenberger, O. The CC chemokine MCP-1 stimulates surface expression of CX3CR1 and enhances the adhesion of monocytes to fractalkine/CX3CL1 via p38 MAPK. J. Immunol. 2006, 176, 7412–7420. [Google Scholar] [CrossRef]
- Cross, A.K.; Richardson, V.; Ali, S.A.; Palmer, I.; Taub, D.D.; Rees, R.C. Migration responses of human monocytic cell lines to alpha- and beta-chemokines. Cytokine 1997, 9, 521–528. [Google Scholar] [CrossRef] [PubMed]
- Sutton, J.S.; Weiss, L. Transformation of monocytes in tissue culture into macrophages epithelioid cells and multinucleated giant cells: An electron microscope study. J. Cell Biol. 1966, 28, 303–332. [Google Scholar] [CrossRef] [PubMed]
- Tajima, K.; Akanuma, S.; Matsumoto-Akanuma, A.; Yamanaka, D.; Ishibashi, K.I.; Adachi, Y.; Ohno, N. Activation of macrophages by a laccase-polymerized polyphenol is dependent on phosphorylation of rac1. Biochem. Biophys. Res. Commun. 2018, 495, 2209–2213. [Google Scholar] [CrossRef]
- Reimer, M.K.; Brange, C.; Rosendahl, A. CCR8 signaling influences toll-like receptor 4 responses in human macrophages in inflammatory diseases. Clin. Vaccine Immunol. 2011, 18, 2050–2059. [Google Scholar] [CrossRef]
- Hoshino, A.; Kawamura, Y.I.; Yasuhara, M.; Toyama-Sorimachi, N.; Yamamoto, K.; Matsukawa, A.; Lira, S.A.; Dohi, T. Inhibition of CCL1-CCR8 interaction prevents aggregation of macrophages and development of peritoneal adhesions. J. Immunol. 2007, 178, 5296–5304. [Google Scholar] [CrossRef] [PubMed]
- Bekeschus, S.; Kolata, J.; Winterbourn, C.; Kramer, A.; Turner, R.; Weltmann, K.D.; Broker, B.; Masur, K. Hydrogen peroxide: A central player in physical plasma-induced oxidative stress in human blood cells. Free Radic. Res. 2014, 48, 542–549. [Google Scholar] [CrossRef] [PubMed]
- Schmidt, A.; von Woedtke, T.; Bekeschus, S. Periodic exposure of keratinocytes to cold physical plasma: An in vitro model for redox-related diseases of the skin. Oxid. Med. Cell. Longev. 2016, 2016, 9816072. [Google Scholar] [CrossRef]
- Wende, K.; Strassenburg, S.; Haertel, B.; Harms, M.; Holtz, S.; Barton, A.; Masur, K.; von Woedtke, T.; Lindequist, U. Atmospheric pressure plasma jet treatment evokes transient oxidative stress in hacat keratinocytes and influences cell physiology. Cell Biol. Int. 2014, 38, 412–425. [Google Scholar] [CrossRef] [PubMed]
- Aruoma, O.I.; Halliwell, B.; Hoey, B.M.; Butler, J. The antioxidant action of n-acetylcysteine: Its reaction with hydrogen peroxide, hydroxyl radical, superoxide, and hypochlorous acid. Free Radic. Biol. Med. 1989, 6, 593–597. [Google Scholar] [CrossRef]
- Ates, B.; Abraham, L.; Ercal, N. Antioxidant and free radical scavenging properties of n-acetylcysteine amide (NACA) and comparison with n-acetylcysteine (NAC). Free Radic. Res. 2008, 42, 372–377. [Google Scholar] [CrossRef] [PubMed]
- Hoffer, E.; Baum, Y.; Nahir, A.M. N-acetylcysteine enhances the action of anti-inflammatory drugs as suppressors of prostaglandin production in monocytes. Mediators Inflamm. 2002, 11, 321–323. [Google Scholar] [CrossRef] [PubMed]
- Nakagawara, A.; Nathan, C.F.; Cohn, Z.A. Hydrogen peroxide metabolism in human monocytes during differentiation in vitro. J. Clin. Investig. 1981, 68, 1243–1252. [Google Scholar] [CrossRef]
- Schmidt, A.; Rodder, K.; Hasse, S.; Masur, K.; Toups, L.; Lillig, C.H.; von Woedtke, T.; Wende, K.; Bekeschus, S. Redox-regulation of activator protein 1 family members in blood cancer cell lines exposed to cold physical plasma-treated medium. Plasma Process. Polym. 2016, 13, 1179–1188. [Google Scholar] [CrossRef]
- Kaushik, N.K.; Kaushik, N.; Min, B.; Choi, K.H.; Hong, Y.J.; Miller, V.; Fridman, A.; Choi, E.H. Cytotoxic macrophage-released tumour necrosis factor-alpha (TNF-alpha) as a killing mechanism for cancer cell death after cold plasma activation. J. Phys. D Appl. Phys. 2016, 49, 084001. [Google Scholar] [CrossRef]
- Bourassa, B.; Monaghan, S.; Rittling, S.R. Impaired anti-tumor cytotoxicity of macrophages from osteopontin-deficient mice. Cell. Immunol. 2004, 227, 1–11. [Google Scholar] [CrossRef]
- Rossol, M.; Pierer, M.; Raulien, N.; Quandt, D.; Meusch, U.; Rothe, K.; Schubert, K.; Schoneberg, T.; Schaefer, M.; Krugel, U.; et al. Extracellular Ca2+ is a danger signal activating the nlrp3 inflammasome through g protein-coupled calcium sensing receptors. Nat. Commun. 2012, 3, 1329. [Google Scholar] [CrossRef] [PubMed]
- Zitvogel, L.; Kepp, O.; Galluzzi, L.; Kroemer, G. Inflammasomes in carcinogenesis and anticancer immune responses. Nat. Immunol. 2012, 13, 343–351. [Google Scholar] [CrossRef] [PubMed]
- Bundscherer, L.; Nagel, S.; Hasse, S.; Tresp, H.; Wende, K.; Walther, R.; Reuter, S.; Weltmann, K.D.; Masur, K.; Lindequist, U. Non-thermal plasma treatment induces mapk signaling in human monocytes. Open Chem. 2015, 13, 606–613. [Google Scholar] [CrossRef]
- Bundscherer, L.; Wende, K.; Ottmuller, K.; Barton, A.; Schmidt, A.; Bekeschus, S.; Hasse, S.; Weltmann, K.D.; Masur, K.; Lindequist, U. Impact of non-thermal plasma treatment on mapk signaling pathways of human immune cell lines. Immunobiology 2013, 218, 1248–1255. [Google Scholar] [CrossRef] [PubMed]
Figure 1.
Exposure of THP-1 cells to physical plasma led to oxidation of cytosolic and mitochondrial compartment and altered their metabolic activity. (a) A schematic overview of standardized plasma treatment of a 96-well plate via a kINPen argon plasma-jet. (b) The concentration of hydrogen peroxide (H2O2) after plasma treatment of 100 µL RPMI medium with goodness of fit of a polynomial (quadratic) function. (c) The representative overlay histogram of DHR123-stained and 120 s plasma-treated or untreated THP-1 cells without PMA and (d) its quantification for 0 s, 20 s and 120 s treatment time (±PMA). (e) The representative overlay histogram of MTO-stained and 120 s plasma-treated or untreated THP-1 cells without PMA and (f) its quantification for 0 s, 20 s and 120 s treatment time (±PMA). (g) Metabolic activity 4–6 h post plasma treatment and (h) the count of viable (DAPI-) THP-1 cells in 1 mL volume, with their calculated mean metabolic activity per cell (blue data points and lines). The data (d and f) are presented as single data points (grey squares) of 4 replicates derived from six independent experiments, and their mean (black bars). The metabolic activity was determined in 8 independent experiments and is presented as (g) mean (bar graphs) + SD or (h) mean as black bar with replicates as blue boxes accompanied by the mean of activity per cell count (blue data points). The statistical analysis was performed using one-way anova with Dunnett post-testing to respective controls. Asterisks represent statistical comparison to control cells without PMA. The seconds (s) indicate plasma treatment time, ctrl = control.

Figure 2.
The validation of the oxidizing effect of plasma and H2O2 in primary monocytes. (a,b) The representative overlay histograms of monocytes stained with DHR-123 or MTO, which were treated with 20 s plasma or 70 µM hydrogen peroxide (H2O2) in the presence or absence of the antioxidant N-acetyl cysteine (NAC). The geometric mean of the histograms of untreated cells is indicated as black line. (c) Normalization of mean fluorescence intensity of DHR-123 and (d) Mitotracker Orange (MTO) stained cells. The data (c,d) are representatives out of two independent experiments and show the mean and SD. The seconds (s) indicate plasma treatment time, ctrl = control.
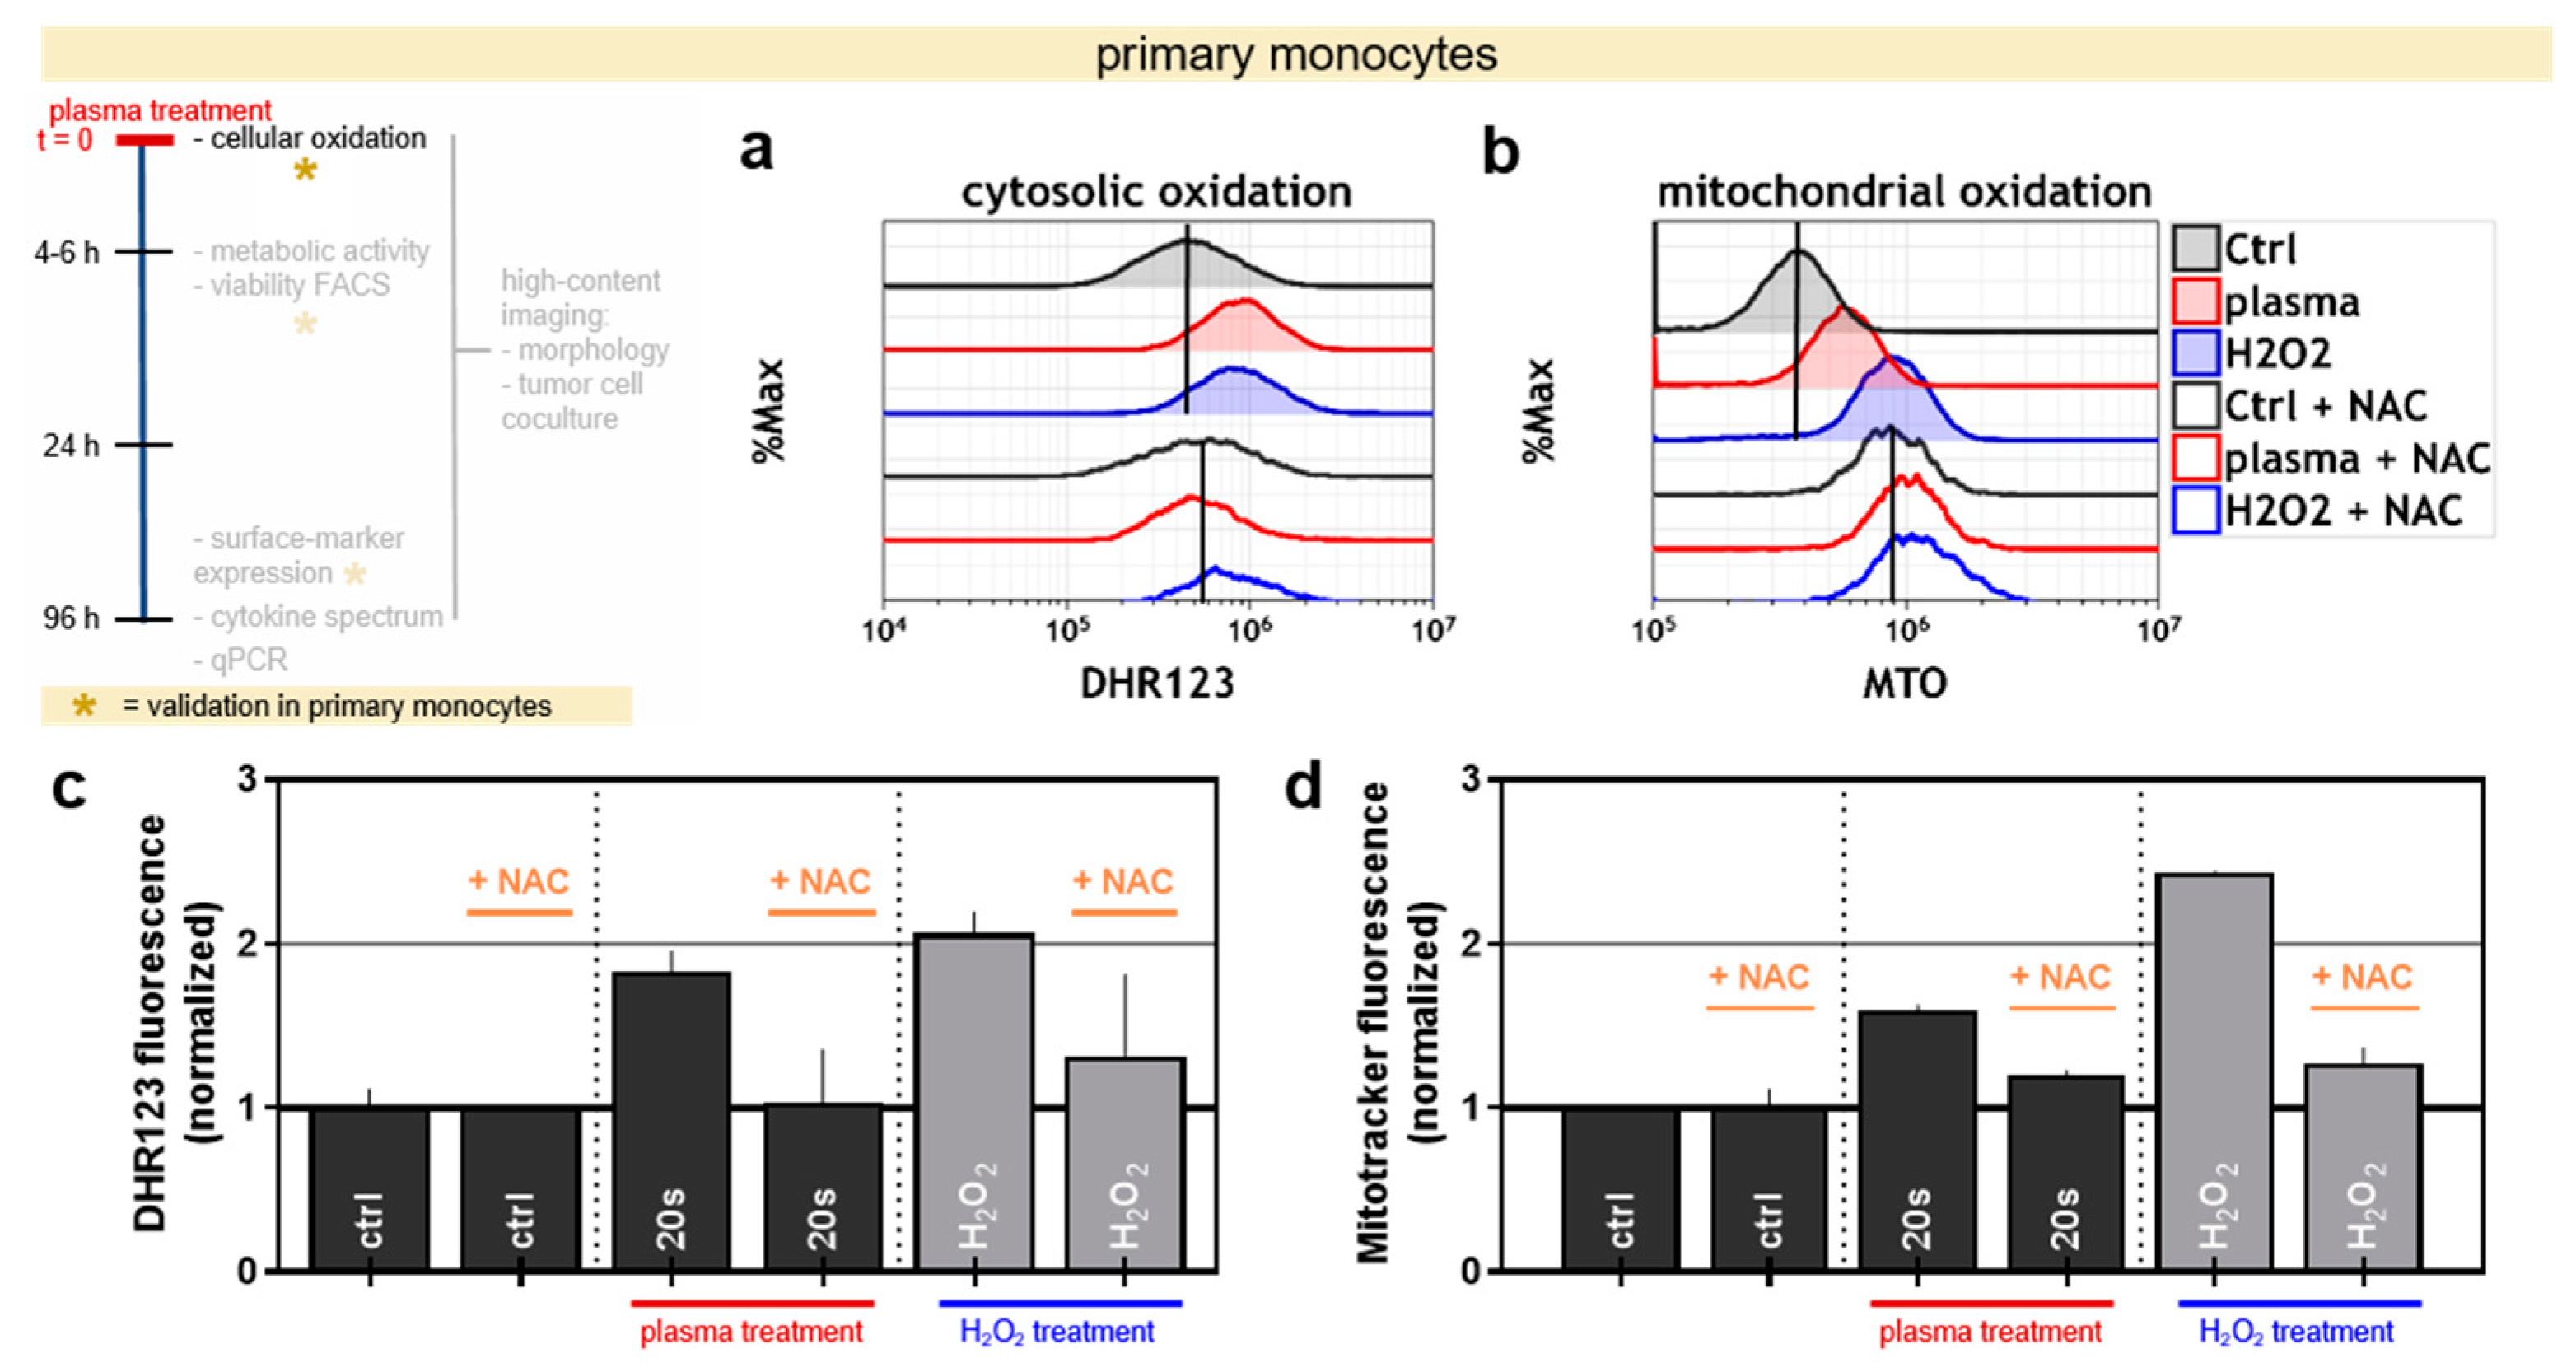
Figure 3.
High content image quantification of morphological changes in THP-1 monocytes up to four days after plasma and/or PMA treatment. 5000 cells were seeded, plasma-treated, and/or PMA-pulsed, and imaged on d0 (4 h), d2 (24 h), and d4 (96 h), respectively. (a) The representative images on day 4 of untreated control cells (I), 120 s plasma-treated cells (II) and cells that were exposed to PMA alone (III). The yellow arrows point to differentiated cells with cellular extensions; (b) Quantification of cell roundness and, (c) quantification of total cell cluster area. Approximately 10,000 single cells per treatment condition were analyzed via computer algorithms. The data are presented as the mean + SEM of three independent experiments with four technical replicates each. The scale bars = 100 µm. Seconds (s) indicate plasma treatment time, ctrl = control.
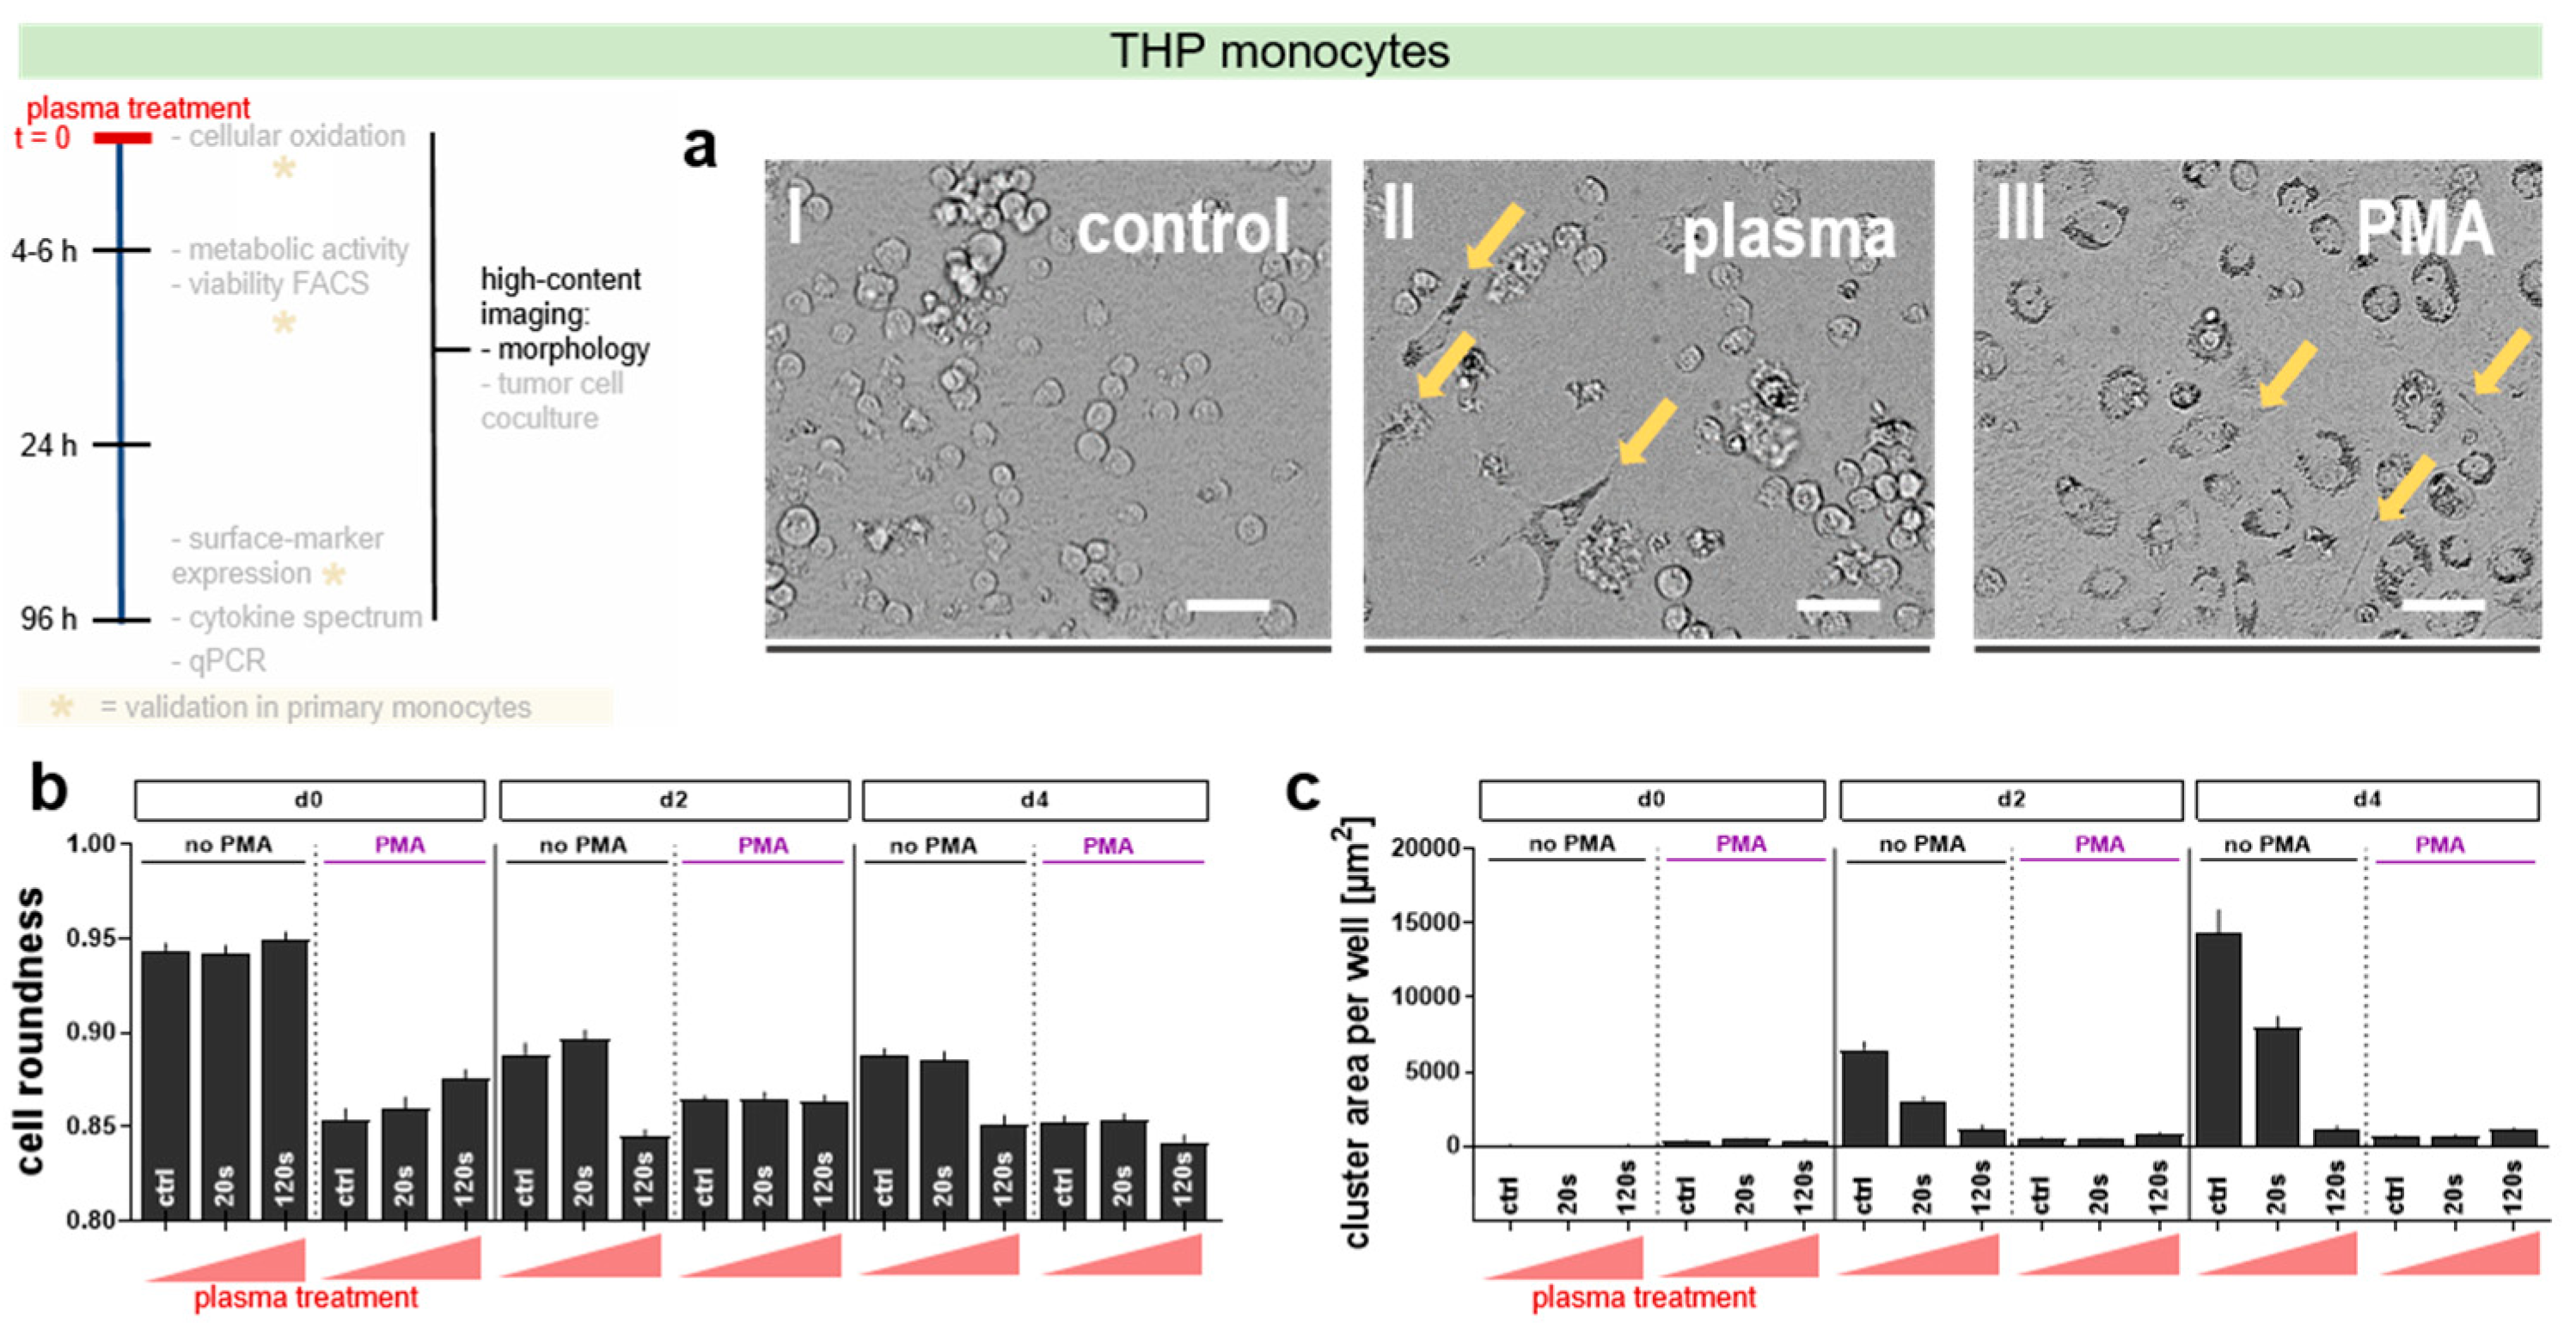
Figure 4.
The cell surface marker expression in THP-1 cells and primary monocytes four days after plasma treatment. (a) The change of surface marker expressions of untreated and 120 s plasma-treated THP-1 cells with or without PMA in comparison to untreated control cells, displayed as a heat-map (white = decrease, light grey = no change, grey = upregulation, black = upregulation with fold change >3. (b–d) The representative overlay histogram of untreated and 120s plasma-treated THP-1 cells without PMA stained with (b) anti-CD55, (c) anti-CD271 and (d) anti-HLA-ABC antibodies. (e–g) Quantification of these selected surface-markers on THP-1 cells for 0 s, 20 s, and 120 s plasma-treatment (±PMA). (h) The change of expression of 5 surface markers on primary monocytes four days after exposure to 0 s, 10 s or 20 s plasma-treatment (±PMA). The data are presented as the mean + SEM of three independent experiments with four technical replicates each. The statistical analysis was performed using two-way anova with Dunnett post-testing to their respective controls. The seconds (s) indicate plasma treatment time, ctrl = control.
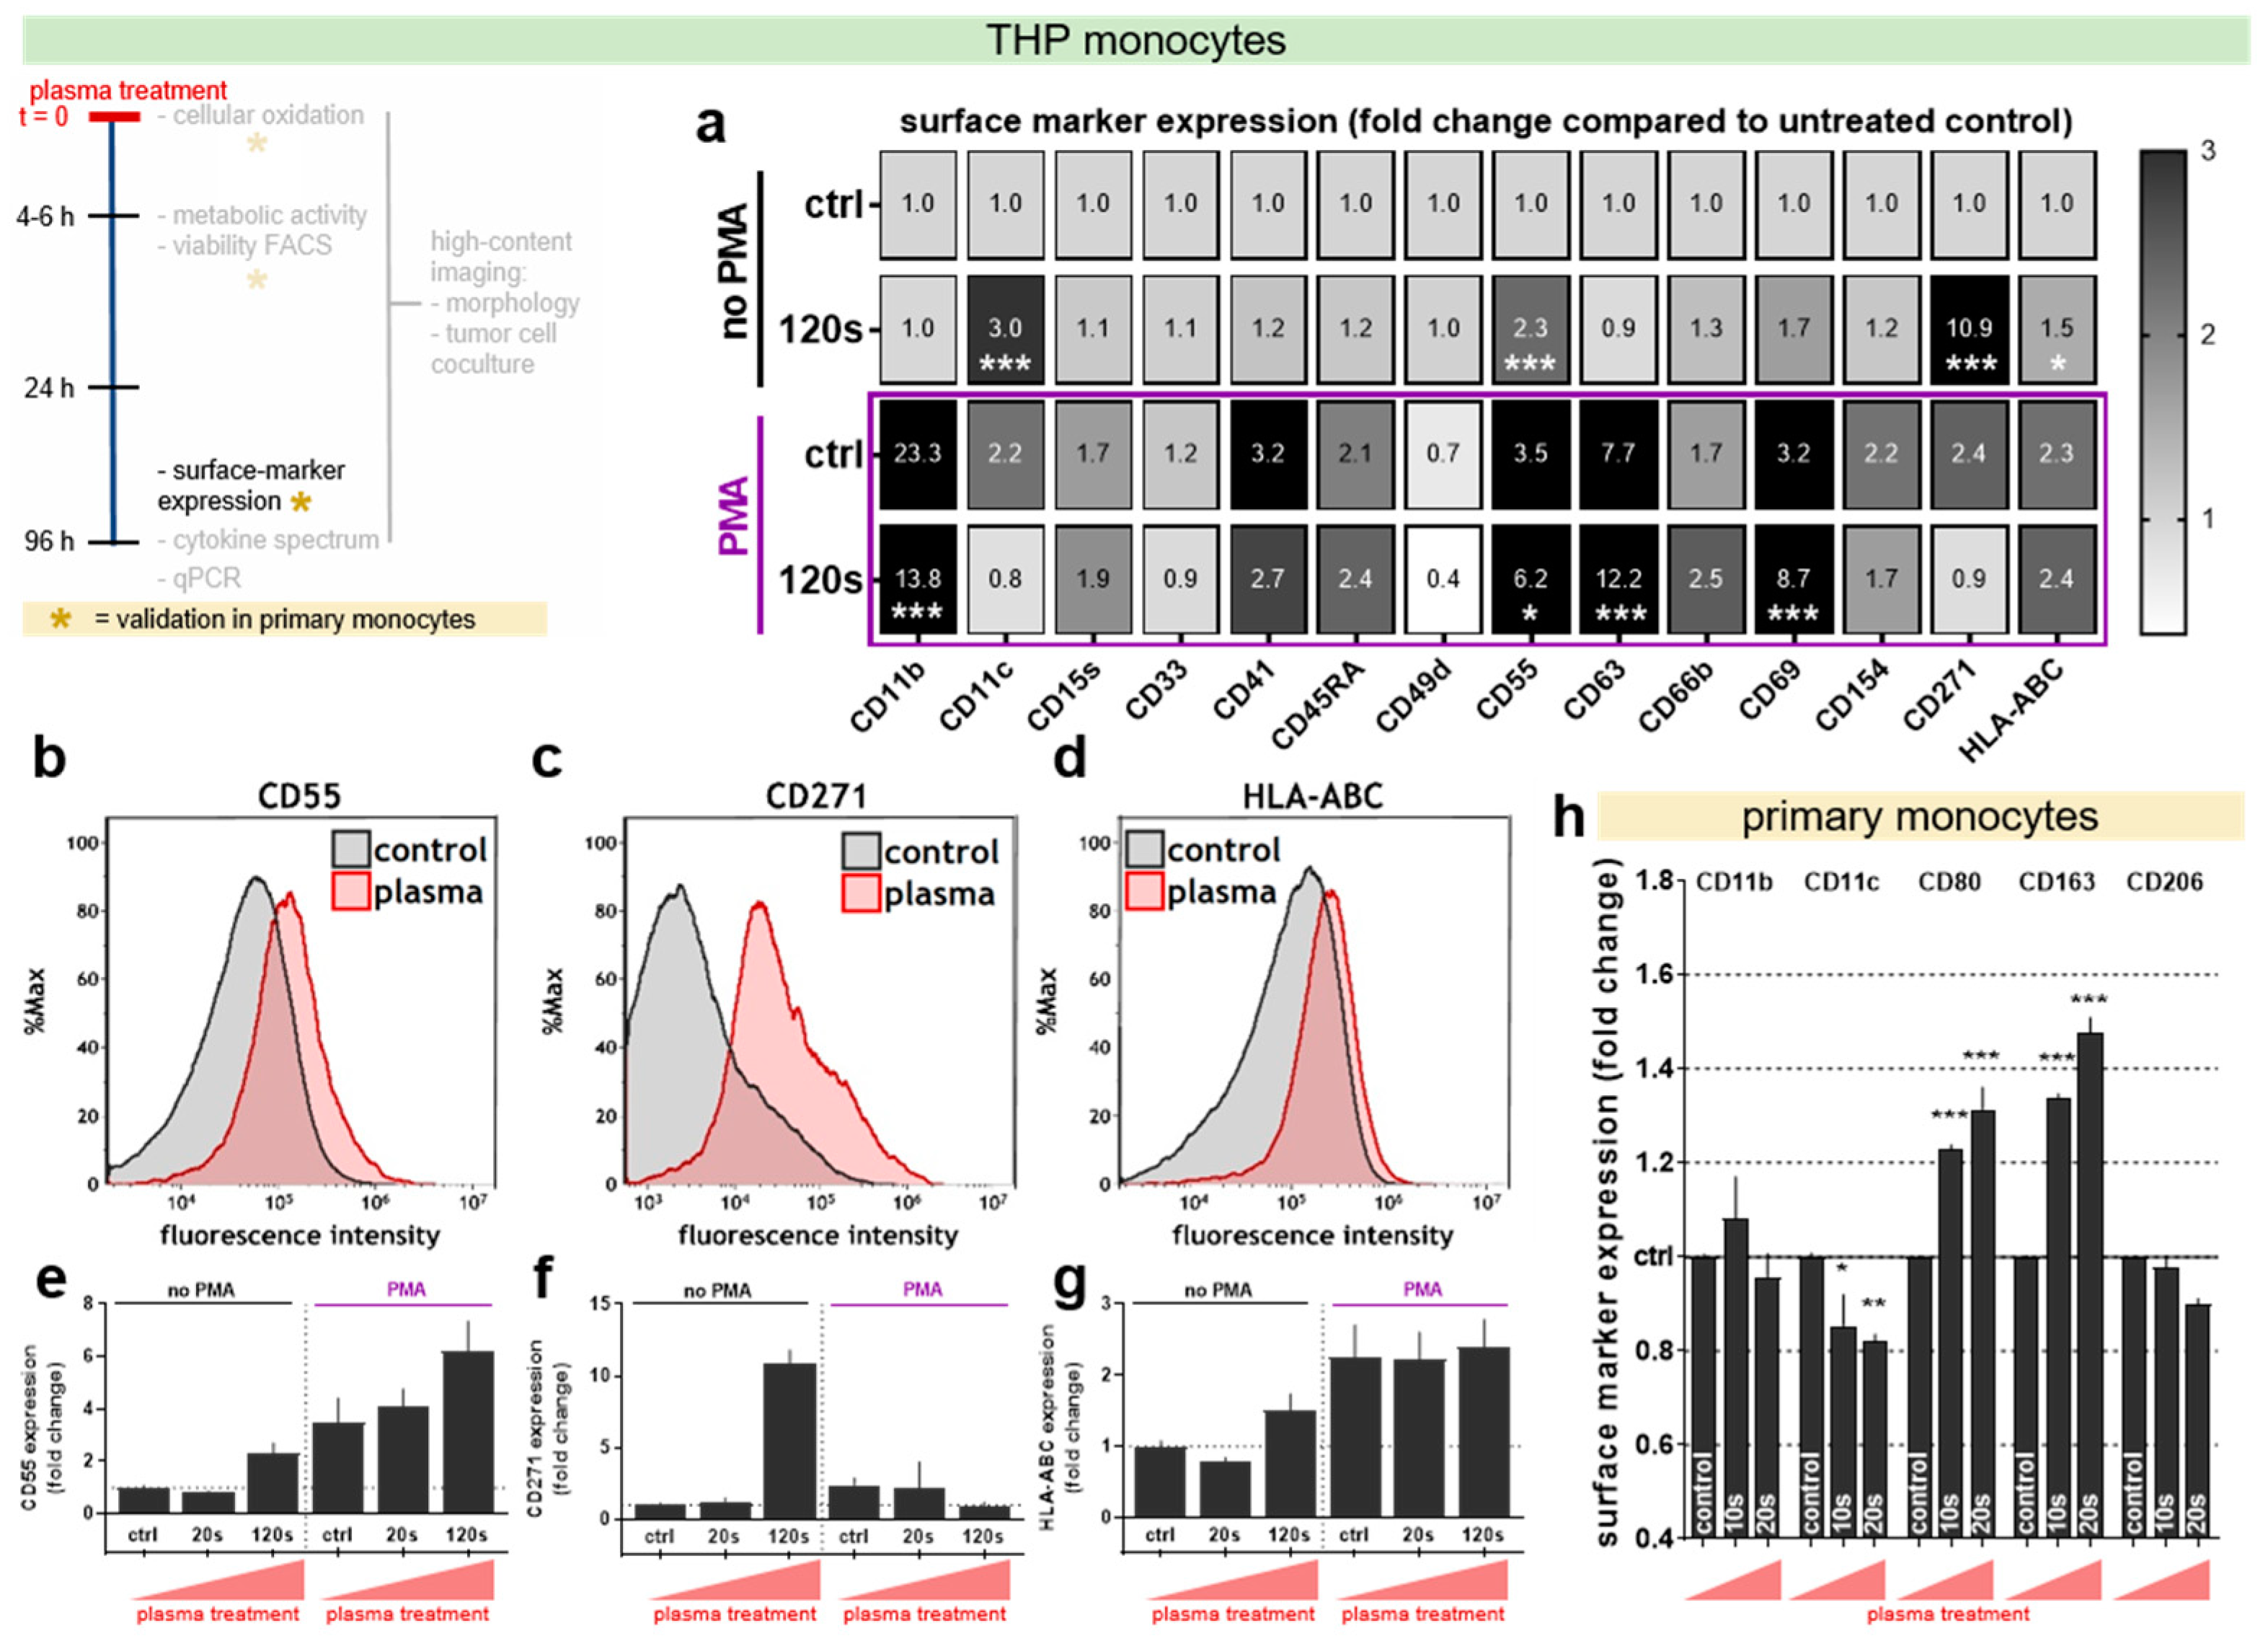
Figure 5.
Plasma and PMA alters cytokine secretion in THP-1 monocyte and the cells’ gene expression four days post treatment. (a) Cytokine content in the supernatant of untreated and plasma-treated THP-1 monocytes (±PMA) in pg/mL. The limit of detection of several cytokines is indicated as a yellow line, and IFNα, IFNγ, IL12p70, IL17A, IL23, and IL33 were not detectable in any sample (data not shown). (b) The modulation of HLA-DR and (c) fibronectin gene expression analyzed with qPCR in 120 s plasma or 300 µM hydrogen peroxide (H2O2) treated THP-1 monocytes with or without PMA. All samples and data (a–c) are pooled from three independent experiments with four technical replicates each and are displayed as the mean + SD. The statistical analysis was performed using two-way anova with Dunnett post-testing to respective controls. The seconds (s) indicate plasma treatment time, ctrl = control.
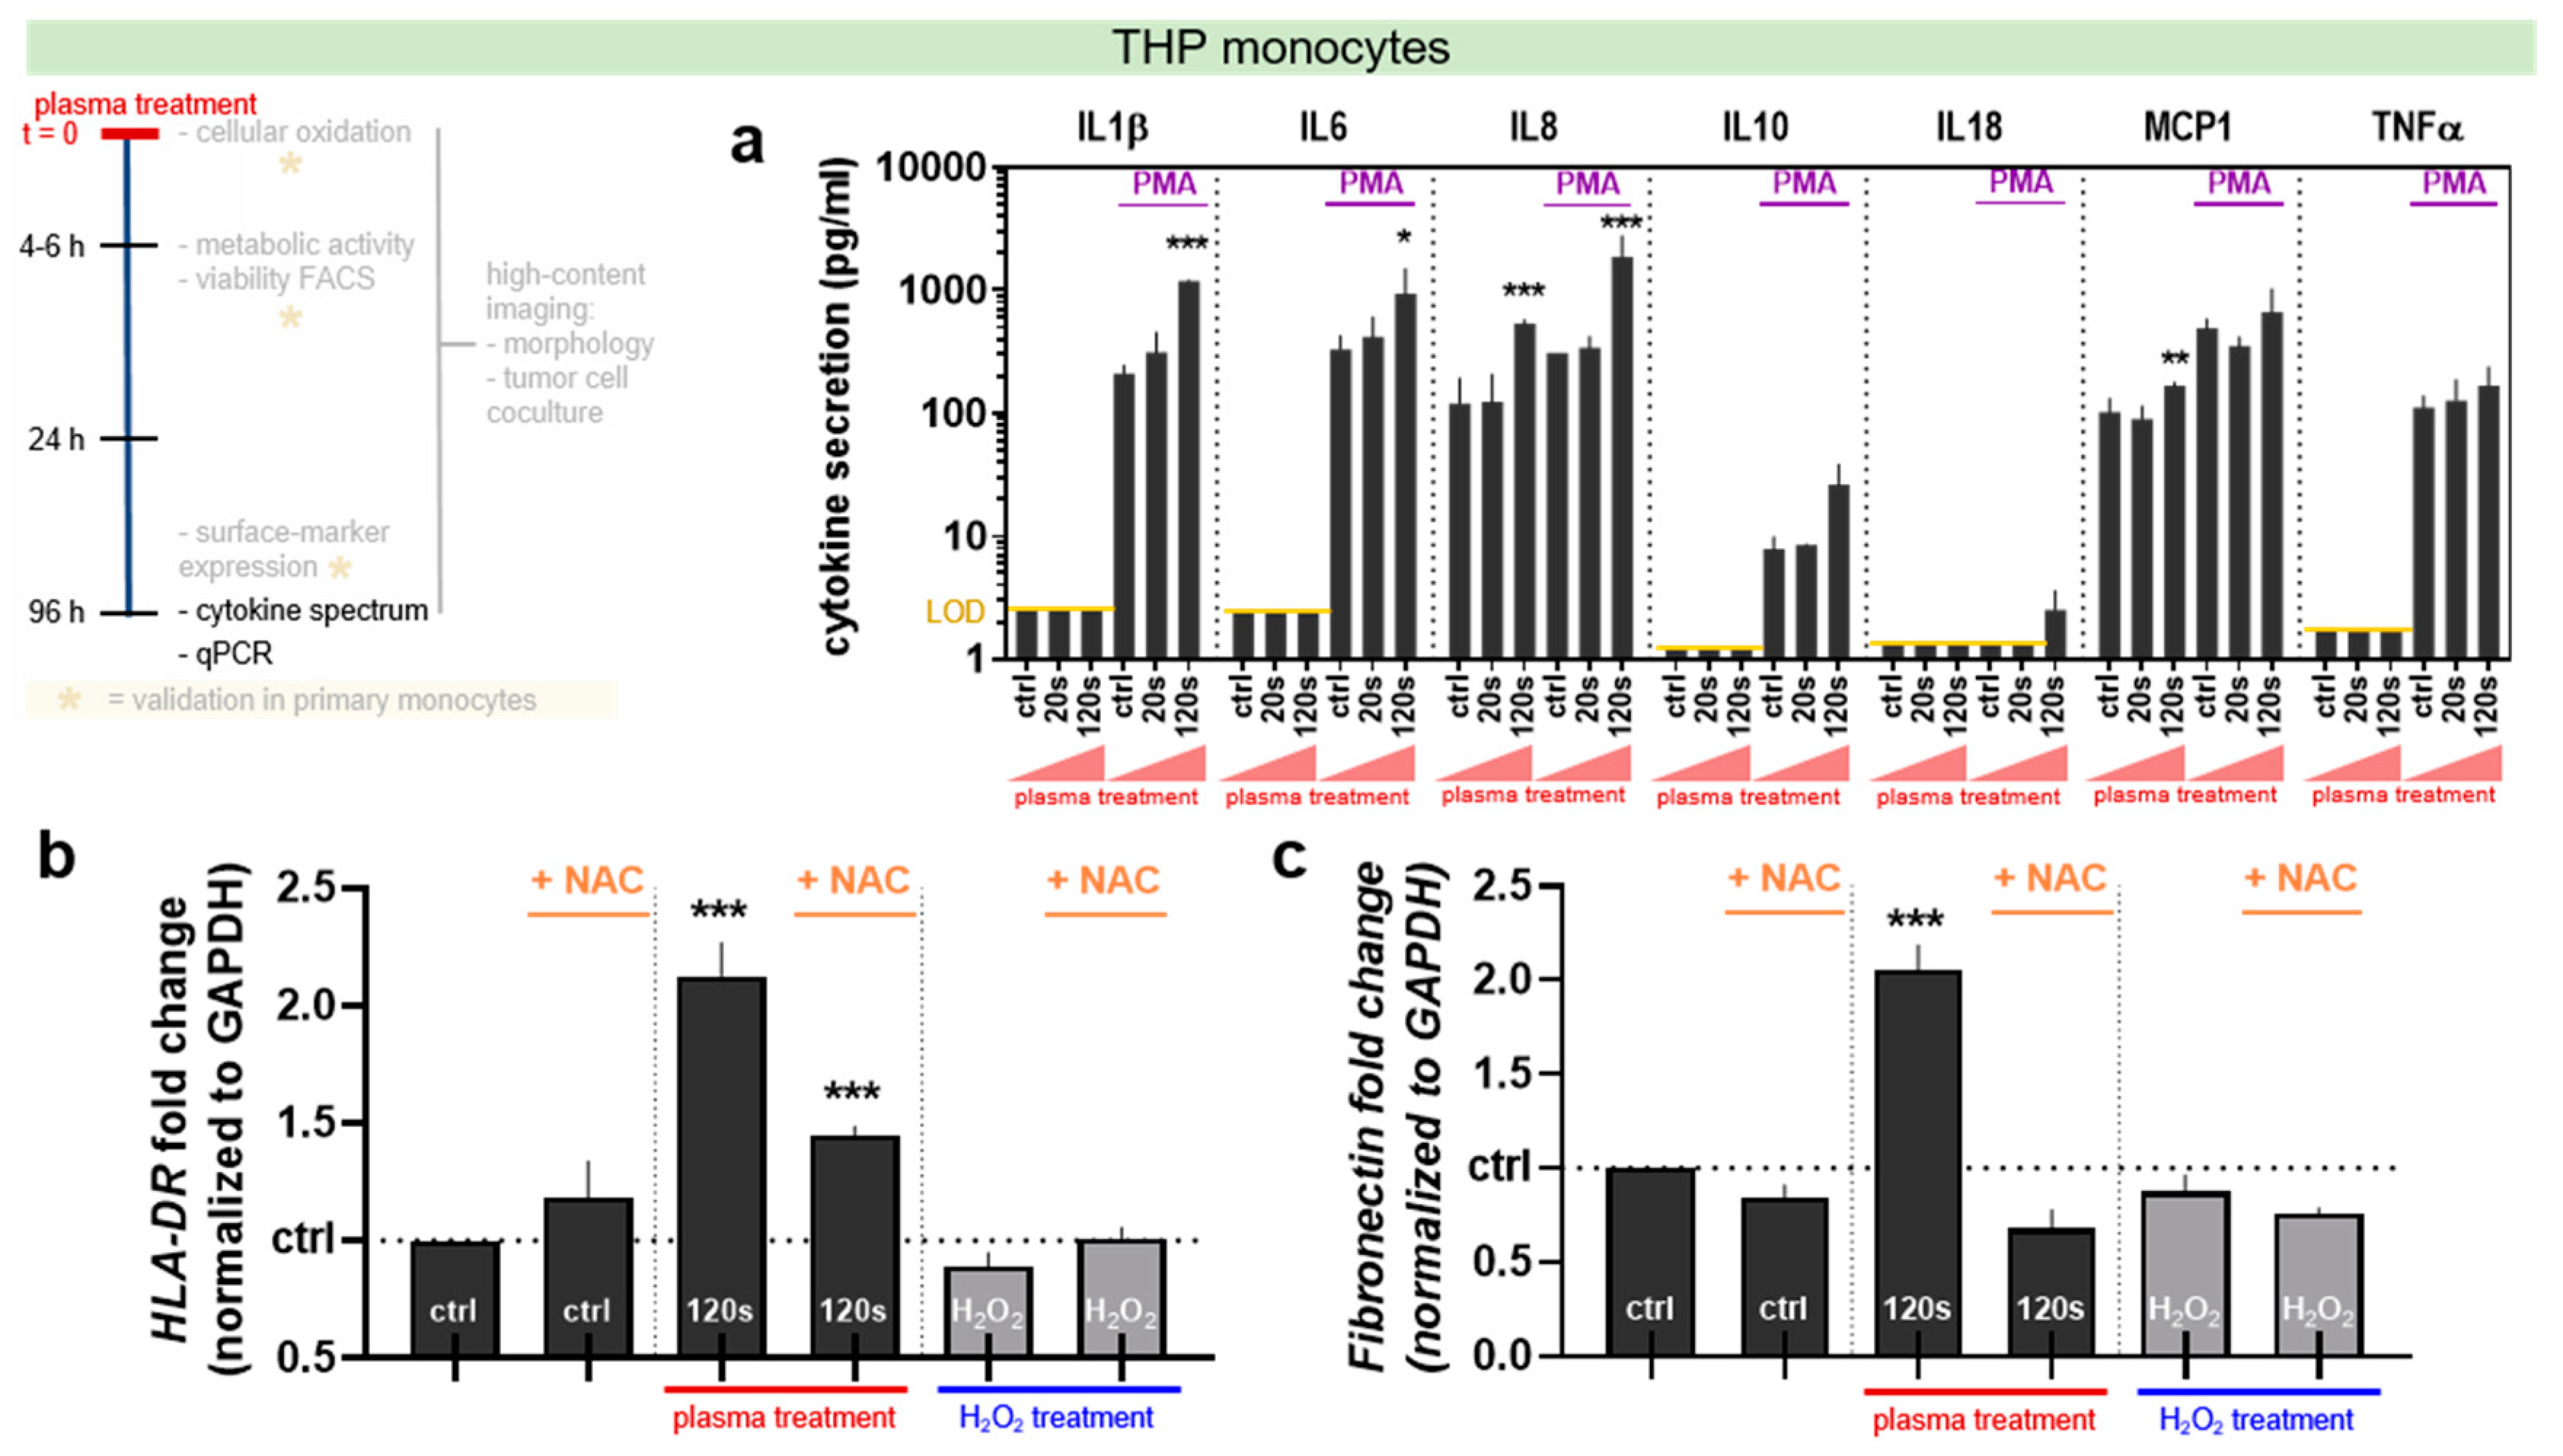
Figure 6.
Co-culture of plasma-stimulated THP-1 monocytes with human A375 melanoma cells. (a) The representative images of the time course of co-culture with 120 s plasma-treated THP-1 cells up to 8 h indicated by t, green arrows point to myeloid cells, red arrows in t = 1 to melanoma cells; (b) The quantification of DAPI as dead-cell dye in cell trace red (CTR) labeled melanoma cells at 8 h after initiation of co-culture. (b) The quantification of DAPI uptake in melanoma cells in untreated, or 20 s or 120 s plasma-treated conditions (±PMA). The data are the mean + SD from two independent experiments with three technical replicates each. The statistical analysis was performed using one-way anova with Dunnett post-testing to respective controls. The seconds (s) indicate plasma treatment time, ctrl = control, scale bar = 50 µm.

© 2019 by the authors. Licensee MDPI, Basel, Switzerland. This article is an open access article distributed under the terms and conditions of the Creative Commons Attribution (CC BY) license (http://creativecommons.org/licenses/by/4.0/).
Share and Cite
MDPI and ACS Style
Freund, E.; Moritz, J.; Stope, M.; Seebauer, C.; Schmidt, A.; Bekeschus, S. Plasma-Derived Reactive Species Shape a Differentiation Profile in Human Monocytes. Appl. Sci. 2019, 9, 2530. https://doi.org/10.3390/app9122530
AMA Style
Freund E, Moritz J, Stope M, Seebauer C, Schmidt A, Bekeschus S. Plasma-Derived Reactive Species Shape a Differentiation Profile in Human Monocytes. Applied Sciences. 2019; 9(12):2530. https://doi.org/10.3390/app9122530
Chicago/Turabian StyleFreund, Eric, Juliane Moritz, Matthias Stope, Christian Seebauer, Anke Schmidt, and Sander Bekeschus. 2019. "Plasma-Derived Reactive Species Shape a Differentiation Profile in Human Monocytes" Applied Sciences 9, no. 12: 2530. https://doi.org/10.3390/app9122530
Note that from the first issue of 2016, this journal uses article numbers instead of page numbers. See further details here.