Application Study of Adaptive Tracking Algorithm in Active Noise Control System of Transformer


1
School of Electrical Engineering, Wuhan University; Wuhan 430072, China
2
State Grid, Hubei Electric Power Company, Technology Training Center; Wuhan 430072, China
*
Author to whom correspondence should be addressed.
Appl. Sci. 2019, 9(13), 2693; https://doi.org/10.3390/app9132693
Submission received: 28 February 2019
/
Revised: 28 April 2019
/
Accepted: 27 June 2019
/
Published: 2 July 2019
(This article belongs to the Special Issue Active and Passive Noise Control)
Abstract
:Active noise control (ANC) technology can be able to reduce the low frequency noise effectively, and has been widely applied in limited enclosed equipment, such as cars, aircraft cockpits, and headphones, etc. Compared with the traditional noise reduction methods, ANC technology is a cost-effective method in handling the low-frequency noise of transformers. An experimental ANC system in a virtual substation is designed and constructed. An adaptive signal tracking ANC algorithm is proposed, and a set of ANC experimental prototypes applied to a virtual substation is designed. Based on the proposed algorithm, the distributions of the acoustics and spectral characteristics of transformer noise in substations are analyzed. Experimental results show that the effective noise reduction can be achieved an average of 5 dB(A) in a given region with respect to the absence of the ANC system.
1. Introduction
Transformer is one of the most important equipment in power system [1]. The noises, especially the low frequency noises emitted by large power transformers and distribution transformers cause a serious disturbance to the surrounding community. For the traditional noise reduction methods, it is difficult to reduce the noise effectively due to the restrictions of economy, security, and other factors. It is believed that the active noise control (ANC) technology can obtain the considerable progress and attention of noise reduction applications in substations.
ANC technology has been successfully applied in acoustic noise reduction, such as cars, ships, and other limited enclosed space [2]. In recent years, substation noise pollution has gained more social attention, and the application of ANC for this kind of free sound field has been gradually increased. It should be noted that ANC system control algorithms and secondary sound source placement are the two key points, which can help to improve the performance of noise reduction effectively. It is necessary to consider the noise characteristics while choosing the control algorithm. The steady-state error, convergence rate, and calculation delay of the algorithm are taken as the evaluation criteria, and the optimal setup is obtained in theory [3]. However, the acoustic reflection, diffraction, and acoustic waves coupling phenomenon in the free sound field make it difficult to achieve effective noise reduction in global space [2]. Therefore, in order to achieve an optimal local optimum, it is necessary to combine the acoustic radiation characteristics of the application environment and the specific noise reduction requirements. At present, ANC technology research on transformer focus on the least mean square (LMS) and its derivative algorithms. Such algorithms are sensitive to interference sources and acoustic feedback phenomena. So, there are many technical problems in the application of such algorithms in transformer noise reduction. In addition, existing research is carried out only in simulation or in anechoic chamber. So the effectiveness of noise reduction actual application in a substation cannot be proved.
At present, many algorithms have been proposed for ANC systems, mainly the LMS algorithm and its improved algorithm. The effectiveness of this type algorithm will be adversely affected when there are other interference noise sources. The feedback branch in the control algorithm and the phenomenon of acoustic feedback in the actual system can also cause the system to be unstable. Haykin S.O. pointed out that the LMS algorithm is simple to calculate and easy to implement, but the disadvantage is the slow convergence [3]. The step size parameter should be chosen in two performance indexes: steady-state error, and convergence speed. Teoh C. applied the Filter-x least mean square (FxLMS) algorithm to transformer noise reduction for the first time, and discussed the distributions of noise and secondary sound sources [4]. However, it only used a 100 Hz sinusoidal signal as the analog noise source, ignoring the interference problem from picking up the noise source signal in practical applications. Kim Y.D. proposed an FxLMS control algorithm for the interference of the fundamental and 2nd harmonic noise, and performed noise reduction experiments in a laboratory environment [5]. Qiu X.J. and Hansen C.H. proposed a waveform synthesis algorithm is proposed by using a notch filter to synthesize the secondary path transfer function based on the FxLMS algorithm, which improves the dependence of the FxLMS algorithm performance on secondary channel parameters [6]. Qiu X.J. used a small transformer as the noise source, the 100, 200, and 300 Hz noise components are taken as the targets to be eliminated, and the obvious noise reduction effect is achieved on the 100 Hz component [7]. The experiment is carried out in an anechoic chamber. Due to the ideal experimental conditions, the adverse effect of acoustic feedback and interference sources on the FxLMS algorithm is neglected. Zhang L.M. proposed an internal composite reference signal transformer ANC algorithm to reduce the impact of interference sources on the ANC system [8]. But, there are frequency and phase deviations between the synthetic reference signal and the actual noise source. Thus, the residual noise signal should be collected by the secondary sensor to amend the synthetic reference signal adaptively in the feedback branch. Actually, there are three problems limiting the algorithm in practical applications, the influence of the interference source noise, phase compensation problem of various frequencies noise of the transformer and the difficulty of building the transfer functions of the primary acoustic channel and the secondary acoustic channel. Although the noise reduction experiment is carried out in a substation, the noise reduction effect is only studied on single of 100 Hz, while the others are not explained. Das D.P. proposed an ANC algorithm, using a power supply signal as a reference signal to avoid the adverse influence of acoustic feedback [9]. However, it could not be applied in practical applications either, because the power signal is converted to radiated noise through the coupling transformation of several physical fields, and the mathematical model of the transformation is not built in the algorithm. Zou H.S. [10] Hu S. [11] Borchi F. [12] proposed an active noise barrier system. There are also acoustic feedback and interference source noise problems.
The purpose of this paper is to build an ANC system for practical substations, according to the noise characteristics of transformers and their radiated sound fields. There are three contributions in this paper. The first is that an adaptive tracking algorithm is proposed, which can eliminate the influence of acoustic feedback and interference source. The second is that an ANC system prototype is built and the noise reduction experiment is carried out in a substation. The third is that the noise reduction effect of the ANC system is analyzed. The paper is organized as follows. In Section 2, the characteristics of transformer noise and acoustic radiation field in substation are measured and analyzed. In Section 3, an adaptive tracking algorithm for transformer noise is proposed. In Section 4, the ANC system prototype is built and the physical noise reduction experiment is carried out in substation. In Section 5, the experimental results are given and the influence factors of noise reduction effect are analyzed.
2. Substation Sound Field Characteristics
For the ANC system, the key factors of noise reduction effect are to design a targeted control algorithm and a secondary source distribution scheme, according to the types and characteristics of noise sources [13]. The control strategy and target of ANC algorithm are designed on basis of acoustic characteristics of noise. The secondary sources placement is based on the substation sound field distribution. Therefore, the first job of this paper is to research the characteristics of transformer noise and the substation sound field distribution.
Operating transformer makes a kind of electromagnetic noise. The reason is that alternating magnetic flux produces magnetostrictive effect which causes vibration of the core laminations. Since the magnetostrictive period is half of the power period, the fundamental frequency of core noise is twice of the power frequency [14]. The difference of magnetic flux path along the core frame and the inner frame, the core hysteresis loss and the non-linearity of the eddy current loss cause the high-order harmonic flux in the core, which produces higher order harmonic noise. The frequency of such noise is usually an integer multiple of the frequency of fundamental frequency noise [15]. In addition, the transformer cooling device produces fluid noise whose energy is evenly distributed over a wide frequency band with no significant peaks. The noise level of such noise is much lower than that of the transformer ontology noise.
A 220 kV substation with a high level of transformer noise located in residential area is taken as the research object. Such industrial noise is a typical acoustic pollution source and needs to be governed. Transformer noise is collected and measured, and then the acoustic characteristics, frequency characteristics and noise distributions are analyzed. The analysis result is used to guide the ANC system control algorithm and the secondary acoustic source placement. The schematic diagram of the substation structure and probe location is shown in Figure 1.
The width of the substation is 60 m, and the length is 70 m. A residential building is 15 m from the west boundary of the substation. Transformer No. 3 is 25 m from the residential building. This transformer noise is a major source of nuisance noise. H series measuring points are placed surrounding by transformer No. 3 and No. 2. Each measuring point is 0.2 m from the transformer, and the measuring point to each other is 1.5 m apart on each side. Transformer noise characteristics are analyzed by the collection of noise signal and sound pressure level of H series measuring points. A column measuring points are arranged in the west boundary, and each point is 7 m apart. A to E column, the interval between each column is 10 m. The sound pressure levels of these points are collected as the references of substation sound field distribution.
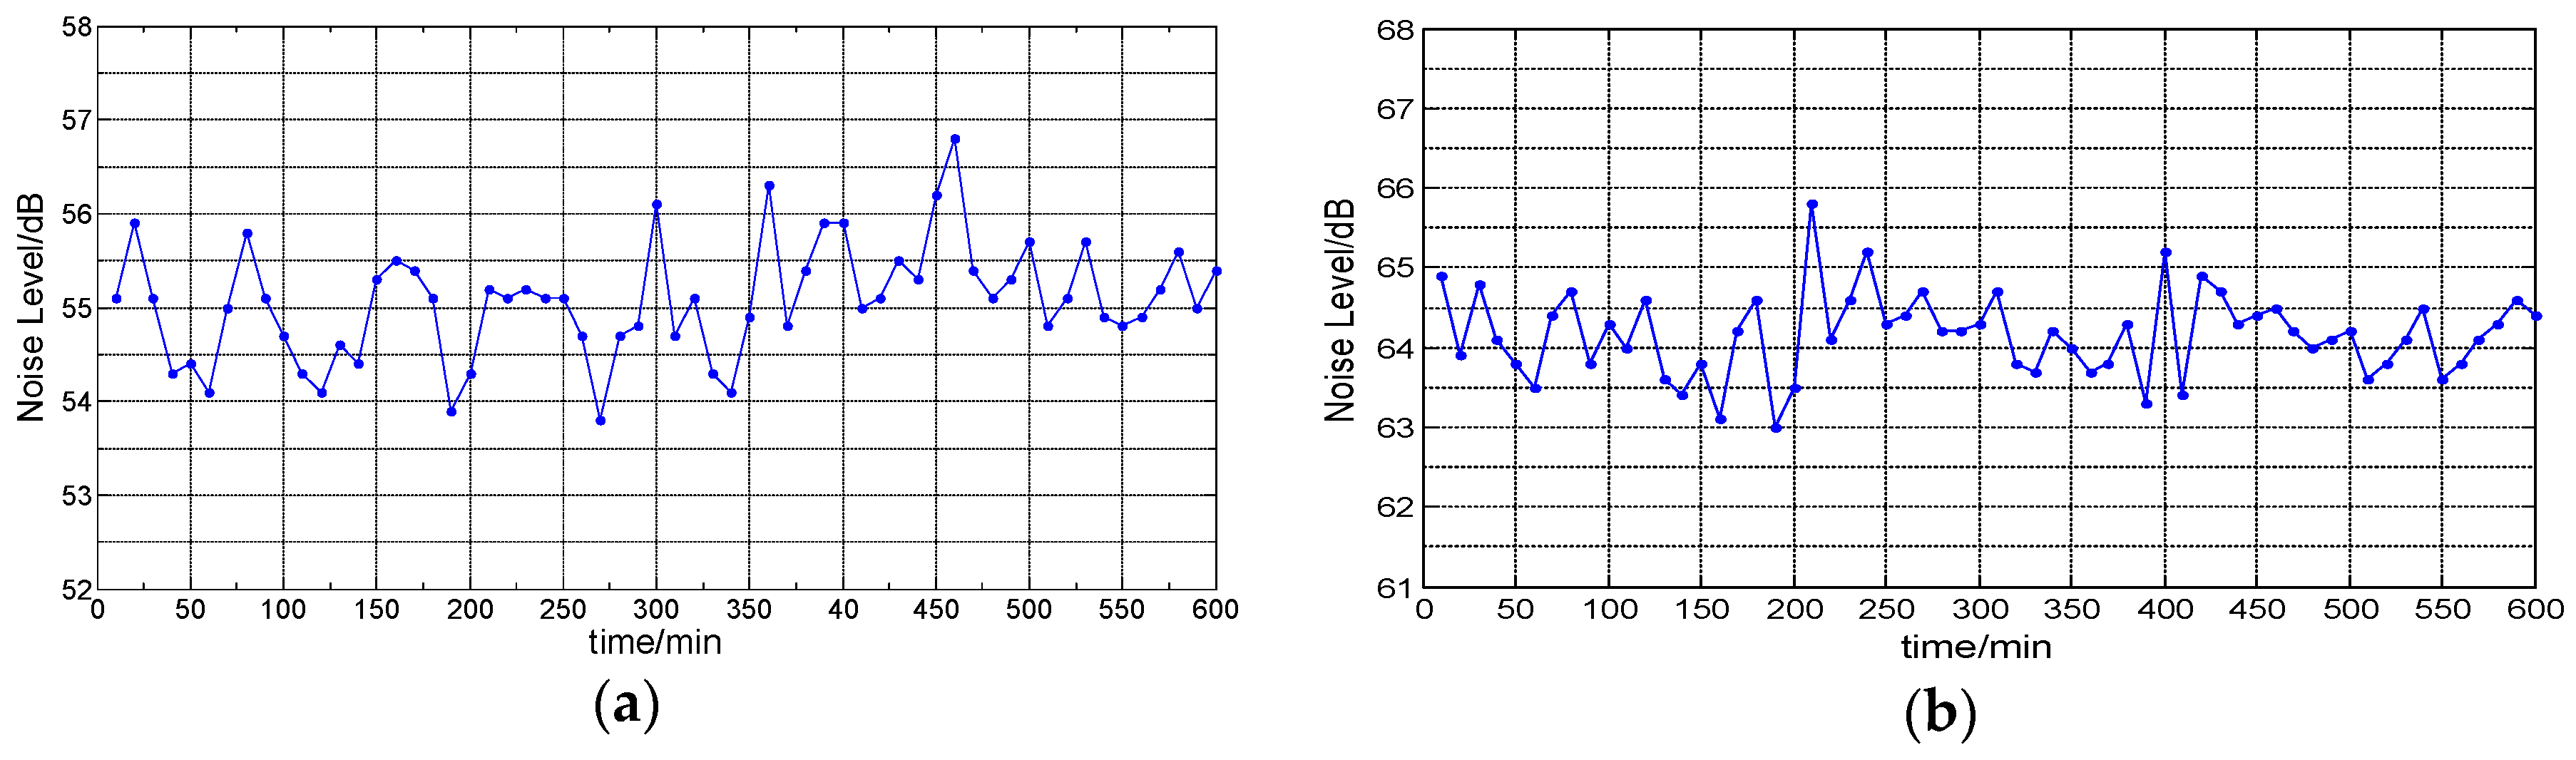
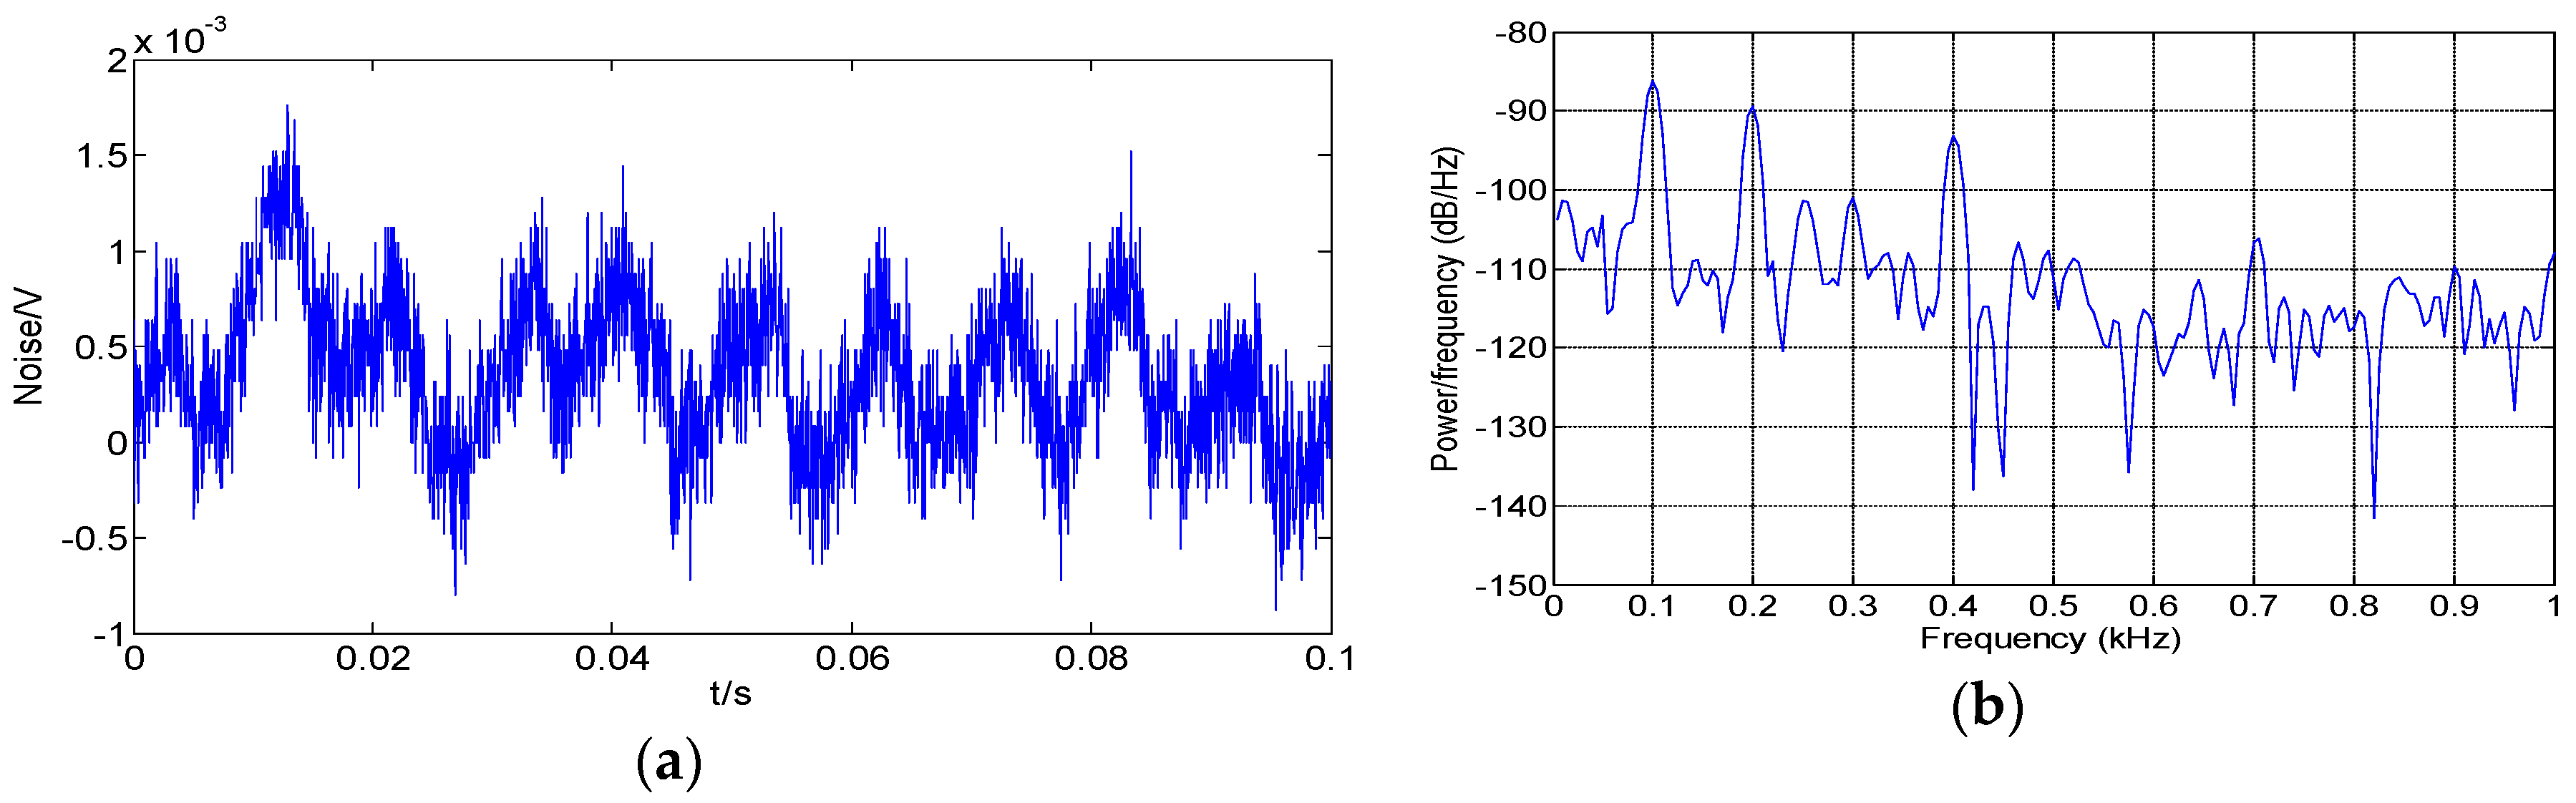
Each measurement point sampled the sound pressure level 10 times, and the interval of each sampling is 10 min. The transformer noise level is measured at 10 min per interval for 600 min at H series and A8 to A10 measurement points, and the noise signal was collected for 15 s. The type of measuring instrument is AWA6921, which is a general-purpose 1 sound measurements to the latest international standards. Figure 2 shows the noise level variation at H2 and A9 in 600 min. Figure 3 shows the time domain and the spectrum of noise signal of H2 within one second. Table 1 shows the noise pressure level of 100 Hz to 500 Hz frequency component at H2.
As shown in Figure 2, the transformer noise is maintained at 64 ± 1 dB at H2. The noise level at A9 is maintained at 55 ± 1 dB(A), and the variation range is less than 1 dB(A). According to the environmental quality standard for noise in China [16], residential buildings belong to the Category 1 acoustic environment functional area. Such areas require the environmental noise limit to be 55 dB (A) during the day. It can be seen that the noise level is close to critical noise in the standard above. Since the power system requires transformer to operate stably, the working characteristic parameters can be regarded as constant, so the radiation noise is stable and fluctuates in a small range. Figure 3 and Table 1 show that the transformer noise is in a discrete peak arrangement in the frequency domain, which is a typical tonal noise. With respect to 100 Hz to 500 Hz, the five noise components are the main transformer noise. In addition, the noise collected by the primary sensor also includes the high-frequency noise component of the transformer body noise, the noise of the transformer cooling fan, and the noise of the surrounding environment. The transformer body noise is mainly line spectrum noise, which is tonal noise. The noises of the transformer cooling fan and surrounding environment are random and broadband, which are chaotic noise [17,18,19]. It can be concluded that the transformer noise is complex sound waves composed of periodic noise and chaotic noise. According to the superposition principle of sound waves, complex sound waves can be expressed by Equation (1).
where, k is the total wave number of the single frequency component; is the chaotic noise [18]; is the amplitude of the kth frequency component; is the phase of the kth frequency component; is the frequency value of the kth frequency component; is the sampling frequency.
The sound pressure level superposition formula can be expressed by Equation (2).
where is the sound pressure level of stacked noise and is the sound pressure level of the kth noise frequency component.
Assuming k = 2, when L1 = L2, ∆L = 3 dB; when L1 – L2 =10dB, ∆L = 0.4dB; when L1 – L2 = 20dB, ∆L = 0.04dB. The deduction shows that the total sound pressure level is equal to that of a single sound source plus 3dB when the sound pressure level of the two sound sources are the same. The bigger the sound pressure level difference between the two sounds, the less the contribution of the lower sound pressure source to total sound pressure level. Table 1 shows the sound pressure values of five main noise components of the transformer. According to the Equation (2), the synthetic sound pressure level of these five frequency components is 65 dB and the actual noise level is 66.5 dB. The sound pressure level contribution of other noise components is 1.5 dB. Therefore, if the five noise components can be effectively suppressed, the main energy of transformer noise can be eliminated, and the purpose of noise reduction can be achieved.
Taking the sound pressure level data of H series measuring points as the equivalent noise source, taking the sound pressure level data at other measuring point as reference, the noise attenuation model of substation is established. The noise distribution of substation is calculated and the substation noise contours are plotted. In the process of noise propagation, the attenuation mainly includes geometric attenuation , attenuation atmospheric attenuation , ground attenuation and barrier attenuation . The total attenuation is the sum of the respective attenuation amounts as follows
Among them, the four attenuation components of the calculation formula are as follows
where r is the distance from predicted point to sound source. r0 is the distance from reference point to sound source. α is the atmospheric absorption attenuation coefficient of the frequency band noise. is the ground factor of the sound source area. is the ground factor of the receiving area. is the ground factor of the intermediate area. N1, N2, N3 is the Fresnel number corresponding to the three diffraction paths along the rectangular obstacle. Using the measured point data and the noise attenuation model, substation sound field distribution is shown in Figure 4.
Figure 4 shows that the transformer initial noise is 64 dB(A) to 66 dB(A). At the west station boundary, near residential building, the noise sound pressure level is still about 56 dB(A). With the distance increasing, the noise sound pressure level at south station boundary is attenuated less than 45 dB(A), which is close to environmental background noise. Due to the obstruction of the switch room and the control room, the noise level at east and north station boundary are much lower than that at the south and west boundary, and it is close to the environmental background noise.
The analysis above shows that the main noise energy of the transformer noise is composed of 100 Hz to 500 Hz noise components. The five noise components are periodic noise, and contribute for more than 95% of the whole noise sound pressure level. The amplitude of the noise sound pressure level varies little, so it can be approximately considered as a constant quantity. And their phase increase or decrease continuously in the time domain. Taking the five noise components as the elimination target, the main sound pressure level of the transformer noise can be eliminated. When only the five noise components are used as reference signals, adverse effects of interference sources and other components can be avoided in the algorithm. In addition, the substation sound field distribution shows that only the west side of the substation needs noise reduction.
3. ANC Control Algorithm Based on an Adaptive Tracking Method
In this work, we focused on the conclusion of transformer noise characteristics analysis, and proposed an adaptive tracking algorithm for 100 Hz to 500 Hz noise components. The five noise components belong to low frequency noise. Comparing with high-frequency noise, it is easier to achieve compensation and tracking of amplitude and phase. The adaptive tracking algorithm proposed in this paper draws on the perturbations observation method in photovoltaic power generation, which tracks the maximum power point under the dynamic change of external factors (temperature, sunshine). The algorithm is a self-optimization algorithm [20]. Its basic principle is judging the change direction of output power after adding voltage perturbations, and then adjusting the perturbations voltage to make the output power towards the maximum point. In the Equation (1), the time-varying parameters of the periodic noise of transformer noise are amplitude and phase , which can be approximately considered as a continuous variation. This paper proposed an adaptive tracking algorithm by adding perturbations of amplitude and phase. Its basic principle is judging the change direction of residual noise after adding perturbations and then adjusting the perturbations to make the residual noise towards the minimum point. When the residual noise reaches the optimum value or constraint conditions, the current amplitude and phase are output. The algorithm flow is shown in Figure 5.
First, the five frequency noise components of 100 Hz, 200 Hz, 300 Hz, 400 Hz, and 500 Hz are picked up by low-pass filter and FFT transform of the transformer noise collected by the primary sensor, and the other noise components are not considered. Thus, Equation (6) can be expressed as:
where represents the reference signal; is the kth noise frequency component in the reference signal; is the kth noise amplitude component in the reference signal; is the kth noise phase component in the reference signal; represents the signal frequency; k is the number of frequency components; n is the sampling sequence.
The perturbations tracing output signal can be expressed as:
where represents the reference signal; is the kth noise frequency component in the perturbation signal; is the kth noise amplitude component in the perturbation signal; is the kth noise phase component in the perturbation signal.
The residual noise sound pressure amplitude is:
When = , − = 2lπ+π, l = 0,1,2,…, the sound pressure of the space sound field reaches the minimum value , the space synthesis acoustic wave is:
Add perturbations and to and , respectively, and then add them to and , respectively.
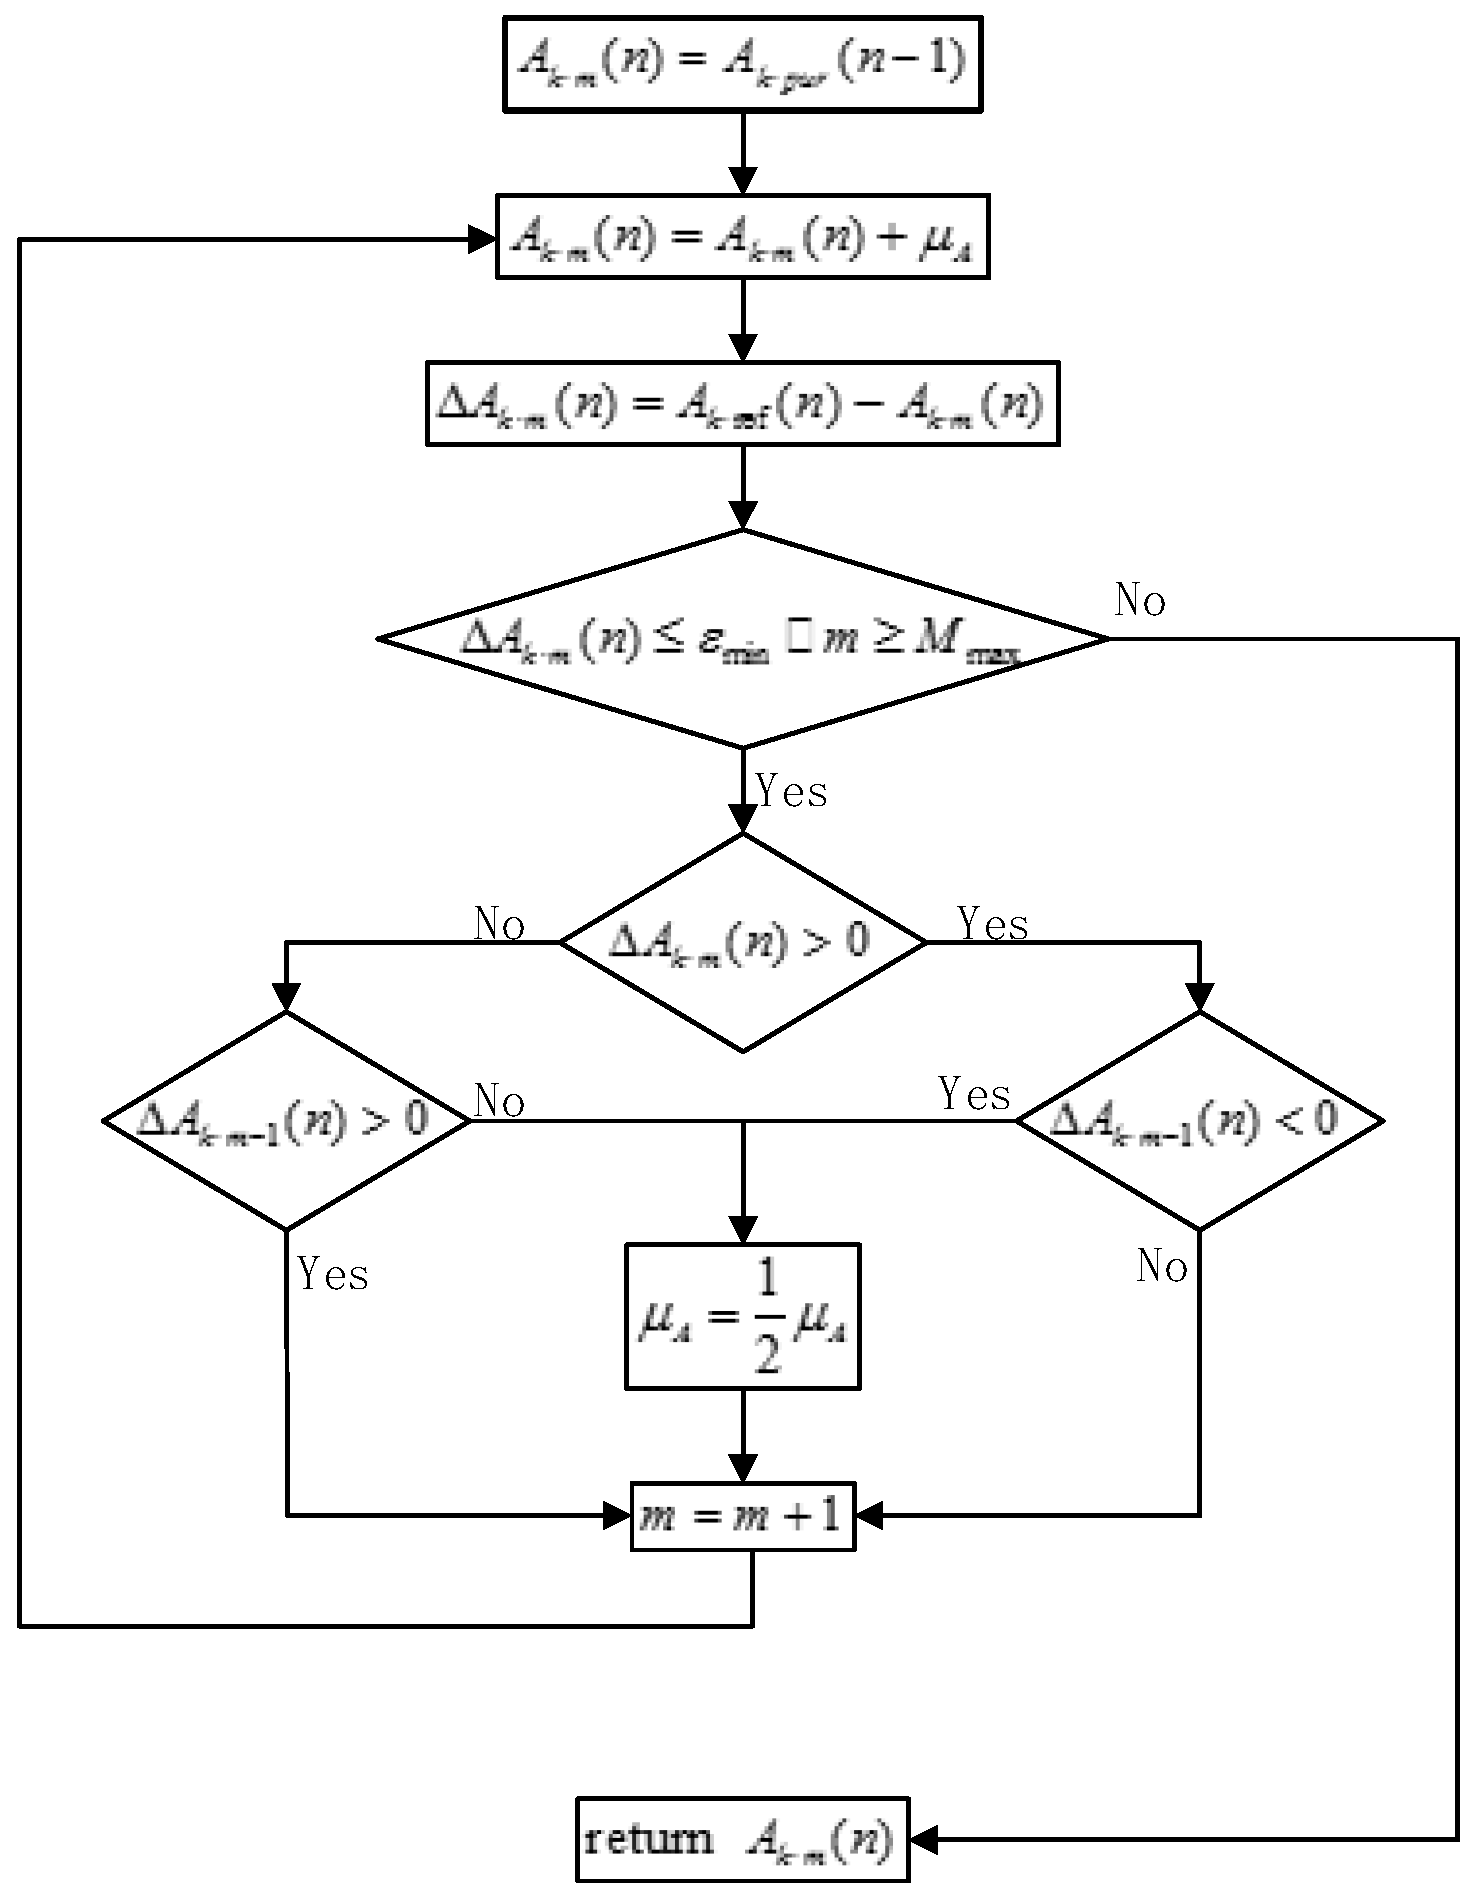
Judge the change of before and after adding perturbations through the Equation (11), we adjust the perturbation , to make change towards to the minimum. When the constraint = 0, = 2lπ+π, l = 0,1,2… or the number of adjustments is reached, the system outputs an adaptive tracking signal with current and . Figure 6 is a detailed amplitude adjusting process, and it is the same with phase adjusting process.
4. Discussion
4.1. Comparing Experiments of Algorithms
4.1.1. Simulation Experiments
The algorithm proposed in this paper is compared with LMS and FxLMS algorithm by simulation. The input signal is the recorded transformer noise. The order of LMS algorithm is set as 32 and the step size is 0.03, and the order of FxLMS algorithm is set as 32 and the step size is 0.05. The parameters of adaptive tracking algorithm are set as follows: the initial phase is 10 degrees; the initial amplitude is 0.1 mV, and the adjustment step of the phase perturbations is 1; the adjustment step of amplitude perturbations is 0.01, and the maximum adjustment limit is 50; the minimum error limit is εmin=. The simulation results are shown in the Figure 7.
The convergence time to steady state of the algorithms proposed in this paper is 0.007, while it is 0.029 seconds and 0.014 seconds of LMS algorithm and FxLMS algorithm respectively. The steady-state error of the proposed algorithm is a little larger than that of the LMS algorithm and the FxLMS algorithm. This is because the elimination target of the proposed algorithm is the five main transformer noises, while the LMS algorithm and the FxLMS algorithms use all noise as the elimination target. Although residual noise by the proposed algorithm is larger, the noise has been greatly reduced with the shortest convergence time.
There is an inconsistency and contradiction between the step size and the convergence speed in the LMS algorithm [3]. Its convergence speed is the slowest of the three algorithms in the simulation experiment. Since perform secondary channel parameter estimation is needed in the FxLMS algorithm, when the algorithm is applied to open sound field, the influence of the secondary channel parameter estimation and acoustic feedback phenomenon may lead to the performance degradation, or even instability of the algorithm [21]. In addition, the algorithmic stability of the LMS algorithm and the FxLMS algorithm is closely related to the power spectrum of the input signal [21,22]. When there is pulse signal in the input signal, the LMS algorithm and the FxLMS algorithm are unstable. However, because the algorithm proposed in this paper sets the error limit and the maximum number of adjustments, even if the pulse noise causes the current calculation to not converge, it will not cause the algorithm to be unstable.
4.1.2. Actual experiments
In order to test the performance of the three algorithms in real sound field environment, the active noise reduction experiment is carried out. The noise source was simulated with 3 speakers, and the spacing between each speaker was 0.25 m; the secondary sound source array was composed of 6 speakers, each speaker having a vertical interval of 0.25 m and a horizontal spacing of 0.4 m. The primary sound source is the recorded transformer noise, and its volume is adjusted to 60 dB at a distance of 1 m. The parameter setting of the algorithm is the same as simulation. Two measuring points are set at 5 m and 10 m from the secondary sound source. The orientation diagram and experimental photos are shown in the Figure 8. The results are shown in the Table 2.
From the measurement results of simulation experiment, it can be seen that 5.7 dB(A) noise reduction is obtained at the X1 measurement point and 4.7 dB(A) noise reduction is obtained at the X2 measurement point by using the proposed algorithm whereby 1.5 dB(A) noise reduction is obtained at the X1 measurement point and 0.8 dB(A) noise reduction is obtained at the X2 measurement point by using the LMS algorithm. Even the noise was intensified at two measurement points by using the FxLMS algorithm which means that the algorithm does not converge under this experimental condition, and that a secondary sources phenomenon screaming out of control appears multiple times in the experimental process. Although the convergence accuracy of the proposed algorithm is not the highest in the simulation experiment, but the proposed algorithm has the following advantages: on the one hand, it converges very fast; on the other hand, it can largely avoid the adverse effects of the noise in addition to those 5 single-frequency noise components which the proposed algorithm only considered as optimization objectives of noise reduction.
4.2. Prototype Configuration and Instrumentation
The ANC system is consisted of two parts: electroacoustic devices and controllers. The electro acoustic device includes the primary noise pickup and residual noise monitoring by acoustic sensor, and the loudspeaker is used as the secondary sound source. The controller is used to achieve the hardware and software of the ANC algorithm. The characteristics of the noise sources should be used as a reference for the control algorithm, and the hardware should be placed on the industry standard substation control room.
The hardware of controller includes the industrial personal computer (IPC), PCI data acquisition, and output board. The software and the key parameters of the algorithm are as follows: the main control program of industrial control computer realized by C ++ is visual, controllable, and monitoring. The adaptive tracking algorithm is used in the main control program, and facilitate to be maintained. The parameters of adaptive tracking algorithm are the same as in 4.1. The main reason for adopting the industrial computer as the hardware carrier of the ANC system controller is that it has good performance at anti vibration, dustproof and electromagnetic shielding, which can protect the internal parts of the computer from affection of electromagnetic field in the substation. In addition, selecting the corresponding chassis according to the control cabinet model in the substation is good to arrange on shelves in actual operation. The main reason for using a PCI board is that it is plug-and-play and has efficient transmission rate and better expansibility. The other part is the electro acoustic device. The primary acoustic sensor is used to pick up the noise signal, and the secondary acoustic sensor is used to monitor the residual noise signal. The Secondary sound source array is composed of nine speakers and a power amplifier. Horizontal spacing of each speaker is 0.3 m, and vertical spacing is 0.3 m. The structure is shown in the Figure 9.
4.3. Experimental Program
The experiment was carried out in the 220 kV substation shown in Figure 1. After the discussion and analysis of Section 2, the noise level at the east, south, and north side of the substation has reached the environmental standard, but the noise level near the residential area in the west side was not up to standard. Noise in such areas needed to be reduced.
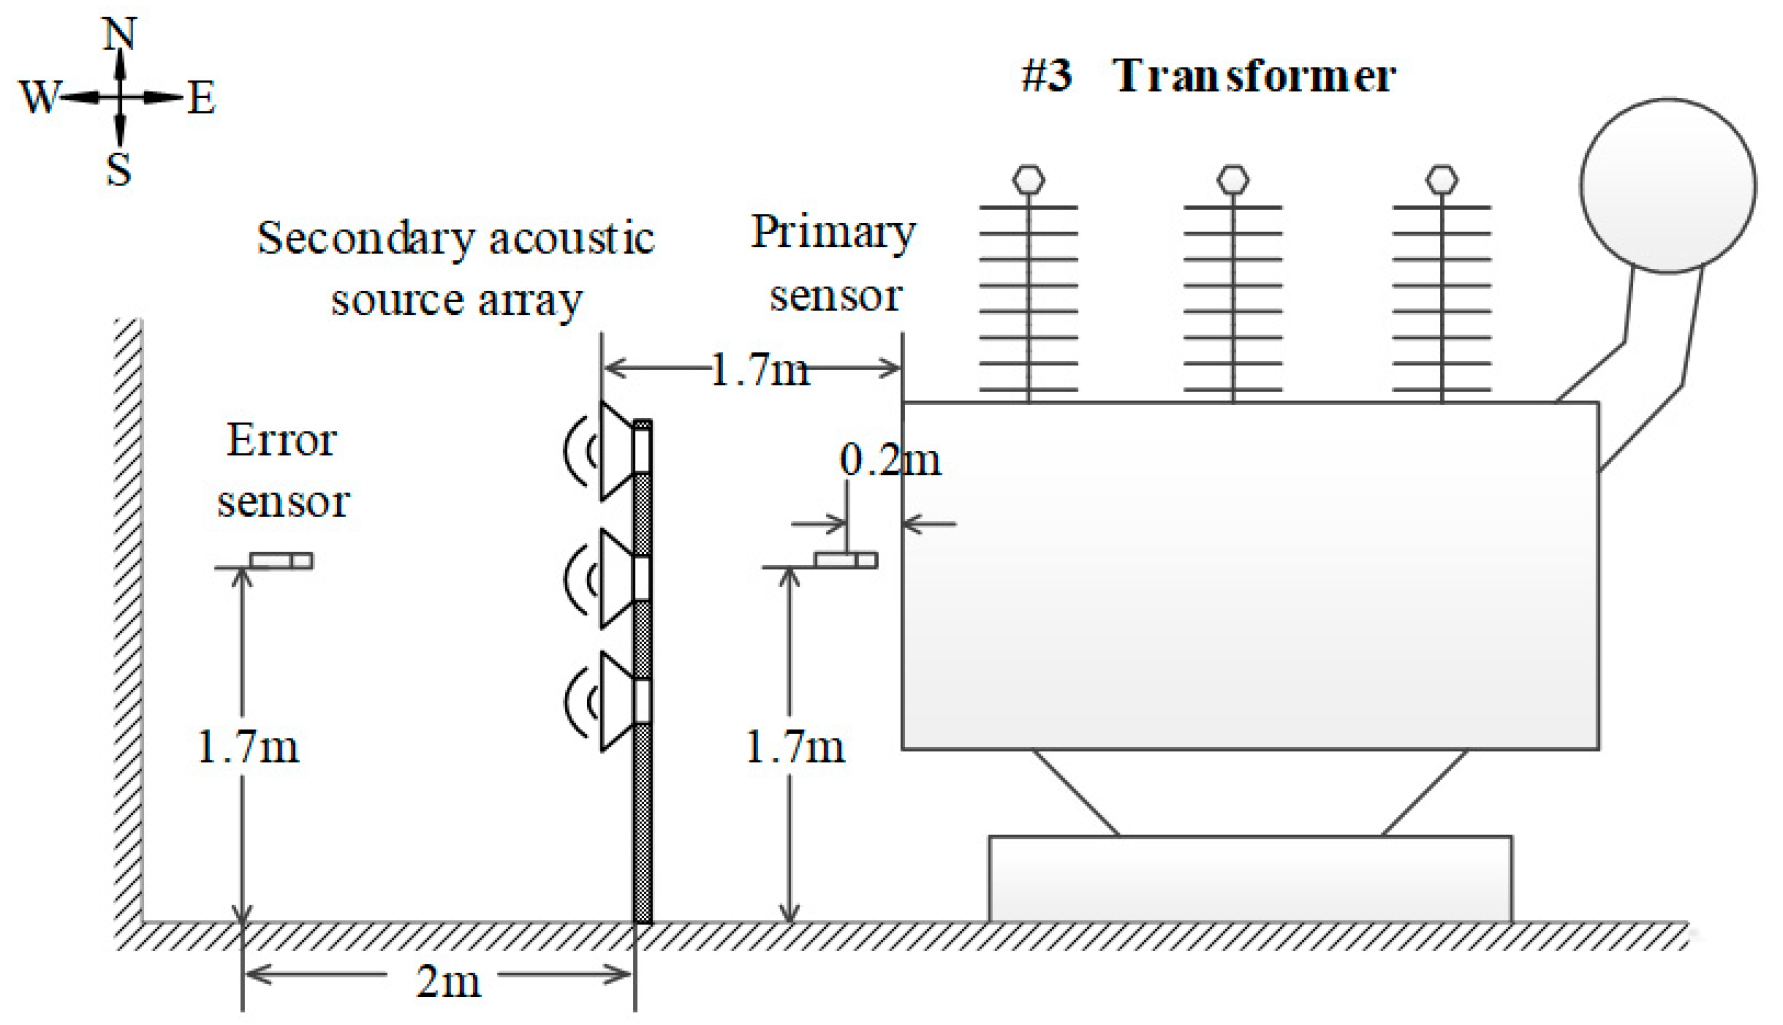
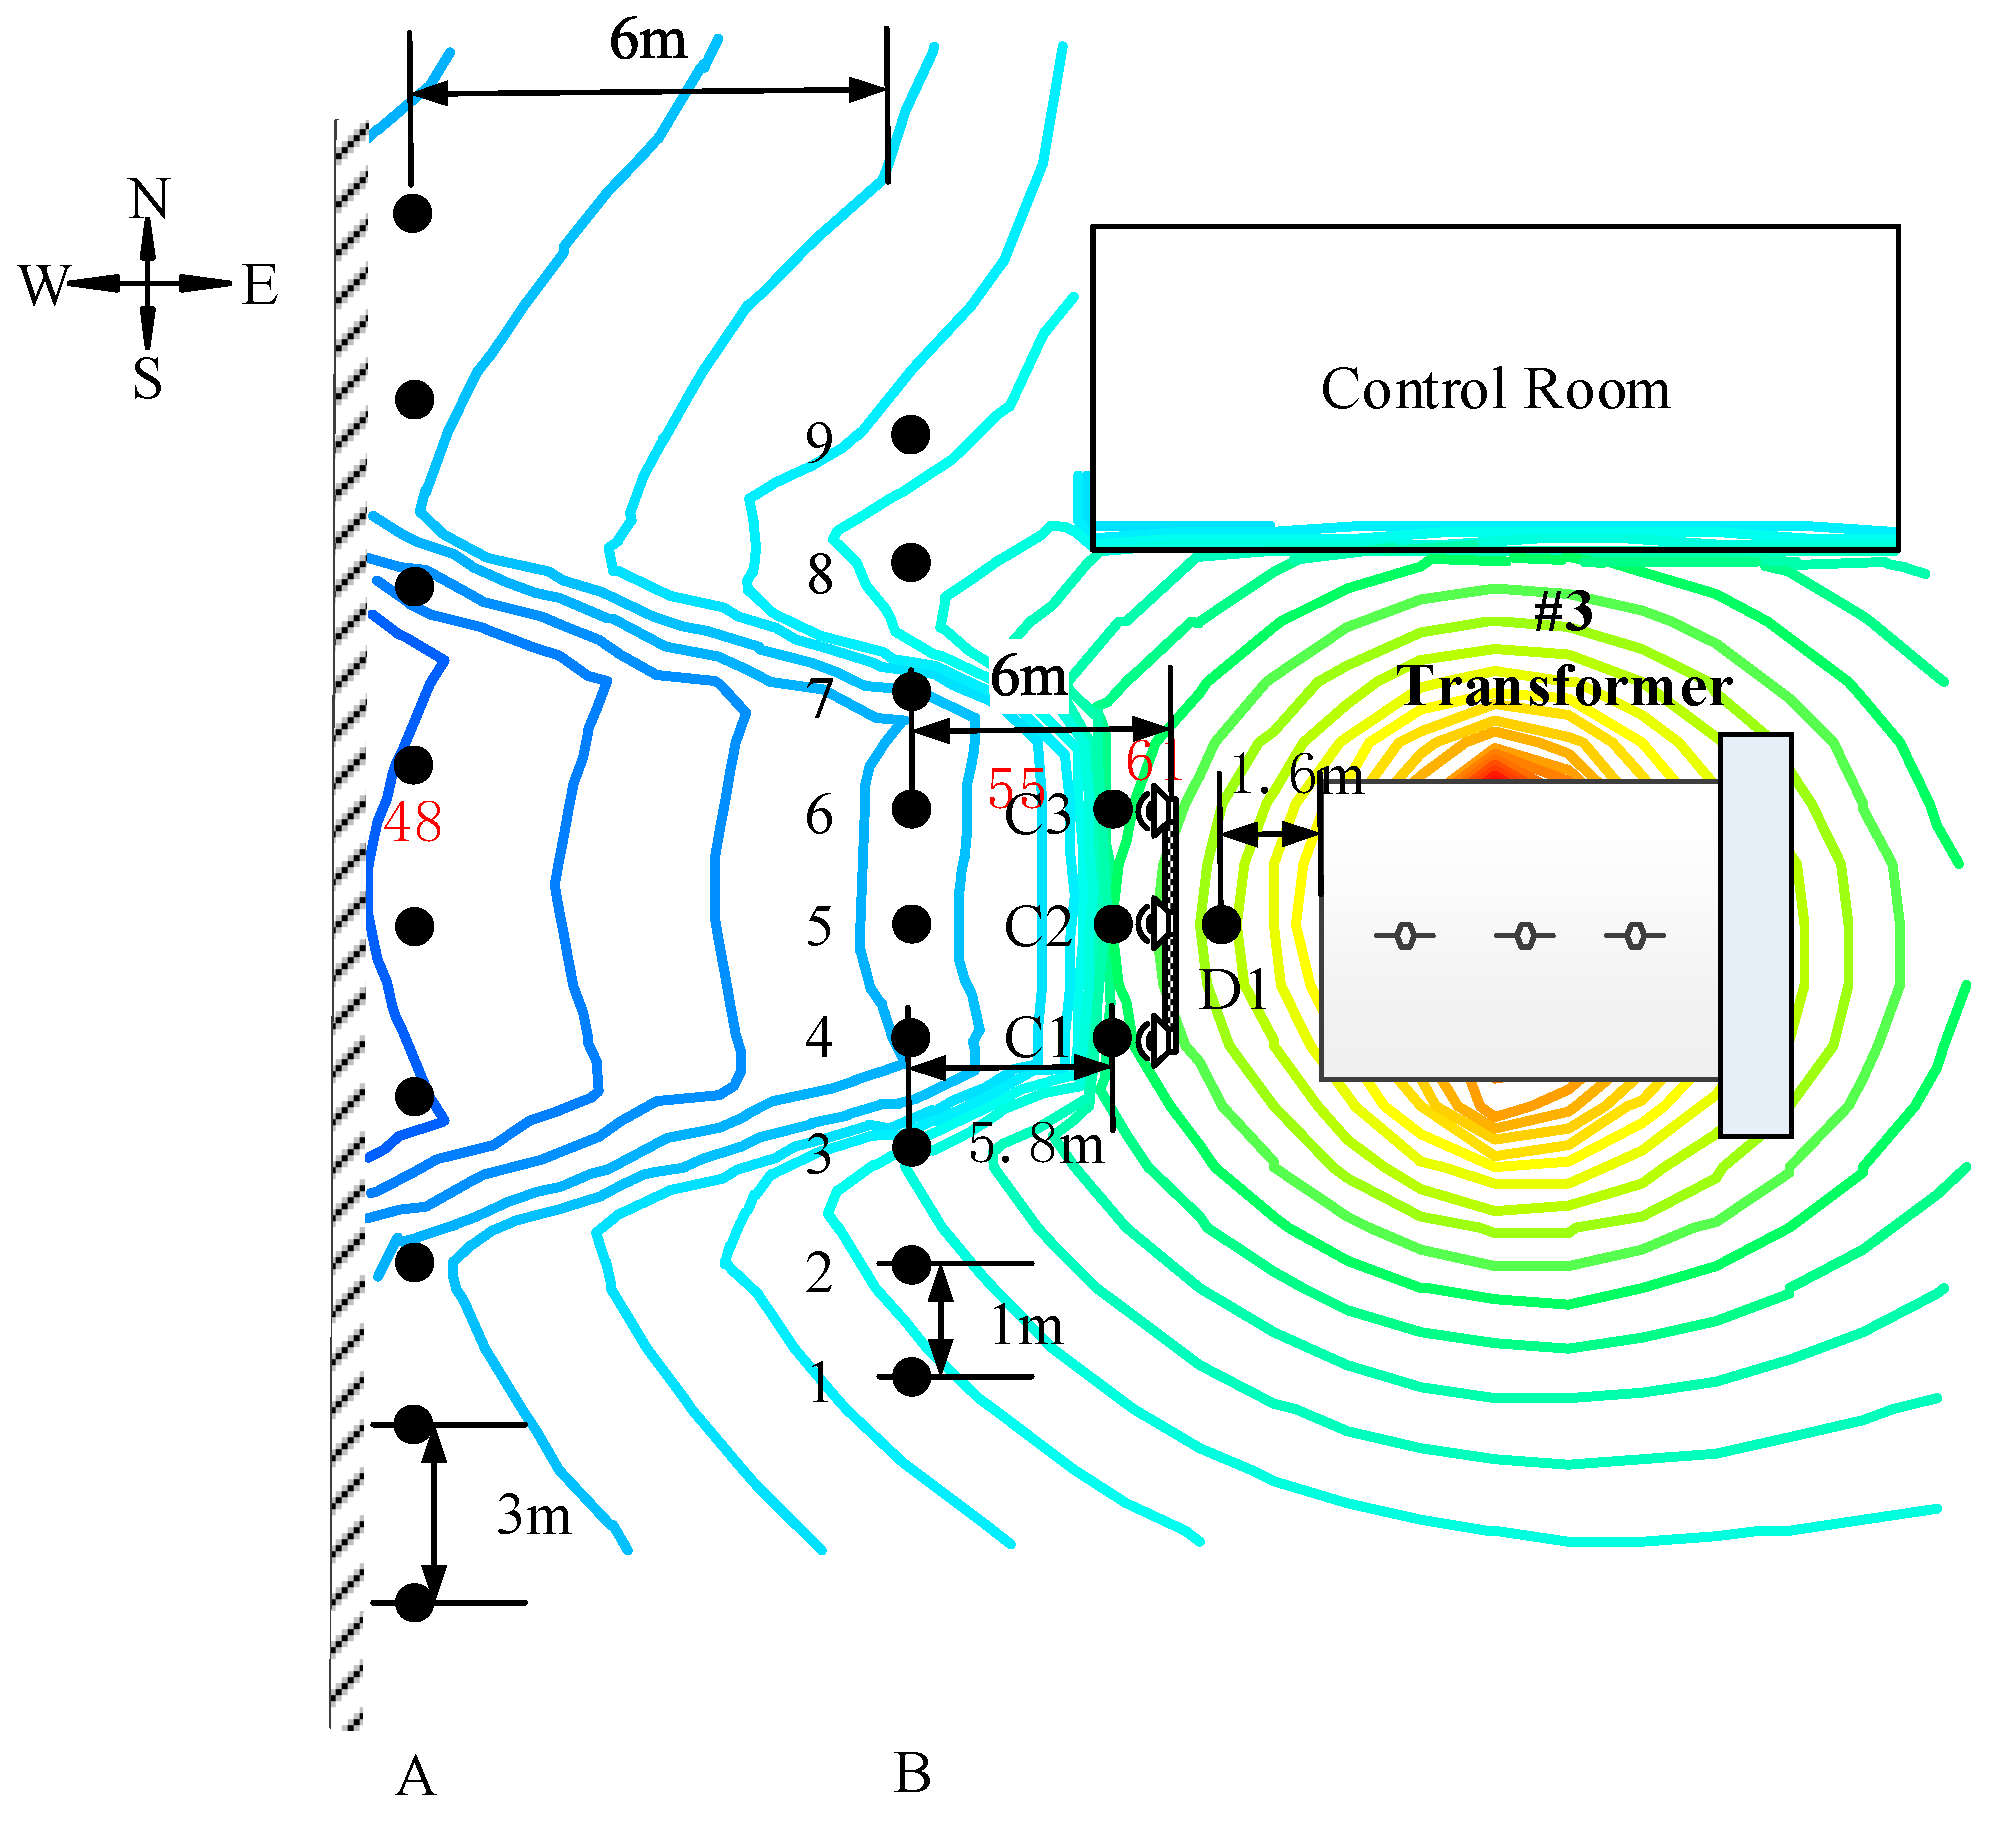
In theory, the distance between the primary sensor and the secondary sound source is much better. In this way, the maximum effect of the interference source on the primary sensor can be avoided. The smaller the distance between the primary acoustic channel and the secondary acoustic channel of the primary sensor and the secondary acoustic channel to the secondary sound source, the smaller the transmission delay of the acoustic channel, so as not to consider the transfer function of the acoustic channel in the control algorithm. No phase compensation is required. However, in the actual substation environment, the secondary sound source and the primary sensor need to meet the substation safety distance requirements. In addition, if the secondary sound source is too close to the primary sensor, the acoustic feedback makes the secondary sound source a new source of interference, which can even lead to algorithm failure and system instability. The position of the error sensor should not be too close or too far away from the secondary sound source. The farther the error sensor to the secondary sound source is, the greater the environmental noise will be. When the error sensor is too close to the secondary sound source, test results show that, due to the physical characteristics of the hardware equipment, the error sensor is greatly affected by the secondary sound and the spatial coupling noise of the secondary sound and the transformer noise cannot be collected accurately. Based on the above factors, this experiment will be the primary sensor layout to the safety permit required minimum distance, distance transformer 0.2 m; the distance between the error sensor to the secondary sound source is 2.5 m; the secondary sound source cloth from the primary sensor 1.7 m, for the 1.7 m secondary sound channel. It is necessary to make the corresponding phase compensation in the frequency output signal of the adaptive tracking algorithm. The layout of the electro-acoustic device and the distribution of the measuring points are shown in the Figure 10. A measuring point is arranged on the west side of No. 3 transformer to detect the effective noise reduction region of the ANC system prototype. The distance between each measuring point of A1 A10 is 3 m. The distance between each measuring point of B1 B10 is 1 m. The vertical distance between the B column and the secondary source is 3 m. The A column survey points are arranged at the station boundary, and the vertical distance from the secondary sound source is 6 m. The measuring point distribution is shown in Figure 11. The noise reduction experiment site is shown in Figure 12.
5. Results
A total of 10 time points are recorded at intervals of 5 minutes, and the average of the results of each test point at 10 time points is shown in Table 3. The sound map of this area is drawn from the measured data and the noise attenuation model represented by Equation (1), as shown in Figure 13. At the same time, at 100 Hz–500 Hz, these 5 noise components of the noise reduction effect observation, take A1 to A10 and B1 to B10 10 times the average measurement.
Analyzing Table 2 and Figure 13 show that the noise pressure level is decreased by 3 ± 0.8 dB(A) compared to that without applying ANC system when the secondary source faces toward the 0.2 m, i.e., the C1 to C3 position. At the B4 to B6 position, the noise pressure is decreased by 4 ± 0.8 dB(A) when the ANC system is not applied. At the C4 to C6 position, the station boundary, the noise pressure ratio decreased by 7 ± 0.3 dB(A) without ANC system on. In the four positions of B3, B7, A3, and A7, it is observed that the noise ratio increases with the increase of 1dB(A) to 1.5dB(A) when the ANC system is not applied, and there is no obvious change at other measuring points after the application of ANC system. It can be inferred that the effective noise reduction region of the ANC system prototype is the fan-shaped region with a forward angle of about 33 degrees of secondary acoustic source. There is a small noise reduction zone at the sector boundary. The possible reasons for this phenomenon is the speaker acoustic radiation has directivity, the positive direction of acoustic waveform is normal, while in the radiation path boundary may occur phase offset or other nonlinear distortion, leading to the location of the secondary sound source sound has become a new source of noise. In addition, as a noise source, the transformer box has many sounding points which radiate non-plane wave. And the reflection and refraction of sound on ground and wall lead to the complex coupling of spatial sound field, which is also the possible cause of this phenomenon.
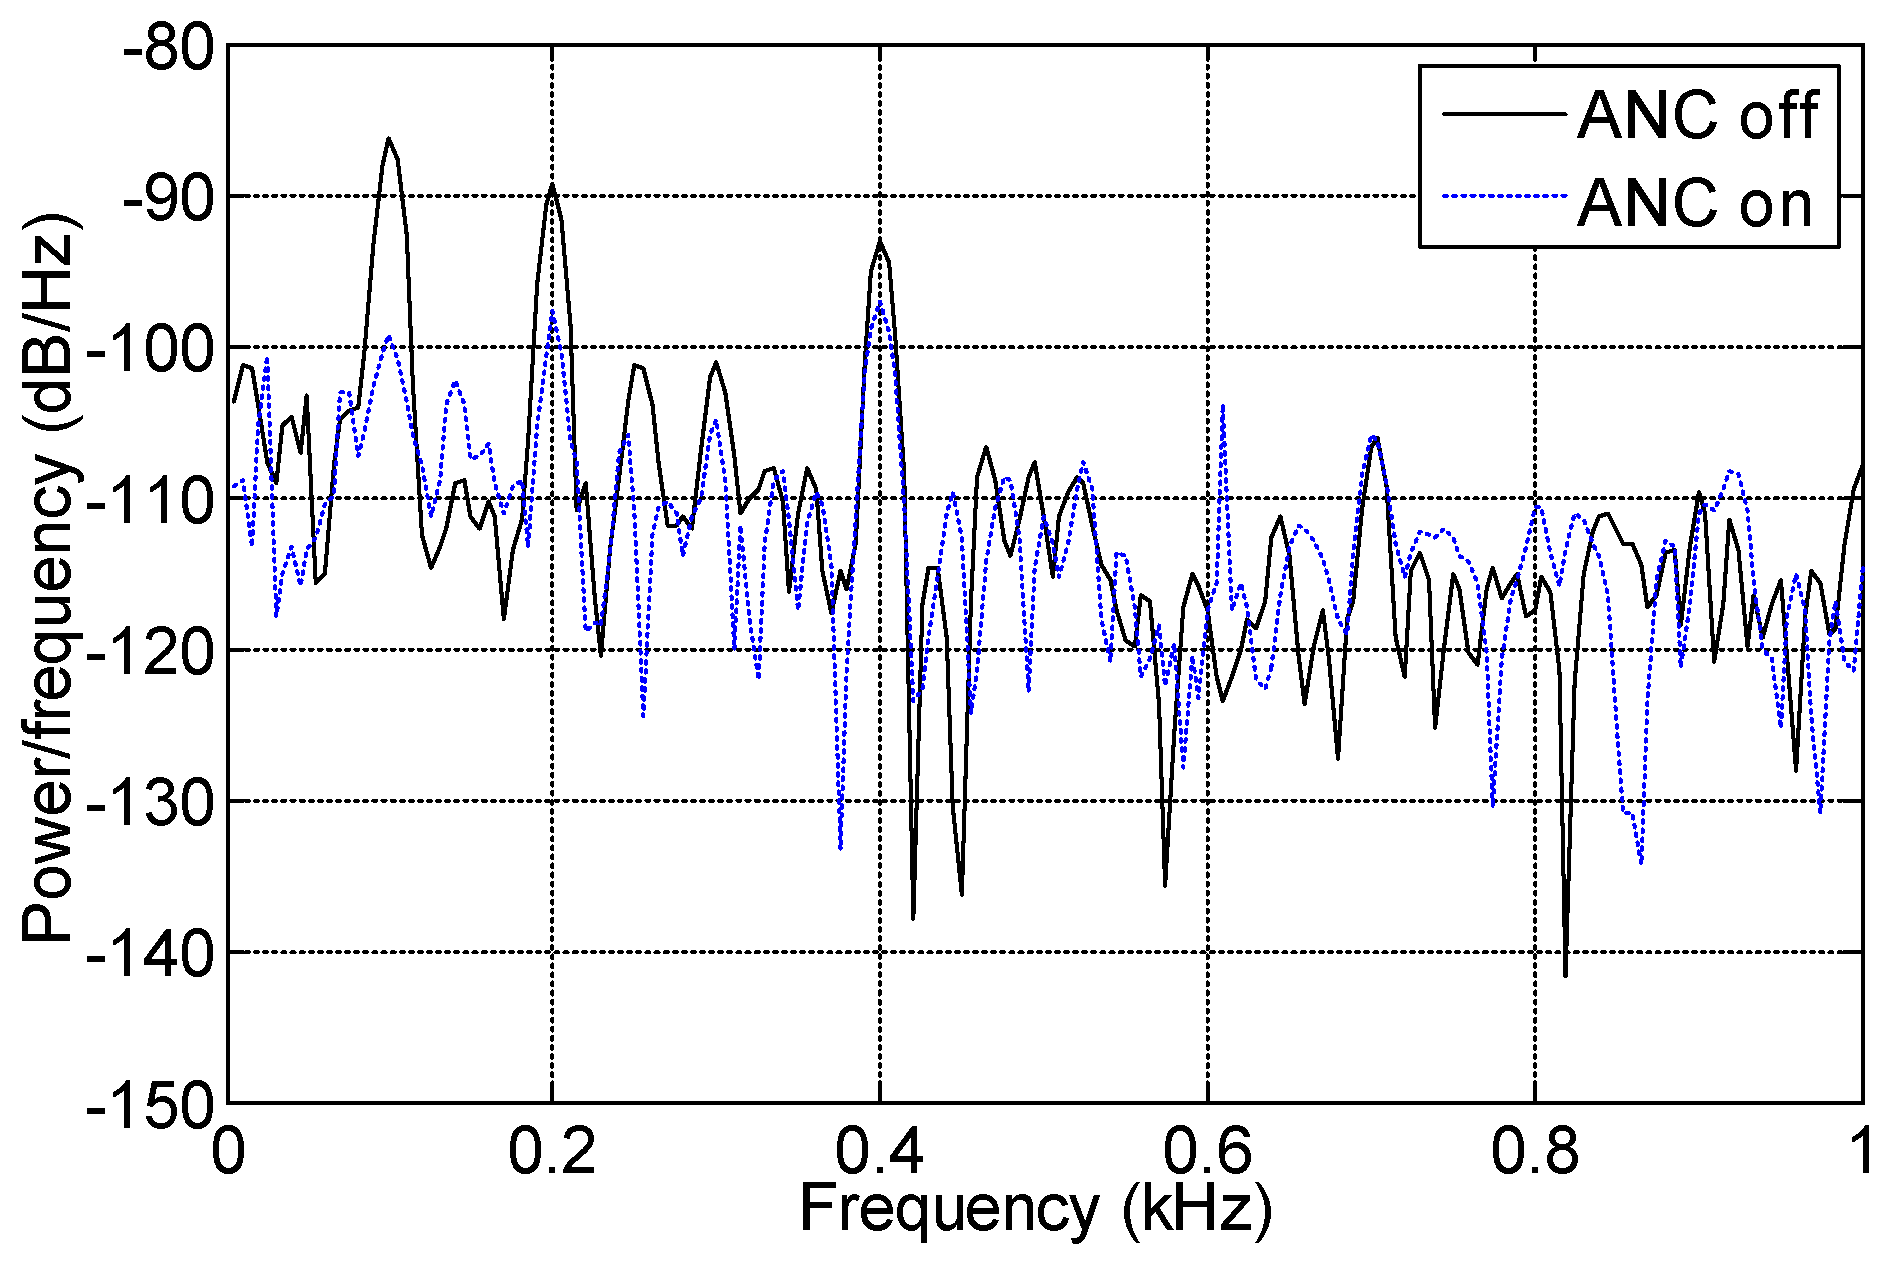
Figure 14 is a contrast analysis of the spectrum of noise signals before and after noise reduction.
Figure 14 shows that, the ANC system prototype proposed in this paper for the five noise components were effective. It has the biggest noise reduction effect on 100 Hz and with the increase of frequency, the noise reduction effect is gradually reduced. And there is no obvious noise reduction effect on the 500 Hz noise component. Possible reasons for this phenomenon are: first, the higher the frequency is, the shorter the acoustic wavelength is, and it makes the space radiation more complex. Second, in the control algorithm, it is difficult to achieve high-precision phase compensation in a high frequency control algorithm. Moreover, it has higher requirements for the performance of the algorithm.
6. Conclusions
In this paper, a noise active control system of power transformer based on an adaptive signal tracking method is proposed and implemented. The noise reduction experiment is carried out in a 220 kV substation, and the noise reduction effect is achieved in a certain area, which provides the basis for further application research. Through the analysis of the experimental process and the results concluded, the following conclusions:
- 1)
- Based on the signal tracking method, the active control algorithm of power transformer noise is easy and simple to calculate, and can be applied to the actual operation of the transformer noise reduction system. The power transformer active control system based on adaptive signal tracking method can operate in the substation, and can achieve the average noise reduction of 5dB(A) in the fan-shaped measurement area with the angle of 33°.
- 2)
- At present, the adaptive signal tracking method proposed in this paper only uses 100 Hz to 500 Hz noise component as the tracking target. The system has obvious effects on noise reduction of 100 Hz to 300 Hz frequency components, but it is not good for noise reduction of 500 Hz components. If the system can improve the tracking ability of the medium and high frequency noise components, the noise reduction performance can be further improved.
- 3)
- The secondary sound source array scheme proposed in this paper is only designed by empirical method. If the secondary noise source array scheme is optimized according to the radiation noise and attenuation characteristics of the transformer noise, it is expected to obtain a larger noise reduction area and better noise reduction effect.
- 4)
- Moreover, the proposed algorithm in this paper is a single channel algorithm, and the secondary sound signals emitted by nine secondary sources are the same. If radiation characteristics and spectrum energy of each component transformer noise are analyzed and a multi-channel system is used, the noise reduction capability of transformer ANC system will be further improved.
Author Contributions
Conceptualization, L.Y. and J.W.; data curation, J.W.; formal analysis, J.W. and Q.L.; funding acquisition, L.Y.; investigation, J.W. and D.W.; methodology, L.Y. and J.W.; project administration, L.Y.; resources, L.Y.; software, L.Y. and J.W.; supervision, L.Y.; validation, Q.L. and D.W.; writing-original draft, J.W.; writing-review and editing, Q.L.
Funding
This research was funded by National Science Foundation of China, grant number 51377123.
Conflicts of Interest
The authors declare no conflict of interest.
References
- Liu, S.W.; Liu, Y.; Li, H.; Lin, F.C. Diagnosis of Transformer Winding Faults Based on FEM Simulation and On-site Experiments. IEEE Trans. Dielectr. Electr. Insul. 2016, 23, 3752–3760. [Google Scholar] [CrossRef]
- Hansen, C.; Snyder, S.; Qiu, X.J. Active Control of Noise and Vibration, 2nd ed.; CRC Press: Boca Raton, FL, USA, 2012; pp. 8–13. [Google Scholar]
- Haykin, S.O. Adaptive Filter Theory, 5th ed.; Prentice Hall Press: Englewood, NJ, USA, 2001; pp. 224–226. [Google Scholar]
- Teoh, C.; Soh, K.; Zhou, R.; Tien, D. Active noise control of transformer noise. IEEE Conf. Energy Manag. Power Deliv. 1998, 1, 747–753. [Google Scholar]
- Kim, Y.D.; Shim, J.M.; Park, K.S.; Jeong, Y.M.; Lee, D.D. Structure vibration analysis and active noise control of a power transformer by mobility measurement. Conf. Cont. Automot. Energy Syst. Eng. 2011, 256, 322–332. [Google Scholar]
- Qiu, X.J.; Hansen, C.H. An Algorithm for active control of transformer noise with on-line cancellation. J. Sound Vib. 2001, 24, 647–665. [Google Scholar] [CrossRef]
- Qiu, X.J.; Li, X.; Ai, Y.T.; Hansen, C. A waveform synthesis algorithm for active control of transformer noise implementation. Appl. Acoust. 2002, 63, 467–479. [Google Scholar] [CrossRef]
- Zhang, L.M.; Tao, J.C.; Qiu, X.J. Active control of transformer noise with an internally synthesized reference signal. J. Sound Vib. 2011, 331, 3466–3475. [Google Scholar] [CrossRef]
- Das, D.P.; Moreau, D.J.; Cazzolato, B.S. Active control of transformer noise by using power line signal as reference. IEEE Conf. Ind. Electron. Appl. 2012, 1, 953–956. [Google Scholar]
- Zou, H.S.; Huang, X.F.; Hu, S.; Qiu, X.J. Applying an active noise barrier on a 110 KV power transformer in Hunan. In Proceedings of the Internoise 2014—43rd International Congress on Noise Control Engineering, Melbourne, Australia, 16–19 November 2014; 2014; Volume 3, pp. 1–7. [Google Scholar]
- Hu, S.; Chen, S.Y.; Zou, H.S.; Li, T.N. Research on the application of active sound barriers for the transformer noise abatement. Conf. Mater. Sci. Eng. Chem. 2016, 44, 2059–2063. [Google Scholar] [CrossRef]
- Borchi, F.; Carfagni, M.; Martelli, L.; Turchi, A.; Argenti, F. Design and experimental tests of active control barriers for low-frequency stationary noise reduction in urban outdoor environment. Appl. Acoust. 2016, 114, 125–135. [Google Scholar] [CrossRef]
- Dayou, M. Handbook of Noise and Vibration Control Engineering; China Machine Press: Beijing, China, 2002; pp. 138–142. [Google Scholar]
- Ming, R.S.; Pan, J.; Norton, M.P.; Wende, S.; Huang, H. The sound-field characterization of a power transformer. Appl. Acoust. 1999, 56, 257–272. [Google Scholar] [CrossRef]
- Ertl, M.; Voss, S. The role of load harmonics in audible noise of electrical transformers. J. Sound Vib. 2014, 333, 2253–2270. [Google Scholar] [CrossRef]
- Environmental Quality Standard for Noise in China. GB 3096-2008; China Environmental Science Press: Beijing, China, 2008; pp. 6–7.
- Lauterborn, W. Nonlinear acoustics and acoustic chaos, sound-flow interactions. Lect. Notes Phys. 2002, 586, 265–284. [Google Scholar]
- Luo, L.; Sun, J.W.; Huang, B.Y. A novel feedback active noise control for broadband chaotic noise and random noise. Appl. Acoust. 2017, 116, 229–237. [Google Scholar] [CrossRef] [Green Version]
- Behera, S.K.; Das, D.P.; Subudhi, B. Functional link artificial neural network applied to active noise control of a mixture of tonal and chaotic noise. Appl. Soft Comput. 2014, 23, 51–60. [Google Scholar] [CrossRef]
- Femia, N.; Petrone, G.; Spagnuolo, G. Optimization of perturb and observe maximum power point tracking method. IEEE Trans. Power Electron. 2005, 20, 963–973. [Google Scholar] [CrossRef]
- Kuo, S.M.; Morgan, D.R. Active Noise Control Systems: Algorithms and DSP Implementations; Wiley Press: New York, NY, USA, 1996. [Google Scholar]
- Butterwech, H.J. A wave theory of long adaptive filters. IEEE Trans. Circuits Syst. 2001, 1, 739–747. [Google Scholar] [CrossRef]
Figure 1.
Sketch of substation structure and location of measuring point.

Figure 2.
The sound pressure variation of the transformer noise. (a) A9; (b) H2.

Figure 3.
The time domain and frequency spectrum at H2. (a) Time-domain signal; (b) Frequency spectrum
Figure 3.
The time domain and frequency spectrum at H2. (a) Time-domain signal; (b) Frequency spectrum

Figure 4.
Contour distribution map.

Figure 5.
Algorithm flow chart.

Figure 6.
Flowchart of disturbance tracking module.

Figure 7.
Simulation results.

Figure 8.
Simulation results.

Figure 9.
Secondary source array structure.

Figure 10.
Schematic diagram of experimental site.

Figure 11.
Location diagram of measuring point.

Figure 12.
Experimental field. (a) Control system; (b) Error sensor and secondary source array; (c) Primary sensor; (d) Noise measuring meter.
Figure 12.
Experimental field. (a) Control system; (b) Error sensor and secondary source array; (c) Primary sensor; (d) Noise measuring meter.

Figure 13.
Noise reduction contour map.

Figure 14.
Spectrum analysis of ANC on and off.


Table 1.
The sound pressure level of five frequency components.
| Frequency | 100 Hz | 200 Hz | 300 Hz | 400 Hz | 500 Hz |
|---|---|---|---|---|---|
| Sound Pressure Level(dB(A)) | 72.93 | 69.29 | 49.54 | 63.23 | 42.37 |
Table 2.
The sound pressure level (dB(A)) of the measuring point.
| ANC off | Adaptive Tracking Method | LMS | FxLMS | |
|---|---|---|---|---|
| X1 | 59.4 | 53.7 | 57.9 | 61.7 |
| X2 | 52.9 | 48.0 | 52.1 | 58.9 |
Table 3.
The average sound pressure level (dB(A)) of the measuring point.
| 1 | 2 | 3 | 4 | 5 | 6 | 7 | 8 | 9 | |
|---|---|---|---|---|---|---|---|---|---|
| A | 53.7 | 54.3 | 52.1 | 47.8 | 48.3 | 48.0 | 53.6 | 55.7 | 53.4 |
| B | 57.6 | 58.4 | 59.3 | 55.2 | 55.8 | 54.6 | 59.7 | 59.5 | 58.9 |
| C | 56.3 | 56.1 | 55.5 | ||||||
| D | 61.6 |
© 2019 by the authors. Licensee MDPI, Basel, Switzerland. This article is an open access article distributed under the terms and conditions of the Creative Commons Attribution (CC BY) license (http://creativecommons.org/licenses/by/4.0/).
Share and Cite
MDPI and ACS Style
Ying, L.; Wang, J.; Liu, Q.; Wang, D. Application Study of Adaptive Tracking Algorithm in Active Noise Control System of Transformer. Appl. Sci. 2019, 9, 2693. https://doi.org/10.3390/app9132693
AMA Style
Ying L, Wang J, Liu Q, Wang D. Application Study of Adaptive Tracking Algorithm in Active Noise Control System of Transformer. Applied Sciences. 2019; 9(13):2693. https://doi.org/10.3390/app9132693
Chicago/Turabian StyleYing, Liming, Jinwei Wang, Qin Liu, and Donghui Wang. 2019. "Application Study of Adaptive Tracking Algorithm in Active Noise Control System of Transformer" Applied Sciences 9, no. 13: 2693. https://doi.org/10.3390/app9132693
Note that from the first issue of 2016, this journal uses article numbers instead of page numbers. See further details here.