Article

VHCF Response up to 109 Cycles of SLM AlSi10Mg Specimens Built in a Vertical Direction

1
Department of Mechanical and Aerospace Engineering, Politecnico di Torino, 10129 Turin, Italy
2
CNR ICMATE–Institute of Condensed Matter Chemistry and Technologies for Energy, 23900 Lecco, Italy
*
Author to whom correspondence should be addressed.
Appl. Sci. 2019, 9(15), 2954; https://doi.org/10.3390/app9152954
Submission received: 27 June 2019 / Revised: 16 July 2019 / Accepted: 22 July 2019 / Published: 24 July 2019
(This article belongs to the Special Issue Fatigue Damage of Additively Manufactured Parts)

Abstract

:
It is well-known that many manufacturing parameters affect the quasi-static and the fatigue response of additive manufacturing (AM) parts. In particular, due to the layer-by-layer production, the load orientation, with respect to the building direction, plays a fundamental role for the fatigue response. This paper investigates the fatigue response up to 109 cycles (very high cycle fatigue (VHCF)) of selective laser melting (SLM) AlSi10Mg specimens built in a vertical direction. Ultrasonic tension-compression tests (stress ratio of –1) are carried out on as-built Gaussian specimens with a large loaded volume (2300 mm3). Fracture surfaces are investigated with the scanning electron microscope to analyze the defects originating the VHCF failure. Probabilistic S-N curves are estimated and analyzed. Experimental results confirm that the defect size controls the VHCF response, thus highlighting the importance of testing large risk volumes for a reliable assessment of VHCF behavior. The average value of the VHCF strength is close to that of the hourglass specimen tested in the literature. The variability of the VHCF strength is instead significantly larger, due to the scattered size distribution of the defects located near the specimen surface, which is the most critical region for crack initiation.

1. Introduction

In the last few years, the use of components produced through additive manufacturing (AM) processes is rapidly growing in many industrial applications. AM parts are currently employed in applications subjected to static loads at room and high temperature [1,2], such as brackets [3], medical devices [4], or heat exchangers [5]; however, their use is still limited for applications subjected to fatigue loads [6,7]. Among the employed alloys, the ones belonging to the Al-Si system are drawing considerable interest thanks to their good mechanical properties and low density. The resulting microstructure of Al-Si produced by AM is much finer than the microstructure obtained by conventional casting, thanks to the high cooling rates associated to the solidification of a limited liquid pool during the layer-by-layer manufacturing. Indeed, cast alloys display a coarse microstructure with eutectic Si appearing as brittle large plates or needles [8]. On the other hand, the AMed microstructure of Al-Si alloys obtained by selective laser melting (SLM) or laser metal wire deposition [9] consists of an interconnected Al-Si eutectic structure, with small grains distributed inside superimposed melt pools. These features, together with the high powder purity that ensures the absence of the detrimental Fe-rich inclusions/precipitates, has been reported to positively affect the material mechanical resistance, in both static and cyclic conditions. However, the high surface roughness and the large defects originating during the building process are detrimental for the fatigue response of as-built AM parts and prevent their use in many structural applications. University and industry research efforts (see [6,7] and the references therein) are therefore currently focusing on the mechanisms of damage and failure of AM parts subjected to fatigue loads and on the effect of process parameters and post-process treatments on the fatigue behavior, with the aim of proposing reliable design methodologies [10] that would guarantee the structural integrity of AM parts and would satisfy the safety standard required in many critical structural applications.
Many research and experimental tests have been carried out in the literature to investigate the fatigue response of AM parts, focusing mainly on the low cycle fatigue (LCF) [11] and the high cycle fatigue (HCF) response [12,13]. Regarding the HCF response, the effect of process parameters [14], heat treatments [15], defect size, and morphology [16] has been widely investigated. Moreover, there is increasing interest on the very high cycle fatigue (VHCF) behavior of AM parts, since in many structural applications the required fatigue life is significantly larger than that assessed through HCF tests. In particular, the VHCF response of AM Ti6Al4V [17,18], AlSi12 [19], and AlSi10Mg [20,21,22] alloys has been recently investigated in the literature. As for the AM AlSi10Mg alloy, the VHCF response up to 109 cycles of as-built and stress-relieved Gaussian specimens with horizontal building direction was studied in [20,21], respectively. Siddique et al. [22] investigated the VHCF response up to 10 8 cycles of AM AlSi10Mg hourglass specimens with a vertical building direction. In particular, in [22], the positive effect of platform heating, which affects the defect morphology and microstructure, was experimentally assessed, and a pore-crack interaction mechanism during crack propagation was shown through X-ray computed tomography. At present, even though it is well-known that size effects significantly influence the VHCF response of wrought [23] and AM parts [24], no experimental tests have been carried out on AM AlSi10Mg specimens with a large risk volume (i.e., the volume of the material subjected to a stress amplitude larger than 90% of the maximum applied stress [25]) and a vertical building direction.
In this paper, the VHCF response of selective laser melting (SLM) AlSi10Mg specimens with a built in vertical direction is experimentally assessed. Fully reversed ultrasonic (load frequency of 20 kHz) tension-compression tests are carried by using the ultrasonic testing machines available at the Politecnico di Torino. Gaussian specimens [25] with a risk volume (2300 mm3) significantly larger than the largest tested in the literature [22], are fatigue-tested to assess the effect of the specimen size on the VHCF response. Gaussian specimens were originally designed at the Politecnico di Torino for the assessment of the size effect in VHCF through ultrasonic fatigue tests. Hourglass and dog-bone specimens commonly used do not permit to test large volume; in particular, the maximum attainable risk volume in dog-bone specimens is limited, since the stress amplitude distribution in the specimen part with a constant cross-section is not uniform and decreases from the maximum value reached at the specimen centre. In Gaussian specimens, the profile of the gauge length is described by a Gaussian function, which ensures a uniform stress distribution and permits to significantly increase the tested risk volume and more properly investigate the size effect.

2. Materials and Methods

2.1. AlSi10Mg Alloy and Process Parameters

The chemical composition of the spherical AlSi10Mg powder has a size between 20 µm and 63 µm and an average size of approximately 45 µm, and the process parameters that were selected for the specimen production are reported in Table 1. All the specimens were manufactured with an SLM solutions machine (model 500 HL quad 4 × 400 W), using a hatch and contour scanning strategy. Although it is known from literature that different scanning strategies can heavily affect both static and cyclic mechanical behavior of SLMed materials [26], the scanning strategy was kept constant in the present work in order to obtain results comparable with literature data. The SLM process was performed under argon atmosphere.
After the cutting of the samples, metallurgical preparation of the surfaces was implemented for observing the microstructure of the as-built samples etched in Keller’s reagent. The tensile properties and the microhardness were also experimentally assessed. Tensile tests were performed with an MTS 2/M testing machine on three dog-bone specimens, following the recommendations of the ASTM E8/E8M-09 standard. The strain during the test was measured with an extensometer. The microhardness was also measured both in the centre and in the sub-surface area of the samples, according to the ISO 6507-1 standard and [20,21]. Using a Future Tech Corporation FM-700 tester, the testing was performed with 200 g load applied for 15 s. The experimental results are discussed in Section 3.1.

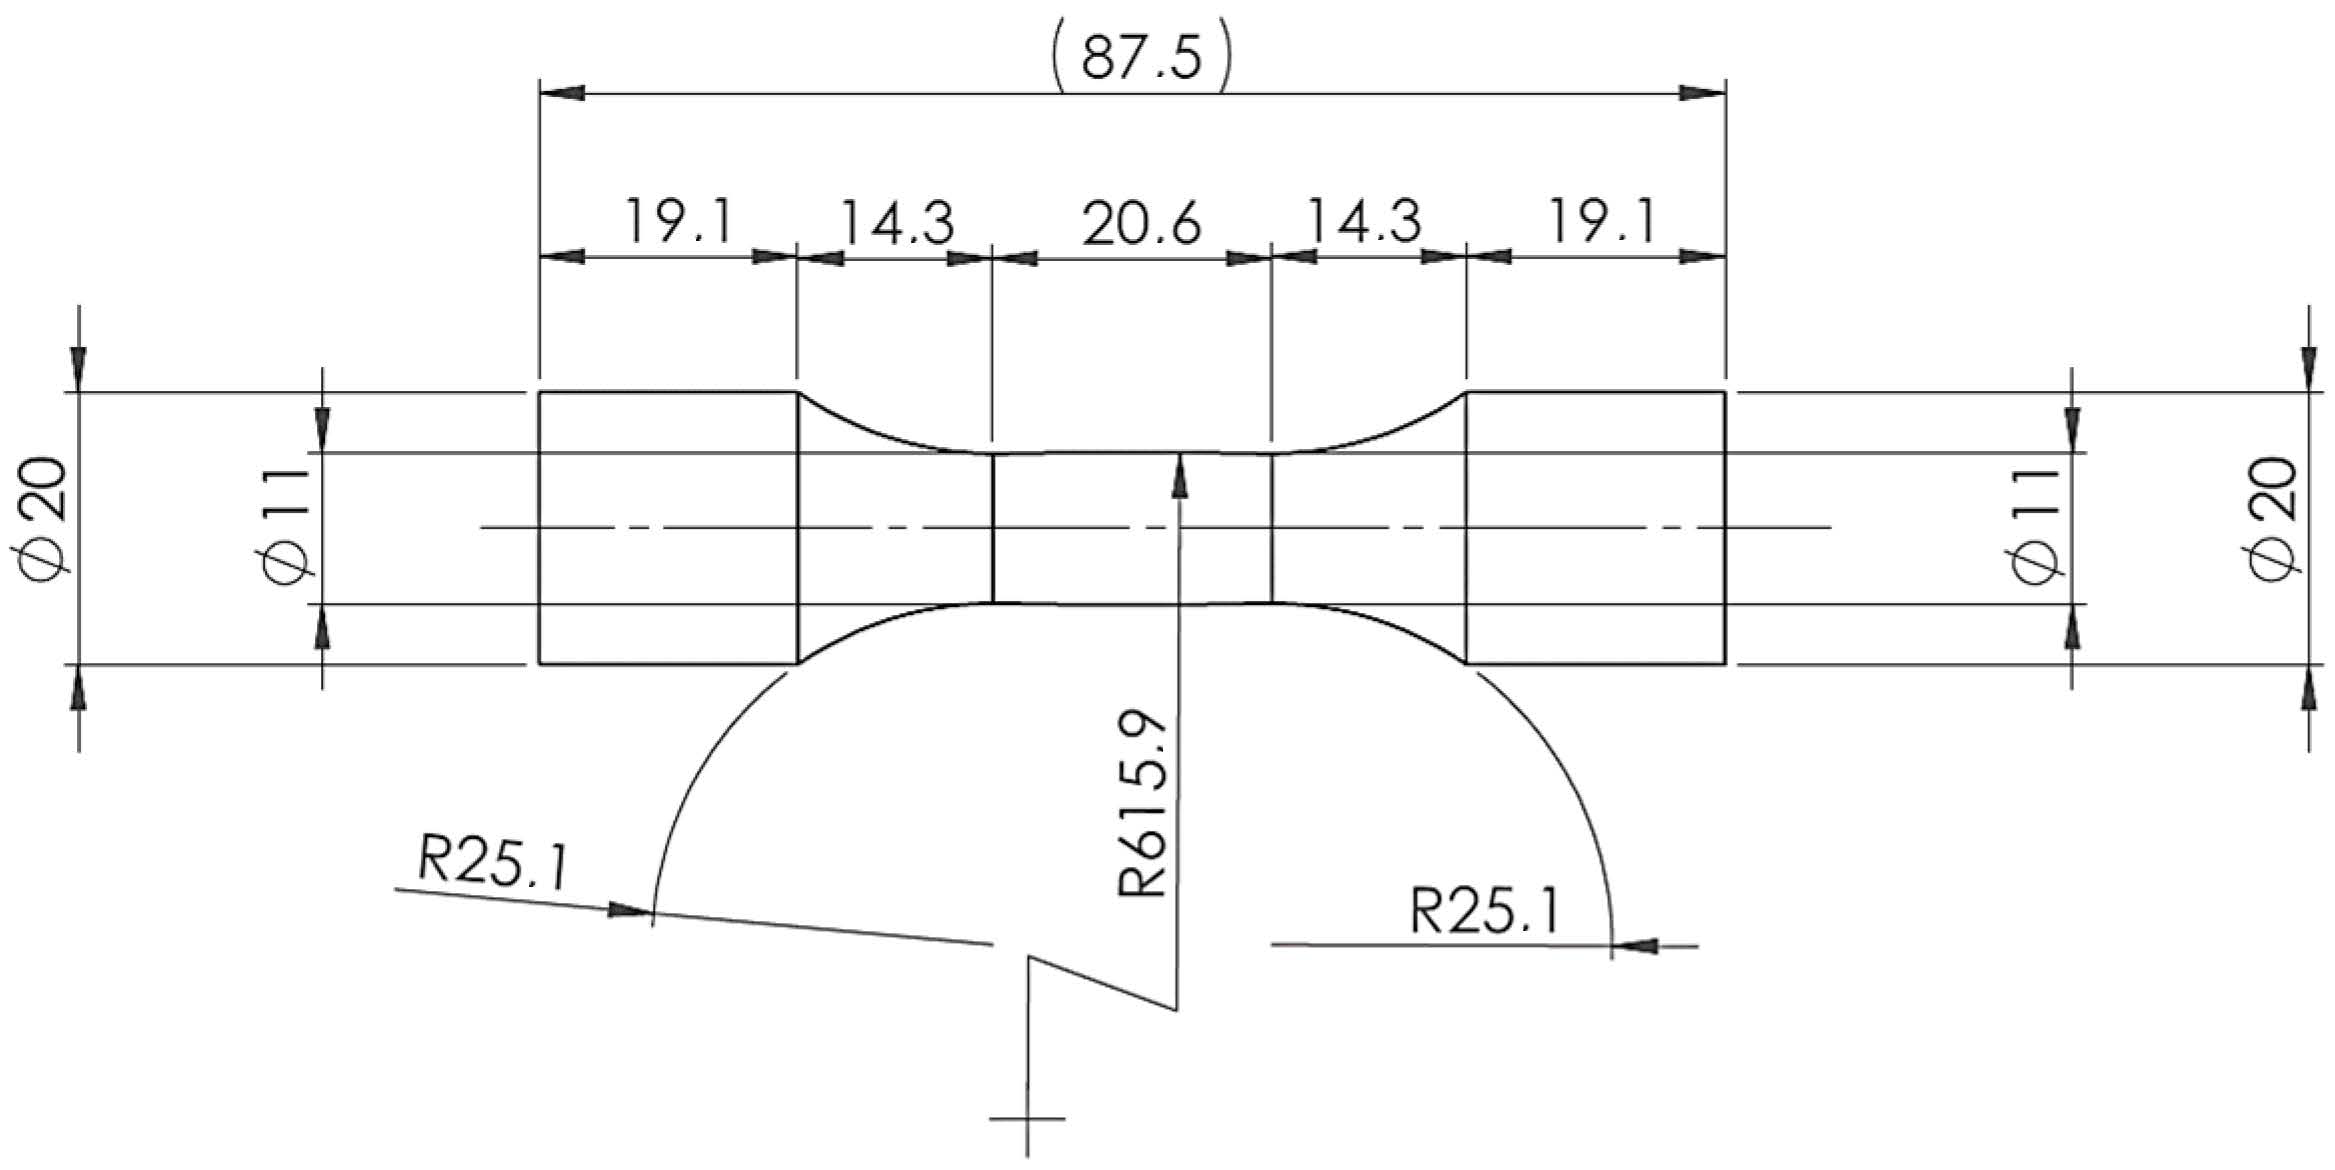
2.2. Ultrasonic Fatigue Tests

Fatigue tests at a loading frequency of 20   kHz were carried out with an ultrasonic testing machine. Constant stress amplitude tension-compression fatigue tests (stress ratio equal to −1) were performed up to 109 cycles (runout specimens). For details on the testing setup, on the closed loop system control developed to maintain the stress amplitude constant and on the limits on temperature increment, the reader was referred to [20,21,27].
Gaussian specimens [25,27,28] with large risk volume V 90 [29] of 2300   mm 3 were tested. According to the VHCF literature [23,29,30,31,32], the size effect influences the VHCF response and, as shown in [31], the prediction of the VHCF response of components with very large risk volume can be dangerously not conservative through tests on small risk volume specimens. The Gaussian specimen profile was analytically designed by the research group of the Politecnico di Torino to investigate the size effect in VHCF through ultrasonic fatigue tests. In particular, by solving the Webster’s equation for a plane wave, it was found that the profile ensuring a uniform stress distribution is described by a Gaussian function [25]. The Gaussian specimen was thereafter numerically verified and experimentally validated and finally adopted by the authors for several experimental tests [20,21,27,28]. For more details on the Gaussian specimen design, the reader is referred to [25,27] and references therein.
Following a standard procedure [20,21], specimens were mechanically polished with sandpapers with grit in the range ( 240 1000 ) in order to investigate the influence of both surface and internal defects on the VHCF behavior and avoid fatigue failures from large superficial scratches at a number of cycles below 105. In particular, specimens were polished in order to smooth the external surface and avoid premature failures at a number of cycles below 10 4 and, therefore, not in the VHCF region. Indeed, through a mechanical polishing process with sandpapers, only a thin layer of material was removed (about 0.1 mm) and, therefore, it was possible to investigate the role of both sub-surface and internal defects. On the other hand, with a machining process, a larger layer of material (i.e., more than 1 mm) was removed and the influence of critical sub-surface defects could not be properly assessed.
The final surface roughness was equal to 1.66 ± 0.14 µm. The Gaussian specimen geometry is shown in Figure 1.
After the fatigue tests, fracture surfaces were investigated with the scanning electron microscope (SEM) to analyze the defects originating the fatigue crack. The feasibility of ultrasonic tests on large Gaussian specimens, which was the main objective of the paper published by the authors in [20], is further attested in the present paper. Probabilistic S-N (P-S-N) curves are estimated through a statistical model proposed by the authors. The experimental results are compared with those obtained through tests on smaller hourglass AlSi10Mg specimens vertically built and produced with similar process parameters [22]. At present, the experimental results in [22] are the only results available in the literature for AlSi10Mg specimens built in a vertical direction and tested above 10 8 cycles. Even if the specimen type and the post-treatment (machining after the AM building process) are different in [22], the comparison permitted to highlight and justify the large scatter that was found experimentally and to confirm the importance of testing as-built specimens with large risk volume.

3. Results

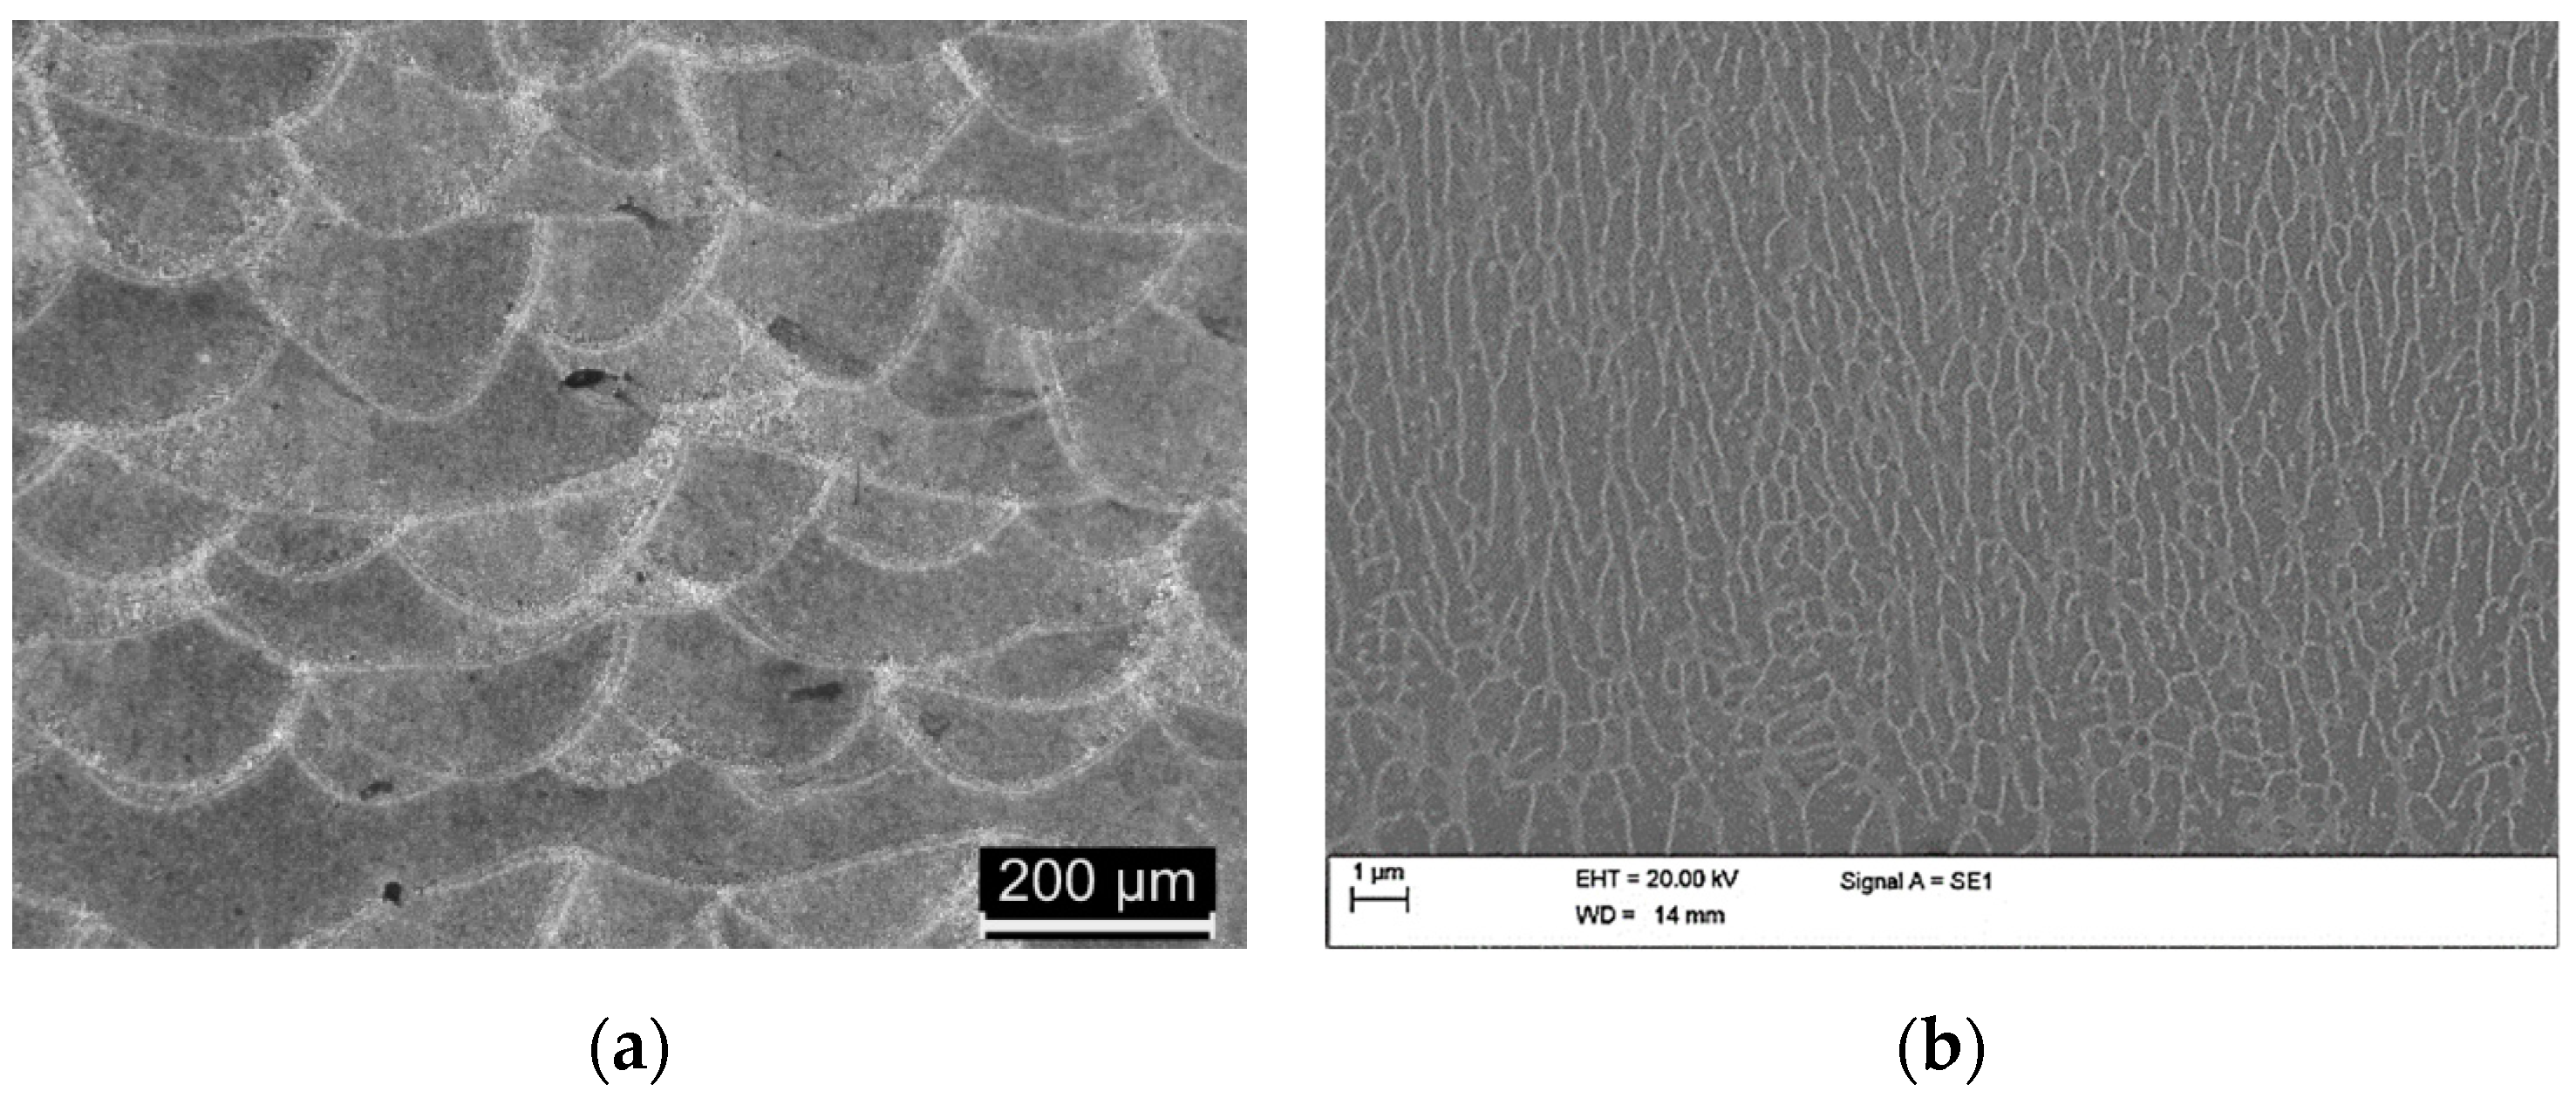
3.1. Microstructural Analysis

Cross-sections perpendicular to the vertical building direction are shown in Figure 2 at low and high magnifications. Macroscopically, the samples put in evidence the layer-by-layer building strategy, which is typical of the SLM process. They are constituted of overlapping melt pools, which appear half-cylindrical in shape and comprise an internal fine fusion zone and an outer coarser heat-affected zone. Moreover, two types of defects, which are known to be possible crack-initiation sites [20], are visible in the reported micrograph; a lack-of-fusion defect, originating from insufficient melting of powder, in the center of the picture and a spherical pore, due to vaporization induced by excessive heating, in the lower part of the image. In Figure 2b (higher magnification), the supersaturated aluminum matrix appears to be surrounded by an almost continuous eutectic Si network [15], which is elongated along the building direction due to the parallel thermal gradient [33,34].

3.2. Quasi-Static Test Results

Table 2 summarizes the results of the tensile tests and the micro-hardness measurements. The average tensile strength, σ u , the elongation to failure, ε f , and the Vickers hardness are reported in Table 2.
The tensile strength obtained in the present paper (line 1 in Table 2) is 24% larger than that obtained by testing wrought AlSi10Mg specimens [35]. The average σ u and ε f   values are slightly smaller (with a difference of about 30   MPa and 0.7 % ) than the corresponding values obtained in the literature for the AlSi10Mg alloy [22]. The difference may actually be considered as negligible, since, in [22], mechanical tests were performed on machined samples, thus reducing the influence of surface defects on final fracture conditions. This hypothesis is further confirmed by yield stresses being very similar in [22] and in the present work (about 260 MPa). On the contrary, the average Vickers hardness is significantly larger than that found in [22], presumably due to the different heat transfer generated during the SLM processes. In detail, even if similar process conditions are used in the current work and in [22], the scanning strategies are different, and the power distribution of the laser beam is not reported. This is consistent with different width/penetration ratios of the liquid pools in the present work and in [22]. Therefore, it can be affirmed that the reduced overheating that occurred in the present work originated higher microhardness values. This is in good agreement with previous studies, in which different energy densities [36] and different emission modes [37] induced significant variations of the microhardness of AlSi10Mg SLMed samples.

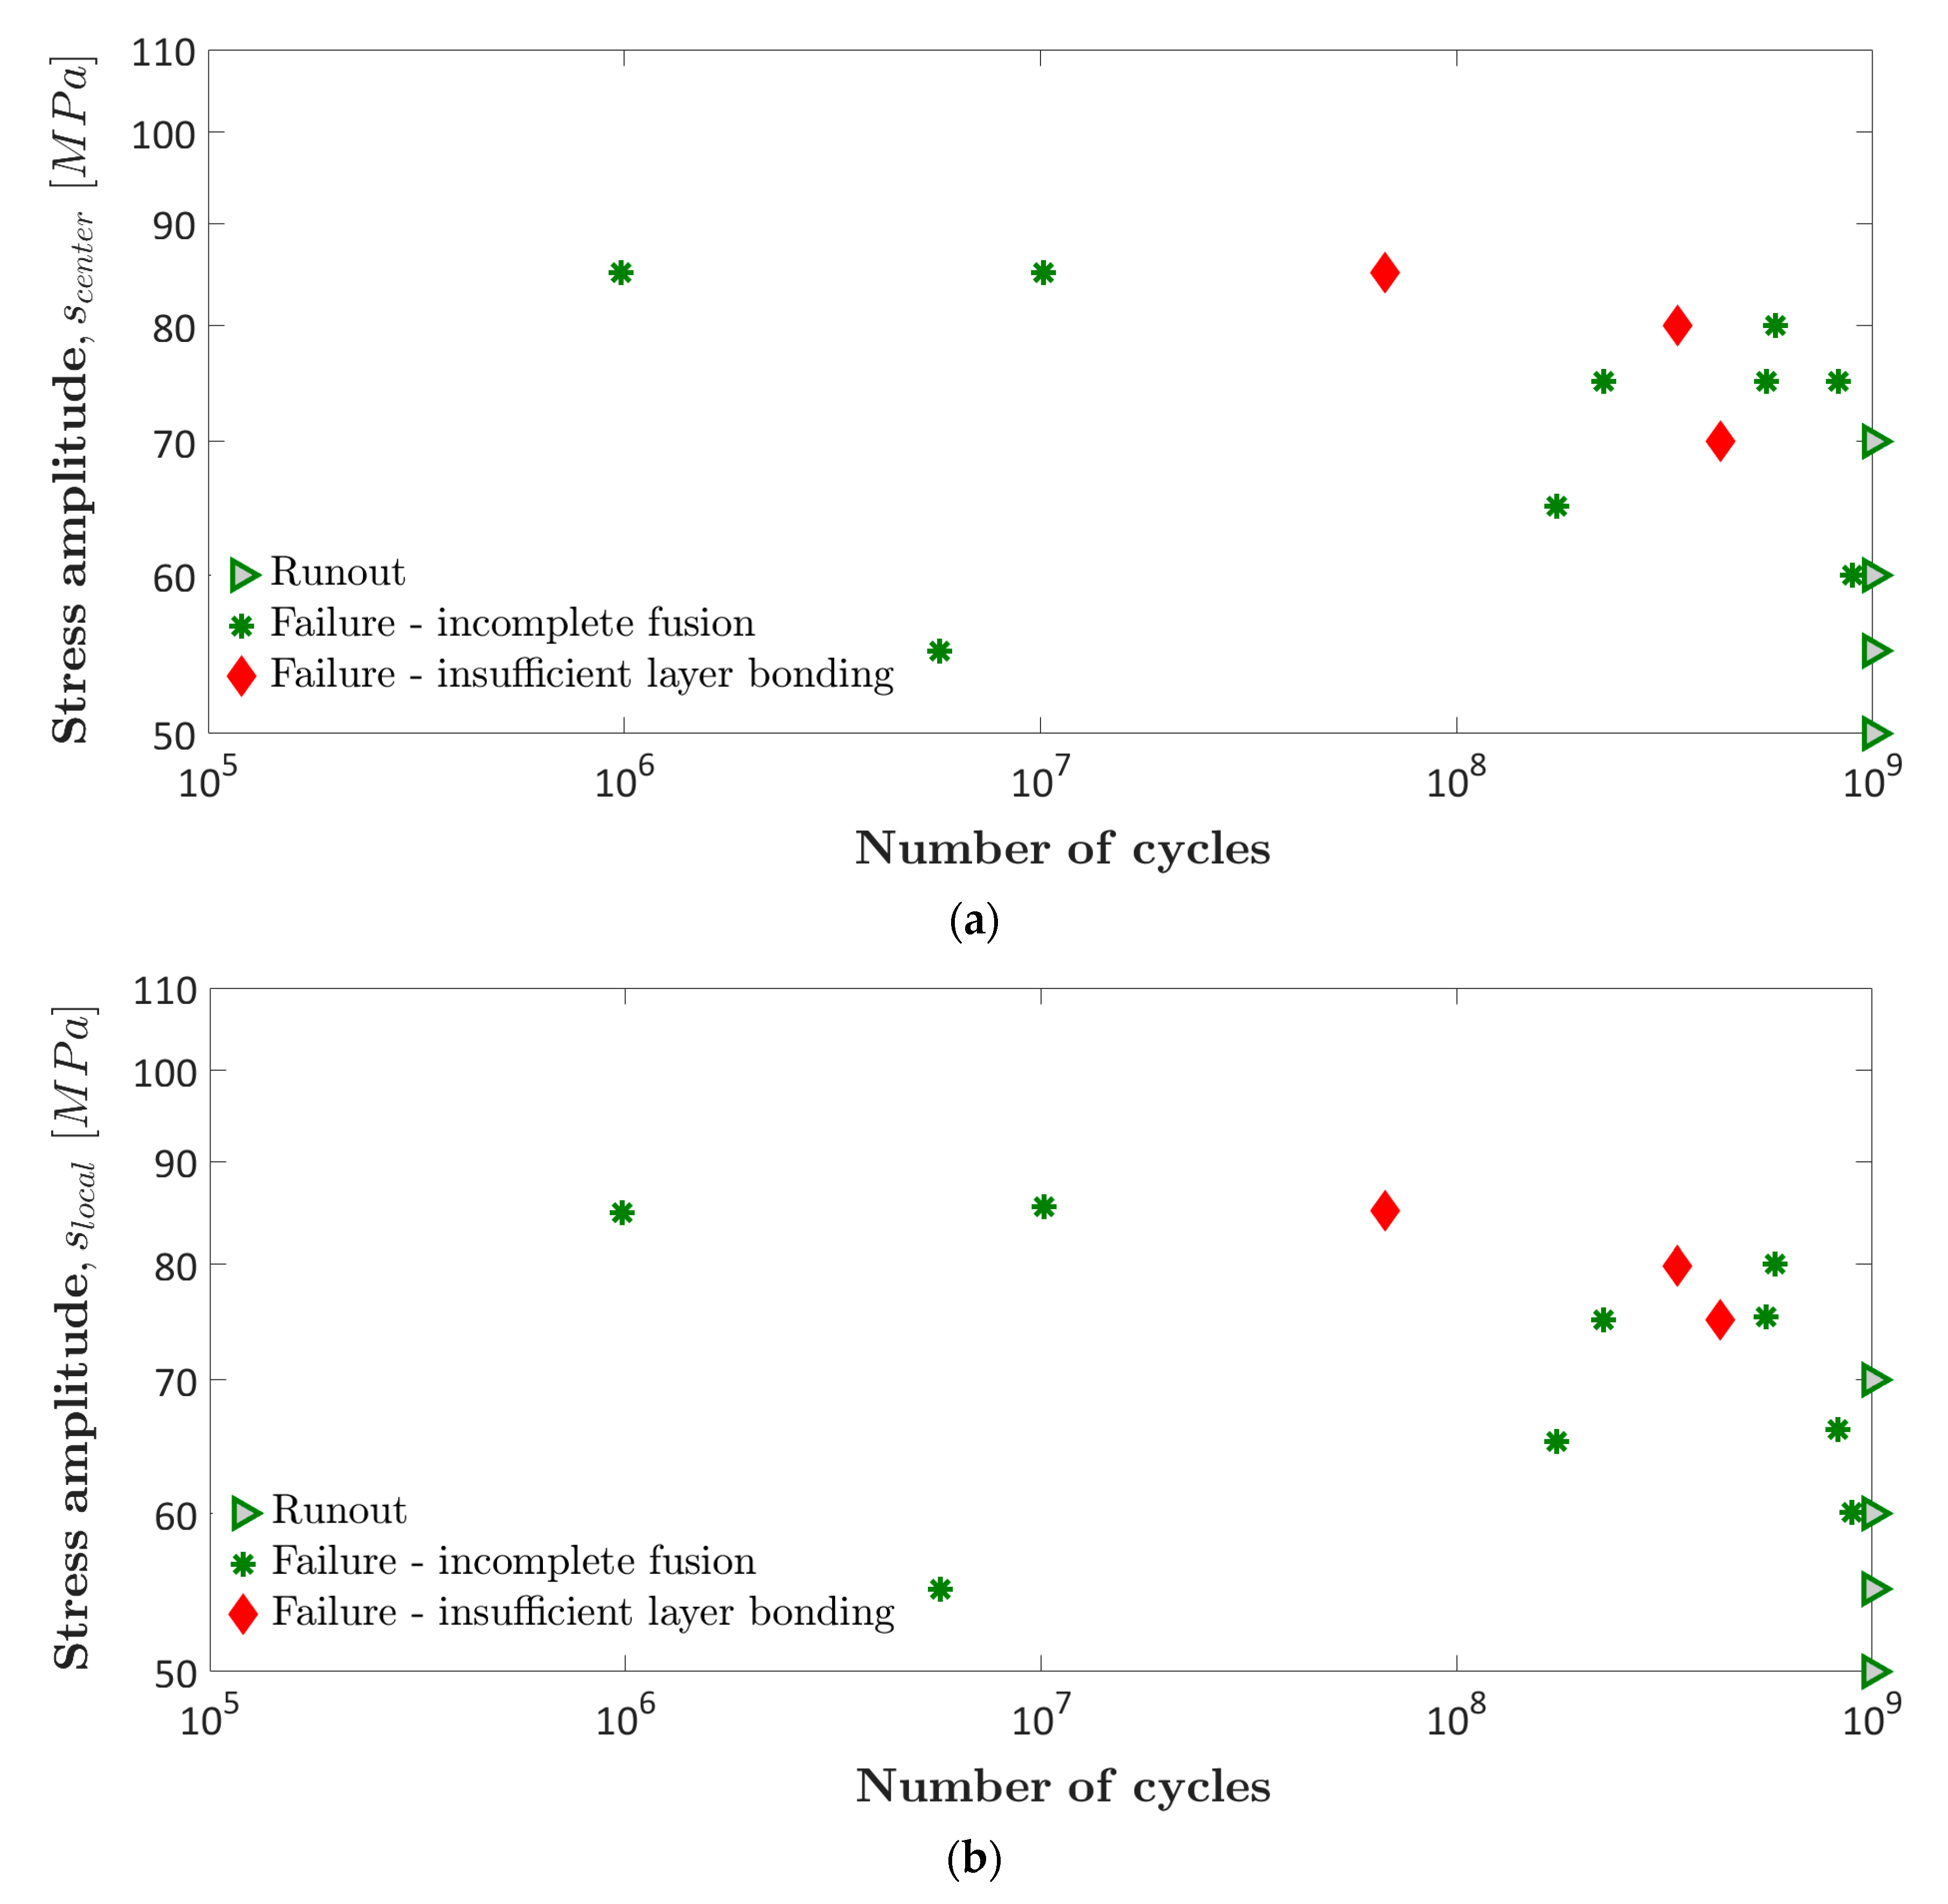
3.3. VHCF Test Results

Ultrasonic VHCF tests were carried out at increasing levels of stress amplitude at the specimen center, s c e n t e r , with the aim of collecting a large amount of failures in the VHCF region (above 10 7 cycles). The first test was carried out at the s c e n t e r equal to 50 MPa, and then the applied stress amplitude was increased with steps of 5 MPa up to 85 MPa. In particular, two tests at stress levels of 55 MPa, 60 MPa, 70 MPa, 80 MPa, and 85 MPa and three tests at 75 MPa were carried out. A total of sixteen VHCF tests were performed. Twelve specimens failed in the range ( 9.82   ×   10 5 :   8.94   ×   10 8 ), whereas four runout specimens did not fail at 10 9 cycles.
In the following analysis, the stress amplitude close to the defect location, referred to as the local stress amplitude s l o c a l , is considered in the following analysis, according to [20,21,27]. s l o c a l was assessed through a finite element analysis (FEA) by considering the location of initial defects within the risk volume. The location of defects in the radial direction was measured through digital processing of the fracture surface images obtained with the optical microscope and the scanning electron microscope (SEM). The location of the defect along the longitudinal direction is measured by using a digital caliber with a nominal resolution of 0.01 mm.
In Figure 3, the S-N plot of the experimental data is shown. In Figure 3a, s c e n t e r , with respect to the number of cycles to failure, N f , is shown; in Figure 3b, s l o c a l , with respect to the number of cycles to failure, N f , is shown. Two markers are used to differentiate between the defects originating the fatigue failure (the defect was due to incomplete fusion and insufficient layer bonding, according to Section 3.3).
According to Figure 3, the difference between s l o c a l and s c e n t e r is generally limited, but it is evident for two specimens that failed above 10 8 cycles. The maximum percent difference is about 10%, which confirms the well-known definition of risk volume (i.e., the volume of the material subjected to a stress amplitude larger than the 90% of the maximum applied stress [25]).
According to Figure 3b, the experimental data exhibit a large scatter in terms of fatigue strength as well as of N f . When s l o c a l = 55   MPa , a premature fatigue failure at N f =   5.7   ×   10 6   and a runout coexist; at about 10 7 cycles, failures at s l o c a l = 55   MPa and at s l o c a l = 85   MPa occur. The reason for the large scatter found experimentally is investigated and discussed in Section 3. The explanations proposed are verified by comparing the defect size, type, and location found experimentally with those found in [22] by testing small hourglass machined specimens, even if obtained by slightly different process parameters.

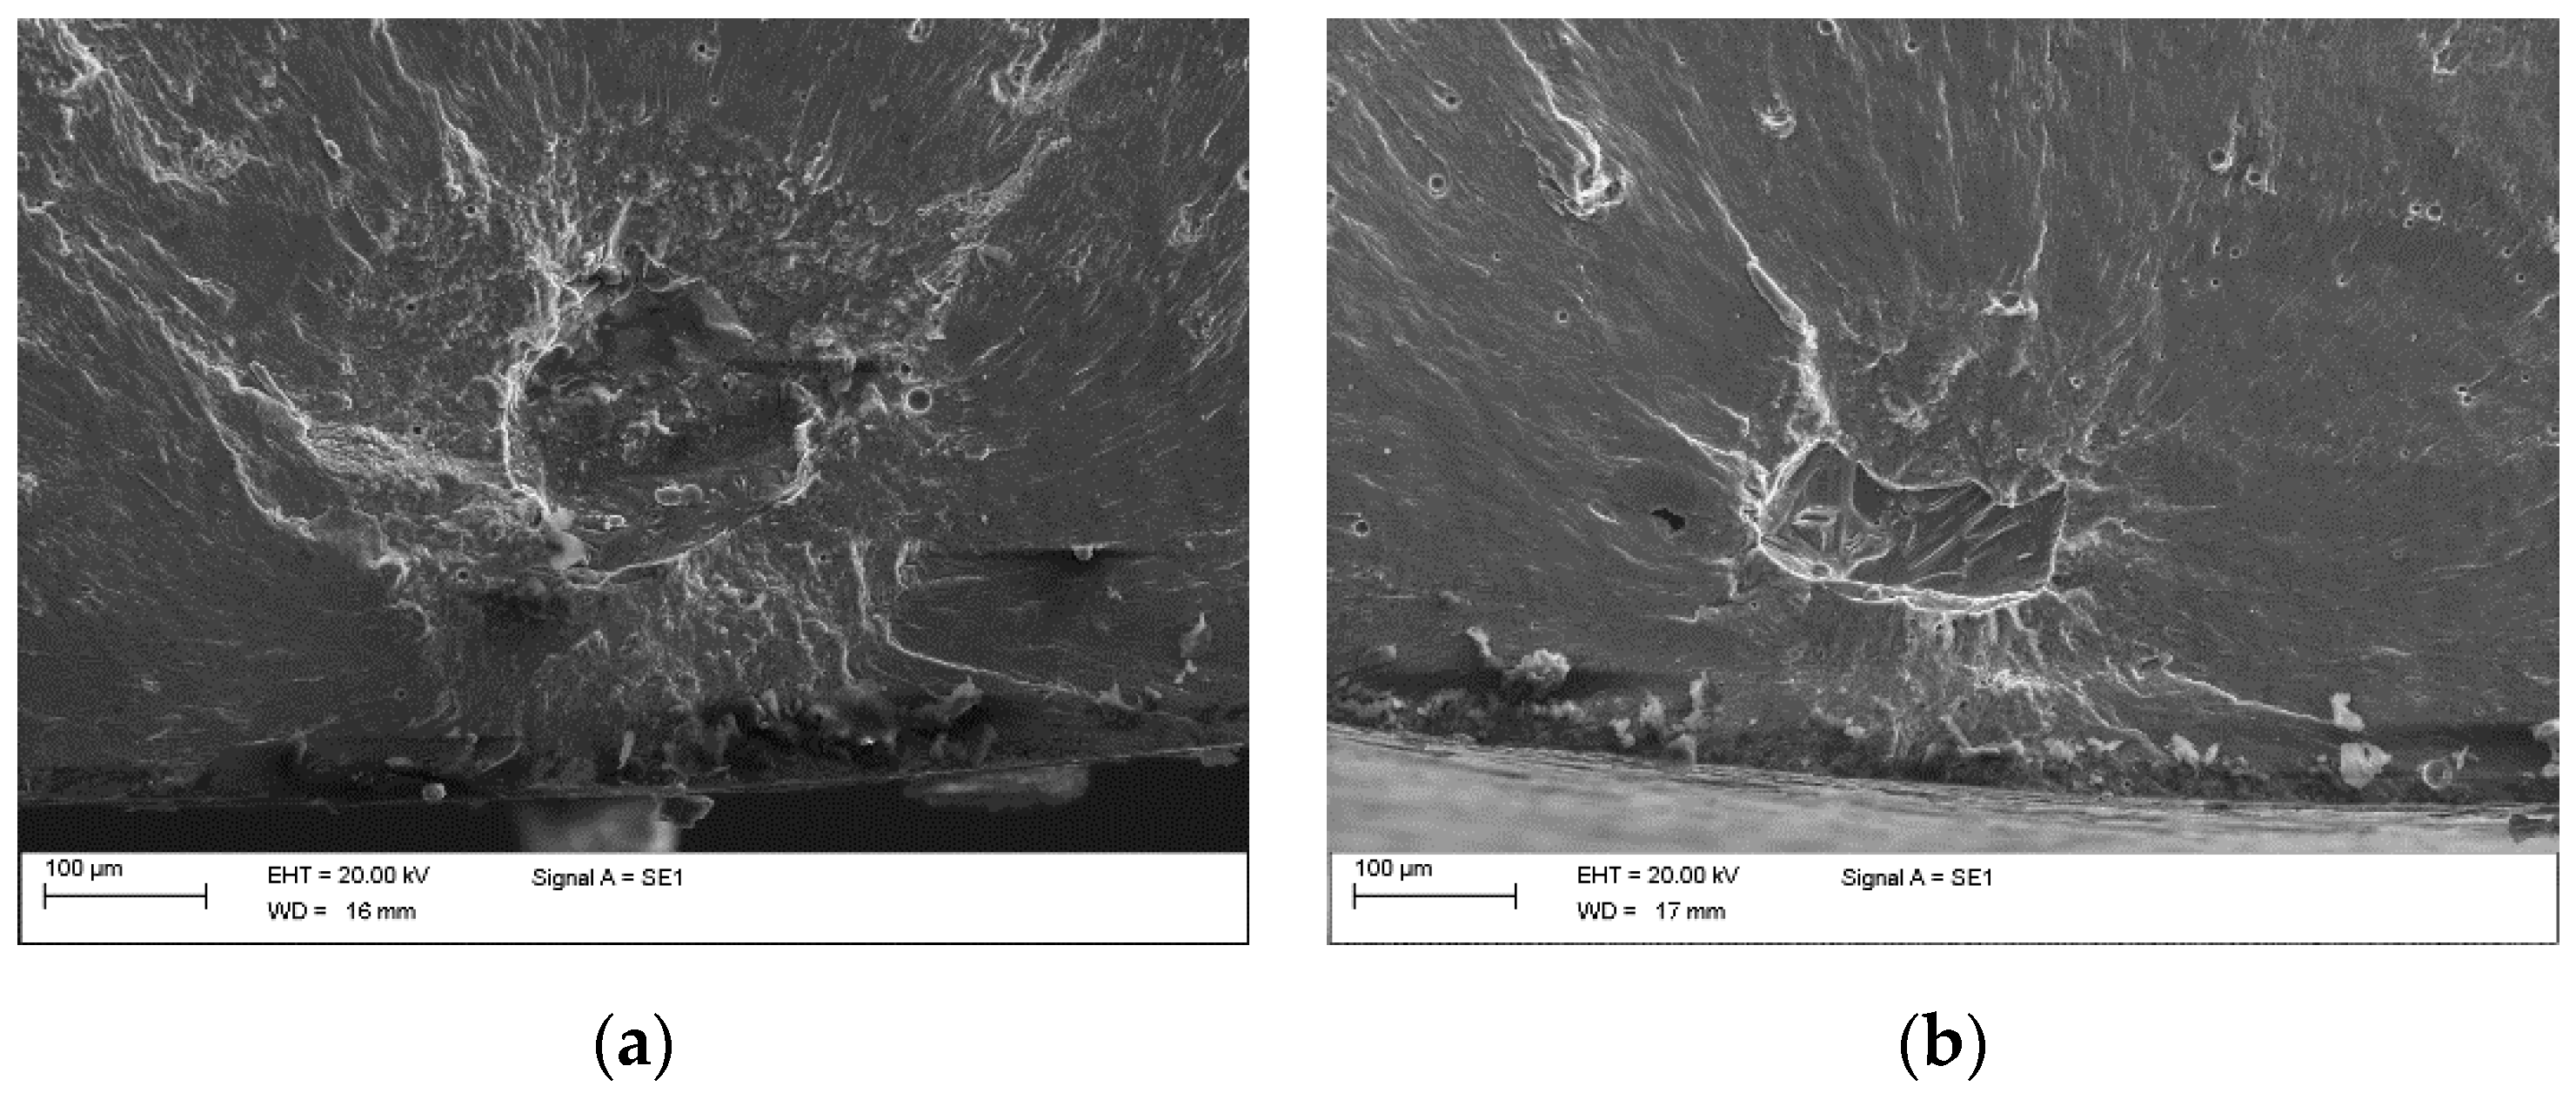
3.4. Analysis of the Critical Defects

The location of the defects originating the fatigue failure is analyzed. Figure 4 shows the distribution of the critical defect size along the axial and radial directions. The effect of defects on the VHCF response and a detailed comparison of the VHCF life found in the present paper and in [22] will be carried out in Figure 8.
According to Figure 4, all the experimental failures are concentrated near the specimen surface, in a region with radial distance, with respect to the surface below 1.1   mm . The external region in as-built specimens is the most critical region, with respect to VHCF failures for vertically built specimens. The same occurs in horizontally built specimens, for which the most critical region is near the region where the supports are removed [20]. As for the axial distribution, defects are randomly distributed within the risk volume V 90 (volume of material subjected to a stress amplitude larger than the 90% of the largest applied stress). This analysis highlights the importance of testing large risk volumes, which permit a more reliable assessment of the critical defects and VHCF behavior. It is worth noting that surface or subsurface defects are characterized by a larger stress intensity factor (SIF) than internal defects, according to [29], thus confirming that an external surface free of large defects would enhance the VHCF response.
Thereafter, the type of defects originating the fatigue failures are investigated. Three types of defects, described in [38,39,40], were mainly observed in bulk SLMed aluminum products: Metallurgical pores, originating from gas entrapment, defects caused by an incomplete fusion of powder, and defects induced by insufficient adhesion between successive layers. Two types of defects were found at the origin of the fatigue failures: Defects due to an incomplete fusion and defects due to an improper layer bonding, as shown in Figure 5a,b, respectively. In contrast to [22], no pores originating failure were found. However, non-critical spherical pores with a smaller size, shown in Figure 5c, were observed at a larger distance from the specimen surface. The different type of defects at the origin of the fatigue failures could be explained by considering the specimen post-process machining. Defects due to an incomplete fusion and due to an improper layer bonding is mainly concentrated in a region close to the specimen surface, but in [22] this critical region of material was removed through machining. After machining, internal pores become critical surface defects, which induce VHCF failures. Moreover, a larger building platform temperature was considered for specimen production in [22] (50 °C higher than in the present investigation), which yielded an expansion of the gas within the pores and increased their size. The pore population therefore was not analyzed in detail, since the main objective of this work is to investigate the critical defects, i.e., the defects which originate the fatigue crack and which control, therefore, the VHCF response. It is worth noting that, if the testing conditions change and pores become the critical defects, their effect on the VHCF response should be analyzed in detail.
The effect of the defect size was then investigated. In order to compare defects characterized by different morphology and chemical composition, the equivalent defect size a c , was considered. Figure 6 plots a c , measured according to [16,29], with respect to N f .
According to Figure 6, a c decreases with the N f . Except for one data ( a c = 207   µ m , N f =   9.8 · 10 5 ), the scatter associated to the N f reduced, with respect to the S-N plot shown in Figure 3, thus confirming that the defect size controls the VHCF response. The deviation of the datapoint ( a c = 207   µ m , N f =   9.8 ×   10 5 ) could be due to a local variation of the microhardness (Section 3.1). The defect size range ( 130 : 286 )   µ m is close to the range found for SLM AlSi10Mg specimens [20] horizontally built. In particular, a c is smaller than 207   µ m in 9 out of 12 defects ( 75 % ), whereas it is larger than 250   µ m in 3 out of 12 defects ( 25 % ).
In order to investigate the influence of defects on the VHCF response, the stress intensity factor threshold (SIF threshold, K t h ) is also analysed. According to [21], for failures in the VHCF region, the SIF associated with the defect must be equal to the SIF threshold. The onset of the VHCF regime is assumed to be equal to 2 × 10 6 cycles [21]. Therefore, only specimens which failed above 2 × 10 6 cycles were considered for computing the SIF threshold. Figure 7 plots the SIF threshold, with respect to the number of cycles to failure, together with the mean SIF threshold, K t h ,   m e a n .
According to Figure 7, SIF threshold values are close to the average value, with limited differences (apart from one data). By considering the SIF threshold, the scatter is significantly reduced, with respect to the S-N plot in Figure 3, further confirming that, for a proper analysis of the VHCF response of AM parts, the interaction between the local stress near the defect and the defect size must be taken into account.

3.5. P-S-N Curves

The marginal P-S-N curves are finally estimated from the experimental failures. The model proposed by the authors [41] is considered. The cumulative distribution function (CDF) of the logarithm of the fatigue life random variable is given by the product of the distribution of the conditional fatigue life and the statistical distribution of a c . The conditional fatigue life is assumed normal, with constant standard deviation and with a mean that linearly depends on s l o c a l and a c . The defect size a c is assumed to follow the largest extreme value distribution, according to [29]. A continuously decreasing linear trend (i.e., without a horizontal asymptote at the end of the curve, the fatigue limit) is considered for modelling the P-S-N curves. The maximum likelihood principle was applied for parameter estimation, by considering both failures and runout data.
Figure 8 shows the S-N plot of the experimental data, together with the estimated median and 0.1% (99% reliability) P-S-N curves. The VHCF response obtained in [22] by testing hourglass specimens with similar process parameters (batch B) is also shown in Figure 8 (light grey markers).
According to Figure 8, the estimated P-S-N curves fit the experimental data well. In particular, 5 out of 12 (about the 50 % ) of the experimental failures are above the median curve. The 0.1% P-S-N curve is below all the experimental failures. On the other hand, for horizontally as-built AlSi10Mg specimens, the 1% P-S-N is below all the experimental failures. Therefore, the large VHCF scatter of vertically built specimens implies a more conservative choice for the design curve to avoid unexpected failures due to rare critical defects.
The VHCF strength is also compared with literature results. For the same N f , the VHCF strength in [22] (light grey markers in Figure 8) is generally larger than that obtained in the paper, but the difference is limited. On the other hand, if the design curve is considered, the difference is significantly larger. For instance, the runout limit at 10 8 cycles in [22] is equal to 90   MPa , whereas the VHCF strength at 10 8 estimated from the 0.1% P-S-N curve is about 40   MPa . Therefore, it can be inferred that the VHCF strength obtained in the present paper is averagely close to the literature results obtained by testing the specimen manufactured with similar process parameters. However, the scatter found experimentally is significantly larger, thus lowering significantly the P-S-N curves with smaller failure probability. The reason for this difference is mainly related to the specimen conditions. The tested Gaussian specimens are not machined and, therefore, surface defects due to incomplete fusion or improper layer bonding, whose size is characterized by a large dispersion, are not removed and contribute to increase the experimental scatter of the VHCF response. Moreover, the tested V 90 of the Gaussian specimens is significantly larger than the largest V 90 tested in the literature, thus increasing the probability of the presence of rare large defects in the risk volume (the size effect, according to [29]). Therefore, the experimental results confirm that the surface region is critical for the VHCF response. In particular, the removal of a layer of surface material has not had a significant effect on the average VHCF strength, but it permits us to reduce the experimental scatter. In this respect, the optimization of the process parameters to reduce the formation of large defects would be more effective for enhancing the VHCF response. On the other hand, in horizontally built specimens [20], the fatigue crack mainly originated from defects formed in the region where the support structures were removed. With horizontally built specimens, the removal of a region of material from the specimen surface (e.g., through a machining process) could have a more effective effect on the VHCF response, since the most critical defects originating during the support removal could be eliminated. This highlights that different post treatments have a different effect on the VHCF response, depending on the part-build orientation during the AM process or, in general, on the defect origin.

4. Conclusions

The VHCF response of SLM AlSi10Mg specimens built in a vertical direction was experimentally assessed in the present paper. Ultrasonic tension-compression tests (stress ratio of –1) were carried on as-built (mechanically polished) Gaussian specimens with large risk volume (2300 mm3). The main results can be summarized as follows:
(1)
The quasi-static mechanical properties were larger than those of the cast parts and close to those reported in the literature.
(2)
VHCF failures originated from defects (defects due to an incomplete fusion and defects due to an improper layer bonding) concentrated in a region of material close to the specimen surface (1.1 mm distance from the specimen surface). Since the VHCF response is driven by the defect size, a significant enhancement of the VHCF behavior could be achieved by optimizing the process parameters that permit to minimize the defect size.
(3)
The 0.1% P-S-N curve was shown to be below all the experimental failures and proved to be a possible reliable choice for designing AM parts. On the other hand, for horizontally as-built AlSi10Mg specimens, the 1% P-S-N was below all the experimental failures. Therefore, the large VHCF scatter of vertically built specimens implies a more conservative choice for the design curve to avoid unexpected failures due to rare critical defects.
(4)
The scatter associated to the VHCF response, significantly larger than that of tests carried out on machined hourglass specimens, was mainly related to the specimen conditions. The tested Gaussian specimens were not machined and, therefore, surface defects due to incomplete fusion or improper layer bonding, whose size was characterized by a large dispersion, were not removed and contributed to increase the experimental scatter of the VHCF response.
(5)
The tested risk volume, significantly larger than the largest risk volume tested in the literature, also contributed to increase the scatter of the experimental results. According to the size effect, in larger risk volumes, the probability of finding large and rare defects at the origin of the fatigue failures increases, with a consequent increment of the defect size range and, accordingly, of the scatter of the experimental failures.
(6)
The surface region is critical for the VHCF response of vertically built AlSi10Mg parts. The removal of a layer of surface material does not significantly affect the average VHCF strength, but it permits us to reduce the experimental scatter and, therefore, to increase the VHCF strength for the same required reliability.

Author Contributions

D.S.P. supervised the research, suggested the adopted models, and reviewed the manuscript; A.T. carried out the VHCF tests at PoliTO, analyzed the VHCF test results, and wrote the paper; J.F. performed the static mechanical tests, the microstructural and fractographic analysis at CNR, and made additions to parts of the manuscript; C.A.B. supervised the preparation of SLM prints and made additions to parts of the manuscript; G.C. supervised the work and reviewed the full manuscript; M.R. reviewed the full manuscript; A.T. supervised the work and made additions to parts of the manuscript.

Funding

This research received no external funding.

Conflicts of Interest

The authors declare no conflict of interest.

References

  1. Caiazzo, F.; Alfieri, V.; Corrado, G.; Argenio, P. Laser powder-bed fusion of Inconel 718 to manufacture turbine blades. Procedia Eng. 2017, 93, 4023–4031. [Google Scholar] [CrossRef] [Green Version]
  2. Uzan, N.E.; Shneck, R.; Yeheskel, O.; Frage, N. High-temperature mechanical properties of AlSi10Mg specimens fabricated by additive manufacturing using selective laser melting technologies (AM-LM). Addit. Manuf. 2018, 24, 257–263. [Google Scholar] [CrossRef]
  3. Aerospace: RUAG—Additive Manufacturing of Satellite Components. Available online: https://www.eos.info/case_studies/additive-manufacturing-of-antenna-bracket-for-satellite (accessed on 15 May 2019).
  4. Khorasani, A.M.; Gibson, I.; Goldberg, M.; Littlefair, G. A survey on mechanisms and critical parameters on solidification of selective laser melting during fabrication of Ti-6Al-4V prosthetic acetabular cup. Mater. Design 2016, 103, 348–355. [Google Scholar] [CrossRef]
  5. Thompson, S.M.; Aspina, Z.S.; Shamsaei, N.; Elwany, A.; Bian, L. Additive manufacturing of heat exchangers: A case study on a multi-layered Ti–6Al–4V oscillating heat pipe. Addit. Manuf. 2015, 8, 163–174. [Google Scholar] [CrossRef]
  6. Yadollahi, A.; Shamsaei, N. Additive manufacturing of fatigue resistant materials: Challenges and opportunities. Int. J. Fatigue 2017, 98, 14–31. [Google Scholar] [CrossRef] [Green Version]
  7. Molaei, R.; Fatemi, A. Fatigue Design with Additive Manufactured Metals: Issues to Consider and Perspective for Future Research. Procedia Eng. 2018, 213, 5–16. [Google Scholar] [CrossRef]
  8. Polmear, I.; StJohn, D.; Nie, J.-F.; Qian, M. Light Alloys: Metallurgy of the Light Metals, 5th ed.; Butterworth-Heinemann: Oxford, UK, 2017. [Google Scholar]
  9. Demir, A.G.; Biffi, C.A. Micro laser metal wire deposition of thin-walled Al alloy components: Process and material characterization. J. Manuf. Process. 2019, 37, 362–369. [Google Scholar] [CrossRef]
  10. Romano, S.; Brückner-Foit, A.; Brandão, A.; Gumpinger, J.; Ghidini, T.; Beretta, S. Fatigue properties of AlSi10Mg obtained by additive manufacturing: Defect-based modelling and prediction of fatigue strength. Eng. Fract. Mech. 2018, 187, 165–189. [Google Scholar] [CrossRef]
  11. Benedetti, M.; Fontanari, V.; Bandini, M.; Zanini, F.; Carmignato, S. Low- and high-cycle fatigue resistance of Ti-6Al-4V ELI additively manufactured via selective laser melting: Mean stress and defect sensitivity. Int. J. Fatigue 2018, 107, 96–109. [Google Scholar] [CrossRef]
  12. Beretta, S.; Romano, S. A comparison of fatigue strength sensitivity to defects for materials manufactured by AM or traditional processes. Int. J. Fatigue 2017, 94, 178–191. [Google Scholar] [CrossRef]
  13. Schneller, W.; Leitner, M.; Springer, S.; Grün, F.; Taschauer, M. Effect of HIP Treatment on Microstructure and Fatigue Strength of Selectively Laser Melted AlSi10Mg. J. Manuf. Mater. Process. 2019, 3, 16. [Google Scholar] [CrossRef]
  14. Beevers, E.; Brandão, A.D.; Gumpinger, J.; Gschweitl, M.; Seyfert, C.; Hofbauer, P.; Rohr, T.; Ghidini, T. Fatigue properties and material characteristics of additively manufactured AlSi10Mg—Effect of the contour parameter on the microstructure, density, residual stress, roughness and mechanical properties. Int. J. Fatigue 2018, 117, 148–162. [Google Scholar] [CrossRef]
  15. Brandl, E.; Heckenberge, U.; Holzinger, V.; Buchbinder, D. Additive manufactured AlSi10Mg samples using Selective Laser Melting (SLM): Microstructure, high cycle fatigue, and fracture behaviour. Mater. Des. 2012, 34, 159–169. [Google Scholar] [CrossRef]
  16. Masuo, H.; Tanaka, Y.; Morokoshi, S.; Yagura, H.; Uchida, T.; Yamamoto, Y.; Murakami, Y. Influence of defects, surface roughness and HIP on the fatigue strength of Ti-6Al-4V manufactured by additive manufacturing. Int. J. Fatigue 2018, 117, 163–179. [Google Scholar] [CrossRef]
  17. Günther, J.; Krewerth, D.; Lippmann, T.; Leuders, S.; Tröster, T.; Weidner, A.; Biermann, H.; Niendorf, T. Fatigue life of additively manufactured Ti–6Al–4V in the very high cycle fatigue regime. Int. J. Fatigue 2017, 94, 236–245. [Google Scholar] [CrossRef]
  18. Wycisk, E.; Siddique, S.; Herzog, D.; Walther, F.; Emmelmann, C. Fatigue Performance of Laser Additive Manufactured Ti–6Al–4V in Very High Cycle Fatigue Regime up to 109 Cycles. Front. Mater. 2015, 2–72. [Google Scholar] [CrossRef]
  19. Siddique, S.; Imran, M.; Wycisk, E.; Emmelmann, C.; Walther, F. Influence of process-induced microstructure and imperfections on mechanical properties of AlSi12 processed by selective laser melting. J. Mater. Process. Technol. 2015, 221, 205–213. [Google Scholar] [CrossRef]
  20. Tridello, A.; Biffi, C.A.; Fiocchi, J.; Bassani, P.; Chiandussi, G.; Rossetto, M.; Tuissi, A.; Paolino, D.S. VHCF response of as-built SLM AlSi10Mg specimens with large loaded volume. Fatigue Fract. Eng. Mater. Struct. 2018, 41, 1918–1928. [Google Scholar] [CrossRef]
  21. Tridello, A.; Fiocchi, J.; Biffi, C.A.; Chiandussi, G.; Rossetto, M.; Tuissi, A.; Paolino, D.S. VHCF response of Gaussian SLM AlSi10Mg specimens: Effect of a stress relief heat treatment. Int. J. Fatigue 2019, 124, 435–443. [Google Scholar] [CrossRef]
  22. Awd, M.; Siddique, S.; Johannsen, J.; Emmelmann, C.; Walther, F. Very high-cycle fatigue properties and microstructural damage mechanisms of selective laser melted AlSi10Mg alloy. Int. J. Fatigue 2019, 124, 55–69. [Google Scholar] [CrossRef]
  23. Furuya, Y. Notable size effects on very high cycle fatigue properties of high strength steel. Mater. Sci. Eng. A 2011, 528, 5234–5240. [Google Scholar] [CrossRef]
  24. Fatemi, A.; Molaei, R.; Simsiriwong, J.; Sanaei, N.; Pegues, J.; Torries, B.; Phan, N.; Shamsaei, N. Fatigue behaviour of additive manufactured materials: An overview of some recent experimental studies on Ti-6Al-4V considering various processing and loading direction effects. Fatigue Fract. Eng. Mater. Struct. 2019, 42, 991–1009. [Google Scholar] [CrossRef]
  25. Paolino, D.S.; Tridello, A.; Chiandussi, G.; Rossetto, M. On specimen design for size effect evaluation in ultrasonic gigacycle fatigue testing. Fatigue Fract. Eng. Mater. Struct. 2014, 37, 570–579. [Google Scholar] [CrossRef] [Green Version]
  26. Wan, H.Y.; Zhou, Z.J.; Li, C.P.; Chen, G.F.; Zhang, G.P. Effect of scanning strategy on mechanical properties of selective laser melted Inconel 718. Mater. Sci. Eng. A 2019, 753, 42–48. [Google Scholar] [CrossRef]
  27. Tridello, A. VHCF response of Gaussian specimens made of high-strength steels: comparison between unrefined and refined AISI H13. Fatigue Fract. Engng. Mater. Struct. 2017, 40, 1676–1689. [Google Scholar] [CrossRef]
  28. Tridello, A.; Paolino, D.S.; Chiandussi, G.; Rossetto, M. VHCF Response of AISI H13 Steel: Assessment of Size Effects through Gaussian Specimens. Procedia Eng. 2015, 109, 121–127. [Google Scholar] [CrossRef]
  29. Murakami, Y. Metal Fatigue: Effects of Small Defects and Nonmetallic Inclusions, 2nd ed.; Elsevier Ltd.: Oxford, UK, 2002. [Google Scholar]
  30. Tridello, A.; Paolino, D.S.; Chiandussi, G.; Rossetto, M. VHCF strength decrement in large H13 steel specimens subjected to ESR process. Proced. Struct. Integr. 2016, 2, 1117–1124. [Google Scholar] [CrossRef] [Green Version]
  31. Tridello, A.; Paolino, D.S.; Chiandussi, G.; Rossetto, M. Effect of electroslag remelting on the VHCF response of an AISI H13 steel. Fatigue Fract. Eng. Mater. Struct. 2017, 40, 1783–1794. [Google Scholar] [CrossRef]
  32. Xue, H.; Sun, Z.; Zhang, X.; Gao, T.; Li, Z. Very High Cycle Fatigue of a Cast Aluminum Alloy: Size Effect and Crack Initiation. J. Mater. Eng. Perform. 2018, 27, 5406–5416. [Google Scholar] [CrossRef]
  33. Kempen, K.; Thijs, L.; Vrancken, B.; Buls, S.; Van Humbeeck, J.; Kruth, J.P. Lowering thermal gradients in Selective Laser melting by pre-heating the baseplate. In Proceedings of the 2nd Solid Freeform Fabrication Symposium, Austin, TX, USA, 12–15 August 2013; pp. 12–24. [Google Scholar]
  34. Zeng, K.; Pal, D.; Stucker, B. A review of thermal analysis methods in laser sintering and selective laser melting. In Proceedings of the Solid Freeform Fabrication Symposium, Austin, TX, USA, 6–8 August 2012; pp. 796–814. [Google Scholar]
  35. Aboulkhair, N.T.; Maskery, I.; Tuck, C.; Ashcroft, I.; Everitt, N.M. The microstructure and mechanical properties of selectively laser melted AlSi10Mg: The effect of a conventional T6-like heat treatment. Mater. Sci. Eng. A 2016, 667, 139–146. [Google Scholar] [CrossRef]
  36. Biffi, C.A.; Fiocchi, J.; Tuissi, A. Selective laser melting of AlSi10Mg: influence of process parameters on Mg2Si precipitation and Si spheroidization. J. Alloys Compound. 2018, 755, 100–107. [Google Scholar] [CrossRef]
  37. Biffi, C.A.; Fiocchi, J.; Bassani, P.; Tuissi, A. Continuous wave vs pulsed wave laser emission in selective laser melting of AlSi10Mg parts with industrial optimized process parameters: Microstructure and mechanical behavior. Addit. Manuf. 2018, 24, 639–646. [Google Scholar] [CrossRef]
  38. Tang, M.; Pistorius, C. Oxides, porosity and fatigue performance of AlSi10Mg parts produced by selective laser melting. Int. J. Fatigue 2017, 94, 192–201. [Google Scholar] [CrossRef]
  39. Aboulkhair, N.T.; Everitt, N.M.; Ashcroft, I.; Tuck, C. Reducing porosity in AlSi10Mg parts processed by selective laser melting. Addit. Manuf. 2014, 1, 77–86. [Google Scholar] [CrossRef]
  40. Olakanmia, E.O.; Cochrane, R.F.; Dalgarnoc, K.W. A review on selective laser sintering/melting (SLS/SLM) of aluminium alloy powders: Processing, microstructure, and properties. Prog. Mater. Sci. 2015, 74, 401–477. [Google Scholar] [CrossRef]
  41. Paolino, D.S.; Tridello, A.; Chiandussi, G.; Rossetto, M. S-N curves in the very-high-cycle fatigue regime: statistical modeling based on the hydrogen embrittlement consideration. Fatigue Fract. Eng. Mater. Struct. 2016, 39, 1319–1336. [Google Scholar] [CrossRef]
Figure 1. Geometry of the Gaussian specimen.
Applsci 09 02954 g001
Figure 2. Microstructural analysis: (a) Optical microscope and (b) scanning electron microscope (SEM) micrographs of as-built specimen observed in the xz view.
Applsci 09 02954 g002
Figure 3. S-N plot of the experimental results: (a) s c e n t e r with respect to N f ; (b) s l o c a l with respect to N f .
Applsci 09 02954 g003
Figure 4. Distribution of defects along the longitudinal and radial directions.
Applsci 09 02954 g004
Figure 5. Types of critical defects: (a) Defect due to incomplete fusion; (b) defect due to improper bonding; (c) non critical pores found within the specimen volume.
Applsci 09 02954 g005aApplsci 09 02954 g005b
Figure 6. Defect size a c , with respect to N f .
Applsci 09 02954 g006
Figure 7. Stress intensity factor (SIF) threshold, with respect to N f .
Applsci 09 02954 g007
Figure 8. Marginal probabilistic S-N (P-S-N) curve: Median and 0.1%-quantile marginal P-S-N curves.
Applsci 09 02954 g008
Table 1. AlSi10Mg powder (wt.%) chemical composition and selective laser melting (SLM) process parameters.
AlSi10Mg Chemical Composition
SiMgCuNiFeMnTiAl
10 0.4 0.25 0.05 0.25 0.1 0.15 bal.
SLM Process Parameters
Laser powerPlate temperatureScanning speedSpot sizeHatch distanceLayer thicknessAverage powder size
350 W 150 °C1.15 m/s80 μ m 170 μ m 50 μ m 45 μ m
Table 2. Results of the tensile tests and of the Vickers hardness measurements.
σ u   [ MPa ] ε f   [ % ] Vickers   Hardness   [ HV ]
AlSi10Mg vertical 419   ( ± 8 ) 4.1   ( ± 0.1 ) 146   ( ± 4 )
AlSi10Mg [22] 451 4.8 127

