Convolutional Models for the Detection of Firearms in Surveillance Videos


1
Interaction, Robotics and Automation Research Group, Universidad Politécnica Salesiana, Calle Vieja 12-30 y Elia Liut, Cuenca 010107, Ecuador
2
Speech Technology Group, Information and Telecommunications Center, Universidad Politécnica de Madrid, Ciudad Universitaria Av. Complutense, 30, 28040 Madrid, Spain
*
Author to whom correspondence should be addressed.
Appl. Sci. 2019, 9(15), 2965; https://doi.org/10.3390/app9152965
Submission received: 20 June 2019
/
Revised: 18 July 2019
/
Accepted: 19 July 2019
/
Published: 24 July 2019
(This article belongs to the Special Issue Artificial Intelligence Applications to Smart City and Smart Enterprise)
Abstract
:Featured Application
The system described in this article aims to be a firearms detection system for retail businesses, banks, train stations, bus stops, etc., which performs automatic monitoring, being able to perform a detection when a firearm is shown.
Abstract
Closed-circuit television monitoring systems used for surveillance do not provide an immediate response in situations of danger such as armed robbery. In addition, they have multiple limitations when human operators perform the monitoring. For these reasons, a firearms detection system was developed using a new large database that was created from images extracted from surveillance videos of situations in which there are people with firearms. The system is made up of two parts—the “Front End” and “Back End”. The Front End is comprised of the YOLO object detection and localization system, and the Back End is made up of the firearms detection model that is developed in this work. These two systems are used to focus the detection system only in areas of the image where there are people, disregarding all other irrelevant areas. The performance of the firearm detection system was analyzed using multiple convolutional neural network (CNN) architectures, finding values up to 86% in metrics like recall and precision in a network configuration based on VGG Net using grayscale images.
1. Introduction
Closed-circuit television (CCTV) systems are composed of one or more surveillance cameras connected to one or more video monitors [1]. This type of security system tries to prevent dangerous situations such as intrusions or armed robberies. Usually, human operators observe these events and activate action protocols when a dangerous situation occurs. However, these systems have the disadvantage that they depend on human detection to activate alarms or action protocols. In [2] it is shown that an operator’s ability to accurately observe activity on a screen is reduced by up to 45% after 12 min of constant monitoring. The failure rate increases to 95% after 22 min. Normally, the high cost of surveillance systems with additional monitoring services is a deterrent to their wide-scale use. In many cases, businesses only implement surveillance cameras without additional monitoring services for their protection. One way to reduce or avoid this type of crime could be the real-time detection of firearms in dangerous situations such as armed robberies. This would provide a faster reaction from security forces, because the detection would be made at the same time that the gun is first detected on the scene. This would allow security forces to be notified simultaneously with the activation of alarms in incidents involving a firearm, thus having a deterrent effect on the attackers. This system could also work as a support system, notifying those observing the monitors.
The problem with firearms detection in CCTV videos has been addressed in many different ways, firstly using classic machine learning algorithms like K-means to make color-based segmentation, combining it with algorithms like SURF (speeded up robust features), Harris interest point detector, and FREAK (fast retina keypoint) to make the detection and localization of the gun [2,3]. In [4] the authors use algorithms like SIFT (scale-invariant feature transform) to extract different features of the image, combining it with K-means clustering and support vector machines to decide whether an image has a gun or not. The authors in [5] use algorithms like background and canny edge detection in combination with the sliding window approach and neural networks to detect and localize the gun. The disadvantage of these systems is that they use a database where the gun occupies most of the image, which does not represent authentic scenarios in which a firearm is involved. Therefore, these systems are not optimal for continuous monitoring where the images extracted from CCTV videos have a high complexity due to the multiple factors involved or where there are open areas with many objects around.
This problem has also been addressed with more complex algorithms like deep convolutional neural networks (CNNs). In [6] the authors used transfer learning, utilizing faster R-CNN trained in a database with only high-quality and low-complexity images. The authors show that the best system that was evaluated in well-known films garnered a low recall produced by the frames with very low contrast and luminosity. It also obtained false positives in the detection produced by the objects in the background of the image, which could be produced because multiple areas of the image are analyzed with the sliding window and region proposals approaches to detect and localize the gun. The authors in [7] face this problem using a symmetric dual camera system and CNNs, using a database made by the authors. However, the most common cameras in CCTV systems are not dual cameras [8], and therefore the use of this system would not apply to most retail businesses.
The most common problems that we found were first that the developed systems use small databases that do not represent authentic robbery scenarios, where many factors are involved. Small and medium markets and businesses use low-cost cameras that capture low-quality video. Luminosity is a risk factor in firearm detection; robberies can be done at any time of the day. Additionally, firearm position is an important factor; the gun can be shown in multiple positions. Second, the sliding window and region proposals approaches that are used for detection and localization of the gun analyze multiple places in the image where a gun could never be found. This could contribute to obtaining a large number of false positives, because the system could easily confuse a number of harmless objects with a gun. Once it is established that a firearm is most likely only to be found next to people, then the close monitoring of any image needs to be in and around the people in the image. To overcome the limitations of the described developed systems, we propose a firearm detection system made up of two convolutional models, in order to focus the detection system only in the part of the image where people are located. It uses the YOLO object detection and localization system [9] and the convolutional model to detect firearms that is developed in this work. The development of this model was done with a new large database of images extracted from surveillance videos and other situations that simulate for the most part a real robbery, considering factors like luminosity in the image, image quality, firearm position, and camera position.
2. System Description
2.1. Database
For the development of systems that use deep learning, it is necessary to have large databases to train these systems. Due to the non-existence of a large image database of people with firearms on the web, we created a database that designated perpetrators into two classes, those with handguns and those without. This database was originally made up of 17,684 images. These images were extracted from surveillance videos of real robberies, videos of people practicing shooting with firearms, and other types of situations different from robberies or shooting practices. These last two types of images were chosen because they were very similar to real robbery scenarios. All of these data were obtained from YouTube, Instagram, and Google. The structure of each class is shown in Figure 1 and Figure 2.
In these types of situations, the gun can be shown in different types of positions. In [10], it is concluded that in the majority of cases where the robbers show their weapons upon entering the scene, they tend to keep their weapons at waist height, or most commonly at shoulder height when posing the initial threat. Luminosity in the image is an important factor in these types of situations because a real robbery could happen at any time of the day. Moreover, image quality is an important factor, because surveillance videos are usually captured with low-cost cameras. This database was created taking all of these factors into consideration; these factors are shown in Figure 3 and Figure 4.
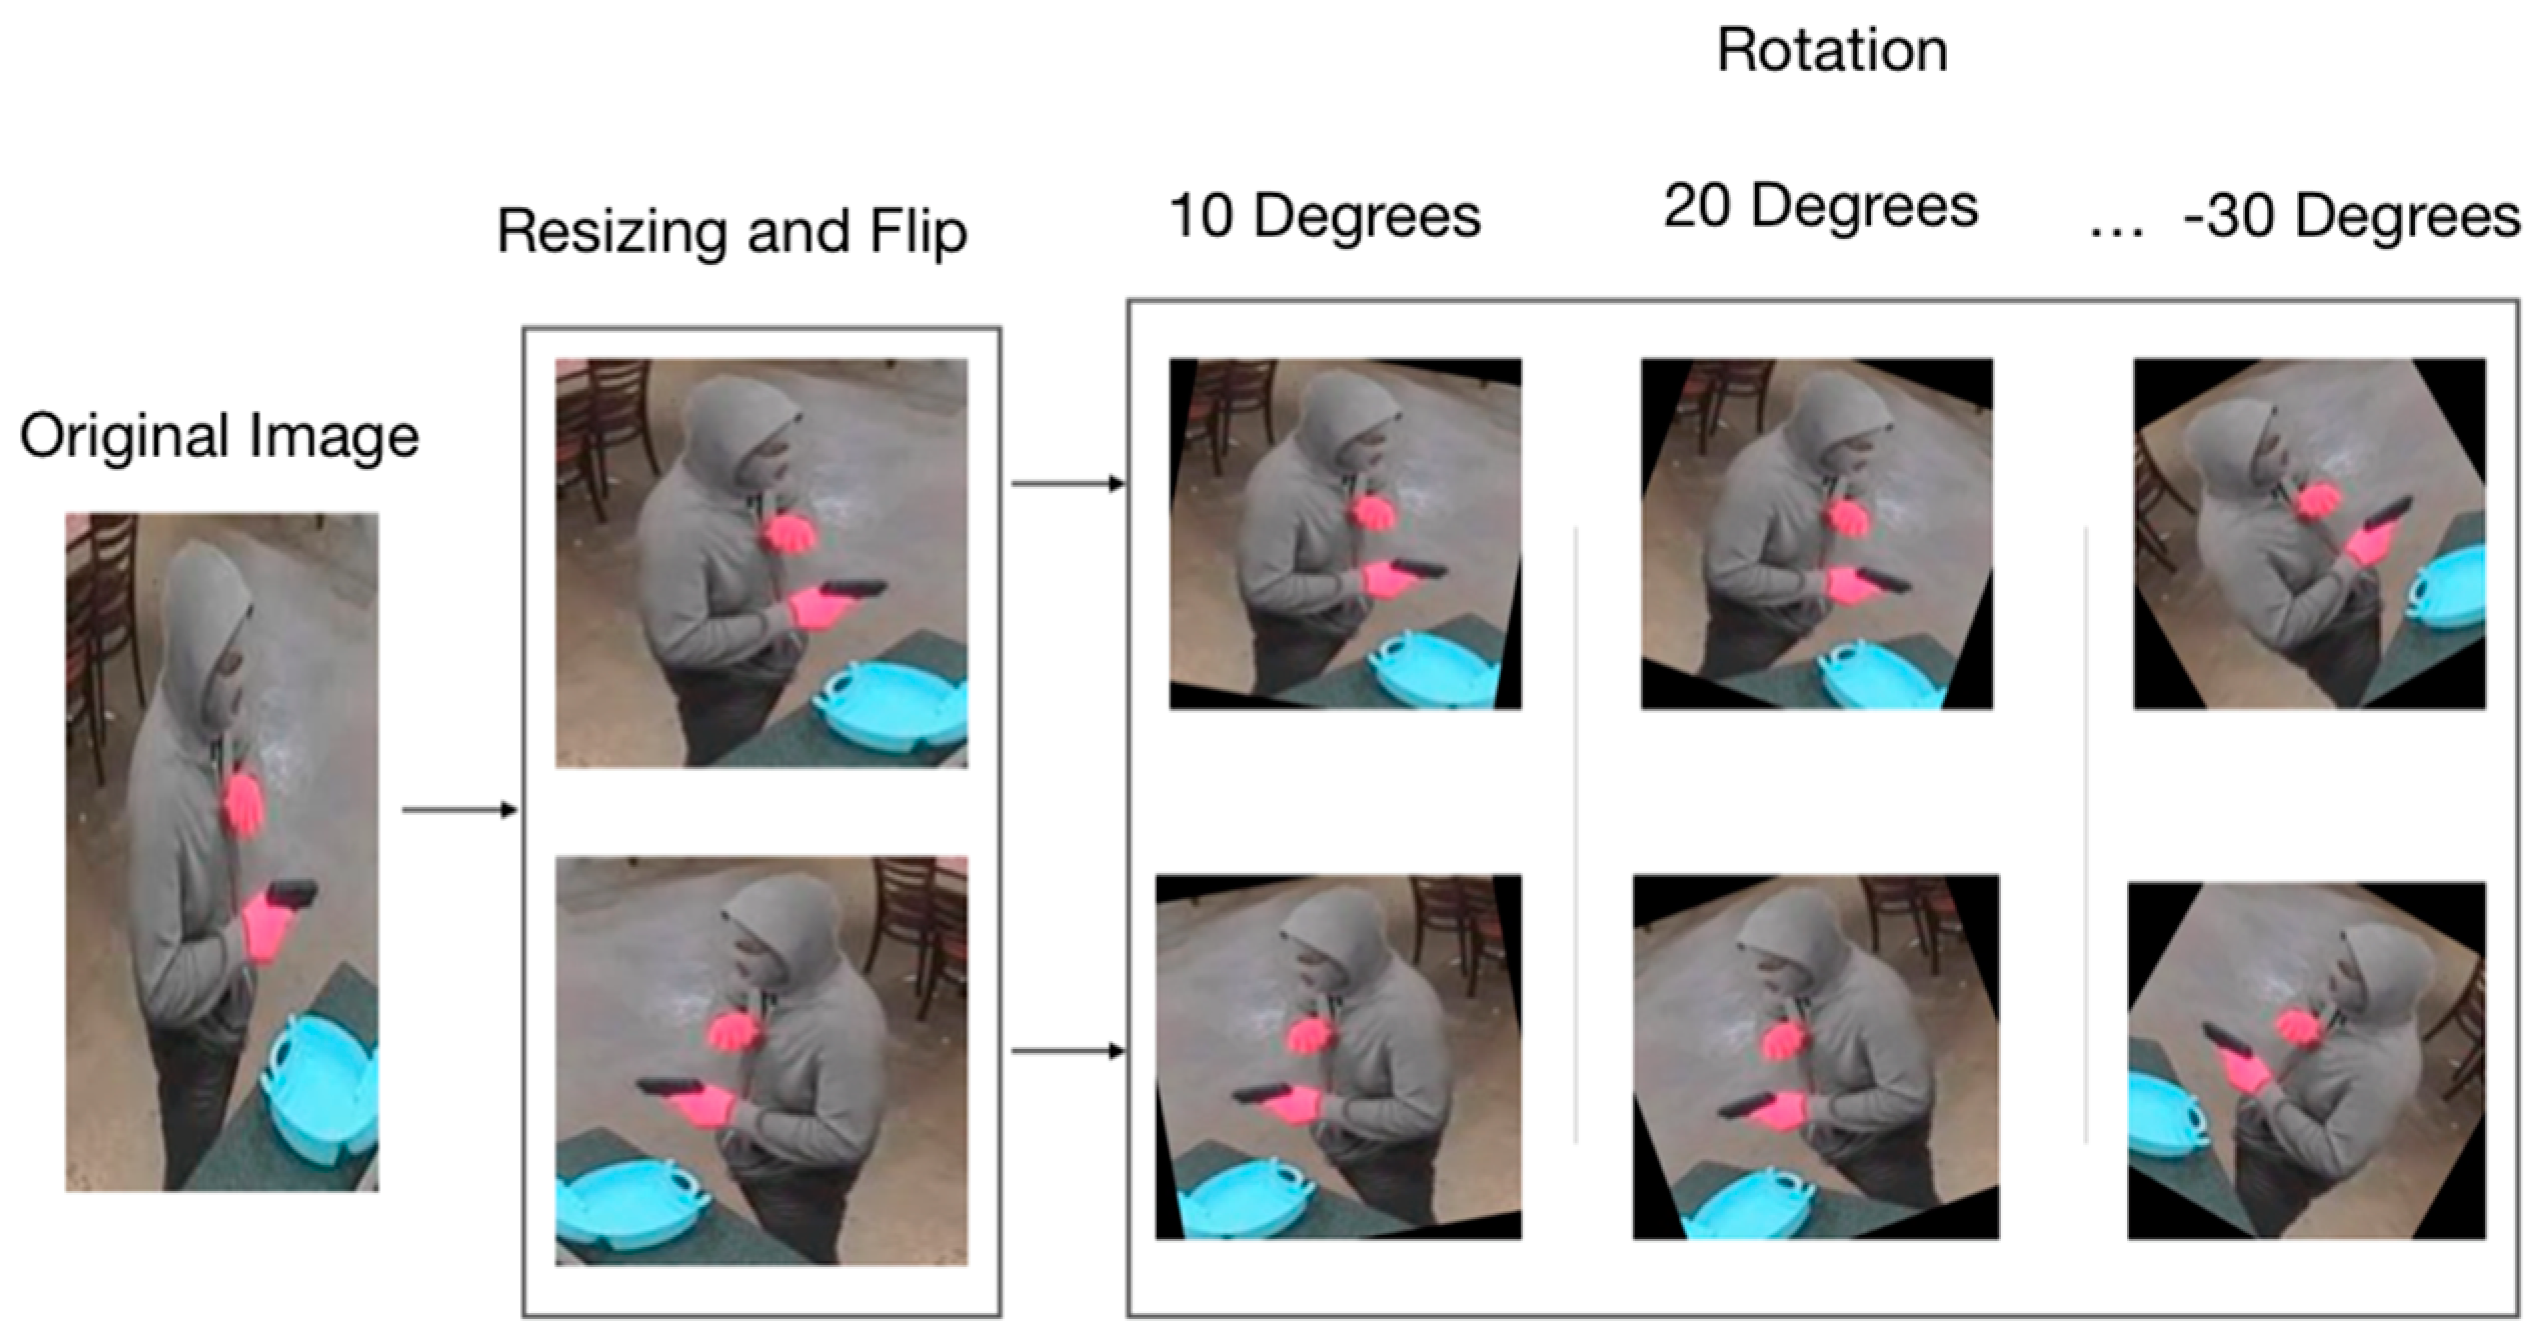
We used CNNs for the development of this system because this type of network is an automatic feature extractor and because this network allows us to detect the firearm in different types of positions and at different distances, which is very important in this application. Before using the database, it was first necessary to resize all the images to a fixed size, because the input of the CNN requires images of the same size. These images were resized to 224 × 224 pixels. It was also necessary to increase the number of images in the database. This was done by applying multiple techniques like flipping the image in the horizontal axis and rotating the images in multiple angles. With these techniques, we increased the original database from 17,684 images to 247,576 images. The applied techniques are shown in Figure 5.
All the details involved in the creation of this database are shown in [11]. The URL where the database is located is shown in Supplementary Materials URL S1.
For the development of the detection system we initially used 70% of the database for the training phase, 15% for the evaluation phase, and 15% for the testing phase. The detection system was developed using Python and TensorFlow. Before using the database, we proceeded to transform the database into a file called “TF.Record”, which is a simple binary format used by TensorFlow. Its use has a significant impact on the importation of the data. This is because for datasets that are too large to be stored in memory only the data that is required at the time (batch) are loaded and processed. This makes the importing process more efficient. Additionally, the binary data can be read more efficiently from the disk.
2.2. System Architecture
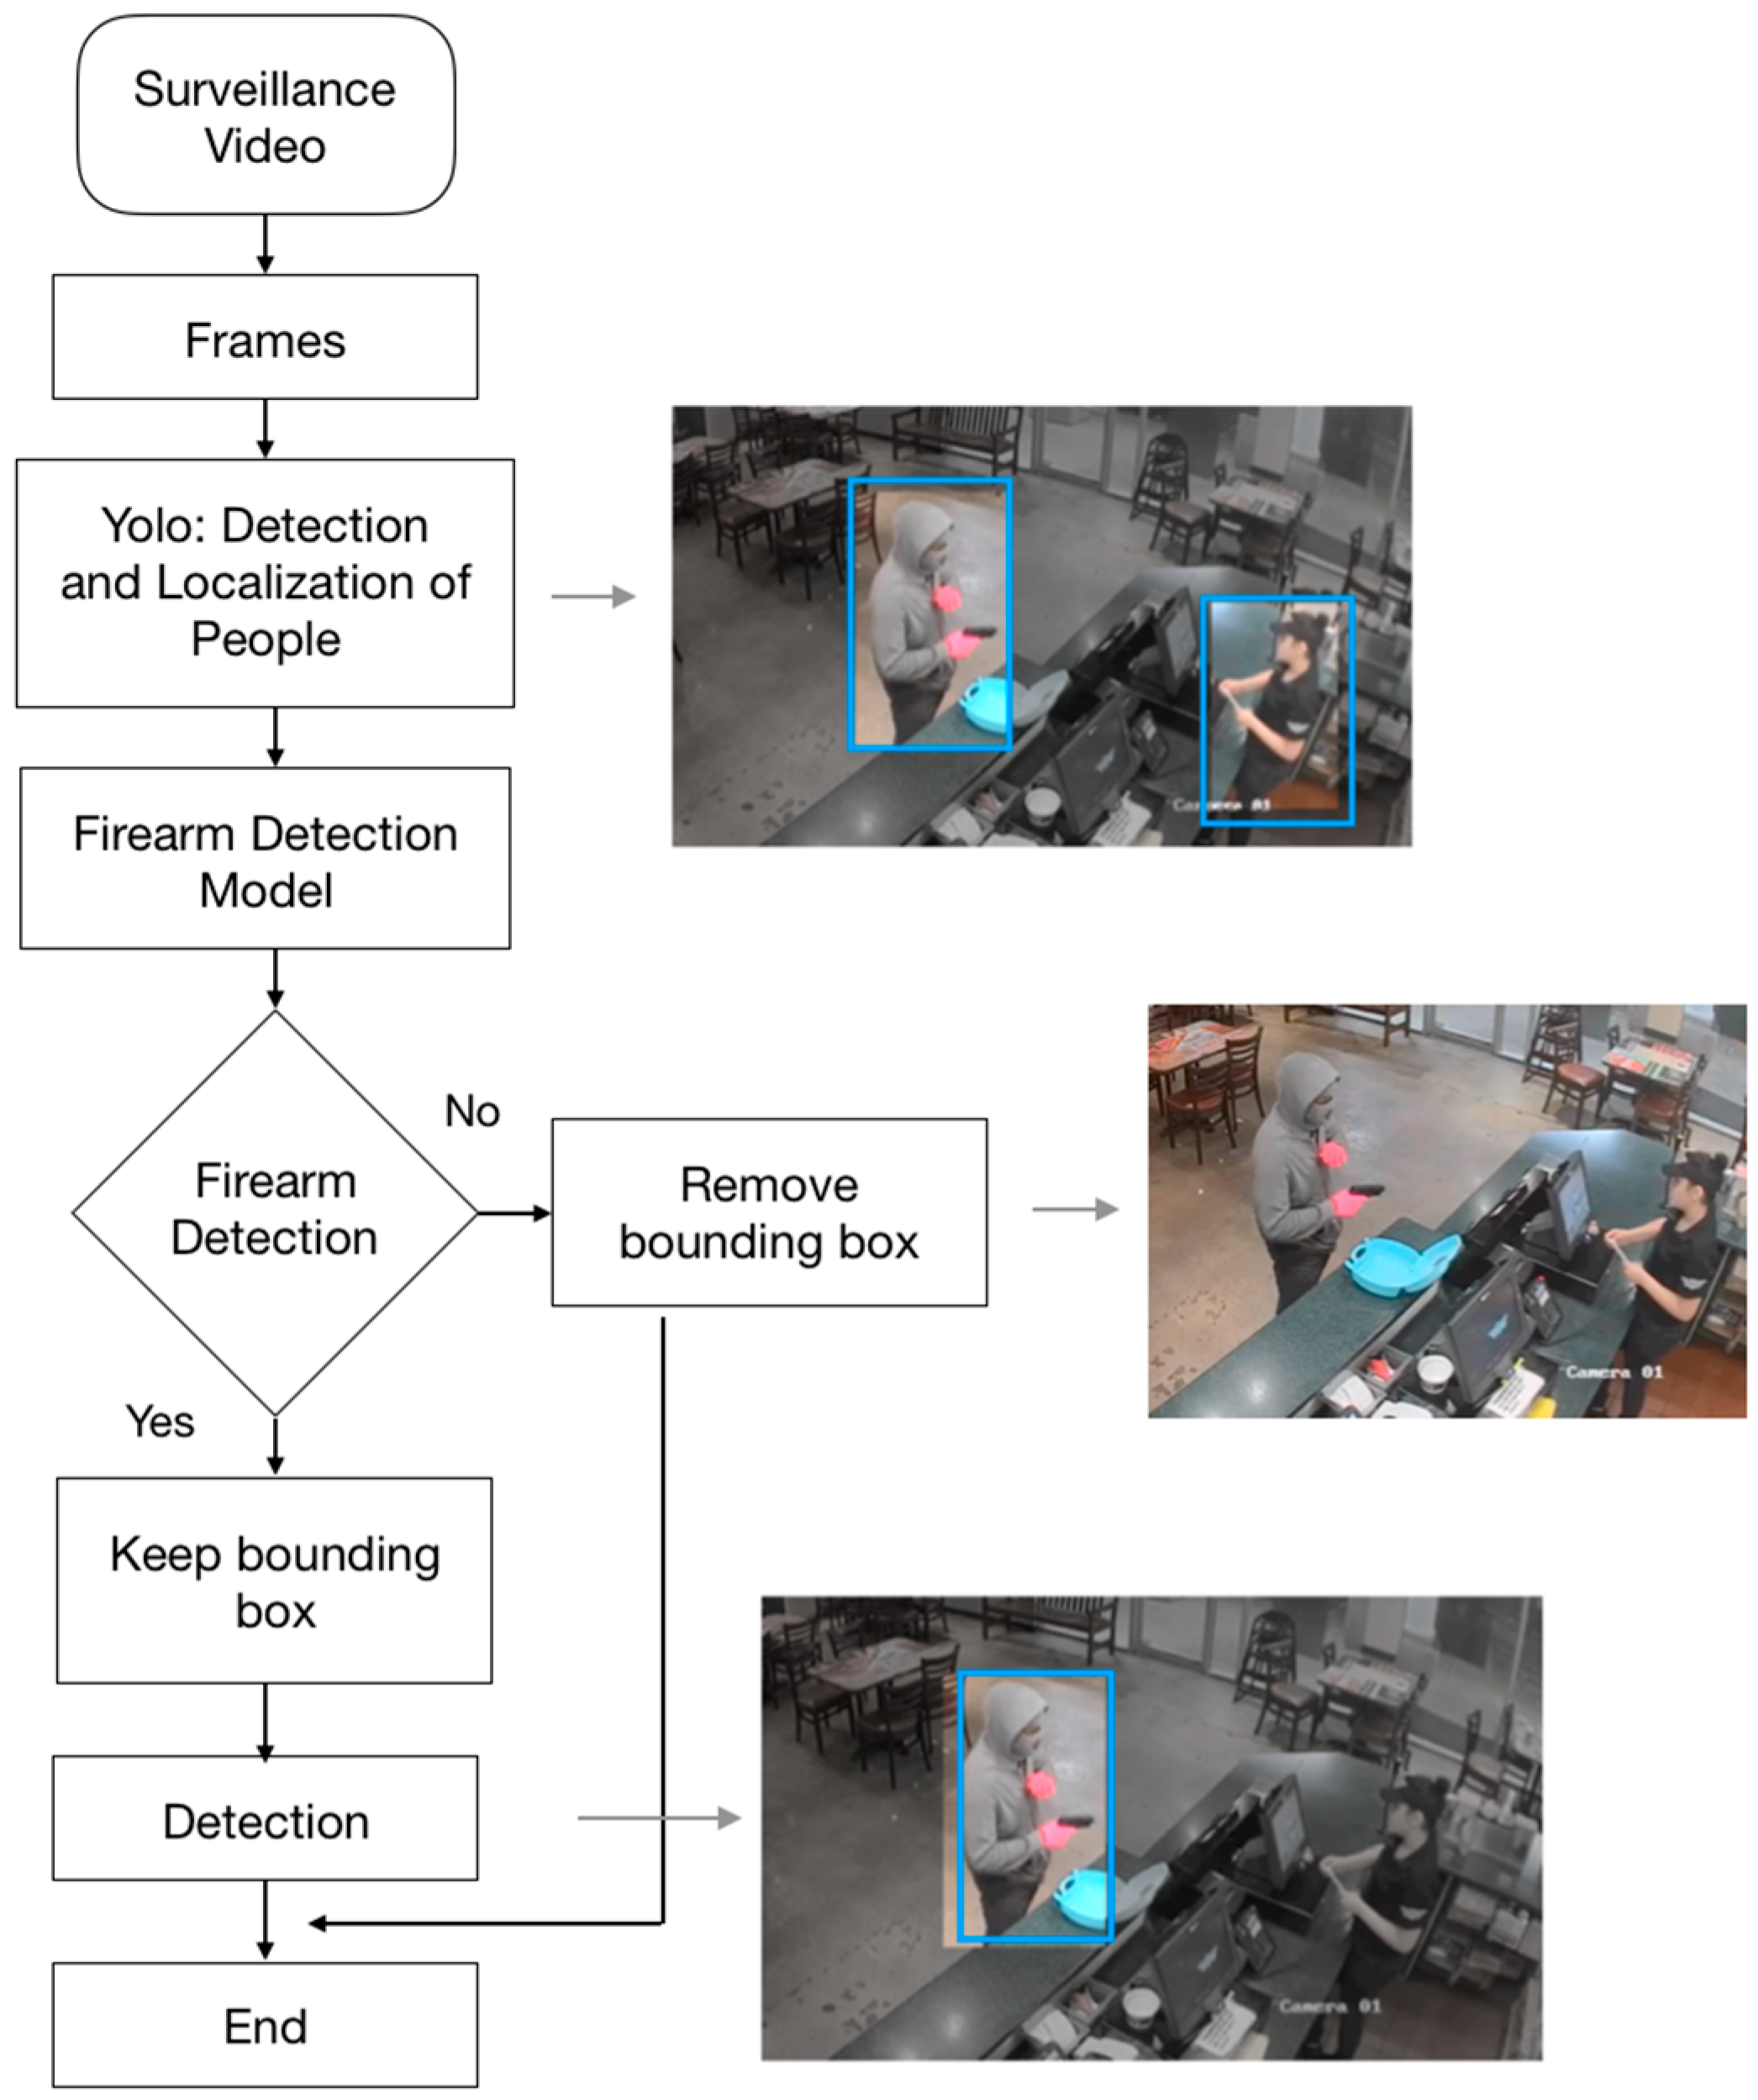
Surveillance cameras are usually located in places where there are a lot of people and multiple objects. Therefore, surveillance videos usually have high complexity in terms of the number of elements in each frame. To simplify the complex environments captured by the camera, we designed a detection system that is divided into two parts. The first part is called the “Front End” and is made up of the YOLO object detection and localization system. YOLO is a real-time object detection and localization system that was trained using a large database called COCO. This database has various types of categories such as persons, cars, animals, etc. The second part of the system is called the Back End, and is made up of the firearms detection model developed in this work. This is shown in Figure 6.
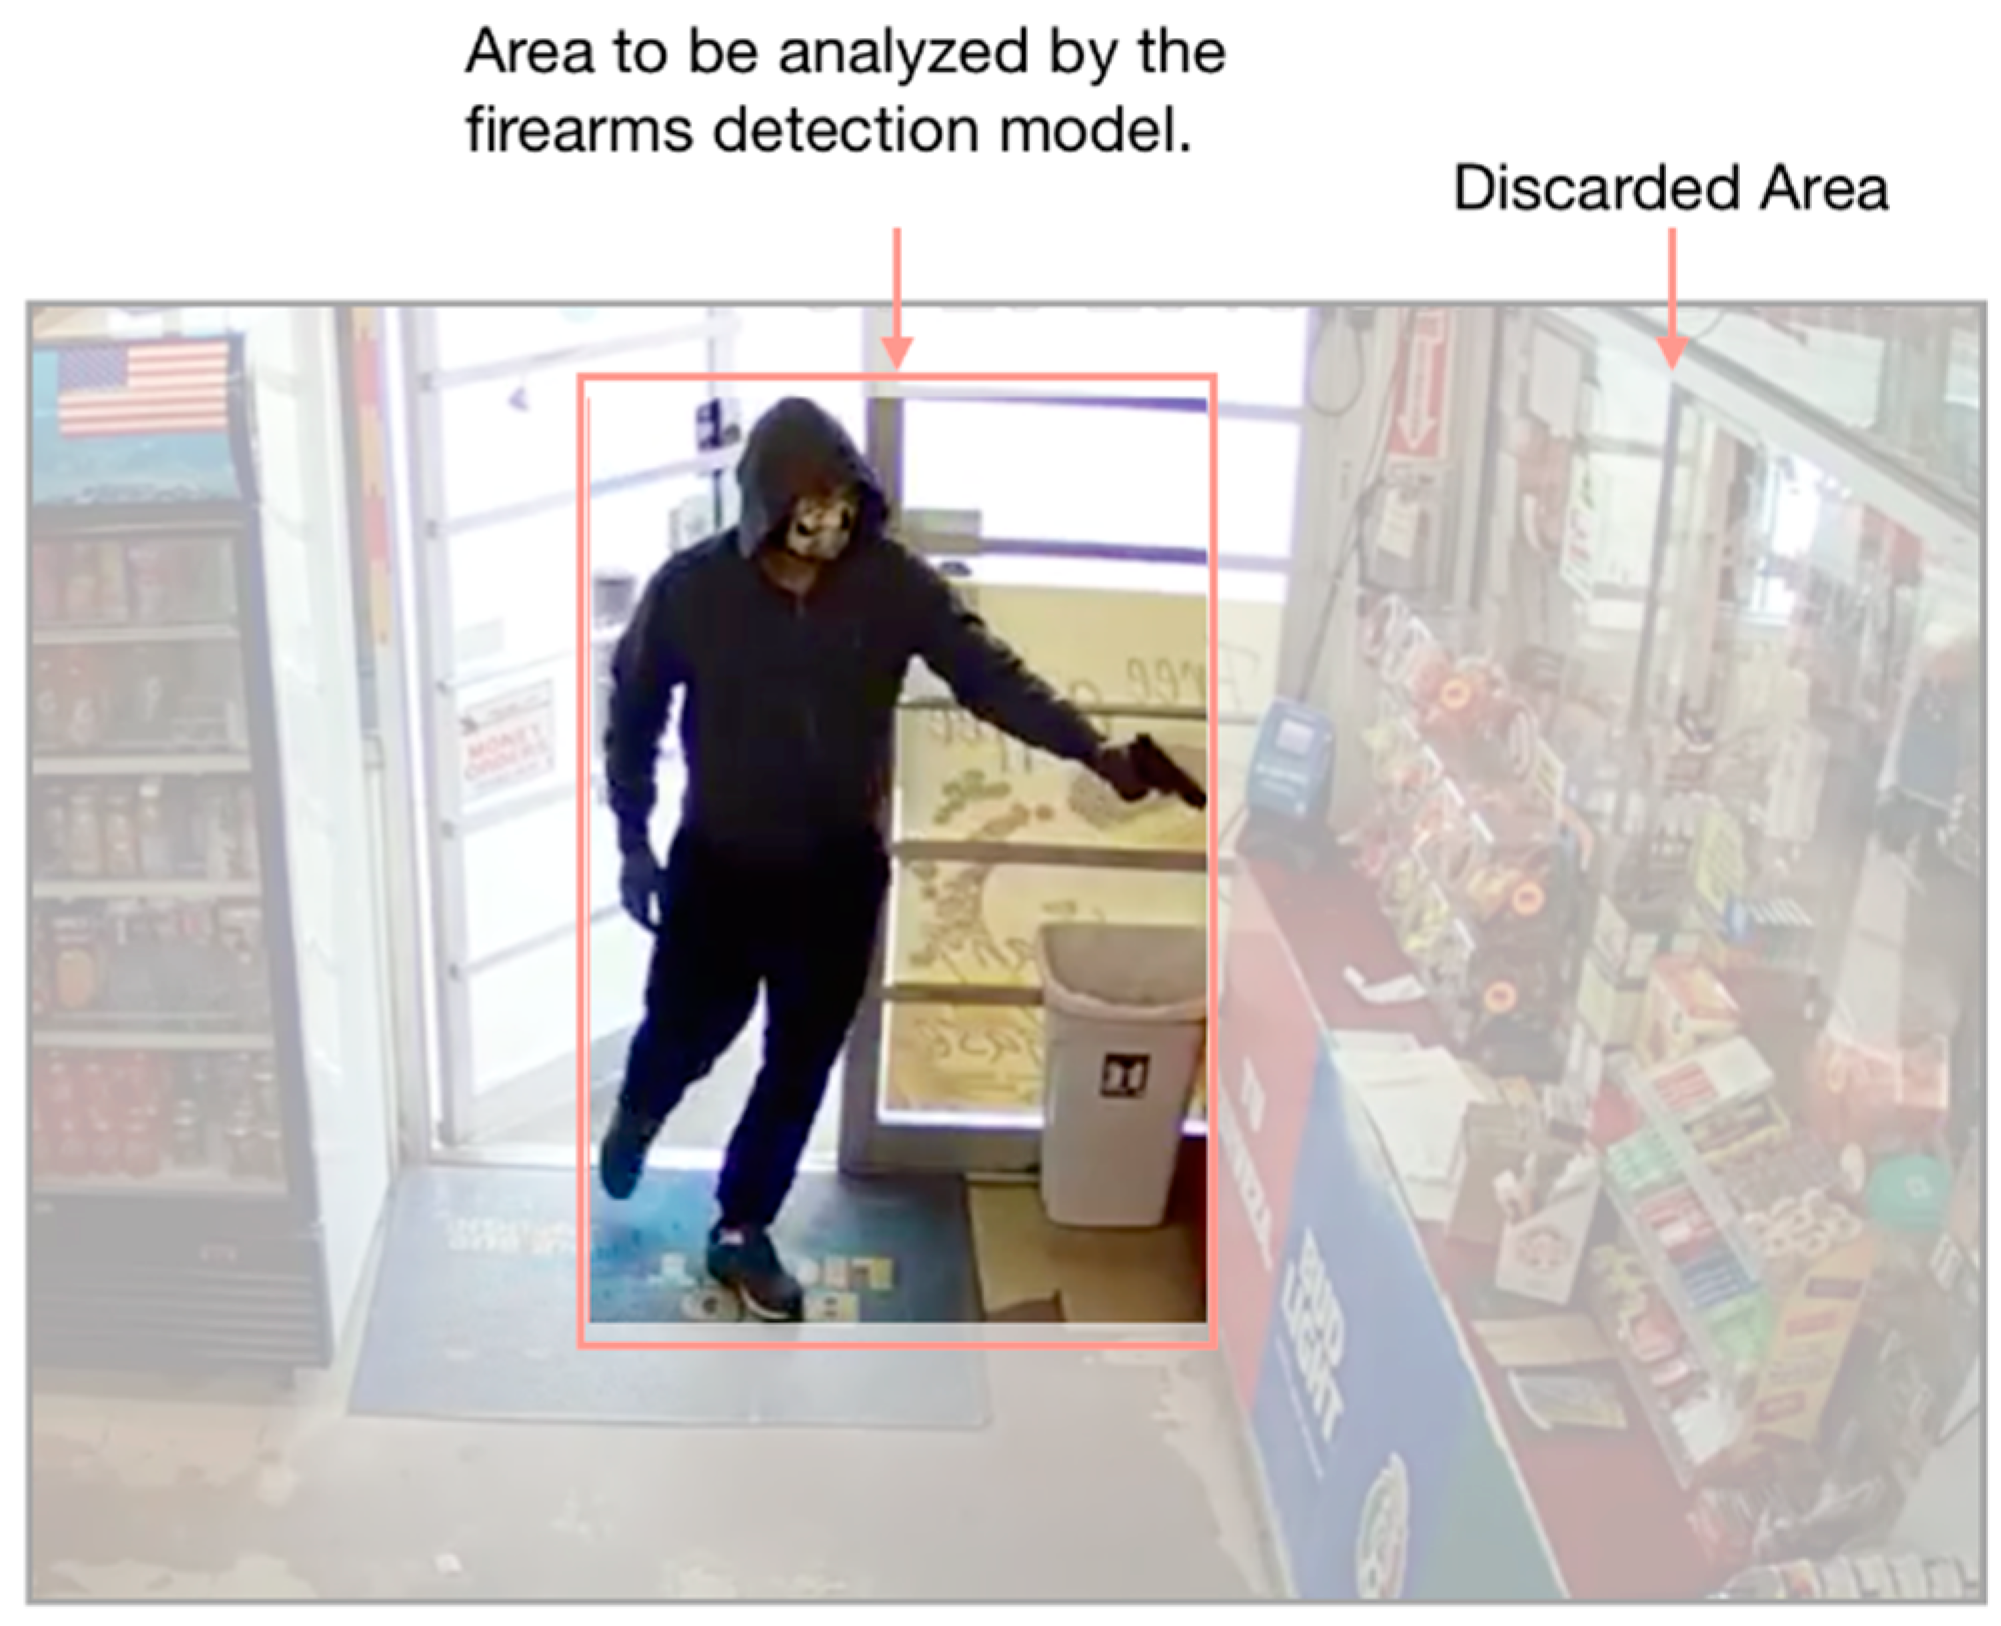
Firearms are almost exclusively found next to people. Therefore, these areas of an image are the most important regarding detection. YOLO is used to detect, locate, and identify the segments of an image where there are people. These segments are the images that will be the input for the developed firearm detection model. In this way, the firearm detection system will analyze only the segments of the image that are most important, reducing the possibility of obtaining false positives in places where firearms will never be found, discarding a large area of the image that is not important for detection. In this way we will not needlessly analyze multiple places in the image in search of firearm detection. By including this important step, we are greatly reducing the number of false alarms that would otherwise occur due to the complex environments of surveillance videos. This is shown in Figure 7 and Figure 8.
The firearm detection model was developed through a CNN. The structure of the CNN was chosen after we carried out different tests with multiple configurations. The initial concept was based on the idea of two types of network architectures that have obtained good results in image detection and classification tasks. The first one is VGG Net [12]. This network is characterized by its depth, implementing a large number of layers and small convolutional filters. The second one is ZF Net [13]. This network is characterized by the use of large convolutional filters in its first layer without implementing a large number of these filters. The CNN was programmed using TensorFlow through Custom Estimators, which is a TensorFlow API that simplifies the development of the model.
2.3. Evaluation Metrics
The evaluation of the model was made based on different metrics to quantify the quality of the predictions of the detection system. We considered the following metrics:
- Accuracy: In terms of a classifier, accuracy is defined as the probability of correctly predicting a class [14].
- Precision: Precision measures the fraction of examples classified as positive that are truly positive [17].
- Recall: Recall measures the fraction of positive examples that are correctly labeled [17].
3. Development and Results
3.1. Training and Evaluation Phases
For the training phase of the CNN, multiple tests were made, first using half of the database, which consists of 123,788 images. This test was made in order to determine if the new images that were created in the database augmentation phase by flipping and rotating the images provided new information or simply affected the training of the model. Second, the complete database was taken, which consists of 247,576 images. These tests were made with the structure that provided the best results in the previous tests using half of the database. For the training phase, we used a batch size of 200 images and a learning rate of 0.001. We used the gradient descent algorithm to train the networks. We implemented the ReLu activation function in the convolutional stage as well as in the layers of the fully connected neural network, except in the last layer where a SoftMax activation function was used. As mentioned previously, we put forward various network architectures based on VGG Net and ZF Net to find the architecture that provided the best results with the created database.
3.1.1. Tests Performed Using Half of the Database
Proposed Networks Based on VGG Net:
Firstly, two configurations were proposed based on VGG Net. These configurations were the same in the convolutional layers, but they differed in the number of neurons used in the fully connected network (FC). These networks were characterized by the use of a large number of small convolutional filters in their layers. These configurations implemented a 1-pixel step in the convolutional filters and a 2-pixel step in the max-pooling layers. These two configurations are shown in Table 1. The results obtained with these configurations are shown in Table 2.
Proposed Networks Based on ZF Net:
Three architectures were proposed based on ZF Net. These networks were characterized by the use of large filters in their first convolutional layers, differing from the previous architectures based on VGG Net that used 3 × 3 filters in all their layers. These configurations implemented a 2-pixel step in the first two convolutional layers and a 1-pixel step was used the following layers. In the max-pooling layers a 2-pixel step was used. These three configurations are shown in Table 3. The results obtained with these configurations are shown in Table 4.
Configurations C2 in test T4 and C3 in test T1 yielded the best results in the evaluation phase. These results were compared, showing that test T4 had an improvement in accuracy of 3.33% and in loss of 21.4% compared with the results obtained in test T1. Moreover, with these results, it can be concluded that the new images that were created in the database augmentation phase provided new information that helped the training of the system by providing complementary information to the initial one.
3.1.2. Tests Performed Using the Complete Database
After having confirmed in the previous tests that the increase of the database provided new information, we proceeded to carry out tests using the complete database using the architecture C2, which was the one that provided the best results in the previous test conducted with half of the database. The obtained results in the training and evaluation phases are shown in Table 5.
The best results were obtained in test T2 using grayscale images, resulting in an improvement in the evaluation phase in accuracy of 0.22% and in loss of 34.3% in comparison with the results obtained in test T1. Therefore, the model used in test T2 with grayscale images was used in the implementation of the system.
3.2. Test Phase
We proceeded to test the system using metrics that were obtained using a test set of 2723 images. Firstly, EER was obtained to find the detection sensitivity to which the system provided the least amount of errors, this value was obtained through the FAR and FRR values. The crossing between FAR and FRR provides the EER value, which corresponded to 0.09, with a sensitivity of 0.52. This is shown in Figure 9.
3.3. Interface
The interface that was created to implement the detection system is shown in Figure 10. The surveillance video is on the right side of the interface. When the system makes a detection, it locates the segment of the image where the firearm was detected, showing this segment on the left side of the interface in addition to an alert message that a firearm has been potentially detected.
4. Conclusions
This paper addressed the development of a firearm detection system. Two convolutional models were used in order to discard areas of the image that are irrelevant for the detection and to focus the firearm detection model only on the areas of the image where people are located. The results showed that with this configuration we were able to reduce the complex environment of real robbery scenarios, taking only the segments of the image where there were people, since these segments are the most important areas of the image to make a detection. Using a convolutional network architecture in the firearm detection model based on VGG Net allowed us to obtain a relative improvement in this application of 21.4% in loss and 3.33% in accuracy, compared to a convolutional network architecture based on ZF Net. The use of grayscale images allowed us to obtain a better performance, having an improvement of 0.22% in accuracy and 34.3% in loss in the evaluation phase of the network, compared to the results obtained with RGB images. In the final performance of the detection system, we obtained 86% precision and 86% recall, which are not the best results. However, to improve this performance, as future research lines it would be interesting to use the same architecture with the two convolutional models to focus the detection system only in the important parts of the image, but using a new model to detect firearms either by training the model on a larger database or using other models and adapting it to this problem with transfer learning.
Supplementary Materials
The Database S1 is available online at christiansalamea.info/databases/.
Author Contributions
D.R. proposed the idea, conceived and made the tests, analyzed the results, and wrote the paper. C.S. reviewed the paper and results.
Funding
This research received no external funding.
Conflicts of Interest
The authors declare no conflicts of interest.
References
- Deisman, W. CCTV: Literature Review and Bibliography; Research and Evaluation Branch, Community, Contract and Aboriginal Policing Services Directorate Royal Canadian Mounted Police: Ottawa, ON, Canada, 2003; pp. 1–24. [Google Scholar]
- Tiwari, R.; Verma, G. A Computer Vision Based Framework for Visual Gun Detection using Harris Interest Point Detector. Procedia Comput. Sci. 2015, 54, 703–712. [Google Scholar] [CrossRef]
- Tiwari, R.; Verma, G. A computer Vision Based Framework for Visual Gun Detection using Surf. In Proceedings of the 2015 International Conference on Electrical, Electronics, Signals, Communications and Optimization (EESCO), Visakhapatnam, India, 24–25 January 2015; pp. 1–5. [Google Scholar]
- Halima, N.; Hosam, O. Bag of Words Based Surveillance System Using Support Vector Machines. Int. J. Secur. Appl. 2016, 10, 331–346. [Google Scholar] [CrossRef]
- Gaga, M.; Lach, S.; Sieradzki, R. Automated Recognition of Firearms in Surveillance Video. In Proceedings of the 2013 IEEE International Multi-Disciplinary Conference on Cognitive Methods in Situation Awareness and Decision Support (CogSIMA), San Diego, CA, USA, 25–28 February 2013; pp. 45–50. [Google Scholar]
- Olmos, R.; Tabik, S.; Herrera, F. Automatic Handgun Detection Alarm in Videos using Deep Learning. Neurocomputing 2018, 275, 66–72. [Google Scholar] [CrossRef]
- Olmos, R.; Tabik, S.; Lamas, A.; Pérez-Hernandez, F.; Herrera, F. A Binocular Image Fusion Approach for Minimizing False Positives in Handgun Detection with Deep Learning. Inf. Fusion 2019, 49, 271–280. [Google Scholar] [CrossRef]
- Reolink. Available online: http://reolink.com/cctv-camera-types/ (accessed on 26 April 2019).
- Redmon, J.; Farhadi, A. Yolov3: An Incremental Improvement. arXiv 2018, arXiv:1804.02767. [Google Scholar]
- Mosselman, F.; Weenink, D.; Lindegaart, M. Weapons, Body Postures, and the Quest for Dominance in Robberies: A Qualitative Analysis of Video Footage. J. Res. Crime Delinq. 2018, 55, 3–26. [Google Scholar] [CrossRef] [PubMed]
- Romero, D.; Salamea, C. Design and Proposal of a Database for Firearms Detection. In Proceedings of the ICAETT 2019—International Conference on Advances in Emerging Trends and Technologies, Quito, Ecuador, 29–31 May 2019. [Google Scholar]
- Simonyan, K.; Zisserman, A. Very Deep Convolutional Neural Networks for Large Scale Image Recognition. arXiv 2014, arXiv:1409.1556. [Google Scholar]
- Zeiler, M.D.; Fergus, R. Visualizing and Understanding Convolutional Neural Networks. Lect. Notes Comput. Sci. 2014, 8689, 818–833. [Google Scholar]
- Menditto, A.; Patriarca, M.; Magnusson, B. Understanding the Meaning of Accuracy, Trueness and Precision. Accredit. Qual. Assur. 2016, 12, 45–47. [Google Scholar] [CrossRef]
- Galdi, P.; Tagliaferri, R. Data mining: Accuracy and Error Measures for Classification and Prediction. Encycl. Bioinform. Comput. Biol. 2018, 1, 431–436. [Google Scholar]
- Hammad, A.M.; Elhadary, R.S.; Elkhateed, A.O. Multimodal Biometric Personal Identification System based on Iris & Fingerprint. Int. J. Comput. Sci. Commun. Netw. 2013, 3, 226–230. [Google Scholar]
- Davis, J.; Goadrich, M. The Relationship Between Precision-Recall and ROC Curves. In Proceedings of the 23rd International Conference on Machine Learning, Pittsburg, CA, USA, 25–29 June 2006; pp. 233–240. [Google Scholar]
Figure 1.
Structure—Class A.

Figure 2.
Structure—Class B.

Figure 3.
Firearm position.

Figure 4.
Luminosity scale.

Figure 5.
Database augmentation.

Figure 6.
System architecture.

Figure 7.
Segmentation.

Figure 8.
Firearm detection system.

Figure 9.
Equal error rate (EER). FAR: false positive rate; FRR: false negative rate.

Figure 10.
Interface.


Table 1.
Proposed networks based on VGG Net—Using half of the database. FC: fully connected.
| Configurations | |
|---|---|
| C1 | C2 |
| Conv 3 × 3 - 64 | Conv 3 × 3 - 64 |
| Max-Pooling 2 × 2 | |
| Conv 3 × 3 - 128 | Conv 3 × 3 - 128 |
| Max-Pooling 2 × 2 | |
| Conv 3 × 3 - 256 | Conv 3 × 3 - 256 |
| Max-Pooling 2 × 2 | |
| Conv 3 × 3 - 512 | Conv 3 × 3 - 512 |
| Max-Pooling 2 × 2 | |
| Conv 3 × 3 - 512 | Conv 3 × 3 - 512 |
| Max-Pooling 2 × 2 | |
| FC - 2048 | FC - 4096 |
| FC - 2048 | FC - 2 |
| SoftMax | |
Table 2.
Results obtained with the networks based on VGG Net—Using half of the database.
| Tests | Image | Steps | Training | Evaluation | |||
|---|---|---|---|---|---|---|---|
| Loss | Accuracy | Loss | Accuracy | ||||
| C1 | T1 | RGB | 10,000 | 0.32 | 0.81 | 0.30 | 0.84 |
| C2 | T2 | RGB | 10,000 | 0.27 | 0.83 | 0.30 | 0.86 |
| T3 | RGB | 12,500 | 0.20 | 0.84 | 0.25 | 0.89 | |
| T4 | RGB | 16,000 | 0.16 | 0.87 | 0.22 | 0.90 | |
| T5 | Gray | 16,000 | 0.20 | 0.85 | 0.26 | 0.89 | |
Table 3.
Proposed networks based on ZF Net—Using half of the database.
| Configurations | ||
|---|---|---|
| C3 | C4 | C5 |
| Conv 7 × 7 - 64 | Conv 7 × 7 - 92 | Conv 7 × 7 - 92 |
| Max-Pooling 3 × 3 | ||
| Conv 5 × 5 - 128 | Conv 5 × 5 - 192 | Conv 5 × 5 - 192 |
| Max-Pooling 3 × 3 | ||
| Conv 3 × 3 - 192 | Conv 3 × 3 - 256 | Conv 3 × 3 - 256 |
| Conv 3 × 3 - 192 | Conv 3 × 3 - 256 | Conv 3 × 3 - 256 |
| Conv 3 × 3 - 128 | Conv 3 × 3 - 192 | Conv 3 × 3 - 192 |
| Max-Pooling 3 × 3 | ||
| FC - 2048 | FC - 4096 | FC - 4096 |
| FC - 2048 | FC - 2 | FC - 2048 |
| FC - 2 | FC - 2 | |
| SoftMax | ||
Table 4.
Results obtained with the networks based on ZF Net—Using half of the database.
| Tests | Image | Steps | Training | Evaluation | |||
|---|---|---|---|---|---|---|---|
| Loss | Accuracy | Loss | Accuracy | ||||
| C3 | T1 | RGB | 17,000 | 0.28 | 0.81 | 0.28 | 0.87 |
| T2 | Gray | 9000 | 0.29 | 0.79 | 0.33 | 0.85 | |
| T3 | Gray | 11,000 | 0.12 | 0.82 | 0.35 | 0.87 | |
| C4 | T4 | RGB | 19,000 | 0.21 | 0.82 | 0.29 | 0.86 |
| C5 | T5 | Gray | 15,000 | 0.13 | 0.85 | 0.32 | 0.86 |
Table 5.
Results obtained with the configuration C2—Using the complete database.
| Tests | Image | Steps | Training | Evaluation | |||
|---|---|---|---|---|---|---|---|
| Loss | Accuracy | Loss | Accuracy | ||||
| C2 | T1 | RGB | 16,500 | 0.15 | 0.857 | 0.32 | 0.906 |
| T2 | Gray | 14,000 | 0.17 | 0.855 | 0.21 | 0.908 | |
Table 6.
Confusion matrix.
| Images | Predictions | |||
|---|---|---|---|---|
| With Firearms | Without Firearms | |||
| Classes | With Firearm | 1361 | 1175 | 186 |
| Without Firearm | 1362 | 192 | 1170 | |
Table 7.
Recall and precision values.
| Metrics | Results |
|---|---|
| Recall | 0.86 |
| Precision | 0.86 |
© 2019 by the authors. Licensee MDPI, Basel, Switzerland. This article is an open access article distributed under the terms and conditions of the Creative Commons Attribution (CC BY) license (http://creativecommons.org/licenses/by/4.0/).
Share and Cite
MDPI and ACS Style
Romero, D.; Salamea, C. Convolutional Models for the Detection of Firearms in Surveillance Videos. Appl. Sci. 2019, 9, 2965. https://doi.org/10.3390/app9152965
AMA Style
Romero D, Salamea C. Convolutional Models for the Detection of Firearms in Surveillance Videos. Applied Sciences. 2019; 9(15):2965. https://doi.org/10.3390/app9152965
Chicago/Turabian StyleRomero, David, and Christian Salamea. 2019. "Convolutional Models for the Detection of Firearms in Surveillance Videos" Applied Sciences 9, no. 15: 2965. https://doi.org/10.3390/app9152965
Note that from the first issue of 2016, this journal uses article numbers instead of page numbers. See further details here.