Meso-Scale Simulation of Concrete Based on Fracture and Interaction Behavior

1
Department of Structural Engineering, College of Civil Engineering, Tongji University, Siping Lu 1239 hao, Yangpu Qu, Shanghai 200092, China
2
Key Laboratory of Ministry of Education for Advanced Civil Engineering and Materials, Tongji University, Siping Lu 1239 hao, Yangpu Qu, Shanghai 200092, China
*
Author to whom correspondence should be addressed.
Appl. Sci. 2019, 9(15), 2986; https://doi.org/10.3390/app9152986
Submission received: 27 June 2019
/
Revised: 22 July 2019
/
Accepted: 22 July 2019
/
Published: 25 July 2019
(This article belongs to the Special Issue Fatigue and Fracture of Non-metallic Materials and Structures)
Abstract
:Based on the cohesive zone model, a meso-scale model is developed for numerical studies of three-phase concrete under tension and compression. The model is characterized by adopting mixed-mode fracture and interaction behavior to describe fracture, friction and collision in tension and compression processes. The simulation results match satisfactorily with the experimental results in both mechanical characteristics and failure mode. Whole deformation and crack propagation process analyses are conducted to reveal damage evolution of concrete. The analyses also set a foundation for the following parametric studies in which mode II fracture energy, material parameter, frictional angle and aggregates’ mechanical characteristics are considered as variables. It shows that the mixed-mode fracture accounts for a considerable proportion, even in tension failure. Under compression, the frictional stress can constrain crack propagation at the beginning of the damage and reestablish loading path during the softening stage. Aggregates’ mechanical characteristics mainly affect concrete’s performance in the mid-and-late softening stage.
1. Introduction
It is widely accepted that the dominant failure mode of concrete is quasi-brittle fracture, which is mainly due to the expanding and connecting of initial defects and microcracks. To explain the behavior of concrete’s fracture, concepts of fracture mechanics were introduced more than 50 years ago [1]. Although it is suitable for applying fracture mechanics theories to the analysis of mass concrete structures, it is inappropriate for application when microcrack and subcritical crack are not ignorable [2]. The sizes of microcracks and subcritical cracks of concrete are several orders of magnitude larger than that of metal. Meanwhile, concrete is a kind of multiphase and heterogeneous material, so the COD (crack opening displacement) and J-integral in elastic-plastic fracture mechanics are inappropriate for application [3].
The macro-mechanic response of concrete is the reflection of its meso-mechanical and micro-mechanic characteristics [2]. According to this idea, scholars have attempted to use finite element methods to research fractures in concrete, similar to the research of metal fractures [4]. Due to the advance of multi-processors’ parallel processing capability, finite element simulation of composite material’s meso-mechanical characteristics has progressed [5]. Through simulation, it is possible to predict the macro performance of concrete with its specific meso-scale structure, material and internal property [6].
Based on the macroscopic experimental phenomena of concrete, several concrete crack models have been proposed to simulate the fracture behavior of concrete. In the 1960s, two basic models were proposed: the discrete crack model [7] and smeared crack model [8]. The former simulates cracking by the definition of nodes’ split criterion, which can describe the geometric discontinuity at cracks. The latter simulates cracking by the definition of elements’ damage, and the model is maintained to be geometrically continuous. Representative discontinuous models include the lattice model [9], rigid bodies-spring model [10], and interface constitutive model [11]. Although the previously mentioned discrete crack model can provide intuitionistic and realistic simulations of crack behavior, their calculation results are sensitive to mesh distortion. In recent years, simulating discrete crack by cohesive zone model [12] and extended finite element method [13] are widely recognized as reliable approaches for their low mesh sensitivity and satisfactory convergent property [14].
The cohesive zone model simulates fractures by inserting cohesive elements at the potential crack propagation paths. The method breaks through the limit of using stress fields and stress intensity factor to describe concrete fracture. Unlike traditional investigation of fracture mechanics, the method uses fracture energy to define the constitutive relation between element deformation and damage on a much grander scale. As mentioned above, the special fracture behavior caused by microcracks and subcritical cracking can be described by elements’ fracture energy. Ongoing studies have been being conducted on concrete fracture energy [15,16,17,18,19,20], and corresponding testing methods of different fracture types have been proposed [21,22].
The cohesive zone model has been frequently adopted in the simulation of the concrete failure problem and proved to be feasible in concrete tension fracture simulation [23,24,25,26,27,28]. However, very few studies report its application in concrete compression simulation, which has a more complex damage evolution in the fracture process [29].
Although it is widely accepted that the main concrete failure process is fracturing [30] and many concrete crack models have been proposed to describe this process, there is still a need of a unified approach to simulate the mechanical behavior and appearance of concrete under different loading conditions. The objective of this research is to extend the application range of the cohesive zone model, making the model suitable for concrete fracture simulation both under tension and compression. Quantifying the effects of the different material and interaction parameters studied in this paper contributes to revealing the relationship between meso-scale fracture and macroscopic behavior of concrete.
2. Finite Element Modeling Method
The explicit method in the Abaqus/Explicit module is used in this paper to simulate concrete tension and the compression loading process. Since friction and collision of particles play a significant role in concrete’s compression softening stage, interaction behavior is defined to describe the contact behavior. The general contact algorithm in Abaqus/Explicit can only be used with three-dimensional surfaces [31], so three-dimensional models are used for simulation.
The models are built to simulate concrete uniaxial tension and compression experiments conducted by Ren et al. [32]. The specimens used for experiments are cuboids with dimensions of 150 × 150 × 50 mm, which were cut from large plate specimens with dimensions of 500 × 500 × 50 mm. The mean tension and compression elastic modules are 42.0 GPa and 37.5 GPa, respectively. The mean tension and compression strengths are 3.24 MPa and 37.5 MPa, respectively. The volume proportion of aggregates calculated by the mixture ratio is 45.1%. For computing efficiency, aggregates whose particle diameters are greater than 2.5 mm are modeled. The fine aggregates and cement matrix are treated as mortar whose mechanical behavior is simulated by mortar particle elements and internal interface elements.
As incomputable microcracks occur during the fracture process, it is difficult to apply the fracture criterion to simulate concrete fracture at the micro-scale. However, it is appropriate to use the traction-separation law to describe the meso-scale damage and fracture caused by the microcracks. For this reason, cohesive elements are used to simulate damage evolution and energy dissipation of concrete. In the main study of this paper (Section 6.4), the cohesive elements are only inserted between the elements of aggregates and mortar (interfacial transitional zones, ITZs), and inside the mortar elements (mortar internal interface, MII), as shown in Figure 1. In the study of Section 6.4, the cohesive elements are also inserted inside the aggregate elements (aggregate internal interface, AII), to study the effects of aggregates’ mechanical characteristics. In this paper, the study adopts the simplifying assumption that the interface properties of ITZs, MII, AII are the same.
The models are meshed by irregular triangle elements in the plane (Figure 1). Compared with other polygon elements, triangle elements provide the maximum number of interfaces with the same nodes in the plane. Cohesive elements are inserted into the interfaces to simulate damage and fracture behaviors.
The displacement loading control is adopted to obtain the complete tension and compression process data. The vertical motions of the nodes at the bottom boundary are constrained. The load is applied by controlling the motions of the nodes at the top boundary. All nodes’ motions in the direction normal to the plane are constrained. In the tension and compression simulations, the final vertical displacements of the top nodes are 0.09 mm and 0.9 mm, respectively. The total time of loading is 100 s. In the first 20 s and last 80 s, the vertical motions of the top nodes are uniformly accelerated and uniform, respectively.
2.1. Mortar Particle and Aggregate Material Model
The linear elastic model is adopted for modeling the behavior of the mortar particles and aggregates. The mortar particles and aggregates are modeled by the six-node linear triangular prism (C3D6) elements. Although the mortar particles and aggregates are assumed to be isotropic in the two-dimensional plane, they need to be defined as anisotropic to eliminate the Poisson effect in the direction normal to the plane. The Poisson ratios normal to the plane are set to zero.
Referring to previous material test results, different elastic moduli are set to the mortar particles and aggregates to simulate the crack propagation caused by local deformation difference. The macroscopic modulus () of specimens can be estimated by the following formula:
where and are the moduli of aggregates and mortar, and and are the volume proportions of aggregates and mortar. The formula is obtained through a short derivation. In the derivation, it is assumed that mortar and aggregates are connected in series. Based on the volume proportions and moduli, Equation (1) was derived.
2.2. Aggregate Generation
The aggregates are generated through modeling arbitrary polygon aggregates based on a pre-generated mesh [33]. The plane is meshed by triangular grids. The nodes’ coordinate information is extracted as the basis to model aggregates, and check conflicts and overlaps. The distributions of aggregates accord with Fuller grading cumulative distribution. The function of Fuller grading curve can be decomposed into two dimensions [34] as:
where denotes the proportion of aggregates whose particle diameter are smaller than the threshold value , is the ratio of the total volume of aggregates to the concrete volume, and is the diameter of the largest aggregate particle.
The geometrical shapes of aggregates are formed by the polygons’ vertices. A random function expressed in terms of the polar coordinates and is used to generate the vertices, as shown in Figure 2. To enforce randomicity and ergodicity, random numbers are introduced while generating the radius and angle. The vertices location is defined as follows:
where is a random number less than 1 and greater than −1, is the edge number, and and are the radius and angle fluctuations respectively. and are used to control the irregularity of aggregates. The greater and , the more irregular the generated aggregates will be. If and , the generated aggregates are regular polygons.
2.3. Interfacial Transitional Zones (ITZs) and Mortar Internal Interface (MII) Model
The ITZs and MII are modeled by eight-node three-dimensional cohesive elements (CH3D8). Cohesive elements only allow separation in one specific direction (Figure 3). Therefore, cracks can only propagate along the boundaries of particle elements, which may lead to mesh sensitivity [35]. In the case of control computing cost, the fine and irregular mesh is generated to provide more path choices for the crack propagation and to reduce the mesh sensitivity to some extent [36]. The geometrical (constitutive) thickness of cohesive elements is set to zero to maintain the original geometrical partition. The quadratic nominal stress criterion is adopted to define the beginning of an element’s degradation, which is presented as follows:
where , and represent the maximum allowable nominal stresses in normal and two shear directions, respectively. Likewise, , and represent the values of the nominal tensile stress and nominal shear stresses in two directions, respectively.
In this paper, linear damage evolution is selected to describe the traction-separation law, for its excellent computing efficiency and high accuracy [37].
Damage evolution is defined based on the mode I and II fracture energies, which are obtainable from the experiments. Since the model is two-dimensional, the out-of-plane shear failure mode will not happen, and the fracture energy in mode III is not taken into account. Different types of concrete shear experiments have shown that the mode II fracture energy of concrete is about 20 to 25 times larger than mode I fracture energy [22,38,39]. The findings are used in the present research.
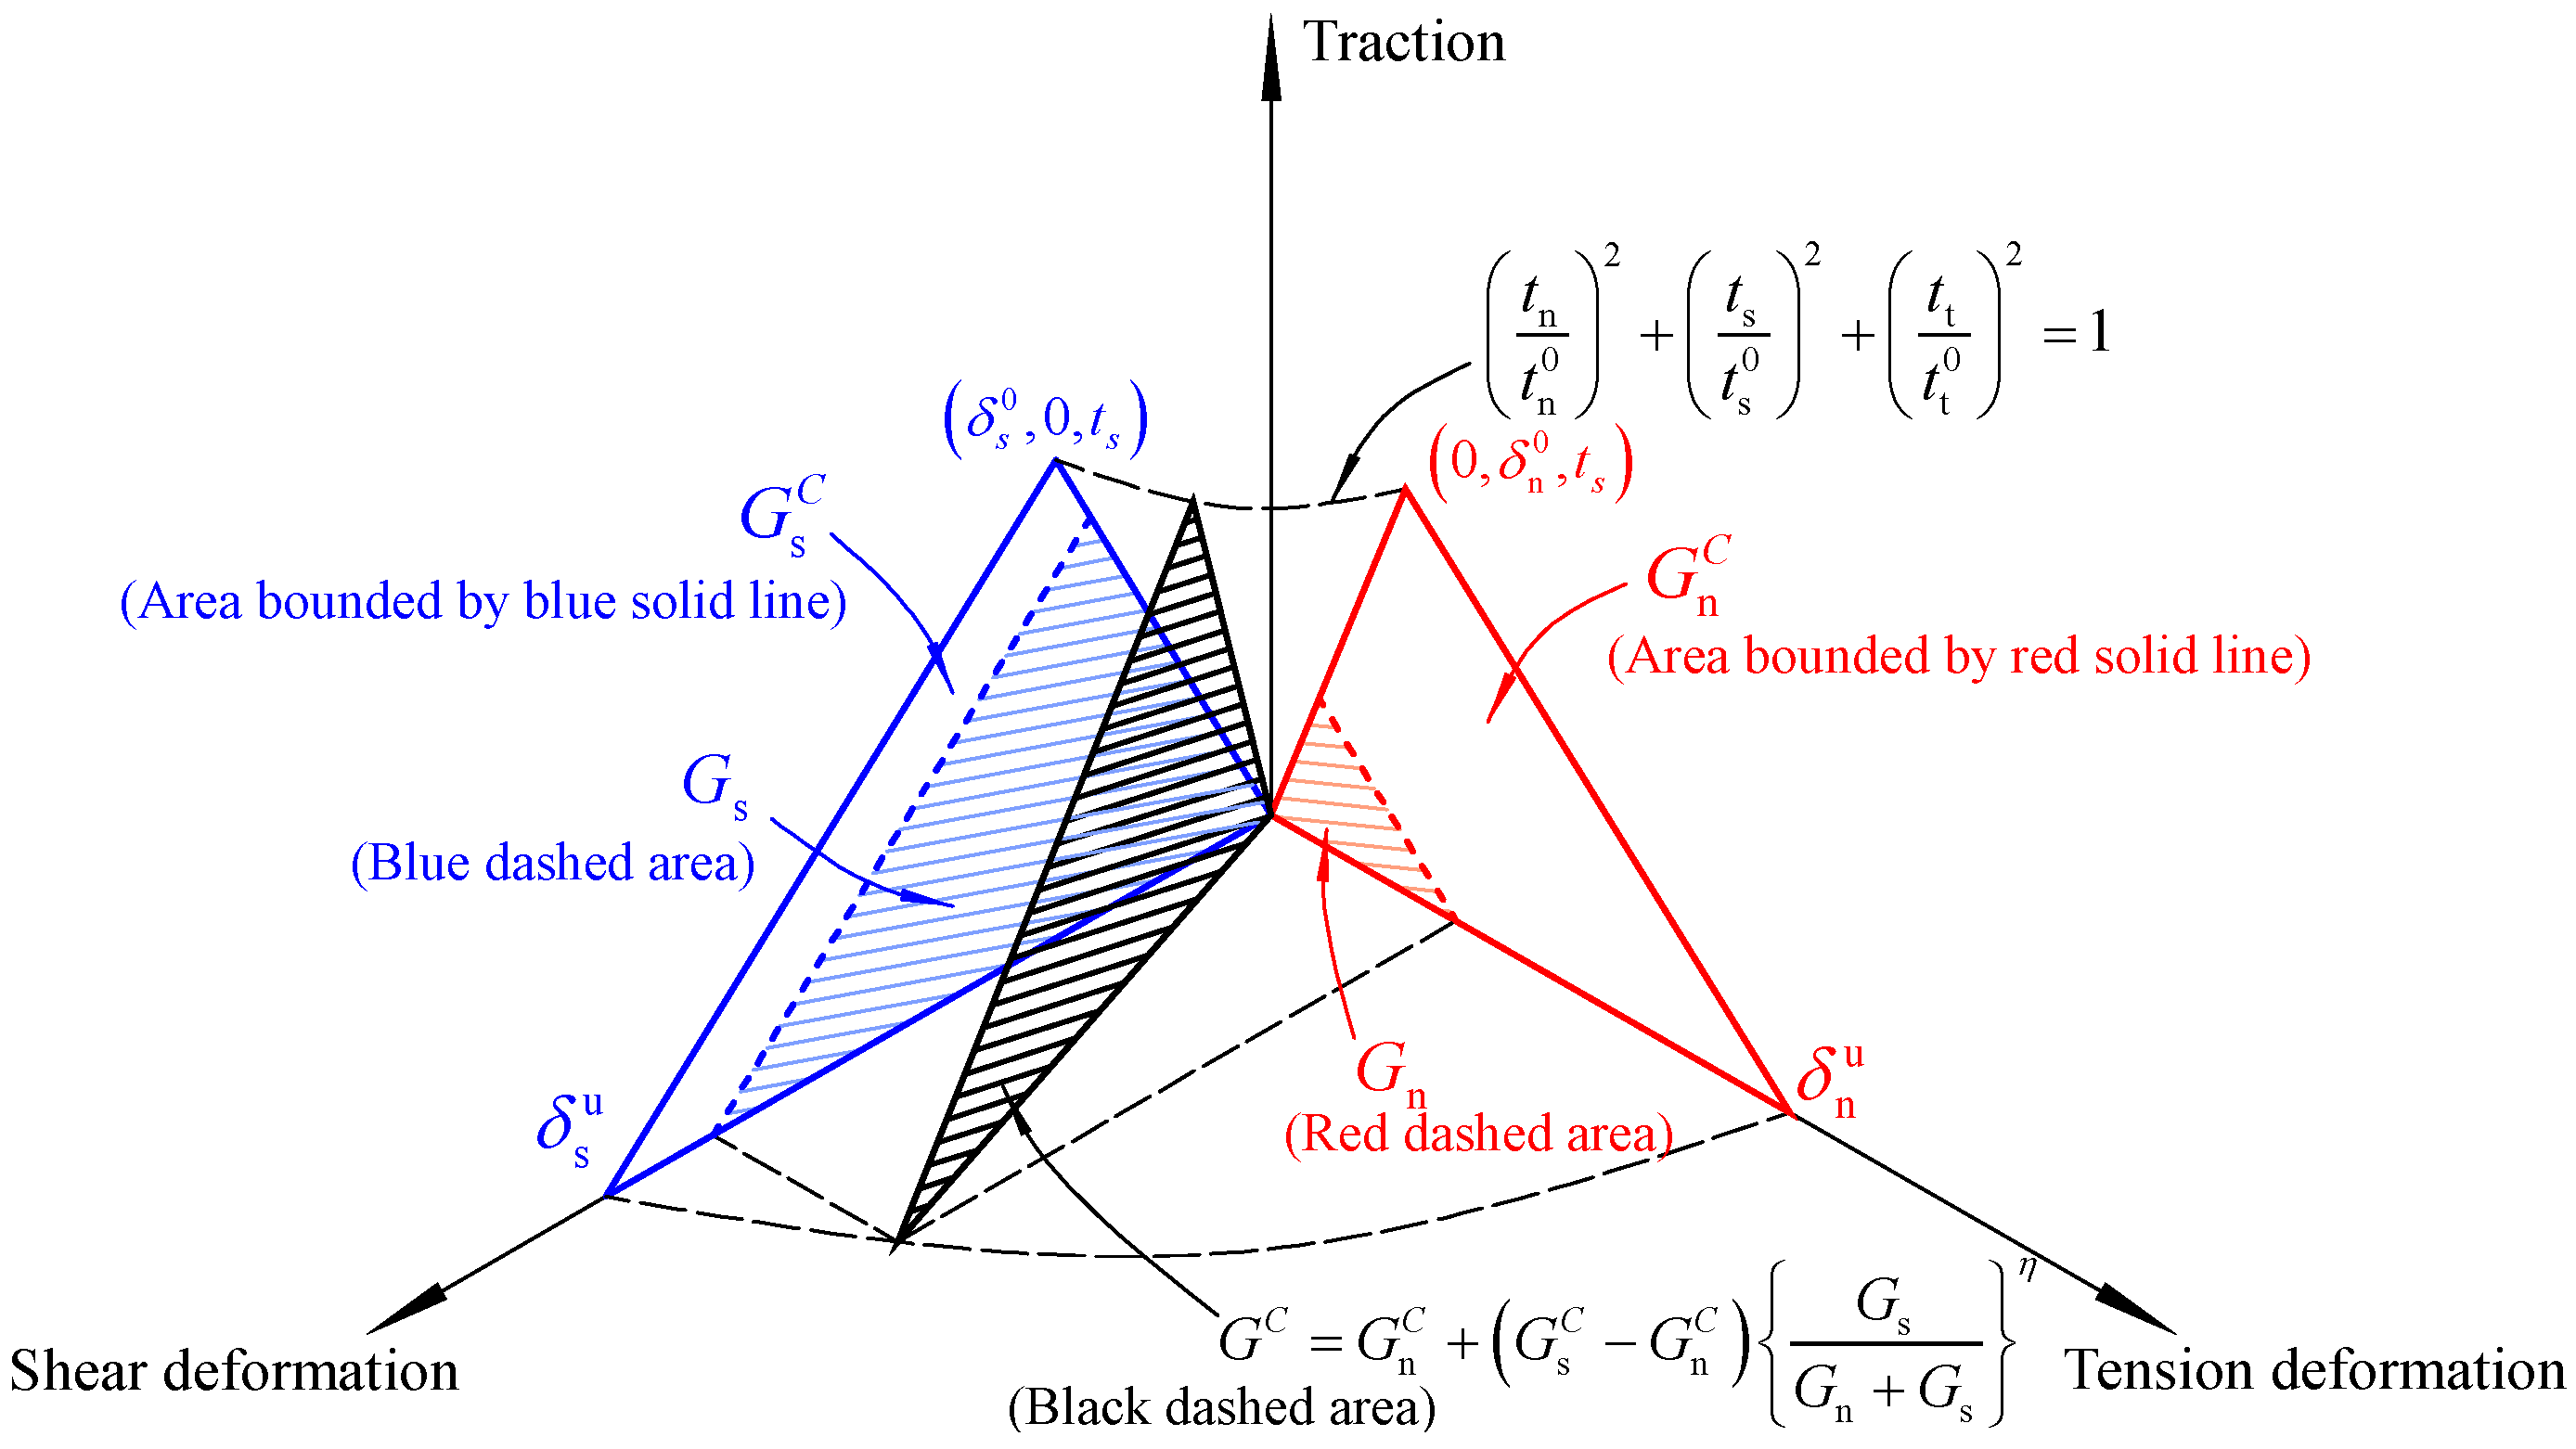
Since crack propagation paths are meandering curves at the meso-scale, mixed-mode (I + II) fractures are more general than pure mode I or II fractures in concrete failure. The Benzeggagh–Kenane (B–K) fracture criterion [40] is applied to define the mixed-mode fracture energy. It is given by:
where is mixed-mode fracture energy, and are mode I and II fracture energies, is the sum of shear strain energies in two directions, is strain energy in the normal direction, and is the material parameter. Since tearing mode fracture will not happen in the 2D models, is equal to in-plane shear energy. and of a cohesive element are computed based on the deformation history at integration points in computation, which also relates to the damage evolution of the element [31]. The quadratic nominal stress criterion and mixed-mode fracture criterion are shown in Figure 4.
2.4. Interaction
Since particles bump and grind during compression, it is necessary to define the interaction characteristics to simulate the collision and friction. It is assumed that when the particle surfaces are in contact, any contact pressure can be transmitted. The ‘hard’ contact is adopted to describe the normal behavior of the interaction. According to the Coulomb friction mechanism, the friction behavior influences ultimate compressive strength and concrete performance in the softening stage [41]. The Coulomb friction model is adopted to describe the tangential behavior of the interaction. As with geomaterial, the friction behavior of concrete can be depicted by the friction angle [42]. The angle can be measured by the direct shear test and uniaxial compression test [43]. With the increase of concrete strength, the angle grows slightly. The friction angle ranges from 50 to 60 degrees. In the modeling, the friction angle is transformed into the friction coefficient . The transformation formula is shown as follows:
3. Calibration of Numerical Simulation
Modeling concrete, which contains multiple materials and interfaces at the meso-scale, requires a large number of parameters. Few experiments can provide the corresponding parameters that can one-to-one match with those used in the numerical simulation presented in this paper. Moreover, the cohesive zone model has a mesh sensitivity problem, so calibration is necessary for obtaining a suitable set of parameters and mesh precision.
In the calibration, it is found that the specimens with the same grading cumulative distribution but different aggregate distributions present different compressive properties, especially during the softening stage. Therefore, it is inadequate to include a single specimen to study the entire concrete performances. In order to conduct universal studies, ten specimens with different aggregate distributions are modeled randomly according to Equation (2) and (3). The number and proportion of aggregates included in the specimens are summarized in Table 1.
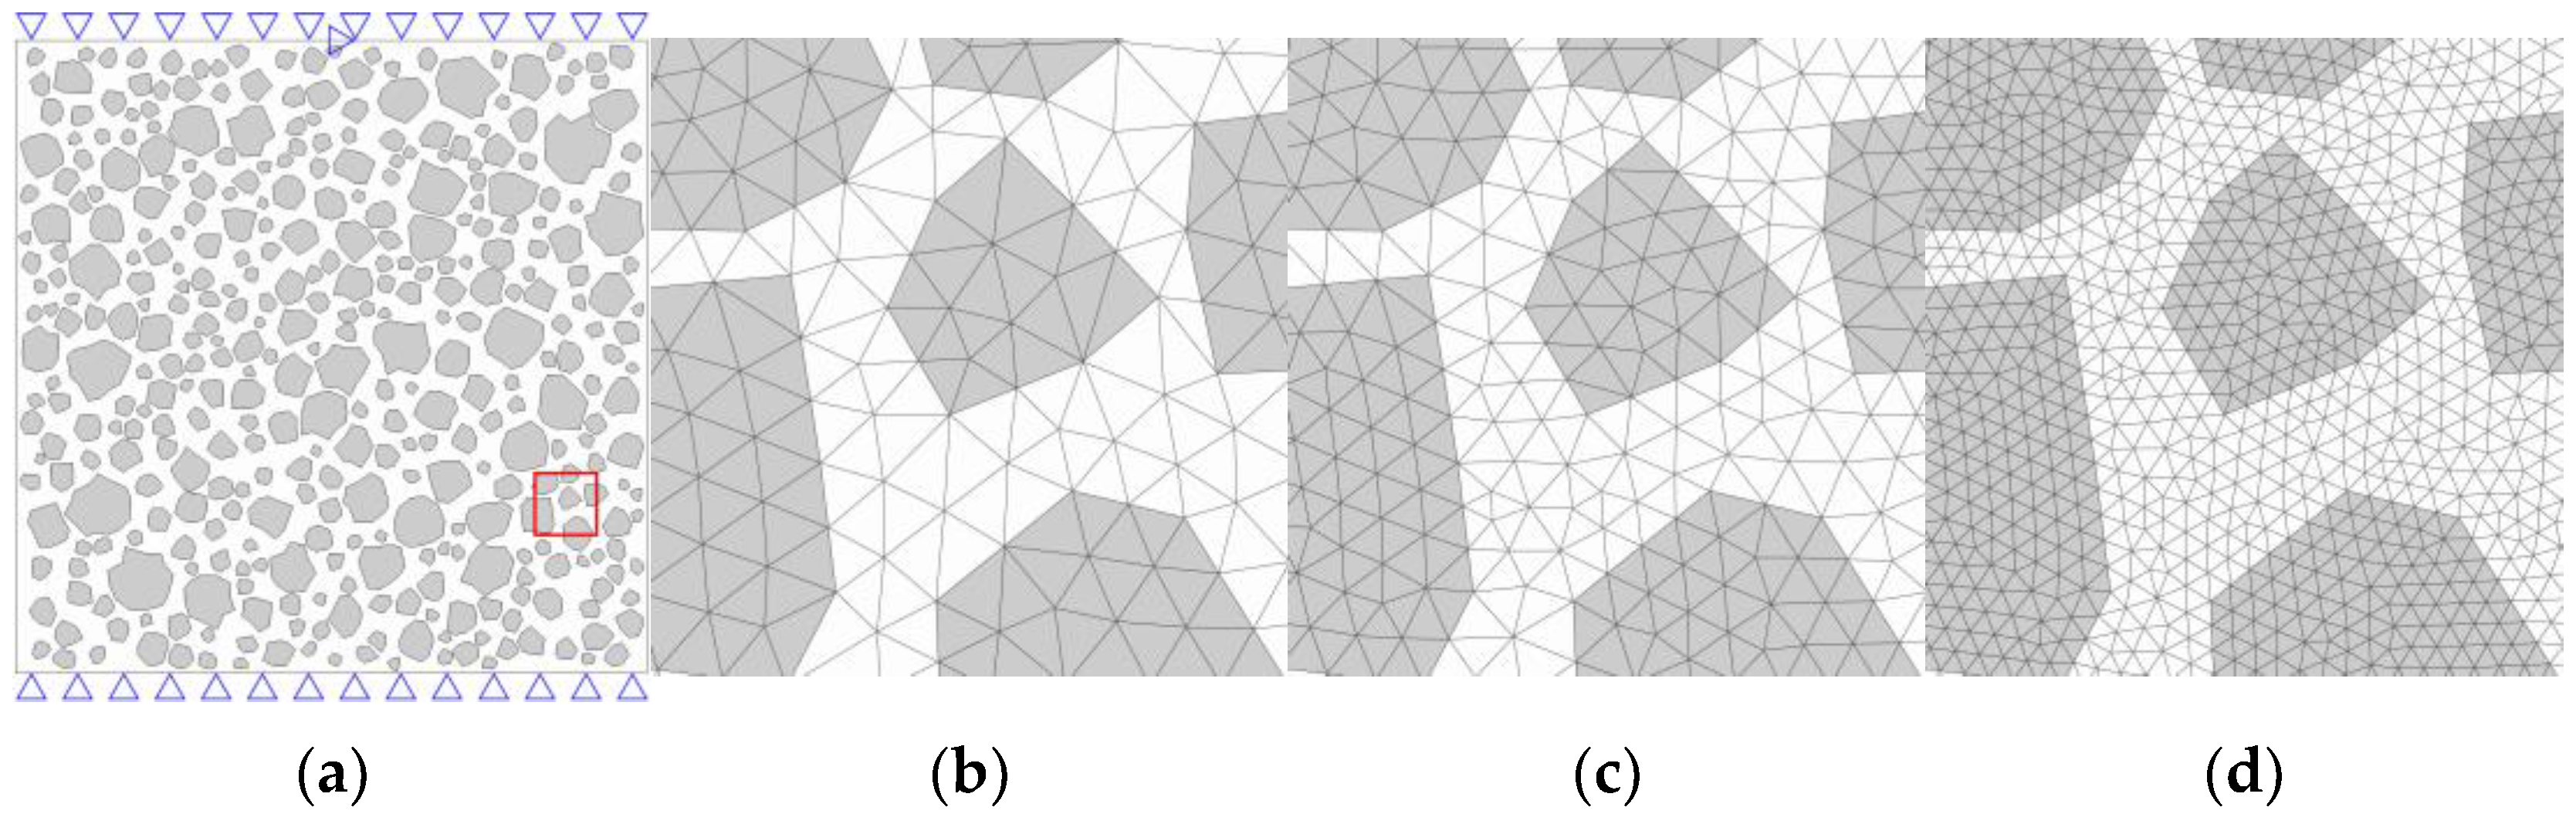
To check the mesh dependence and computing efficiency, three models with the same aggregate distribution and different mesh precisions are tested. The approximate element sizes of the models are 1.5 mm, 1.0 mm, 0.5 mm (Figure 5). The number of bulk elements and cohesive elements are listed in Table 2. The time consumption of the models with element size of 1.0 mm and 0.5 mm are 2.5 and 11.6 times that of the model with 1.5 mm element size, respectively.
Figure 6 shows the stress-strain curves of the specimens with different element sizes. Comparing the tension and compression simulation results, it is shown that the compressive performance is more sensitive to mesh precision. It is indicated that the damage and fracture of cohesive elements lead to stress redistribution. With the increase of plastic deformation ability in the local area, the stress distribution becomes more uniform, which can make the particles stay at a higher average stress level. Hence, the increase of cohesive element number can contribute to higher ultimate compressive strength and higher residual strength in the softening stage. The mesh size of 1.0 mm is chosen for further experiments due to its good simulation accuracy and acceptable time consumption.
Based on the outcomes of previous research and the simulation technique discussed in Section 2, the models are calibrated by considering interaction relations, material and interface parameters. Through the calibration, the frictional angle of 54.4° and the material parameters listed in Table 3 can make the models achieve satisfactory results, which are in close agreement with experimental results in both mechanical response and failure mode. In the following, the standard models used for analysis and parametric study are the models with ten different aggregate distributions and the calibrated parameters.
4. Tension Simulation Result
The complete tensile stress-strain curves of the specimens are shown in Figure 7. A mean curve is plotted to show the integral trend of the curves. Assume that is the stress of i-th specimen at the global strain . The points on the mean curve can be calculated as follows:
Through the calibration, the mean curve agrees well with the curve of the experimental result [32]. The curves of standard deviation and standard deviation coefficient that are calculated with simulation data are also plotted in Figure 7. The curves represent the absolute and relative errors of the simulation data, respectively. It is worth noting that the standard deviation almost remains constant in the softening stage. The stable deviation indicates that the specimens have a close damage evolution rate at the same global deformation level in spite of their different aggregate distributions.
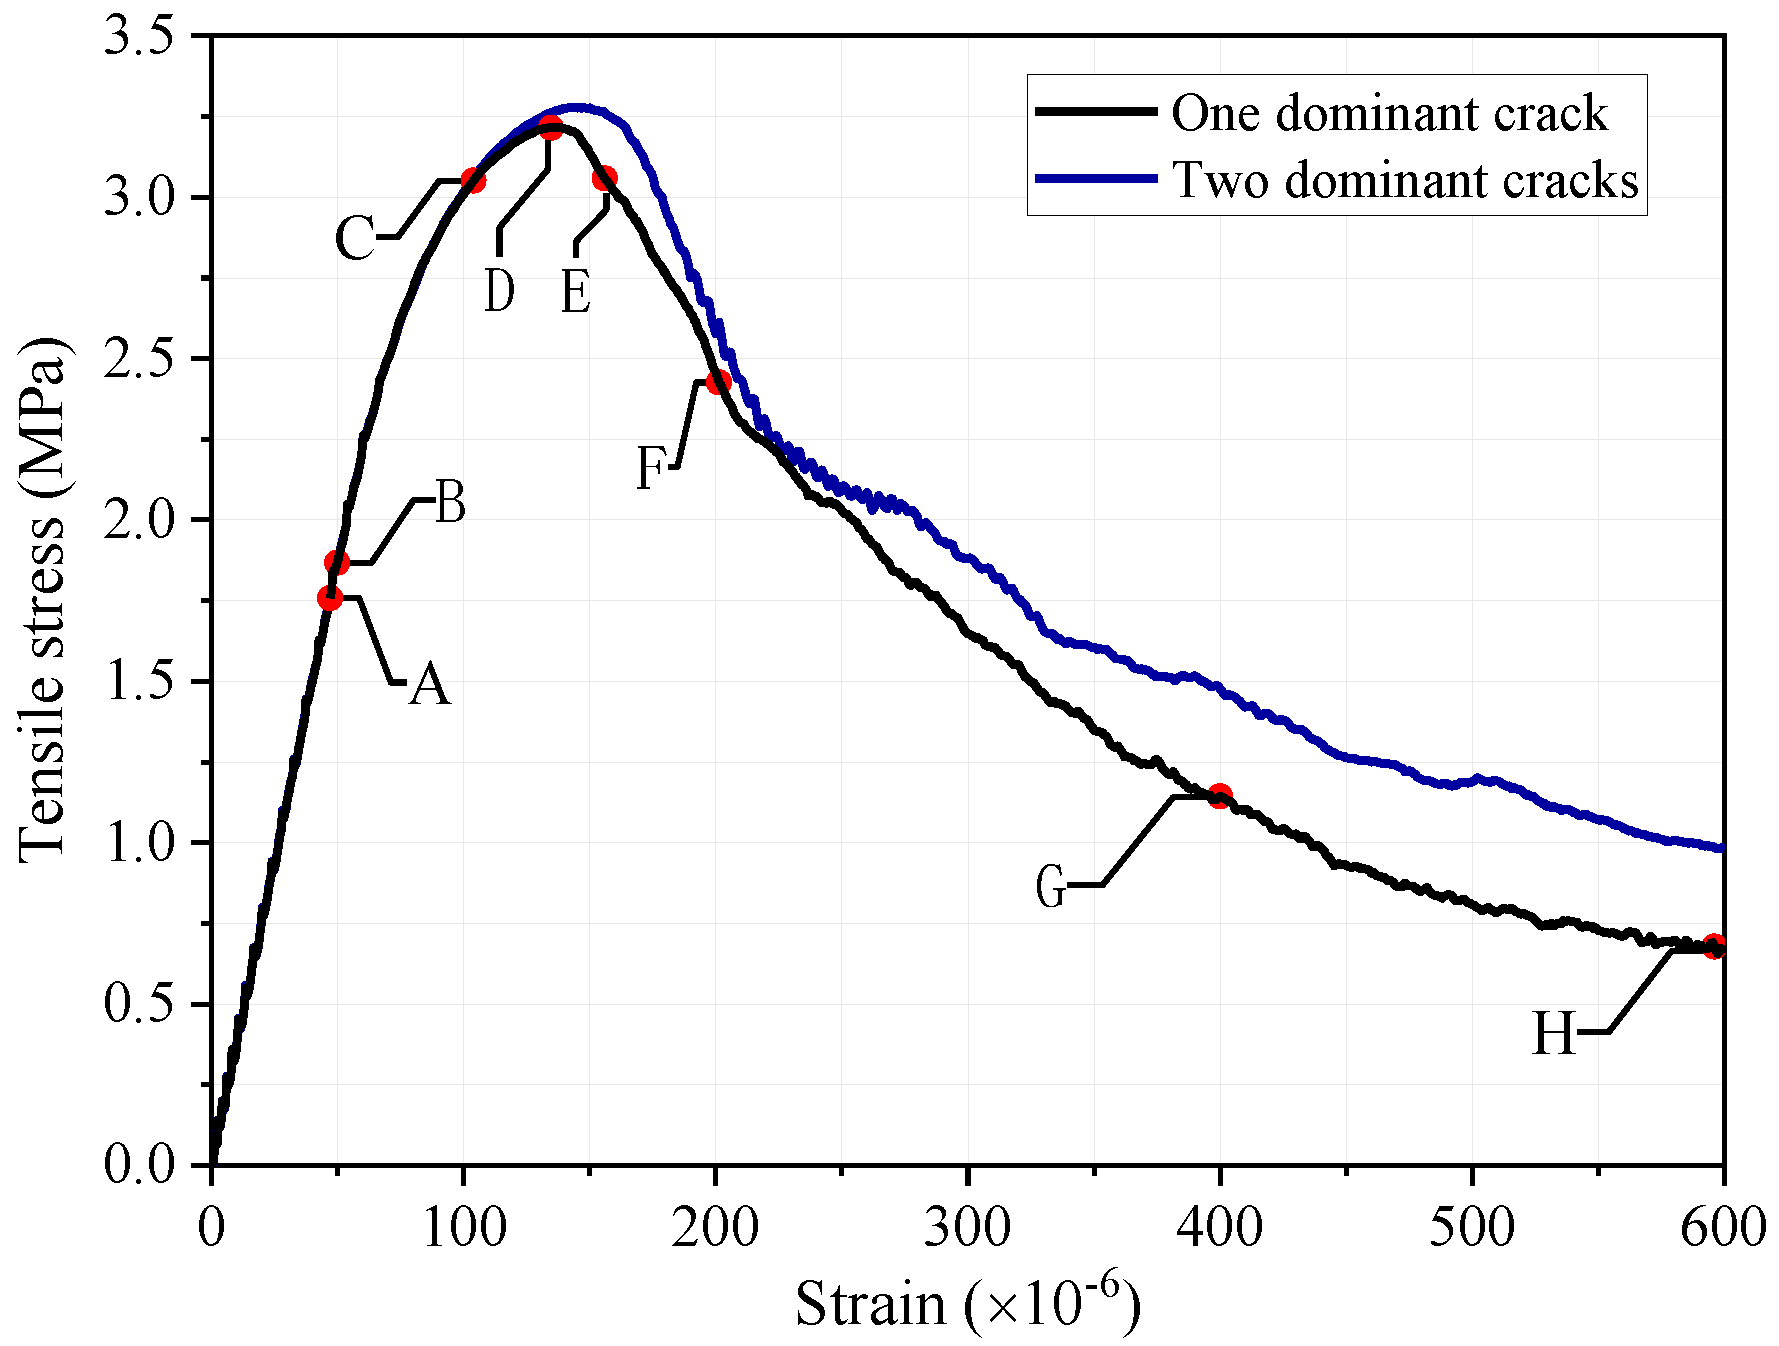
As shown in Figure 8, there are two typical tension failure modes: the specimen fracture with one or two dominant cracks perpendicular to the tension direction. In the failure mode with only one dominant crack, the crack extends through the whole cross-section as the experimental result. The majority of the tension failures are this mode. In the other failure mode, the two dominant cracks at different horizontal positions extend from both sides. With the crack propagation, the horizontal projections of the two cracks intersect each other. Afterward, one of the crack’s propagation rates declines, and the other crack extends through the whole cross-section. Figure 9 shows the strain-stress curves of the specimens with one or two dominant cracks. The strength and energy dissipation of the specimen with two dominant cracks is higher than that of the specimen with one dominant crack
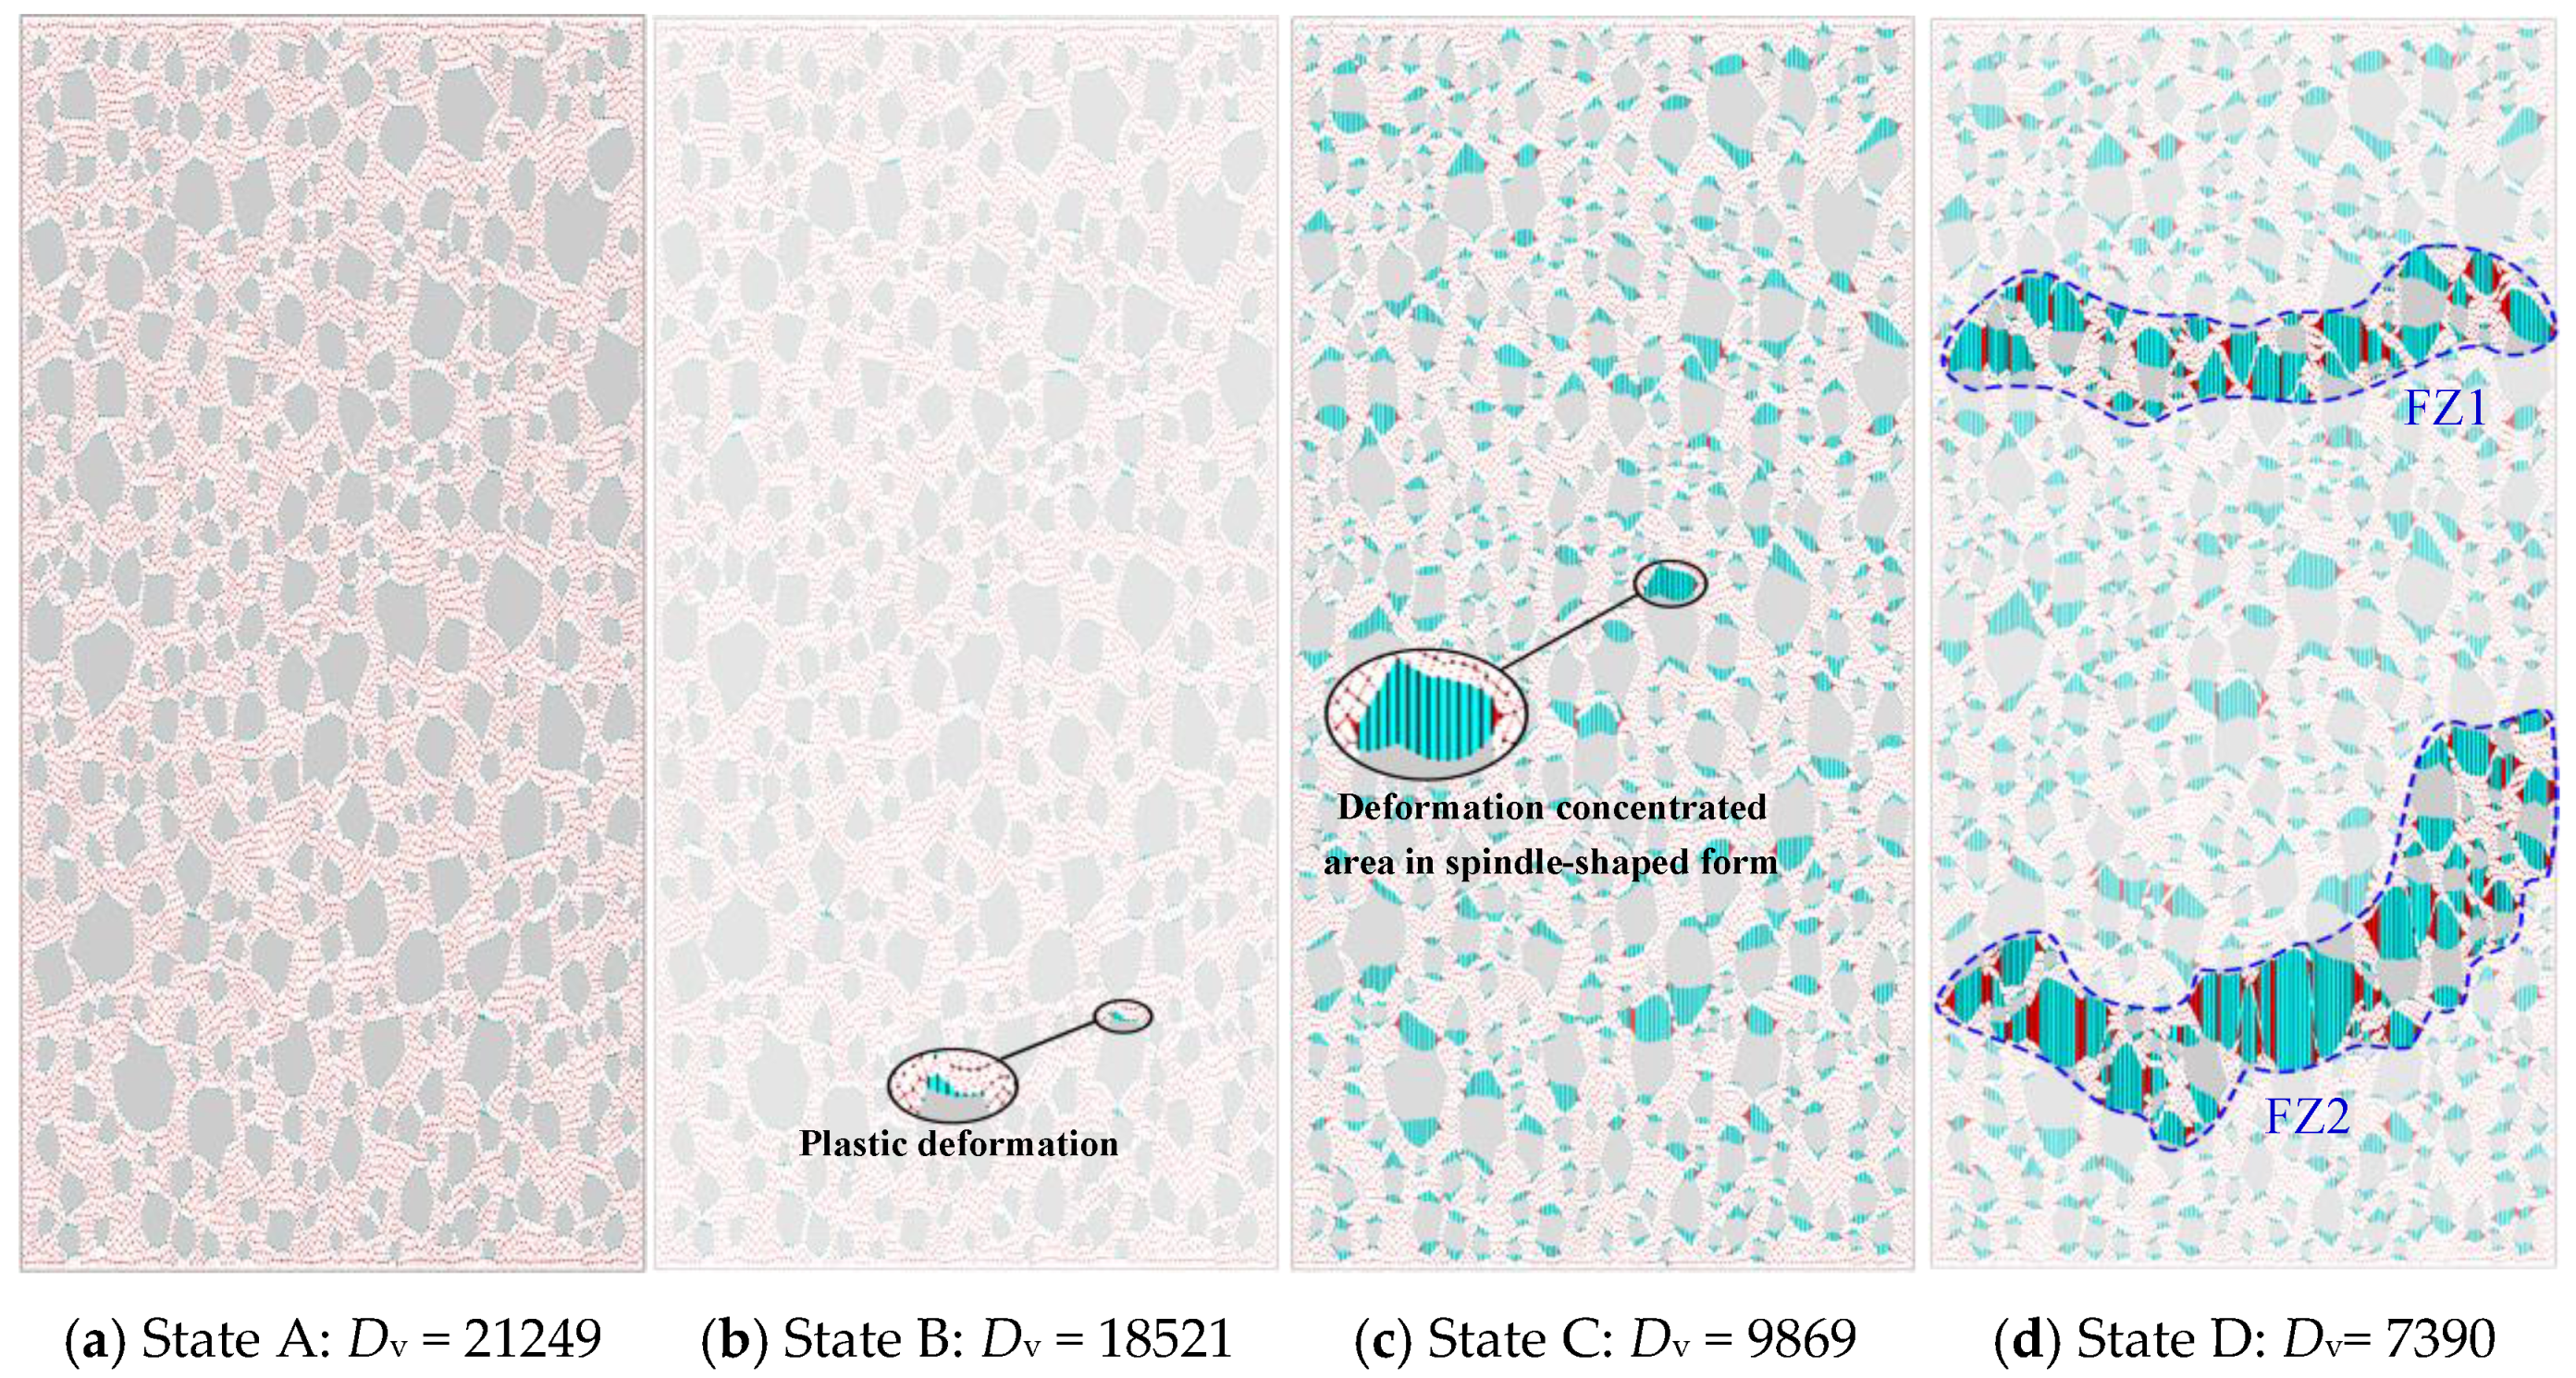
The specimen with one dominant crack in Figure 8 is selected for the deformation process analysis. In order to observe the whole deformation process, the deformation of the specimen is enlarged geometrically, as shown in Figure 10. The specimen’s original deformation in the direction of tension is multiplied by a deformation scale factor to make the aspect ratio become 2:1 from 1:1. Eight characteristic states are selected to describe the deformation process. The corresponding points of the states are plotted on the stress-strain curve in Figure 9.
After the specimen is loaded, before state A, the deformation evenly distributes at the aggregates and mortar, as shown in Figure 10a. The obvious plastic deformation appears since state B. Although the global stress hasn’t reached the damage initial stress of the ITZ elements, a few ITZ elements begin sustaining damage due to the stress concentration caused by the deformation difference between mortar and aggregates.
It is obvious from Figure 10c that the deformation concentrates at ITZ elements and nearby MII elements at state C. Many deformation concentrated areas are formed as spindle-shaped, which are comprised by ITZ elements at mid-piece and MII elements at both ends. When the specimen attained the ultimate tensile strength state, two potential fracture zones (FZ1 and FZ2) are formed by the deformation concentrated areas, as shown in Figure 10d.
At state E, one of the potential fracture zones (FZ1) degrades, and another one (FZ2) extends unstably. At state F, the first fracture initiates at the center-left. The deformation of MII elements is very close to that of the nearby ITZ elements. The original spindle-shaped characteristic of the deformation areas has almost disappeared.
Although the cracks develop and extend quickly afterward, the drop rate of bearing capacity slows down, and the curve gradually flattens. At state G, a large number of ITZ elements are eliminated. As can be noticed, a new deformation concentrated area (FZ4) has been generated at the bottom right corner of the potential fracture zone during the stage between state F and G, while the potential fracture zone (FZ3), which was generated since state D, begins contracting. At state H, fracture happens in this new deformation concentrated area (FZ4). This illustrates that although the tension crack generally propagates through the main deformation concentrated areas, the crack would bypass parts of areas and propagate through a new fracture path due to the force redistribution.
5. Compression Simulation Result
The aggregate distribution has a substantial influence on the concrete compressive property, especially in the softening stage. Compared with the tension simulation result, the result of compression simulation shows greater discreteness. The tensile behavior is determined by the weakest section, while compressive behavior is determined by the entire specimen [41].
The crack initiation is caused by the localized shear failure, as shown in Figure 11. There are two to four main shear bands crossing the whole section in the middle region accompanied by several small bands on both sides. The angles between the shear bands and the direction of compression range from 5 to 15 degrees. The specimens are divided into several wedge-shaped blocks by the shear bands as the experimental result [32].
The complete compressive stress-strain curves are shown in Figure 12. As with the statistical characteristics of tension stress-curves, the datum maintains a low dispersion before the mean compressive stress reaches its peak. Remarkably, both the curves of standard deviation and standard deviation coefficient have a ‘valley’ at the specimens’ softening stage. In the descending branch, the stress-strain curves of the specimens are pinched together at a certain state. The ‘valley’ symbolizes that there is a relatively steady state in the softening stage, at which the specimens have a close residual bearing capacity.
Figure 13 shows the complete compressive stress-strain curve of the model with the same aggregate distribution as the one analyzed in Section 4. Seven states labeled from ‘A’ to ‘G’ on the curve are selected to describe the crack propagation process as shown in Figure 14. The cracks newly appearing in each state are differentiated by colors.
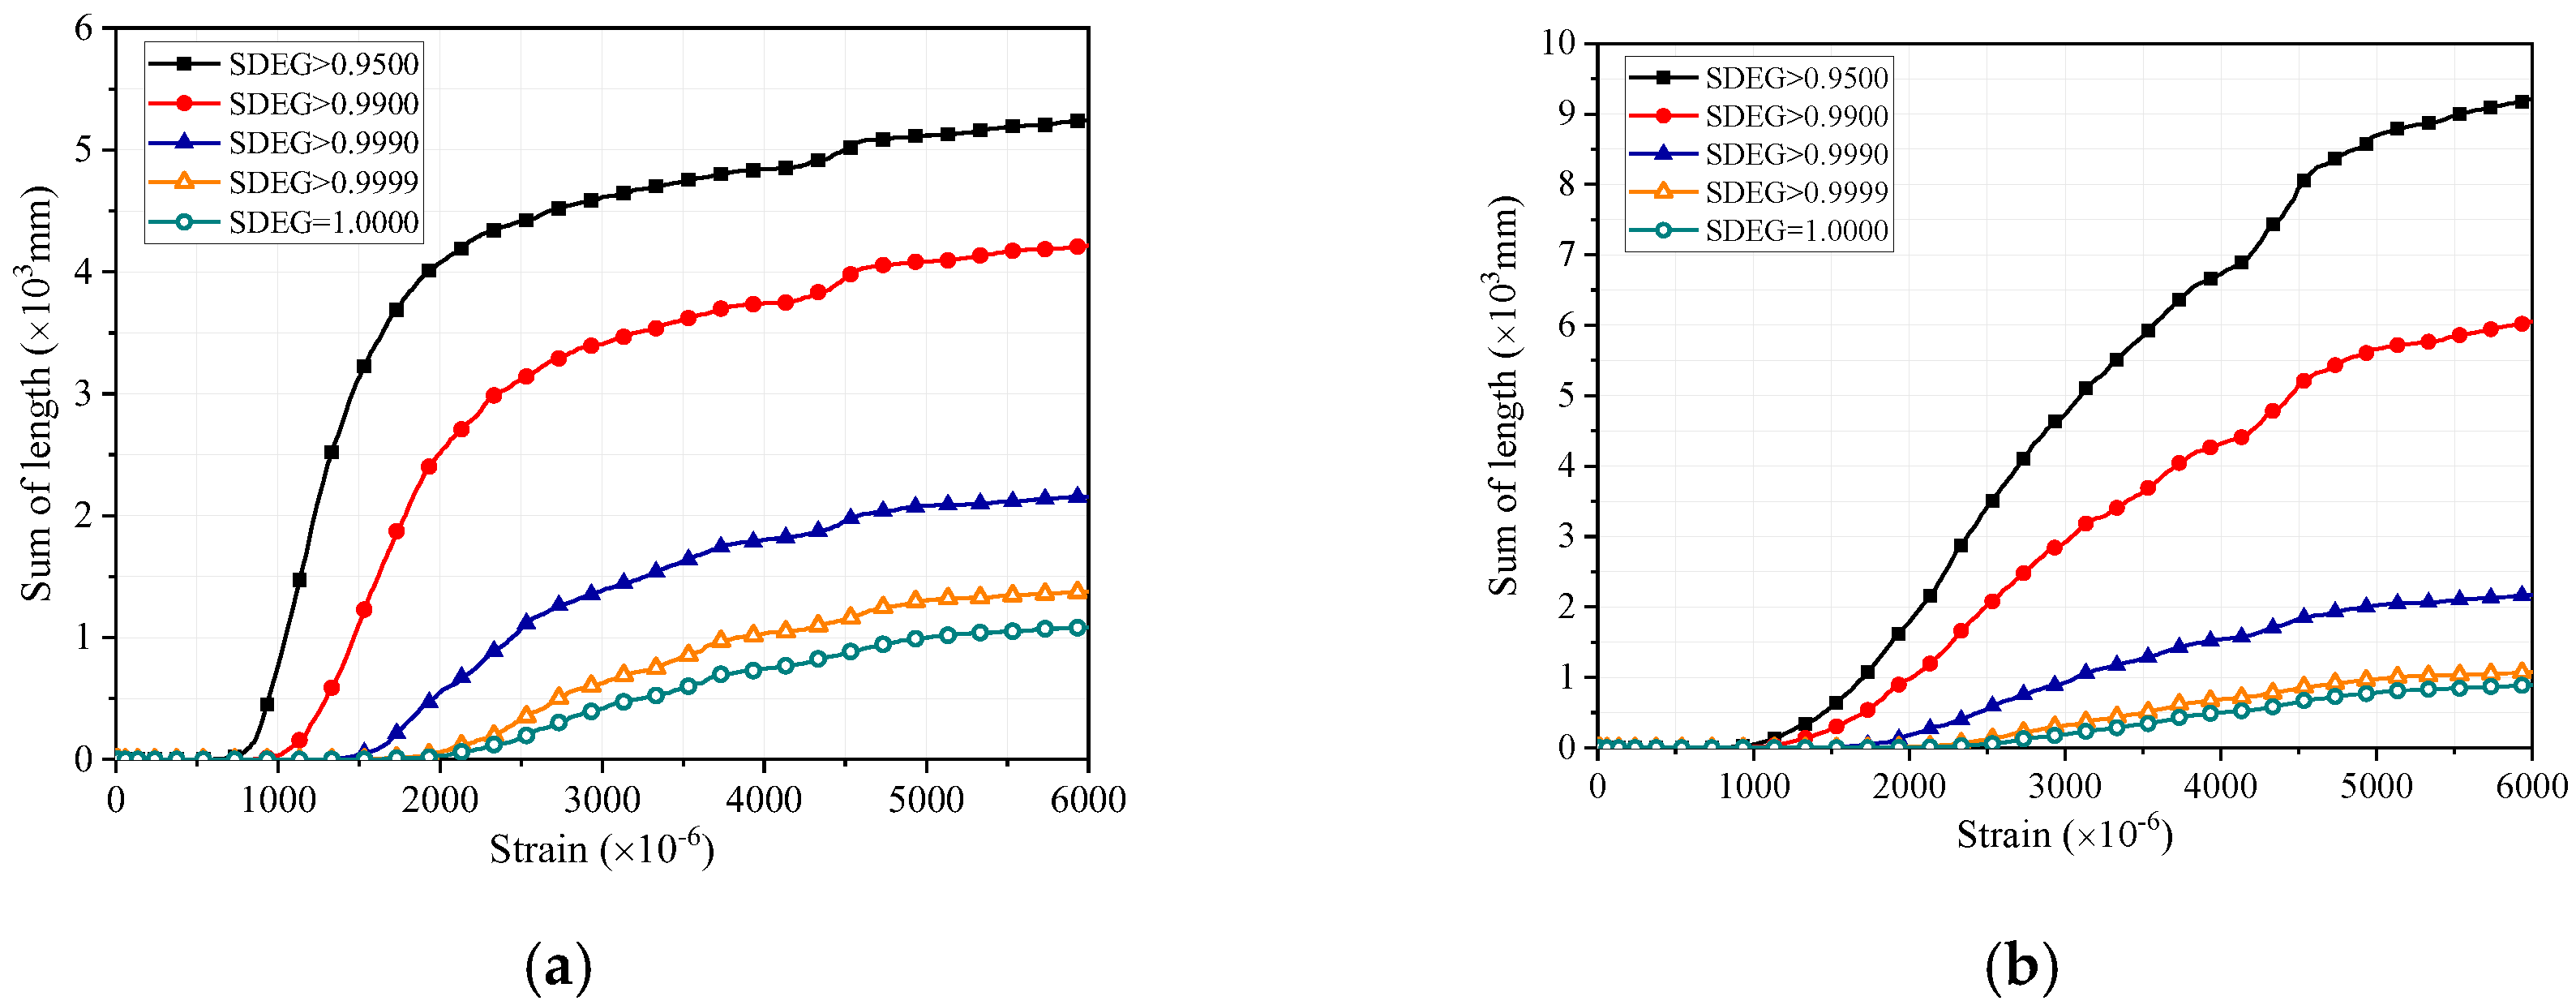
The sums of the lengths of ITZ and MII elements with different damage degrees are accumulated, as shown in Figure 15. SDEG (overall value of the scalar damage variable) values of the elements are extracted from the result file to determine the damage degree. When an element’s SDEG value equals 1, the element would be eliminated to simulate visible fracture. The lengths of the elements are calculated by the coordinates of the elements’ nodes. Since the nonlinear behavior of the specimen is simulated by the damage of ITZ and MII elements, the total length of the elements represents a specimen’s damage condition.
The specimen is linear-elastic until the first damage occurs. Damage firstly occurs at ITZ elements, and then MII elements. The damage evolution rate of the specimen gradually accelerates and achieves a constant speed with the deformation increased. Although the ultimate bearing capacity hasn’t been reached, the crack initiates at state A. The crack nucleates at the ITZ elements parallel to the loading direction and propagates slowly before the state B.
Afterwards, several small cracks appear from the bottom middle-right to the top-right corner during the stage between state B and C. The bearing capacity gradually declines at this stage. A rudiment of a shear band seems to be formed by these small cracks.
The residual bearing capacity descends rapidly during the stage between states C and E, accompanied by the appearance of main shear bands. The MII elements’ fracture leads to the branching and coalescence of the crack. In this stage, the damage evolution rate is fast but steady.
It is interesting that the valleys of the standard deviation curve and standard deviation coefficient curve occur when the specimen is at state E, which indicates that the relatively steady state is attributed to the formation of main shear bands. At this state, the residual capacity depends on the friction action of the blocks divided by the shear bands. In the following loading process, the crack propagation rate slows down. The specimen’s deformation gradually evolves into the slipping of the wedge-shaped blocks.
6. Parametric Study
6.1. The Effect of Mode II Fracture Energy
Since mode I fracture was considered as the dominant form in tension damage, single fracture energy was adopted to describe the interface fracture behavior in the previous concrete tension simulation. In this method, the fracture energies of the interface elements are fixed values regardless of fracture type. Moreover, since the compression failure of concrete is mostly due to shear fracture [41], modeling with one specific fracture energy is unable to simulate the fracture behavior of concrete both under tension and compression. Due to the multiphase and heterogeneous property of concrete, the mixed-mode fracture would occur inevitably in concrete failure, even under uniaxial tension conditions. Mixed-mode fracture energy is determined by mode I and mode II fracture energy, and the two pure-mode fracture energies both have influences on concrete tensile and compressive behavior. In this section, the effect of mode II fracture energy on the performance of concrete under tension and compression is studied.
As mentioned in Section 2, the experiment results show that there is a relationship between mode I and II fracture energy. In this section, mode I fracture energy is fixed. The ratio of mode II and mode I fracture energy () is taken as the variable to investigate the effect of mode II fracture energy. The ratio is calculated by the following equation:
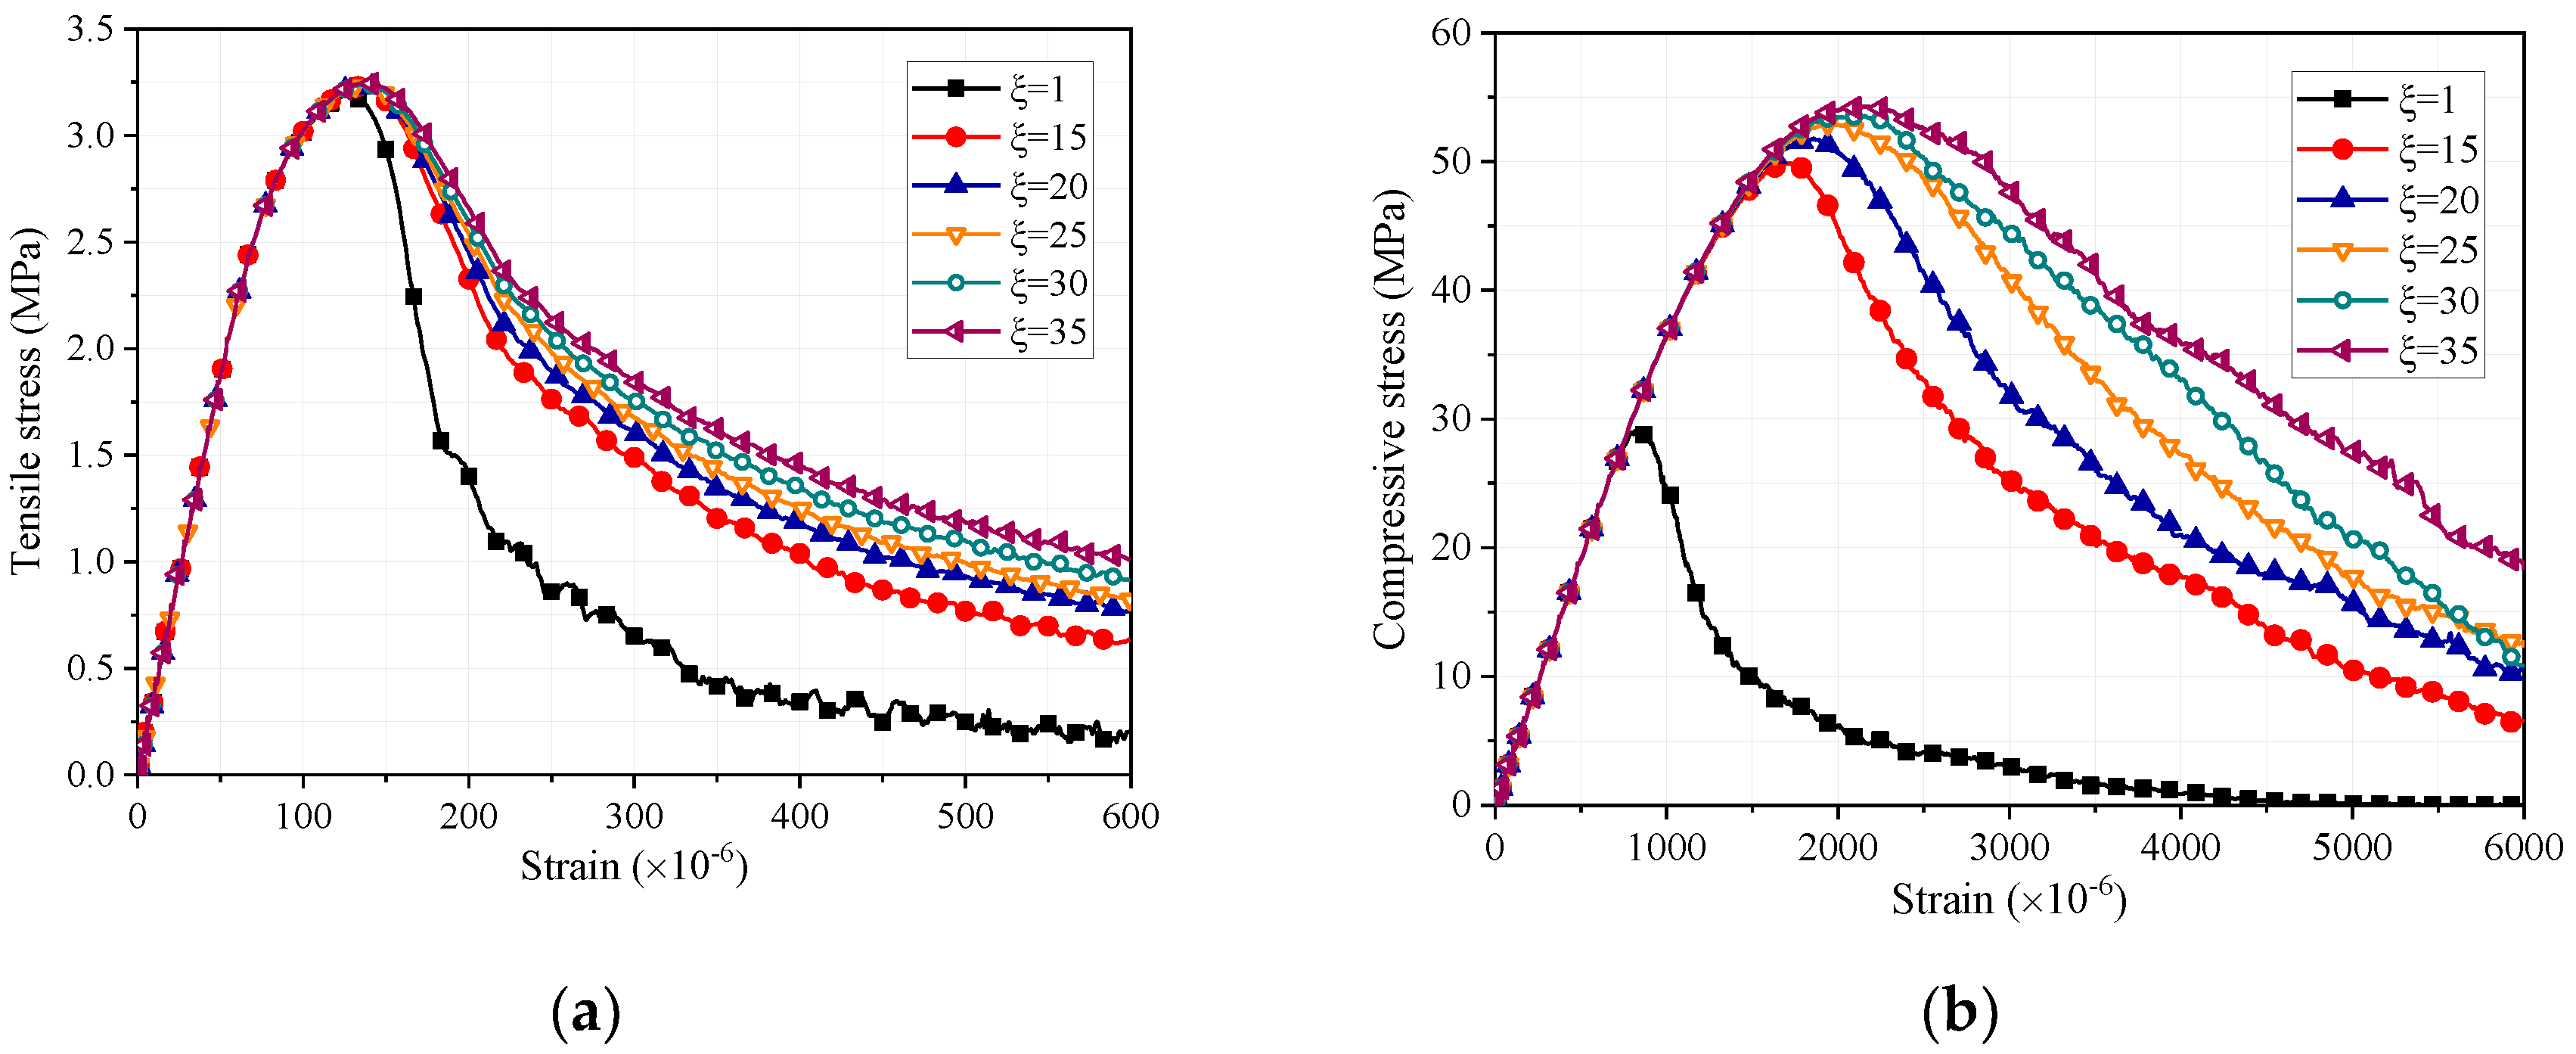
The tension simulation result of varying is shown in Figure 16a. The influence on the ultimate tensile strength is negligible. It is noteworthy that the mode II fracture energy influences the specimen’s tensile behavior in the softening stage. The mixed-mode fracture accounts for a large proportion. In the case that the mode II fracture energy equals the mode I fracture energy (), the total fracture energy is 48.2% lower than that of the standard model (). It can be inferred that the mixed-mode fracture energy caused by the difference of the two pure-mode fracture energy accounts for about half of the total fracture energy.
The compression simulation result of varying the multiple is shown in Figure 16b. The ultimate compressive strength is significantly influenced by the mode II fracture energy, which is different from tensile strength. When the mode II fracture energy equals the mode I fracture energy (), the compressive strength and total fracture energy is 44.7% and 82.2% lower than that of the standard model (), respectively. As described in Section 3 and Section 4, the crack initiates before and after the specimen reaches the ultimate bearing capacity state under compression and tension, respectively. Low mode II fracture energy will limit interface elements’ shear deformation under compression, while it has a relatively low influence on the interface elements’ tensile deformation under tension. It can be noticed that with the increase of mode II fracture energy, the growth of compressive strength decreases. The limit of compressive strength gradually translates from deformation ability to the shear strength of interface elements.
6.2. The Effect of Mixed-Mode Fracture Criterion
The concrete’s fracture is generally mixed-mode, especially under compression. The Benzeggagh–Kenane (B–K) fracture criterion with the material parameter is adopted to define the damage evolution of mixed-mode fracture. It is accepted that the B–K criterion can adequately specify the mixed-mode fracture energy for a wide range of composite material [44].
In this section, the material parameter is taken as the variable to investigate the effect of mixed-mode fracture criterion. The other parameters are held the same, as listed in Table 3. Since there are limited studies of the material parameter of concrete, the parameter value of brittle epoxy resin is taken as a reference, which ranges from 1.0 to 2.0. Through calibration, it seems that 1.2 is an appropriate value for the parameter under both compression and tension conditions.
Figure 17 shows the complete tensile and compressive stress-strain mean curves for varying the parameter . The results indicate that the material parameter mainly affects the concrete performance in the softening stage under both tension and compression. The ultimate tensile and compressive strengths are slightly affected. It seems that the curves separate at the peak and gradually tend to decrease in parallel with the increase of global strain. For the specimens with the same aggregate distribution, the crack propagation paths are similar under tension, as are the failure modes and the sum of crack length under compression, as shown in Figure 8. According to the B–K criterion expression (Equation (5)), if the ratio of strain energy at a tangent to that in the normal direction is constant, a decrease of material parameter leads to the increase of total fracture energy . Due to the similarity in failure modes, the bearing capacities of the specimens are mainly determined by the fracture energy.
6.3. The Effect of Frictional Behavior
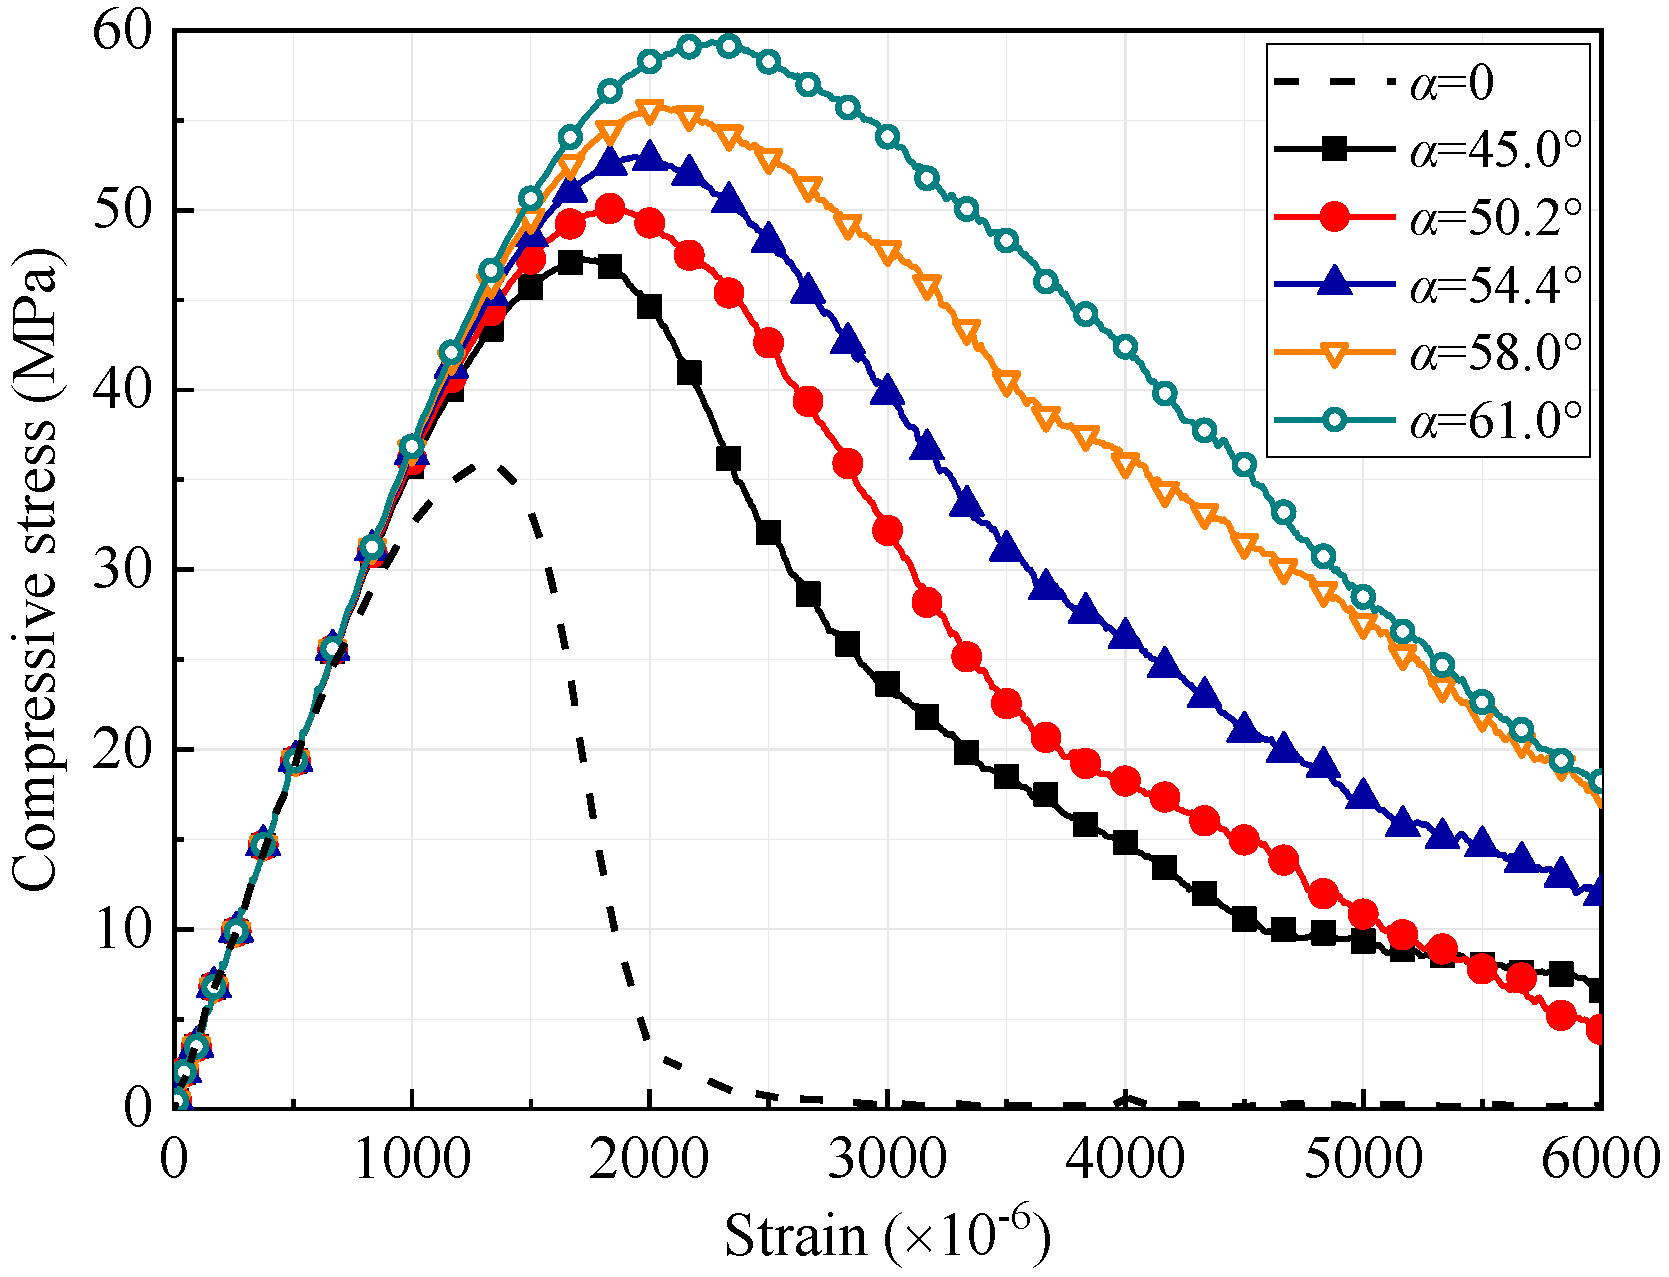
Coulombic friction is considered a key factor that influences the ultimate strength and residual bearing capacity of concrete. The results of the direct shear test and uniaxial compression test showed that the concrete with higher compressive strength has a greater internal friction angle. Although a desirable strength of concrete specimens can be achieved in experiments by adjusting the material types and aggregate gradation, it is hard to control the maximum allowable frictional stress. Therefore, the frictional angle α is taken as the variable to investigate the effect of frictional behavior.
As shown in Figure 18, the internal frictional behavior of concrete affects the final failure mode. With the increase of frictional angle, the inclination angles of main shear bands decrease. The local cracks tend to propagate dispersedly into concrete blocks rather than in the direction of the shear bands. The stress-strain curves of varying frictional angle α are shown in Figure 19. As expected, the increase of frictional angle value has a positive influence on the concrete bearing capacity in the whole loading process. The influence strengthens once the plastic deformation appears and weakens when the specimens’ bearing capacity declines by about a third. The sum of the crack length of the specimens is calculated as shown in Figure 20.
When the tangential interaction is frictionless (α = 0), the compressive strength and energy dissipations are 35.9% and 77.1% lower than that of the standard model (α = 54.4°), respectively. It is noticed that the crack propagates more sufficiently and the inclination angle of the shear bands decreases with the increase of frictional angle. Although the cracks’ local propagation paths are different, the main shear bands of the specimens are similar. The friction stress could constrain the crack propagation at the beginning of the damage, which benefits the ultimate bearing capacity. In the softening stage, the friction stress could help reestablish the loading path and make more blocks participate in bearing load, which may cause more cracks.
6.4. The Effect of Aggregates’ Mechanical Characteristics
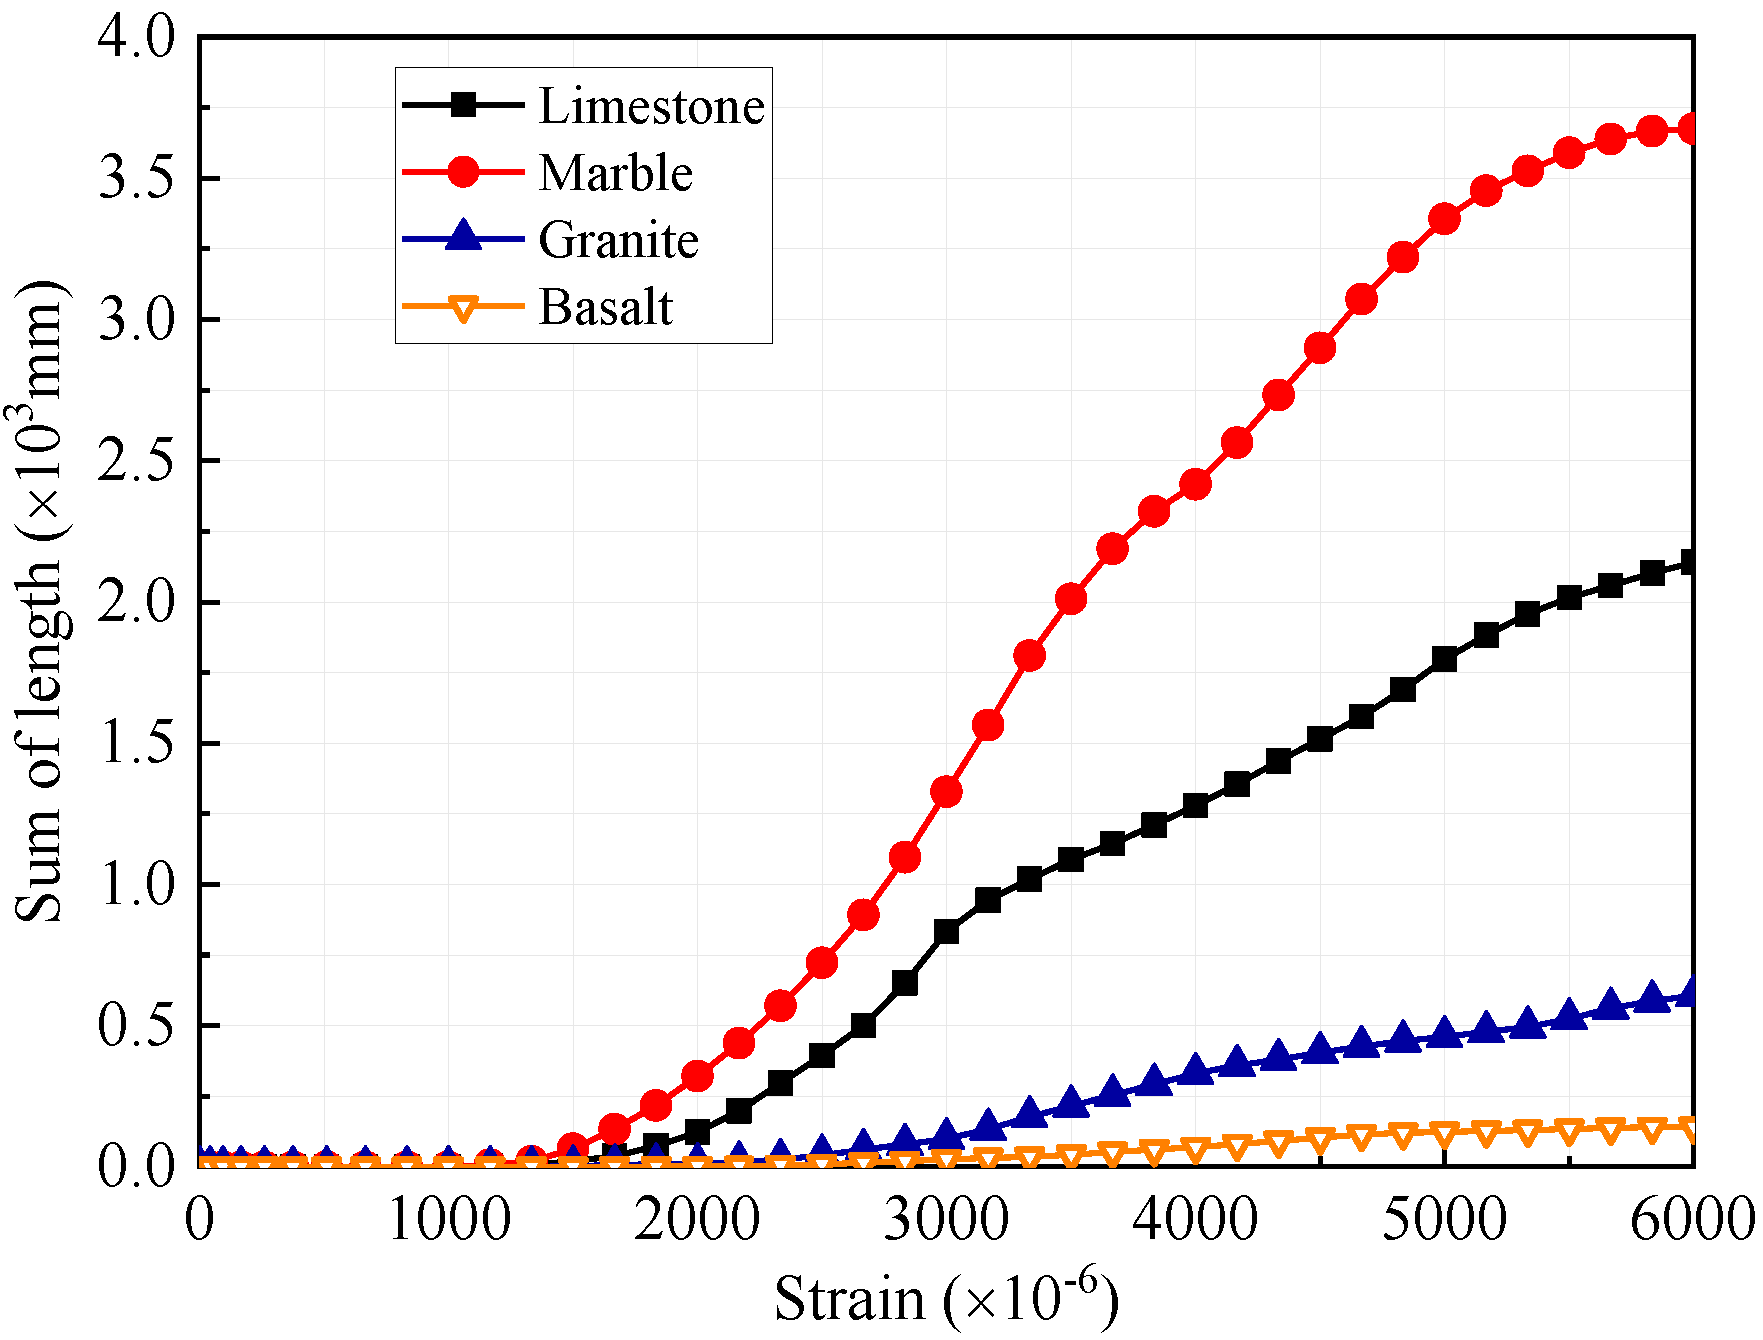
Although the tensile behavior of concrete is dominated by the properties of ITZs and mortar, damage and fracture may happen in aggregates during compression [45]. Different kinds of aggregates have differences in mechanical characteristics, geometrical shape, and corresponding ITZ properties [46]. To study the effect of aggregates’ mechanical characteristics on concrete compressive performance, based on standard models, cohesive elements are inserted into aggregates to simulate aggregate internal interfaces (AII). The material parameters of AII elements are set by referring to the material tests of the following common aggregate rocks: limestone [47], marble [48], granite [49], and basalt [50]. The material parameters of AII elements are listed in Table 4.
The stress-strain curves of varying aggregates’ mechanical characteristics are shown in Figure 21. Compared with the ultimate bearing capacity of the models without considering aggregate damage and fracture, the ultimate bearing capacities of the models with limestone, marble, granite, basalt aggregates fall by averages of 1.1%, 1.0%, 0.23%, 0.18%, respectively. The effect of aggregate type on the stress-strain relationship is mainly reflected in the softening stage. As shown in Figure 22, damage evolution of aggregates accelerates in the early softening stage. Since marble aggregates have the lowest tensile and shear strength, they are more likely to be damaged during the compression process. The energy dissipation of aggregates can lead to stress redistribution at the local area and enhance residual strength.
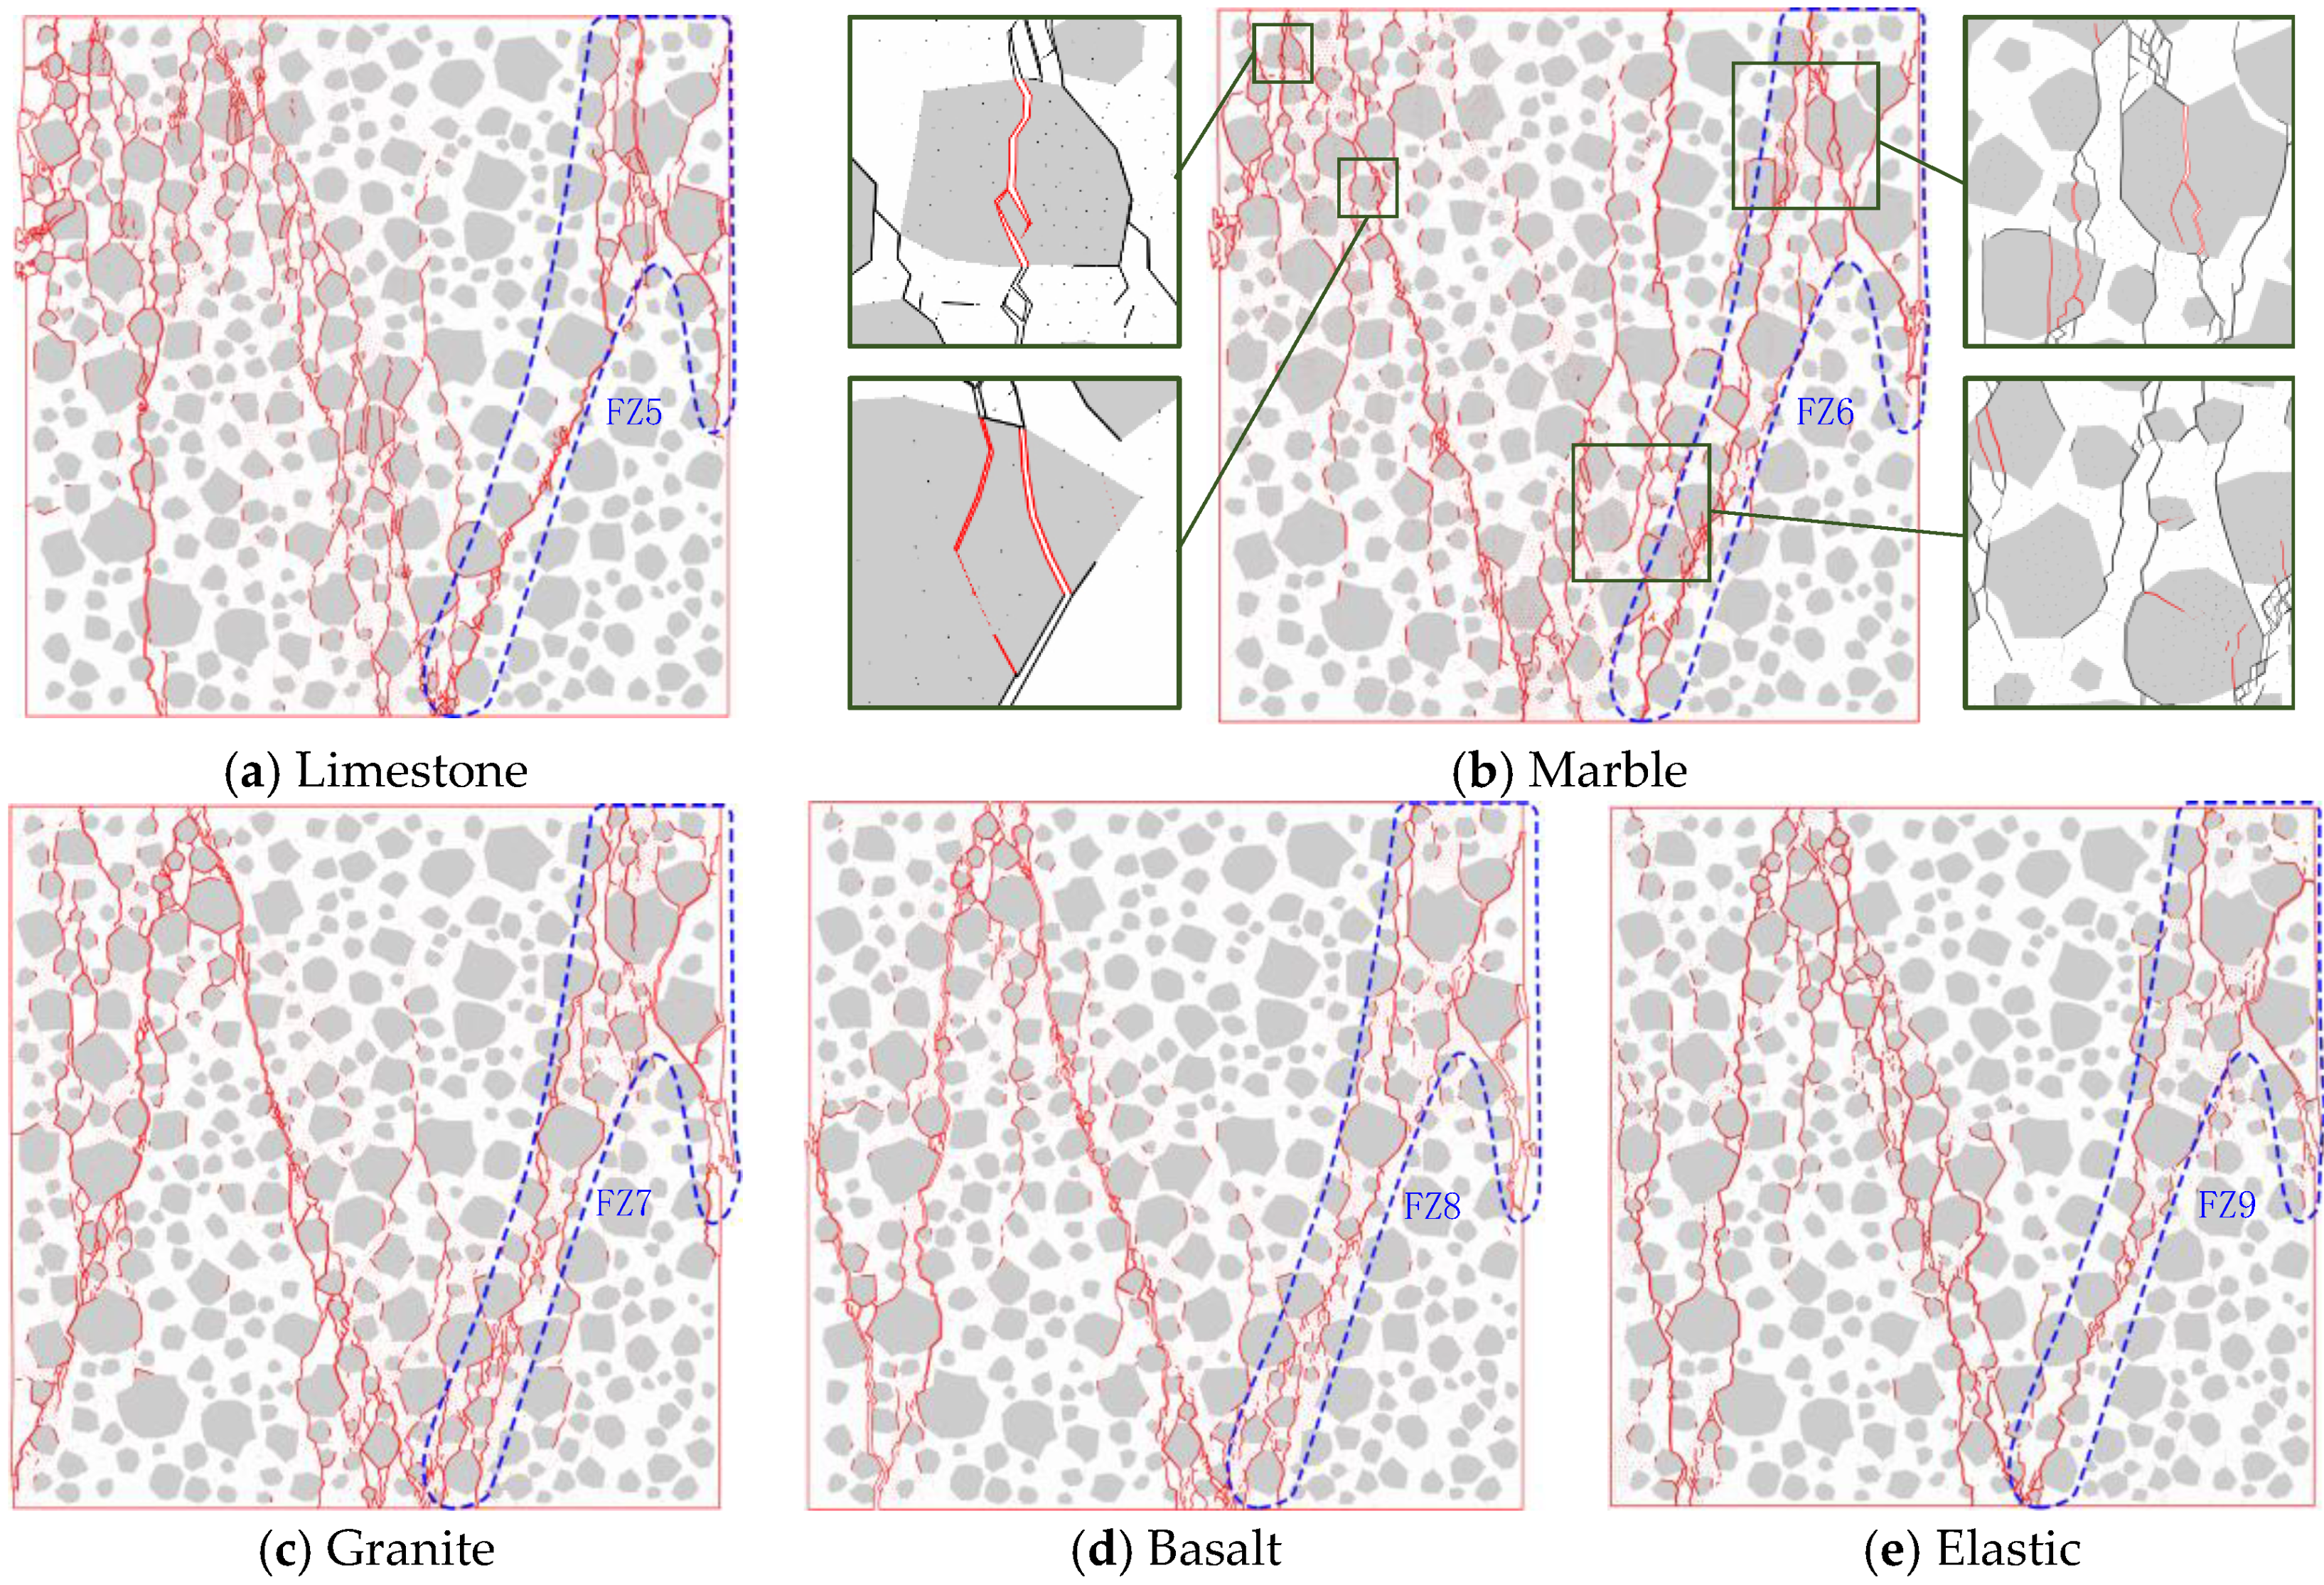
Figure 23 shows the failure modes of the models with the same aggregate distribution and different aggregates’ mechanical characteristics. It can be seen that the fracture of aggregates only constitutes a minority, but the crack propagation paths at the models’ left half are obviously influenced by local crack propagation differences caused by aggregates’ fracture. Since the shear bands at the models’ right half form earlier than those at left half, the models have very similar failure modes (FZ5–FZ9) at the right half. In view of these observations, it can be concluded that the influence of aggregates’ mechanical characteristics on concrete’s mechanical characteristics and failure modes is mainly concentrated in the mid-and-late softening stage.
7. Conclusions
The application range of the cohesive zone model for simulation of three-phase concrete (i.e., aggregate, mortar, and ITZs) has been extended. Through the definition of mixed-mode fracture and interaction behavior, the model is suitable for simulation both under tension and compression. The modeling method and relevant material parameters are discussed based on the simulation technique and previous material experiment results. A balance between mesh sensitivity and computing efficiency has been achieved through the calibration of mesh precision. The simulation results have good agreement with the experiments in both mechanical characteristics and failure modes. The whole process analyses and parametric studies are conducted to investigate the failure mechanism of concrete under tension and compression. The following conclusions can be drawn from this study.
The ITZ and MII elements modeled by cohesive elements are appropriate to simulate concrete meso-scale fracture behavior and damage accumulation at a smaller scale. The mesh precision level in which the approximate element size is 1/150 of the size of the model can provide a relatively high simulation accuracy and calculation efficiency.
The discreteness of compressive behavior caused by aggregate distribution on the stress-strain curve is larger than that of tension behavior. In the tension simulation, the specimens with different aggregate distributions have similar damage evolution rates at the same global deformation level. The failure modes of concrete can be separated into two types: one or two dominant cracks perpendicular to the tension direction.
In the concrete compression simulation, the inclination angles of shear bands range from 5 to 15 degrees. A valley in the standard deviation coefficient curve is formed, which symbolizes a relatively steady state in the softening stage when main shear bands form.
In the parametric study, it is found that the mixed-mode fracture accounts for a considerable proportion both in tension and compression failure. The fracture energy caused by the difference of the two pure-mode fracture energy occupies 48.2% and 82.2% of the total fracture energy under tension and compression, respectively. Mode II fracture energy has a significant impact on both ultimate and residual compressive strength of concrete. In the case that mode II fracture energy is equal to mode I fracture energy, the ultimate compressive strength reduces by 44.7%.
The mixed-mode fracture criterion mainly affects concrete performance in the softening stage under both tension and compression, while the effects on failure mode, tensile and compressive strength are negligible.
Frictional behavior mainly affects concrete compressive performance. In the case that there is no internal frictional behavior, the ultimate compressive strength and energy dissipation reduce by 35.9% and 77.1%, respectively. The frictional stress can constrain crack propagation at the beginning of damage and reestablish the loading path in the softening stage.
If the influence of aggregates’ geometrical shapes and ITZ properties are subtracted, aggregates’ mechanical characteristics affect concrete’s mechanical characteristics and failure modes, mainly concentrated in the mid-and-late softening stage.
Author Contributions
Conceptualization, X.X. and Q.X.; methodology, X.X. and Q.X.; software, Q.X.; validation, X.X.; formal analysis, Q.X.; investigation, X.X. and Q.X.; resources, X.X.; data curation, Q.X.; writing—original draft preparation, Q.X.; writing—review and editing, X.X. and Q.X.; visualization, X.X. and Q.X; supervision, X.X.; project administration, X.X.; funding acquisition, X.X.
Funding
This research was funded by the National Natural Science Foundation of China (Grant Nos. 51578400, 51178328), Project of Science and Technology Commission of Shanghai Municipality (Grant No. 16DZ1201602).
Conflicts of Interest
The authors declare no conflict of interest.
References
- Kaplan, M.F. Crack propagation and the fracture of concrete. J. Am. Concr. Inst. 1961, 58, 591–610. [Google Scholar]
- Wittmann, F.H. (Ed.) Structure of concrete with respect to crack formation. In Fracture Mechanics of Concrete; Elsevier: London, UK, 1983; pp. 43–74. [Google Scholar]
- Yu, X. (Ed.) Nonlinear fracture mechanics of concrete. In Fracture Mechanics Rock Concrete; Central South University of Technology Press: Changsha, China, 1991; pp. 335–381. [Google Scholar]
- Kaczmarczyk, J.; Kozłowska, A.; Grajcar, A.; Sławski, S. Modelling and microstructural aspects of ultra-thin sheet metal bundle cutting. Metals 2019, 9, 162. [Google Scholar] [CrossRef]
- Baskes, M.; Hoagland, R. Summary report: Computational issues in the mechanical behavior of metals and intermetallics. Mater. Sci. Eng. 1992, 159, 1–34. [Google Scholar] [CrossRef]
- Dawson, P.R.; Needleman, A.; Suresh, S. Issues in the finite-element modeling of polyphase plasticity. Mater. Sci. Eng. A-Structural Mater. Prop. Microstruct. Process. 1994, 175, 43–48. [Google Scholar] [CrossRef]
- Ngo, D.; Scordelis, C. Finite element analysis of reinforced concrete beams. ACI 1967, 64, 152–163. [Google Scholar]
- Rashid, Y.R. Ultimate strength analysis of prestressed concrete pressure vessels. Nucl. Eng. Des. 1968, 7, 334–344. [Google Scholar] [CrossRef]
- Herrmann, H.J.; Hansen, A.; Roux, S. Fracture of disordered, elastic lattices in two dimensions. Phys. Rev. B 1989, 39, 637–648. [Google Scholar] [CrossRef]
- Kikuchi, A.; Kawai, T.; Suzuki, N. The rigid bodies-spring models and their applications to three-dimensional crack problems. Comput. Struct. 1992, 44, 469–480. [Google Scholar] [CrossRef]
- Carol, I.; López, C.M.; Roa, O. Micromechanical analysis of quasi-brittle materials using fracture-based interface elements. Int. J. Numer. Methods Eng. 2001, 52, 193–215. [Google Scholar] [CrossRef]
- Hillerborg, A.; Modeer, M.; Petersson, P. Analysis of crack formation and crack growth in concrete by means of fracture mechanics and finite elements Hillerborg. Cem. Concr. Res. 1976, 6, 773–782. [Google Scholar] [CrossRef]
- Belytscho, T.; Black, T. Elastic crack growth with minimal remeshing. Int. J. Numer. Methods Eng. 1999, 45, 610–620. [Google Scholar]
- De Cicco, D.; Taheri, F. Delamination buckling and crack propagation simulations in fiber-metal laminates using xfem and cohesive elements. Appl. Sci. 2018, 8, 2440. [Google Scholar] [CrossRef]
- Bažant, B. Oh, crack band theory of concrete. Mater. Struct. 1983, 16, 155–177. [Google Scholar] [CrossRef]
- Duan, K.; Hu, X.; Wittmann, F.H. Boundary effect on concrete fracture and non-constant fracture energy distribution. Eng. Fract. Mech. 2003, 70, 2257–2268. [Google Scholar] [CrossRef]
- Cifuentes, H.; Alcalde, M.; Medina, F. Measuring the size-independent fracture energy of concrete. Strain 2013, 49, 54–59. [Google Scholar] [CrossRef]
- Vishalakshi, K.P.; Revathi, V.; Sivamurthy Reddy, S. Effect of type of coarse aggregate on the strength properties and fracture energy of normal and high strength concrete. Eng. Fract. Mech. 2018, 194, 52–60. [Google Scholar] [CrossRef]
- Merta, I.; Tschegg, E.K. Fracture energy of natural fibre reinforced concrete. Constr. Build. Mater. 2013, 40, 991–997. [Google Scholar] [CrossRef]
- Vydra, V.; Trtík, K.; Vodák, F. Size independent fracture energy of concrete. Constr. Build. Mater. 2012, 26, 357–361. [Google Scholar] [CrossRef]
- RILEM Technical Committee 50. Determination of fracture energy of mortar and concrete by means of three point bend tests on notched beams. Mater. Struct. 1985, 18, 285–290. [Google Scholar]
- Bažant, Z.P.; Pfeiffer, P.A. Shear fracture tests of concrete. Mater. Struct. 1986, 19, 111–121. [Google Scholar] [CrossRef]
- Kim, Y.R.; de Freitas, F.A.C.; Jung, J.S.; Sim, Y. Characterization of bitumen fracture using tensile tests incorporated with viscoelastic cohesive zone model. Constr. Build. Mater. 2015, 88, 1–9. [Google Scholar] [CrossRef]
- Kim, S.M.; Al-Rub, R.K.A. Meso-scale computational modeling of the plastic-damage response of cementitious composites. Cem. Concr. Res. 2011, 41, 339–358. [Google Scholar] [CrossRef]
- Trawiński, W.; Bobiński, J.; Tejchman, J. Two-dimensional simulations of concrete fracture at aggregate level with cohesive elements based on X-ray μCT images. Eng. Fract. Mech. 2016, 168, 204–226. [Google Scholar] [CrossRef]
- Liang, S.; Li, J.; Yu, F. A Multi-scale analysis-based stochastic damage model of concrete. J. Tongji Univ. 2017, 45, 1249–1257. [Google Scholar]
- Yılmaz, O.; Molinari, J.-F. A mesoscale fracture model for concrete. Cem. Concr. Res. 2017, 97, 84–94. [Google Scholar] [CrossRef]
- Trawiński, W.; Tejchman, J.; Bobiński, J. A three-dimensional meso-scale modelling of concrete fracture, based on cohesive elements and X-ray μCT images. Eng. Fract. Mech. 2018, 189, 27–50. [Google Scholar] [CrossRef]
- Unger, J.F.; Eckardt, S.; Koenke, C. A mesoscale model for concrete to simulate mechanical failure. Comput. Concr. 2011, 8, 401–423. [Google Scholar] [CrossRef]
- Gao, X.; Liu, C.; Tan, Y.; Yang, N.; Qiao, Y.; Hu, Y.; Li, Q.; Koval, G.; Chazallon, C. Determination of fracture properties of concrete using size and boundary effect models. Appl. Sci. 2019, 9, 1337. [Google Scholar] [CrossRef]
- Dassault Systèmes, D.S. Abaqus Analysis User’s Guide; Technical Report Abaqus 6.14 Documentation. Simulia Corp., 2016. Available online: http://abaqus.software.polimi.it/v6.14/index.html (accessed on 25 July 2019).
- Ren, X.; Yang, W.; Zhou, Y.; Li, J. Behavior of high-performance concrete under uniaxial and biaxial loading. ACI Mater. J. 2008, 105, 548–558. [Google Scholar]
- Wang, B.; Hong, W.; Zhang, Z.Q.; Zhou, M.J. Mesoscopic modeling method of concrete aggregates with arbitrary shapes based on mesh generation. Chin. J. Comput. Mech. 2017, 34, 591–596. [Google Scholar]
- Walraven, J.; Reinhardt, H. Theory and experiments on the mechanical behaviour of cracks in plan and reinforced concrete subjected to shear loading. Heron J. 1981, 26, 5–68. [Google Scholar]
- Bažant, Z.P.; Jirasek, M. Nonlocal integral formulations of plasticity and damage: Survey of progress. J. Eng. Mech. 2016, 128, 1119–1149. [Google Scholar] [CrossRef]
- Yang, Z.; Xu, X.F. A heterogeneous cohesive model for quasi-brittle materials considering spatially varying random fracture properties. Comput. Methods Appl. Mech. Eng. 2008, 197, 4027–4039. [Google Scholar] [CrossRef]
- Alfano, G. On the influence of the shape of the interface law on the application of cohesive-zone models. Compos. Sci. Technol. 2006, 66, 723–730. [Google Scholar] [CrossRef]
- Reinhardt, H.W.; Xu, S. A practical testing approach to determine mode II fracture energy GIIF for concrete. Int. J. Fract. 2000, 105, 107–125. [Google Scholar] [CrossRef]
- Kumar, C.N.S.; Rao, T.D.G. Punching shear resistance of concrete slabs using mode-II fracture energy. Eng. Fract. Mech. 2012, 83, 75–85. [Google Scholar] [CrossRef]
- Benzeggagh, M.L.; Kenane, M.; Aldcb, A. Measurement of mixed-mode delamination fracture toughness of unidirectional glass/epoxy composites with mixed-mode bending apparatus. Compos. Sci. Technol. 1996, 56, 439–449. [Google Scholar] [CrossRef]
- Van Mier, J.G.M. Mode II fracture localization in concrete loaded in compression. J. Eng. Mech. 2009, 135, 1–8. [Google Scholar] [CrossRef]
- Valsangkar, A.J.; Holm, T.A. Friction angle between expanded shale aggregate construction materials. Geotech. Test. J. 1997, 20, 252–257. [Google Scholar]
- Cong, Y.; Kong, L.; Zheng, Y.; Erdi, A.B.; Wang, Z. Experimental study on shear strength of concrete. Concrete 2015, 5, 40–45. [Google Scholar]
- Bui, Q.V. A modified Benzeggagh-Kenane fracture criterion for mixed-mode delamination. J. Compos. Mater. 2011, 45, 389–413. [Google Scholar] [CrossRef]
- Aïtcin, P.-C.; Mehta, P.K. Effect of coarse aggregate characteristics on mechanical properties of high-strength concrete. Mater. J. 1990, 87, 103–107. [Google Scholar]
- Rocco, C.G.; Elices, M. Effect of aggregate shape on the mechanical properties of a simple concrete. Eng. Fract. Mech. 2009, 76, 286–298. [Google Scholar] [CrossRef]
- Bažant, Z.P.; Gettu, R.; Kazemi, M.T. Identification of nonlinear fracture properties from size effect tests and structural analysis based on geometry-dependent R-curves. Int. J. Rock Mech. Min. Sci. Geomech. Abstr. 1991, 28, 43–51. [Google Scholar] [CrossRef]
- Shaofeng, Y.; Zhang, Z.; Ge, X.; Qiu, Y.; Xu, J. Correlation between fracture energy and geometrical characteristic of mesostructure of marble. Rock Soil Mech. 2016, 37, 2341–2346. [Google Scholar]
- Ying, X.; Junchen, Z.; Wei, Y.; Kaiwen, X. Experimental study of dynamic fracture energy anisotropy of granitic rocks. Chin. J. Rock Mech. Eng. 2018, 37, 3231–3238. [Google Scholar]
- Jianping, Z.; Nengbin, C.; Hongwei, Z. Investigation on failure behavior of basalt from different depth based on three-point bending meso-experiments. Chin. J. Rock Mech. Eng. 2013, 32, 689–695. [Google Scholar]
Figure 1.
Element mesh of model: (a) bulk elements of aggregate (grey colored) and mortar particle (white colored); (b) cohesive elements of ITZs (interfacial transitional zones, red colored) and mortar internal interface (blue coloured).
Figure 1.
Element mesh of model: (a) bulk elements of aggregate (grey colored) and mortar particle (white colored); (b) cohesive elements of ITZs (interfacial transitional zones, red colored) and mortar internal interface (blue coloured).

Figure 2.
Aggregate generation in polar coordinates.

Figure 3.
Spatial representation of CH3D8 (eight-node three-dimensional) cohesive element.

Figure 4.
Illustration of quadratic nominal stress criterion and mixed-mode fracture criterion.

Figure 5.
The meshes with different approximate element sizes: (a) boundary constraint condition marked by the blue triangles and the zoom area marked by the red square; (b) approximate size of 1.5 mm; (c) approximate size of 1.0 mm; (d) approximate size of 0.5 mm.
Figure 5.
The meshes with different approximate element sizes: (a) boundary constraint condition marked by the blue triangles and the zoom area marked by the red square; (b) approximate size of 1.5 mm; (c) approximate size of 1.0 mm; (d) approximate size of 0.5 mm.

Figure 6.
Effect of element size on global stress-strain relation under (a) tension and (b) compression.
Figure 6.
Effect of element size on global stress-strain relation under (a) tension and (b) compression.

Figure 7.
Statistical characteristic of global stress-strain curve under tension.

Figure 8.
Failure modes of the specimens under tension: (a) simulation result (with one dominant crack); (b) simulation result (with two dominant cracks).
Figure 8.
Failure modes of the specimens under tension: (a) simulation result (with one dominant crack); (b) simulation result (with two dominant cracks).

Figure 9.
Global stress-strain curve of the specimens with one and two dominant cracks.

Figure 10.
Deformation magnification in loading direction of a specimen in eight states. Cohesive elements of ITZs (blue coloured) and mortar internal interface (red coloured).
Figure 10.
Deformation magnification in loading direction of a specimen in eight states. Cohesive elements of ITZs (blue coloured) and mortar internal interface (red coloured).

Figure 11.
Failure modes of the specimens with different aggregate distributions under compression


Figure 12.
Statistical characteristic of global stress-strain curve under compression.

Figure 13.
Global stress-strain curve of a specimen under compression.

Figure 14.
Crack propagation process of a specimen: (a) State A, B, C; (b) State D, E; (c) State F, G.
Figure 14.
Crack propagation process of a specimen: (a) State A, B, C; (b) State D, E; (c) State F, G.

Figure 15.
The relationship between global strain and the sum of length of (a) ITZ elements and (b) MII elements with different damage degree.
Figure 15.
The relationship between global strain and the sum of length of (a) ITZ elements and (b) MII elements with different damage degree.

Figure 16.
Effect of mode II fracture energy on global stress-strain relationship under tension (a) and compression (b).
Figure 16.
Effect of mode II fracture energy on global stress-strain relationship under tension (a) and compression (b).

Figure 17.
Effect of material parameter on global stress-strain relationship under (a) tension and (b) compression.
Figure 17.
Effect of material parameter on global stress-strain relationship under (a) tension and (b) compression.

Figure 18.
Failure modes of a specimen under the different frictional angles.


Figure 19.
Effect of frictional angle on global stress-strain relationship under compression.

Figure 20.
Effect of frictional angle on crack propagation under compression.

Figure 21.
Effect of aggregates’ mechanical characteristics on global stress-strain relationship under compression.
Figure 21.
Effect of aggregates’ mechanical characteristics on global stress-strain relationship under compression.

Figure 22.
The relationship between strain and the sum of length of AII elements whose SDEG (overall value of the scalar damage variable) values are higher than 0.95.
Figure 22.
The relationship between strain and the sum of length of AII elements whose SDEG (overall value of the scalar damage variable) values are higher than 0.95.
Figure 23.
Failure modes of a specimen with different aggregate types; in the zoom areas of Figure 23b, the cracks through aggregates are marked by red, the others are marked by black.
Figure 23.
Failure modes of a specimen with different aggregate types; in the zoom areas of Figure 23b, the cracks through aggregates are marked by red, the others are marked by black.


Table 1.
Aggregate gradation and particle number.
| Aggregate Particle Diameter D (mm) | Proportion | Particle Number |
|---|---|---|
| 12 < D ≤ 15 | 5.36% | 8–11 |
| 9 < D ≤ 12 | 8.83% | 20–25 |
| 6 < D ≤ 9 | 11.74% | 65–72 |
| 2.5 < D ≤ 6 | 19.18% | 291–308 |
| D ≤ 2.5 | 35.69% | / |
Table 2.
The bulk and cohesive elements number of the model with different mesh precision.
| Approximate Elements Size (mm) | Bulk Element | Cohesive Element |
|---|---|---|
| 1.5 | 22,076 | 19,877 |
| 1.0 | 50,890 | 44,357 |
| 0.5 | 199,038 | 166,548 |
Table 3.
Material properties of aggregate particles, mortar particles, interfacial transition zones (ITZs), and mortar internal interface (MII).
Table 3.
Material properties of aggregate particles, mortar particles, interfacial transition zones (ITZs), and mortar internal interface (MII).
| Parameter | Aggregate | Mortar | ITZs | MII |
|---|---|---|---|---|
| Elastic Modulus, (GPa) | 72 | 28 | 24 | 26 |
| 0.16 | 0.2 | - | - | |
| 0 | 0 | - | - | |
| Shear modulus (GPa) | 31.0 | 11.7 | 10.0 | 10.8 |
| (MPa) | - | - | 2.6 | 4 |
| Maximum nominal stress in shear direction, and (MPa) | - | - | 10 | 30 |
| (N/mm) | - | - | 0.025 | 0.1 |
| (N/mm) | - | - | 0.625 | 2.5 |
| B-K criterion material parameter, | - | - | 1.2 | 1.2 |
Table 4.
Material properties of aggregate internal interfaces (AIIs).
| Parameter | Limestone | Marble | Granite | Basalt |
|---|---|---|---|---|
| (MPa) | 6.0 | 4.5 | 10.0 | 15.0 |
| Maximum nominal stress in shear direction, and (MPa) | 45.0 | 40.0 | 90.0 | 120.0 |
| (N/mm) | 60 | 160 | 400 | 1400 |
| (N/mm) | 1500 | 4000 | 10,000 | 35,000 |
| B-K criterion material parameter, | 1.2 | 1.2 | 1.2 | 1.2 |
© 2019 by the authors. Licensee MDPI, Basel, Switzerland. This article is an open access article distributed under the terms and conditions of the Creative Commons Attribution (CC BY) license (http://creativecommons.org/licenses/by/4.0/).
Share and Cite
MDPI and ACS Style
Xiong, X.; Xiao, Q. Meso-Scale Simulation of Concrete Based on Fracture and Interaction Behavior. Appl. Sci. 2019, 9, 2986. https://doi.org/10.3390/app9152986
AMA Style
Xiong X, Xiao Q. Meso-Scale Simulation of Concrete Based on Fracture and Interaction Behavior. Applied Sciences. 2019; 9(15):2986. https://doi.org/10.3390/app9152986
Chicago/Turabian StyleXiong, Xueyu, and Qisheng Xiao. 2019. "Meso-Scale Simulation of Concrete Based on Fracture and Interaction Behavior" Applied Sciences 9, no. 15: 2986. https://doi.org/10.3390/app9152986
Note that from the first issue of 2016, this journal uses article numbers instead of page numbers. See further details here.