Fatigue in Concrete under Low-Cycle Tensile Loading Using a Pressure-Tension Apparatus


1
Department of Civil Engineering, Australian College of Kuwait, P.O. Box 1411, Safat 13015, Kuwait
2
Department of Civil Engineering and Applied Mechanics, McGill University, 817 Sherbrooke Street West, Montreal, QC H3A 0C3, Canada
3
Project Coordinator, Aecon, 20 Carlson Ct, Etobicoke, ON M9W 7K6, Canada
4
Department of Computational Science and Engineering, North Carolina A&T State University, 1601 E, Market Street, Greensboro, NC 27411, USA
*
Author to whom correspondence should be addressed.
Appl. Sci. 2019, 9(16), 3217; https://doi.org/10.3390/app9163217
Submission received: 15 July 2019
/
Revised: 1 August 2019
/
Accepted: 6 August 2019
/
Published: 7 August 2019
(This article belongs to the Special Issue Fatigue and Fracture of Non-metallic Materials and Structures)
Abstract
:Fatigue due to low-cycle tensile loading in plain concrete was examined under different conditions using the pressure-tension apparatus. A total of 22 wet or dry standard concrete cylinders (100 mm × 200 mm) were tested. By definition, low-cycle loading refers to the concept of multiple load cycles applied at high stress levels (i.e., a concrete structure subjected to seismic loading). Results suggest that concrete samples subjected to low-cycle tensile loading will fail after a relatively low number of cycles of loading and at a lower magnitude of stress compared to the maximum value applied during cyclic loading. Furthermore, non-destructive testing was employed in order to ascertain the extent of progressive damage inflicted by tensile loading in concrete specimens. It was found that ultrasonic pulse velocity is a viable technique for evaluating the damage consequential of loads applied to concrete, including that resultant from low levels of tensile stress (i.e., as low as 10% of its maximum tensile capacity). Additionally, finite element analysis was performed on a modeled version of the pressure-tension apparatus with a sample of concrete, which has yielded similar results to the experimental work.
1. Introduction
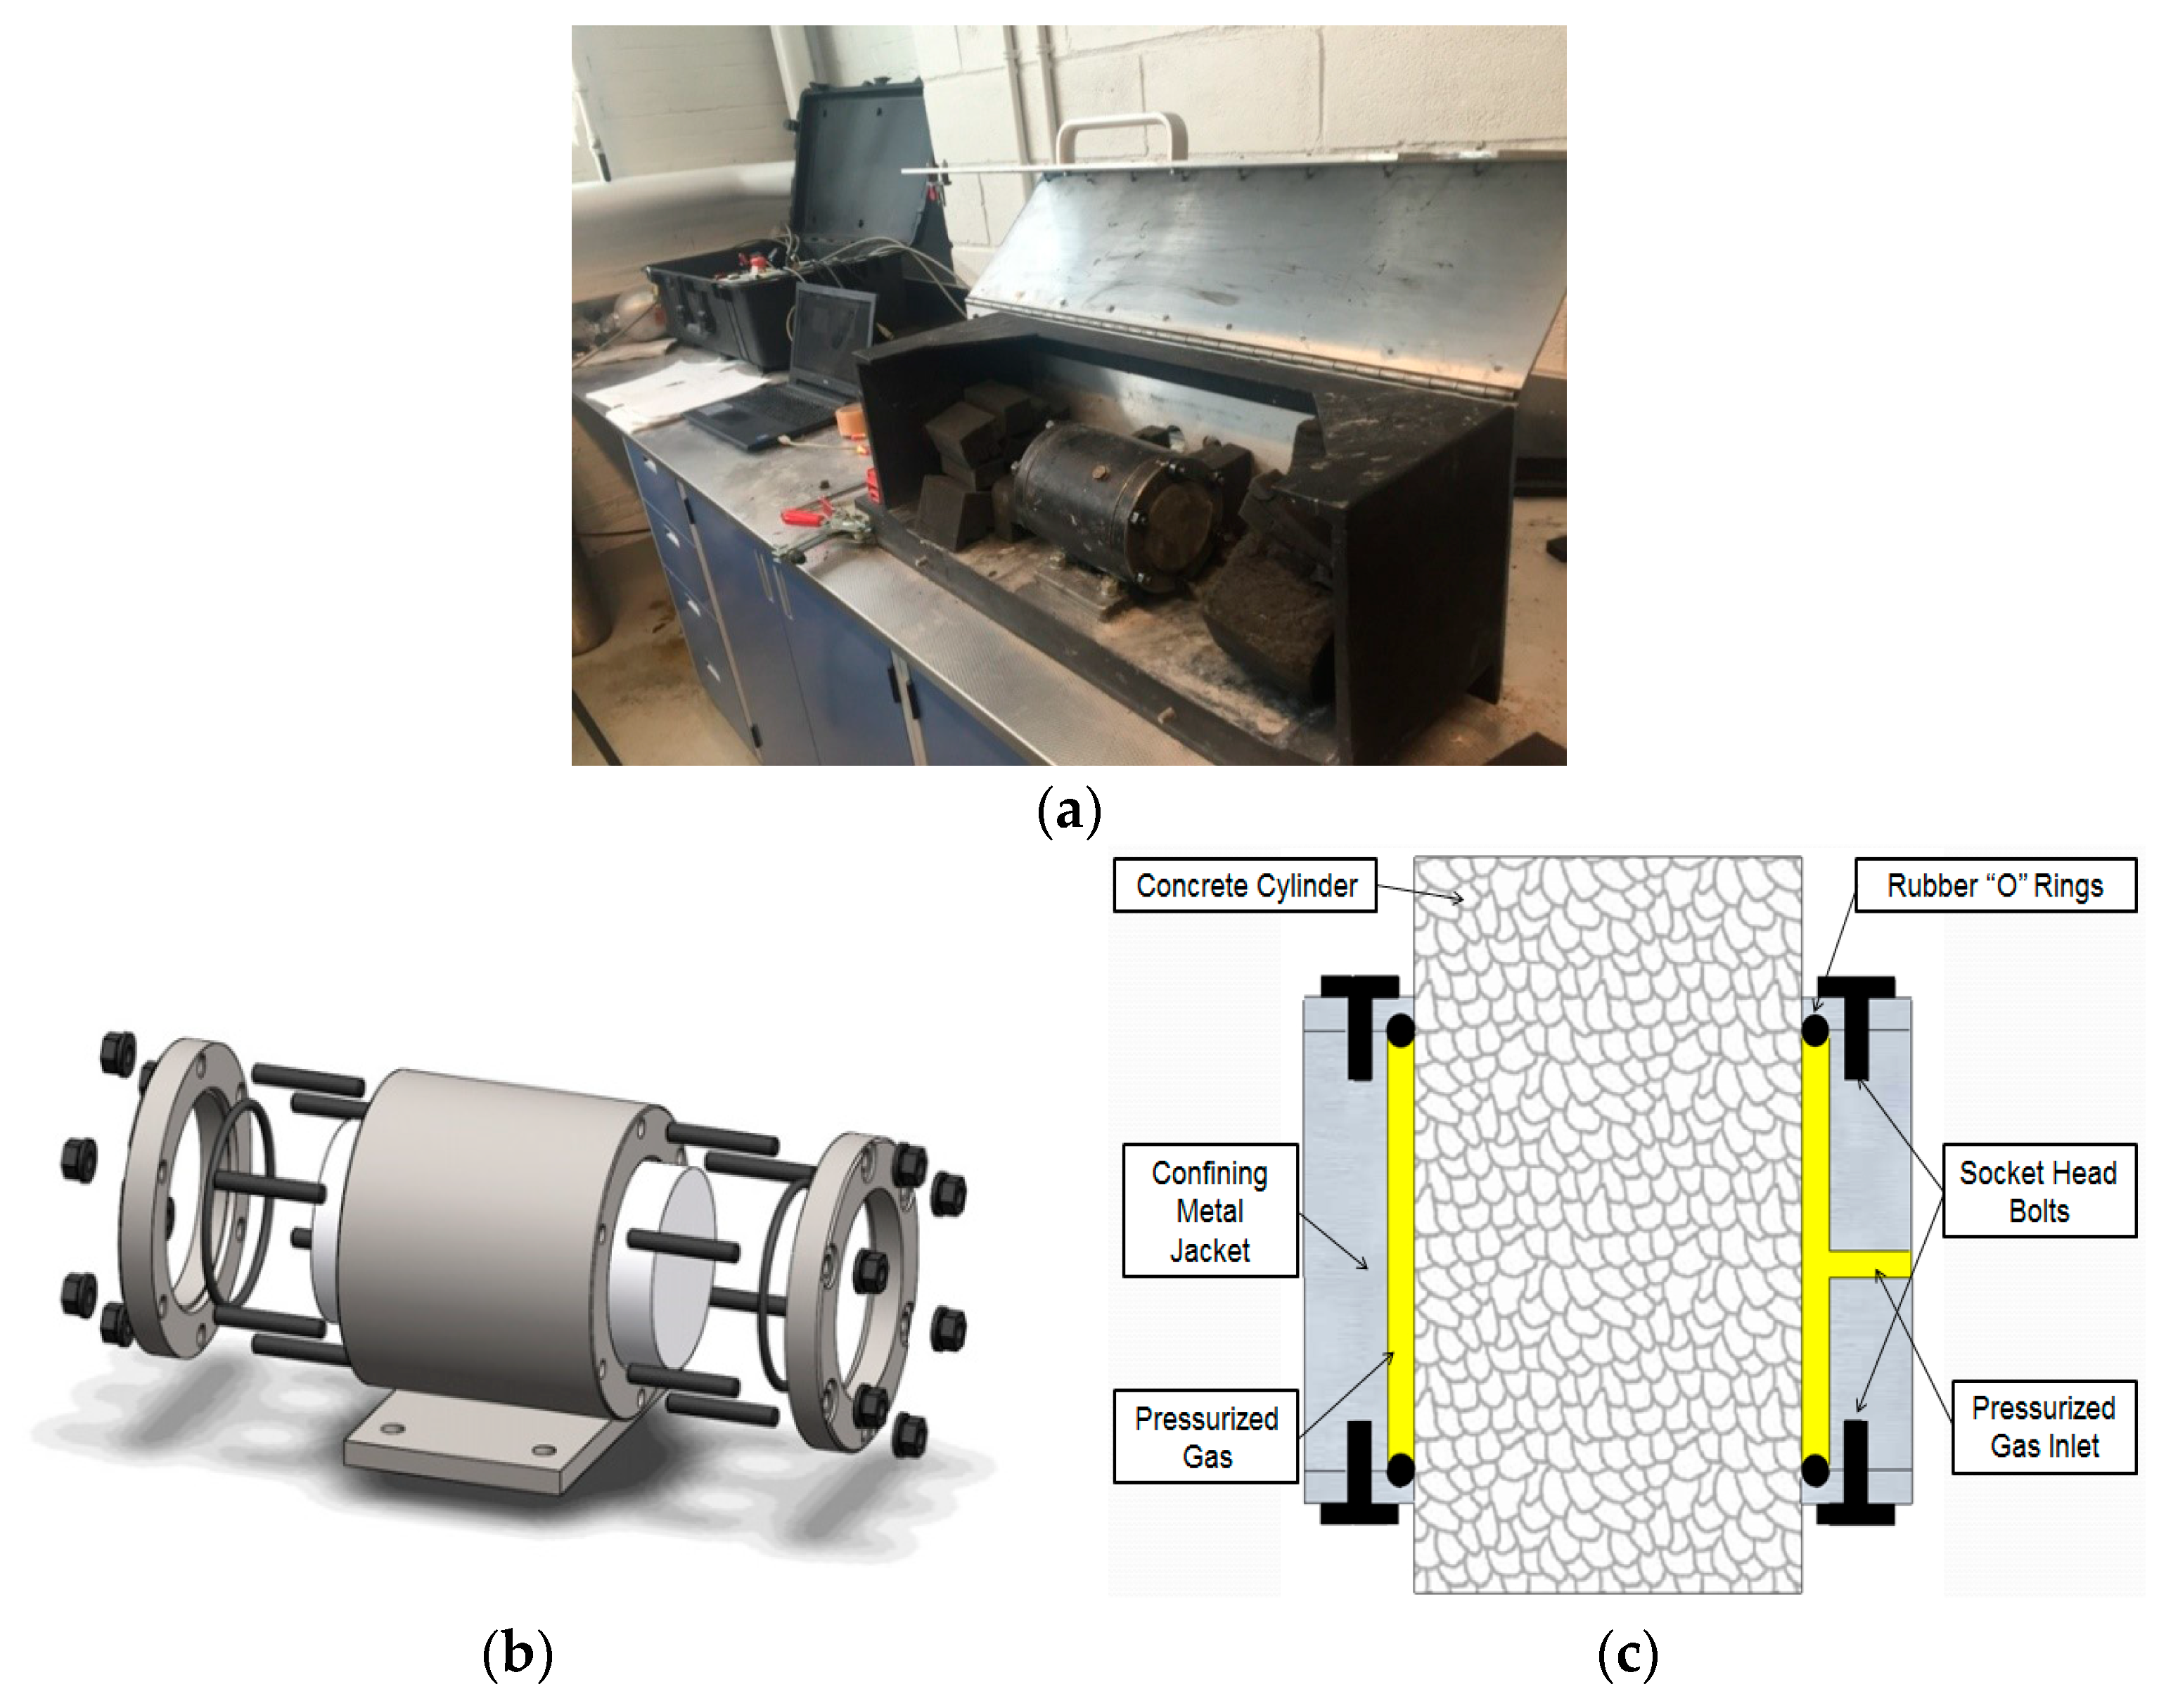
The pressure tension testing method was originally developed by the Building Research Council as a new method of examining anisotropic loading conditions on materials [1]. The pressure tension apparatus uses standard 100 mm × 200 mm concrete cylinders as samples. Concrete core samples can also be used. The size of the sample allows this test method to be adapted to common concrete testing procedures used in industry. The test uses a pressurized gas equally applied along the curved surface of the cylinder, with rubber O-rings at either end of the specimen to hold the gas between the testing chamber and the concrete cylindrical sample surface, as shown in Figure 1. The two flat ends of the cylinder are left open to the atmosphere, which causes a net induced tension field to arise within the concrete sample parallel to the longitudinal axis of the cylinder. Komar [2] devised and implemented a novel instrumentation system that allowed for fully automated control of the loading rate and variety of loading conditions, including ramped loading at different rates, cyclic loading, constant loading rate (such as creep), and controlled unloading. This study uses the method of cyclic loading.
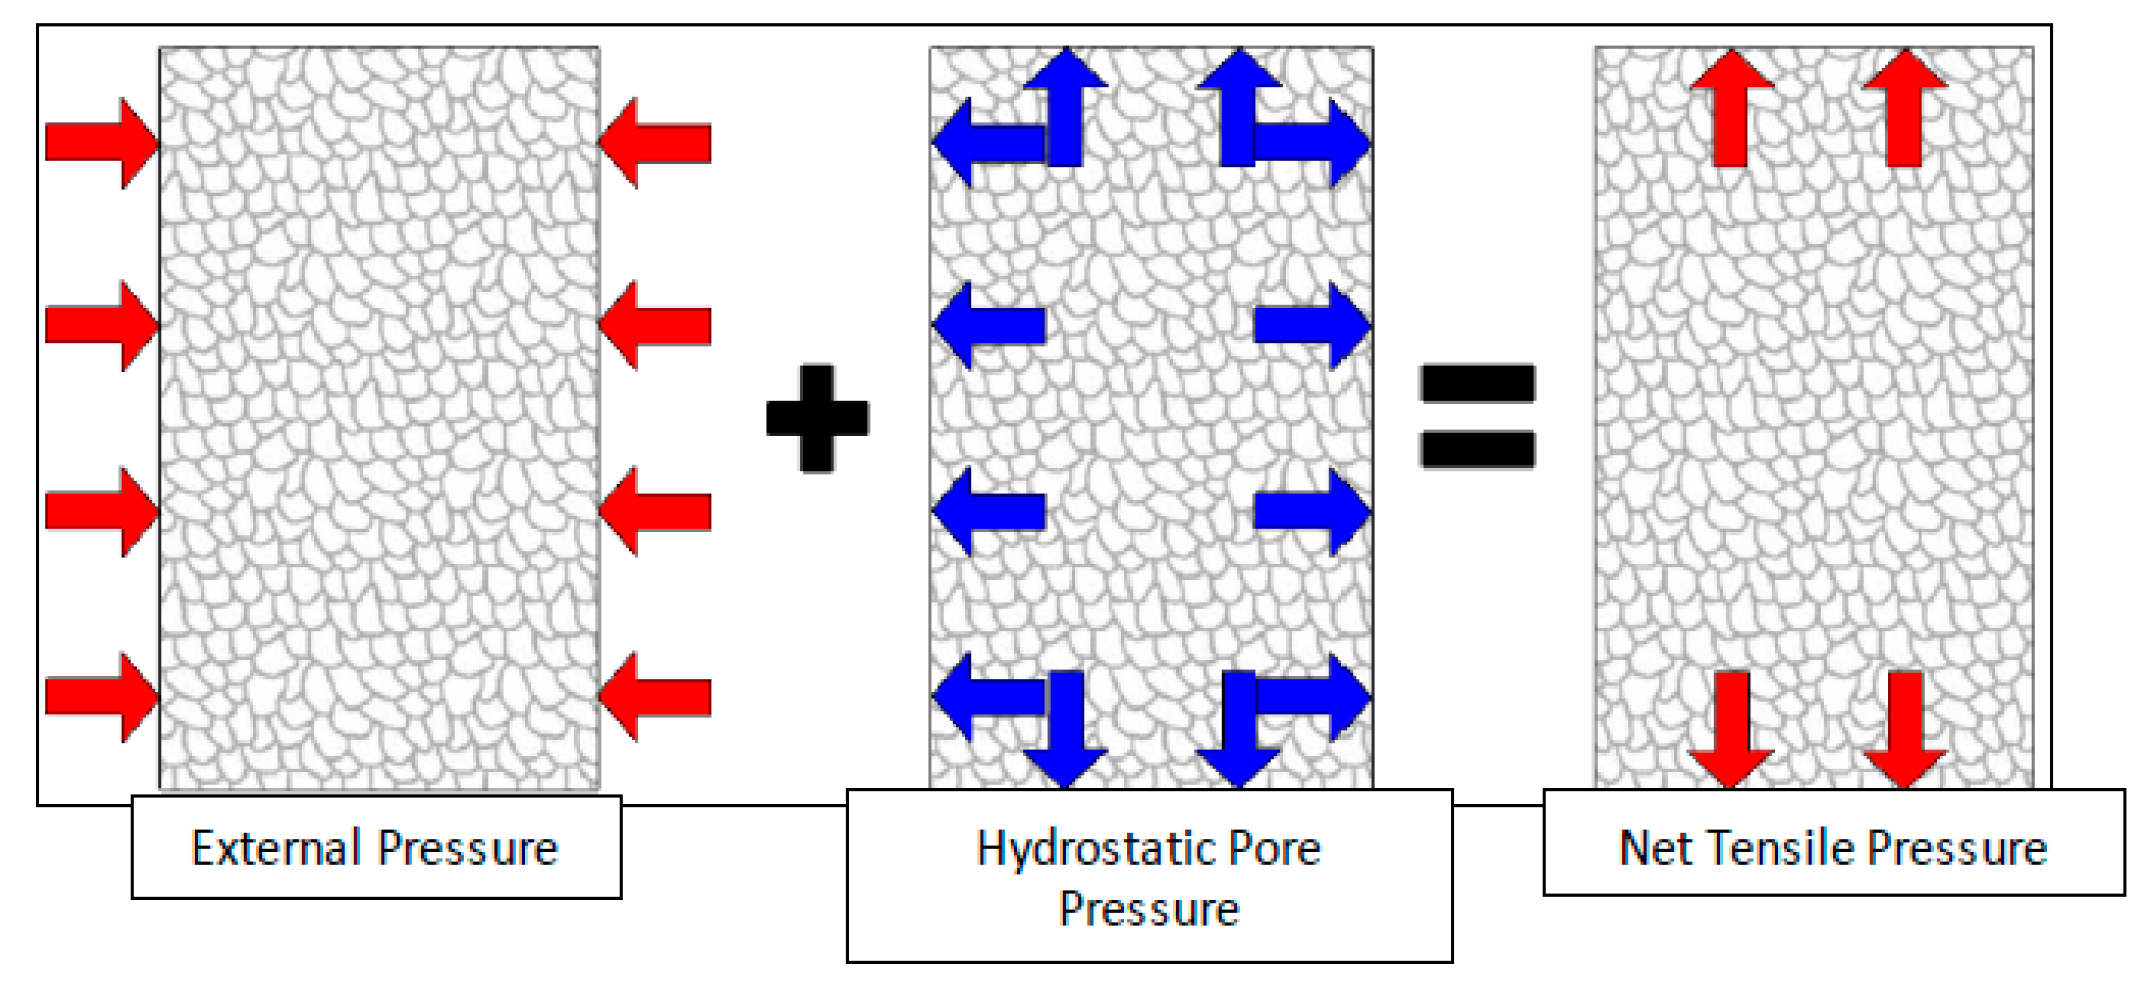
In this test method, a tension field will be produced from a compressive load. It can be understood as a net effective stress which is consistent with principles first developed for soil mechanics [3]. Concrete is a two-phase material with a solid phase consisting of the hydrated cementitious matrix and the aggregates, and a liquid phase consisting of the pore water. The different reactions of the two phases to a biaxial stress gives rise to the pressure tension effect: the liquid phase reacts in a hydrostatic manner, in contrast to the solid phase which reacts in the directions of the applied load. All the stresses in the plane of gas loading cancel each other out, with a net tension field arising along the axis of the cylinder [4], which is shown in Figure 2. The pressure tension apparatus uniformly increases the gas pressure applied to the concrete cylinder until the point where the solid phase of the specimen can no longer remain together, at which point the concrete cylinder breaks at the weakest plane along its length. The gas pressure at the moment of failure is taken as the ultimate tensile strength of the concrete.
Rashidi et al. [5] conducted an experimental study to evaluate the strength of concrete subjected to Indirect Diametrical Tensile (IDT), Unconfined Compressive Strength (UCS) and submaximal modulus testing methods. Their experimental design involved the application of a specific strain rate of 1 mm/min on concrete specimens. IDT employs a controlled loading condition to split the cylinder into two half-cylinders. In contrast, the present experimental design uses gas pressure to achieve the same mode of failure.
Ultrasonic Pulse Velocity (UPV) provides information about the evolution of the pore space of concrete, for both hydration and changes due to durability issues. Komar [2] used UPV to track the hydration process during curing; they found UPV could distinguish between different pore structures at early ages and could track the evolution of the pore structures over the curing period. UPV can be divided into three categories: Direct (sensors opposite to each other), indirect (adjacent sensors), and semi-direct (sensors at right angles) transmission. Ultrasonic waves have been used to predict and evaluate concrete strength and its properties in several studies [6]. However, this method can also be used to detect the internal deficiencies of concrete such as cracks. In this experimental work, the UPV method is used to determine the presence of cracks in concrete after a low magnitude of tensile stress is applied. The UPV test is a measurement of the continuity of the solid part of the concrete through which the stress waves propagate, and it is well-suited for evaluating any changes to this solid structure due to ongoing deterioration. The test apparatus produces and applies a pulse into the concrete by means of a pulse transducer and receiver and encompasses the ability to accurately measure the amount of time the pulse takes to pass through the concrete.
2. Materials and Methods
A total of 22 standard concrete cylinders (100 mm × 200 mm) were cast and tested. The concrete used in the cylinders was made using the mix design shown in Table 1. The specimens were molded and compacted based on ASTM C31 [7]. After 24 h of curing in their molds, the cylinders were removed and stored in ambient laboratory conditions for over 2 years.
In a pressure-tension test, a destructive test method that specifically evaluates the tensile capacity of concrete, a cylindrical steel jacket is used to hold a concrete cylinder serving as the specimen. A rubber O-ring is used at each end to keep an airtight seal and prevent possible gas leakage. With the ends then left free, gas pressure is incrementally applied to the curved surface of the concrete cylinder until the specimen ultimately fractures across a single plane perpendicular to the axis of the concrete specimen. The value of gas pressure at fracture thus corresponds to the maximum tensile capacity of the concrete. Compressed air is used as the loading medium for all specimens in this experimental work. The air was pressurized using a portable air compressor with a maximum available pressure of about 17 MPa, which was stored in a pressurized gas vessel attached to the compressor and the testing machine. A variable check valve was used to keep the pressure head constant in order to minimize inconsistency in the test caused by pressure variance in the storage tank. A needle valve was used as the controller for the flow rate of the compressed gas into the testing chamber. The valve was operated by a mechanical actuator which was controlled using custom software and monitored using a digital acquisition device (DAQ). Measurement of pressure within the test chamber was obtained using a digital pressure transducer directly adjacent to the chamber, which was used as a control input in the software. The pressure transducer had a measured error of ±0.05 MPa. The DAQ had a sensing resolution of approximately 0.1 s [2,6]. All pressure-time plots were recorded and stored, and the data point immediately preceding failure was used as the failure load.
The implemented control algorithm is a modified proportional integral derivative function which automatically varies the valve position based on the detected error between the measured pressure and the set point. The set point is an arbitrary time-dependent function, and all tests carried out in this study used a uniformly increasing pressure-time signal with a rate of about 0.02 to 0.03 MPa/second, comparable to loading rates in both ASTM C 496 and ASTM C 33 [6]. A higher rate of about 0.10 to 0.15 MPa/second was used during the cyclic loading of the specimens to expedite the process.
Rubber O-rings with a diameter of 10 mm were used to seal the interface between the test chamber and the concrete sample (Figure 1). One or two layers of polyvinylchloride tape was applied on both ends of the cylinder to provide a better seal between the O-rings and the cylinder, which occasionally had voids or deterioration defects that could cause leakage around the O-rings. The O-rings were torqued with a series of six lug nuts bearing on a steel plate in a manner that applied equal pressure on them and ensured a tight seal for the loading gas.
Pressure tension testing is affected by the moisture content of the specimens; samples with a higher water content fail at a higher tensile resistance as compared to dry specimens [2]. For dry samples, the failure mode in pressure tension testing changes from a single crack to a volumetric failure at a lower applied tensile stress [2,8].
Fatigue loading can be categorized into low-cycle and high-cycle loading. Low-cycle loading encompasses the introduction of a few high-stress load cycles such as the application of the earthquake loads on a structure. Conversely high-cyclic loading is categorized by the introduction of a large number of low-stress load cycles, such as the live load applications on the bridges and airport pavements.
The flexural test method is the most commonly used method for fatigue testing. Comparatively, compressive fatigue tests have been studied to a lesser extent. After the emergence of nonlinear fracture mechanics toward evaluating the performance of concrete, some researchers have shown interest in the fatigue characteristics of concrete in tension [9,10,11]. Nevertheless, there are very limited studies available on the behavior of plain concrete under direct tension fatigue loading [12,13,14,15]. The challenges associated with direct tensile testing on concrete is also a primary reason for limited and often conflicting data availability.
Furthermore, non-destructive testing (NDT) was employed to evaluate the progressive damage inflicted by tensile loading on concrete cylinders using UPV apparatus. A Proceq TICO model of automatic UPV was used for this experimental study. Three measurements of transit times along the axis of the cylinder were recorded, and the average of these three values was noted. Length measurements from the cylinders (i.e., height of the concrete cylinder specimens) were used to convert the travel times into the UPV values reported. A commercially available water-based lubricant was used to ensure a good connection between the transmitter/receiver and the greatly variable surface of the concrete samples.
In this study, two piezoelectric sensors are placed at opposite ends of the test specimen (i.e., direct method). Electronic pulses are generated by one sensor, while the other sensor measures the time taken by the pulse to transmit through the concrete. Knowing the distance traveled (i.e., the height of the concrete cylinder specimen in this case), transmission velocity will be calculated based on the resultant value and the condition of the concrete may be determined.
3. Experimental Results and Discussion
3.1. Tensile Strengths (No Cyclic Loads)
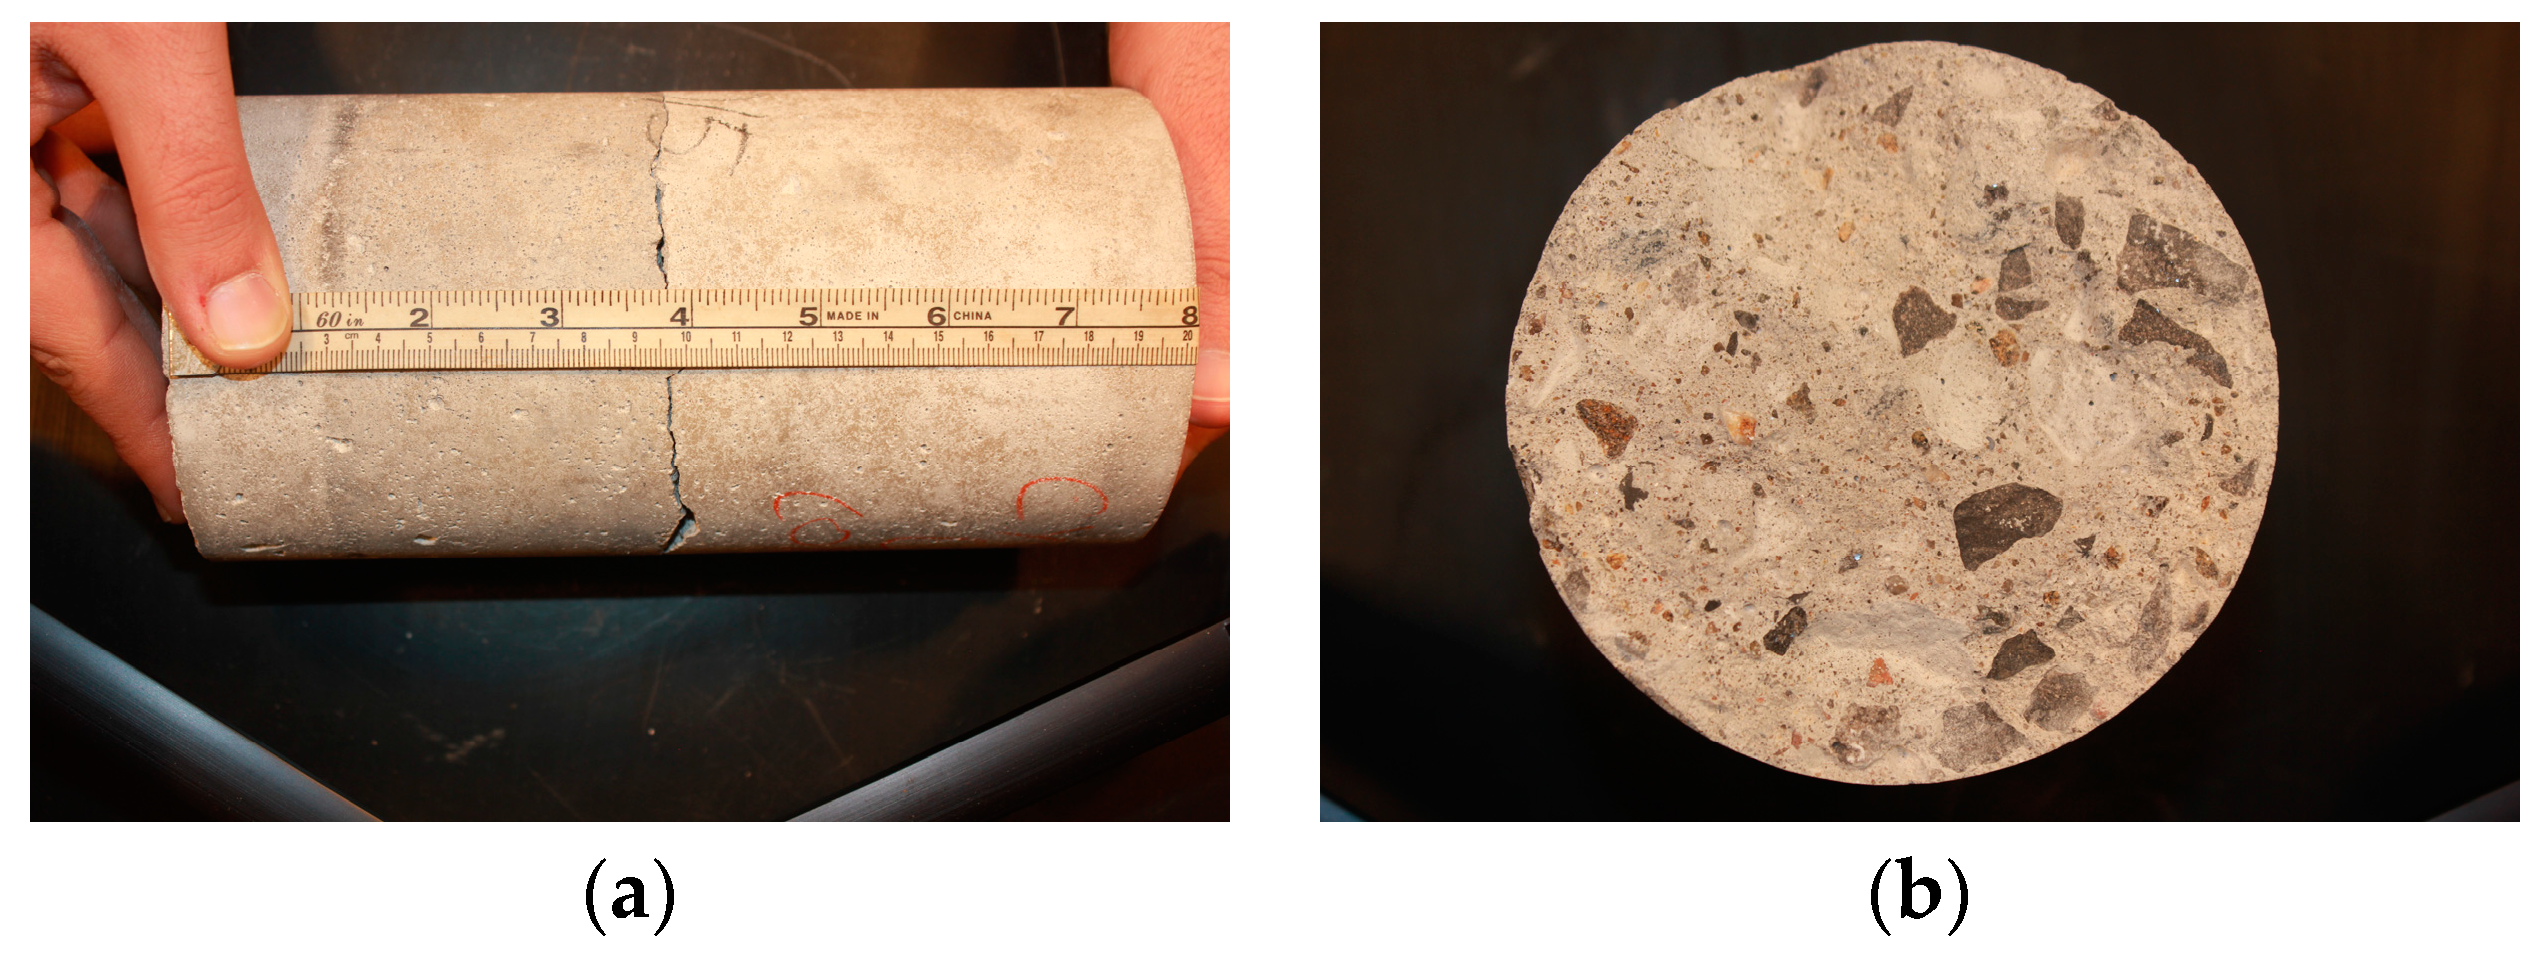
The first trial of samples consisted of six standard concrete cylinders loaded up to failure (Figure 3). The first two were tested in dry conditions, while the other four were tested in wet conditions (they have been submerged in water for few days before the test). The results of each individual test are presented in Table 2. The statistical analysis exhibits that the average tensile strength of the dry specimens was lower than that of the wet specimens. In contrast, the coefficient of variation for the wet specimens is much bigger than that of the dry specimens. The recommended coefficient of variation in the ASTM C 496 standard is 14%. Given the limited number of tests conducted in this study, it seems that the pressure tension test on dry specimens will give a conservative and reliable result as compared to the wet specimens. More test results are required to attest this statement.
3.2. Tensile Strengths (Cyclic Loads)
Twelve wet and four dry concrete cylinders (a total of sixteen specimens) have been tested under a cyclic loading condition. Since the tensile strength of the specimen can be varied substantially for the wet specimens as shown in Table 2, finding the fatigue threshold associated with a low-cycle loading protocol can be quite challenging. The results are shown in tabular format for these specimens.
Table 3 shows the cyclic test results for two wet specimens (No. 7 and No. 8). Each one failed during the cyclic loading and under a tensile stress that was below the maximum applied tensile stress in previous cycle(s). Both specimens have not been loaded prior to the cyclic loads. It is worth mentioning that the stress at failure is also less than the average tensile strength of 4.45 MPa (as indicated in Table 2).
Specimens No. 9 to No. 14 have been subjected to 100 cycles of tensile loads with a maximum tensile stress of 2.23 MPa to 3.01 MPa. Then, they have been loaded up to the failure point and the tensile strengths have been recorded to see the effect of the cyclic loading on the final tensile strength. The results are tabulated in Table 4. It seems that the tensile strength of concrete will not be affected if the maximum tensile stress in the cyclic loading is below a threshold (i.e., low-cycle loading). This threshold can be more than 62% of the tensile strength (based on the limited number of test results presented in Table 4) but more test results are required for verification. The difference between these specimens and those reported in Table 3 is that they have been subjected to a cyclic loading for 100 cycles and then tested up to the failure point. The specimens in Table 3 failed during the cyclic loading.
Specimens No. 15 to No. 18 have been subjected to a cyclic loading with a maximum of 20 cycles. The cyclic loading started at a low level (about 50% of the average tensile strength of the wet specimens as indicated in Table 2) and the maximum load in the next 20 cycles has been increased gradually (by about 5% of the average tensile strength of the wet specimens as indicated in Table 2). The purpose of this test method was to prove that there is a threshold for the cyclic loading at which the fatigue failure will happen at a low-cycle loading. Test results for these specimens are shown in Table 5.
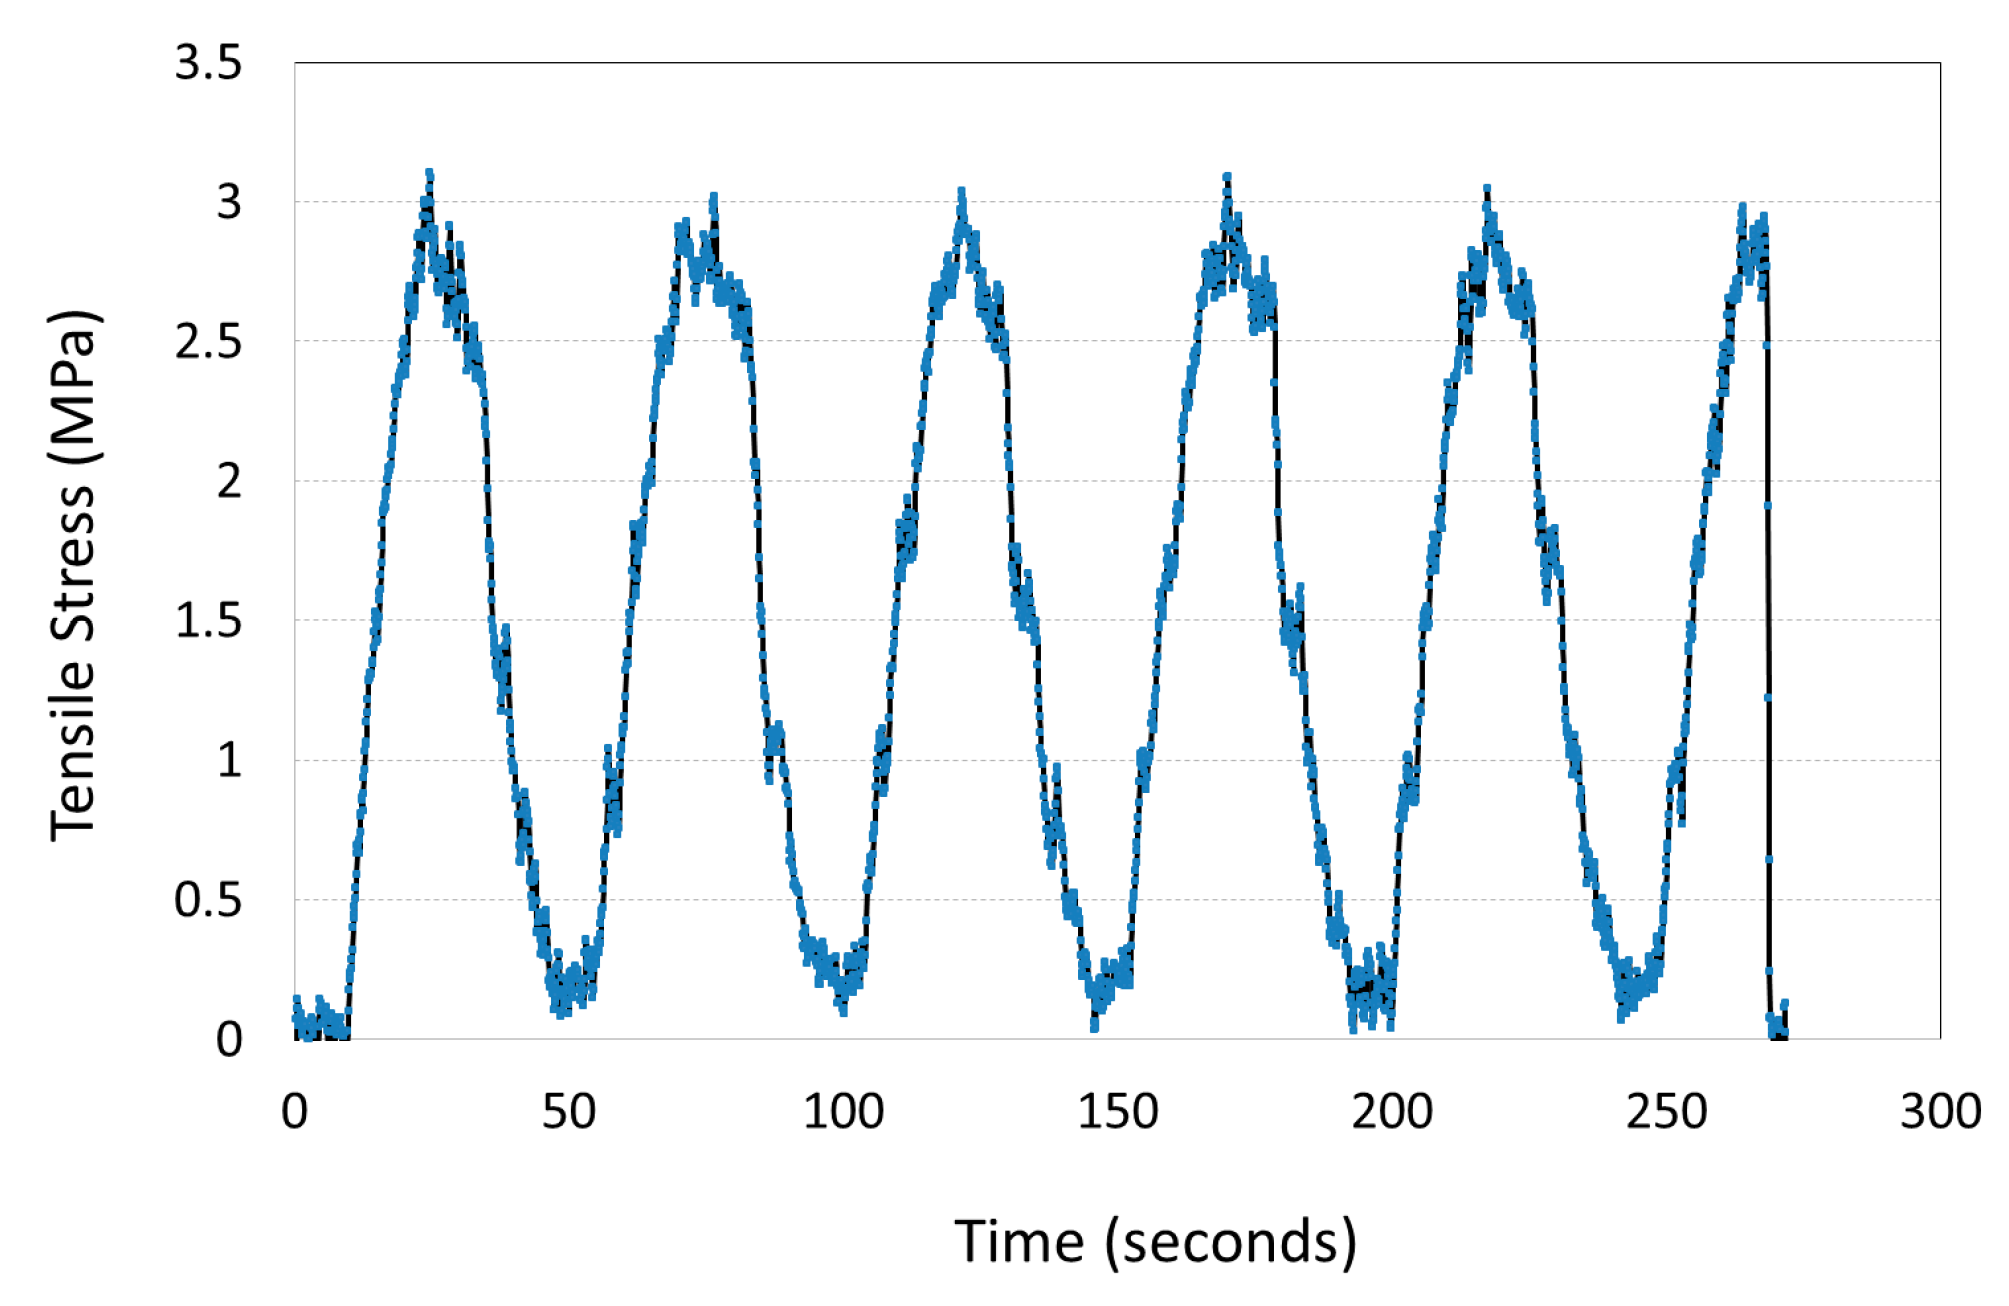
Table 6 shows the test results for specimens No. 19 to No. 22. They have been tested in a dry condition. The same procedure explained for testing specimens No. 15 to No. 18 has been followed for these tests. It is clear that the condition of the concrete cylinders (i.e., wet versus dry) plays an important role in the tensile capacity of the concrete in cyclic loading (Table 3, Table 4, Table 5 and Table 6) and non-cyclic loading (Table 2). As an example, the cyclic loading on specimen No. 19 is shown in Figure 4, in which the specimen failed during the sixth cycle.
3.3. UPV Test Results and Discussions
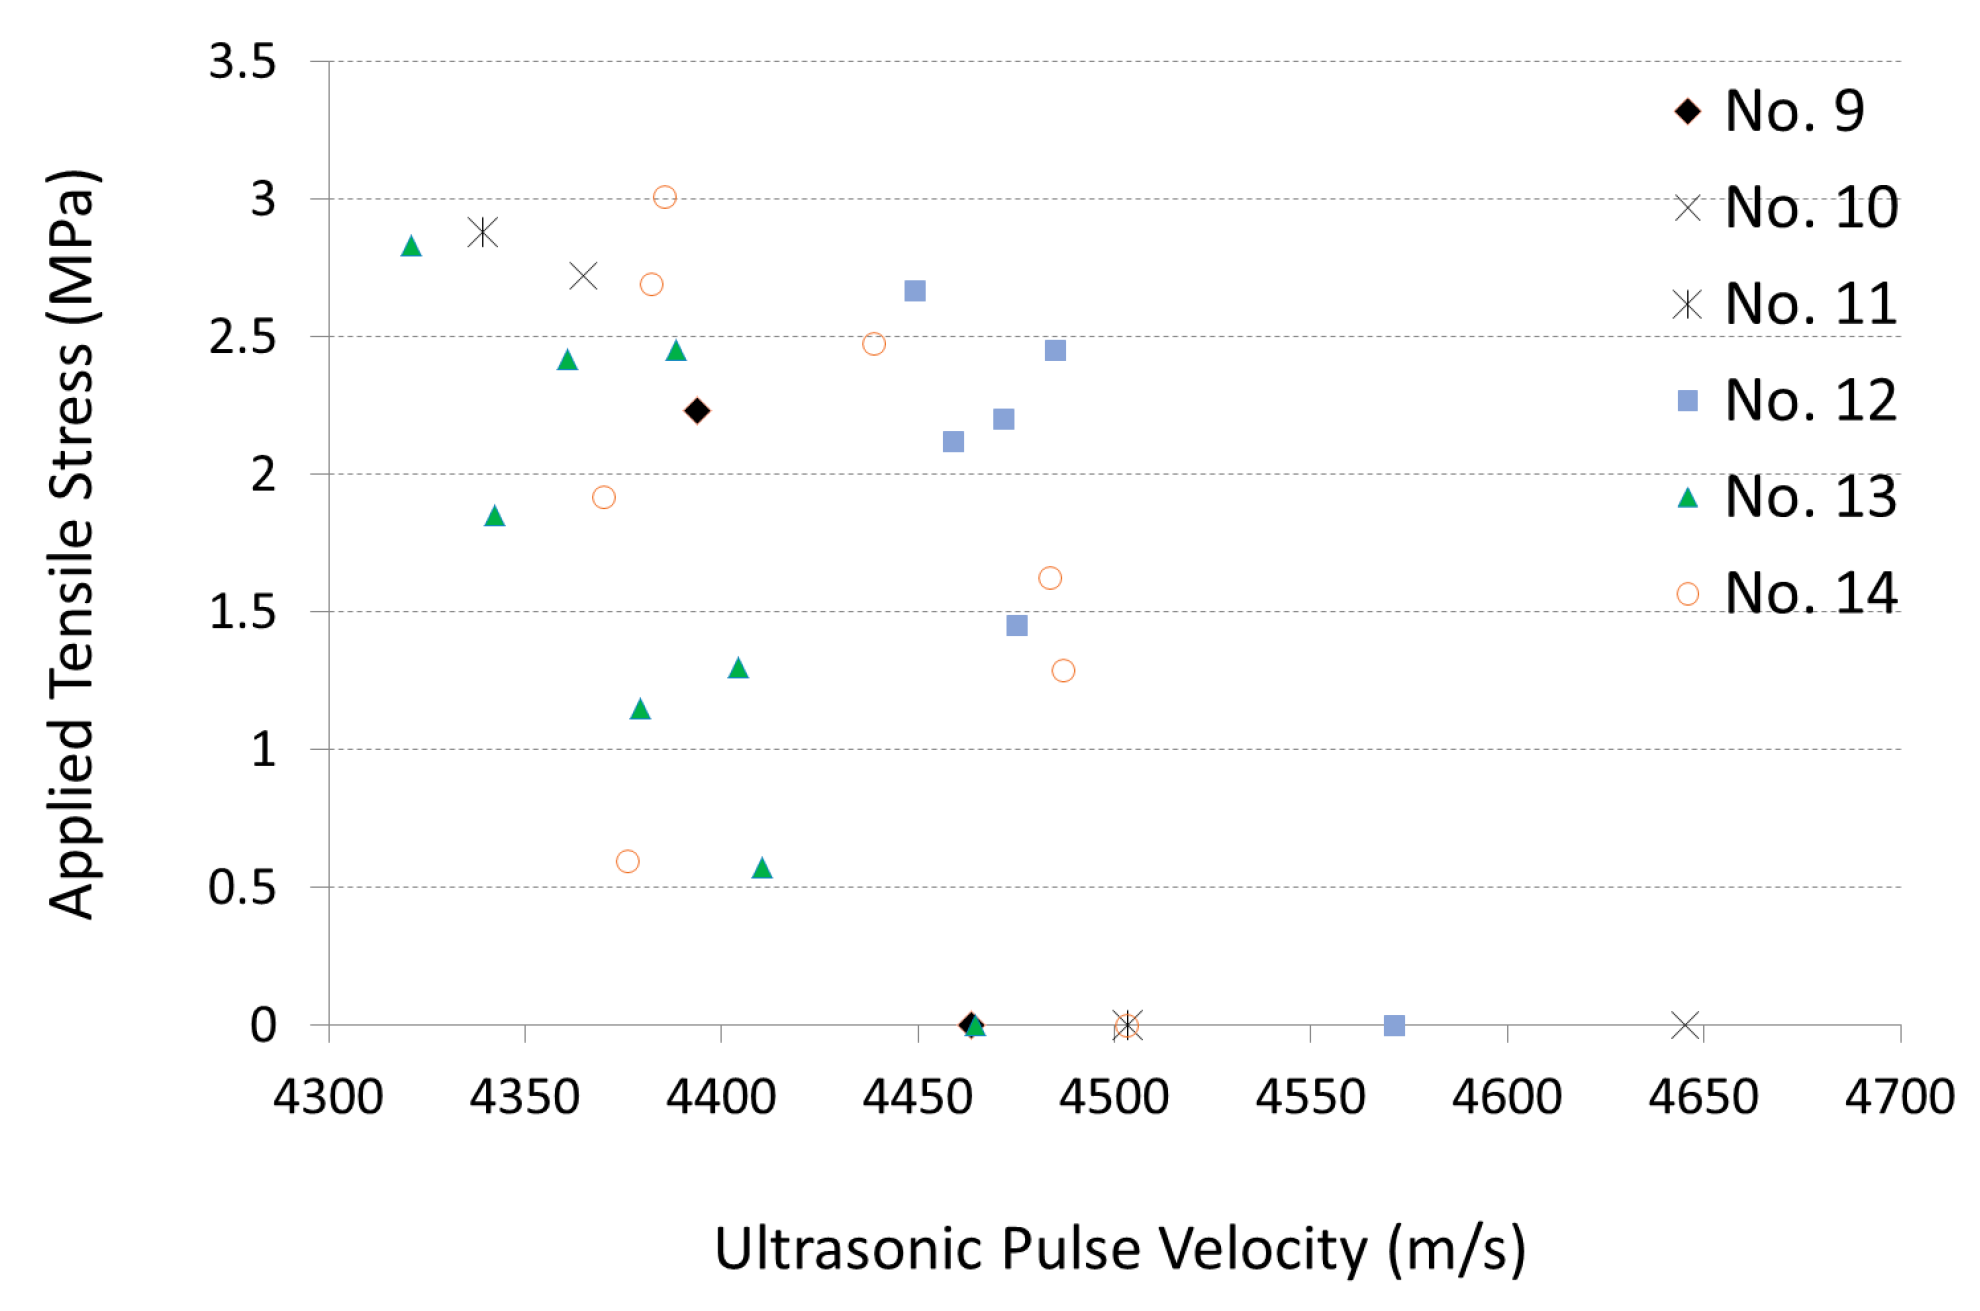
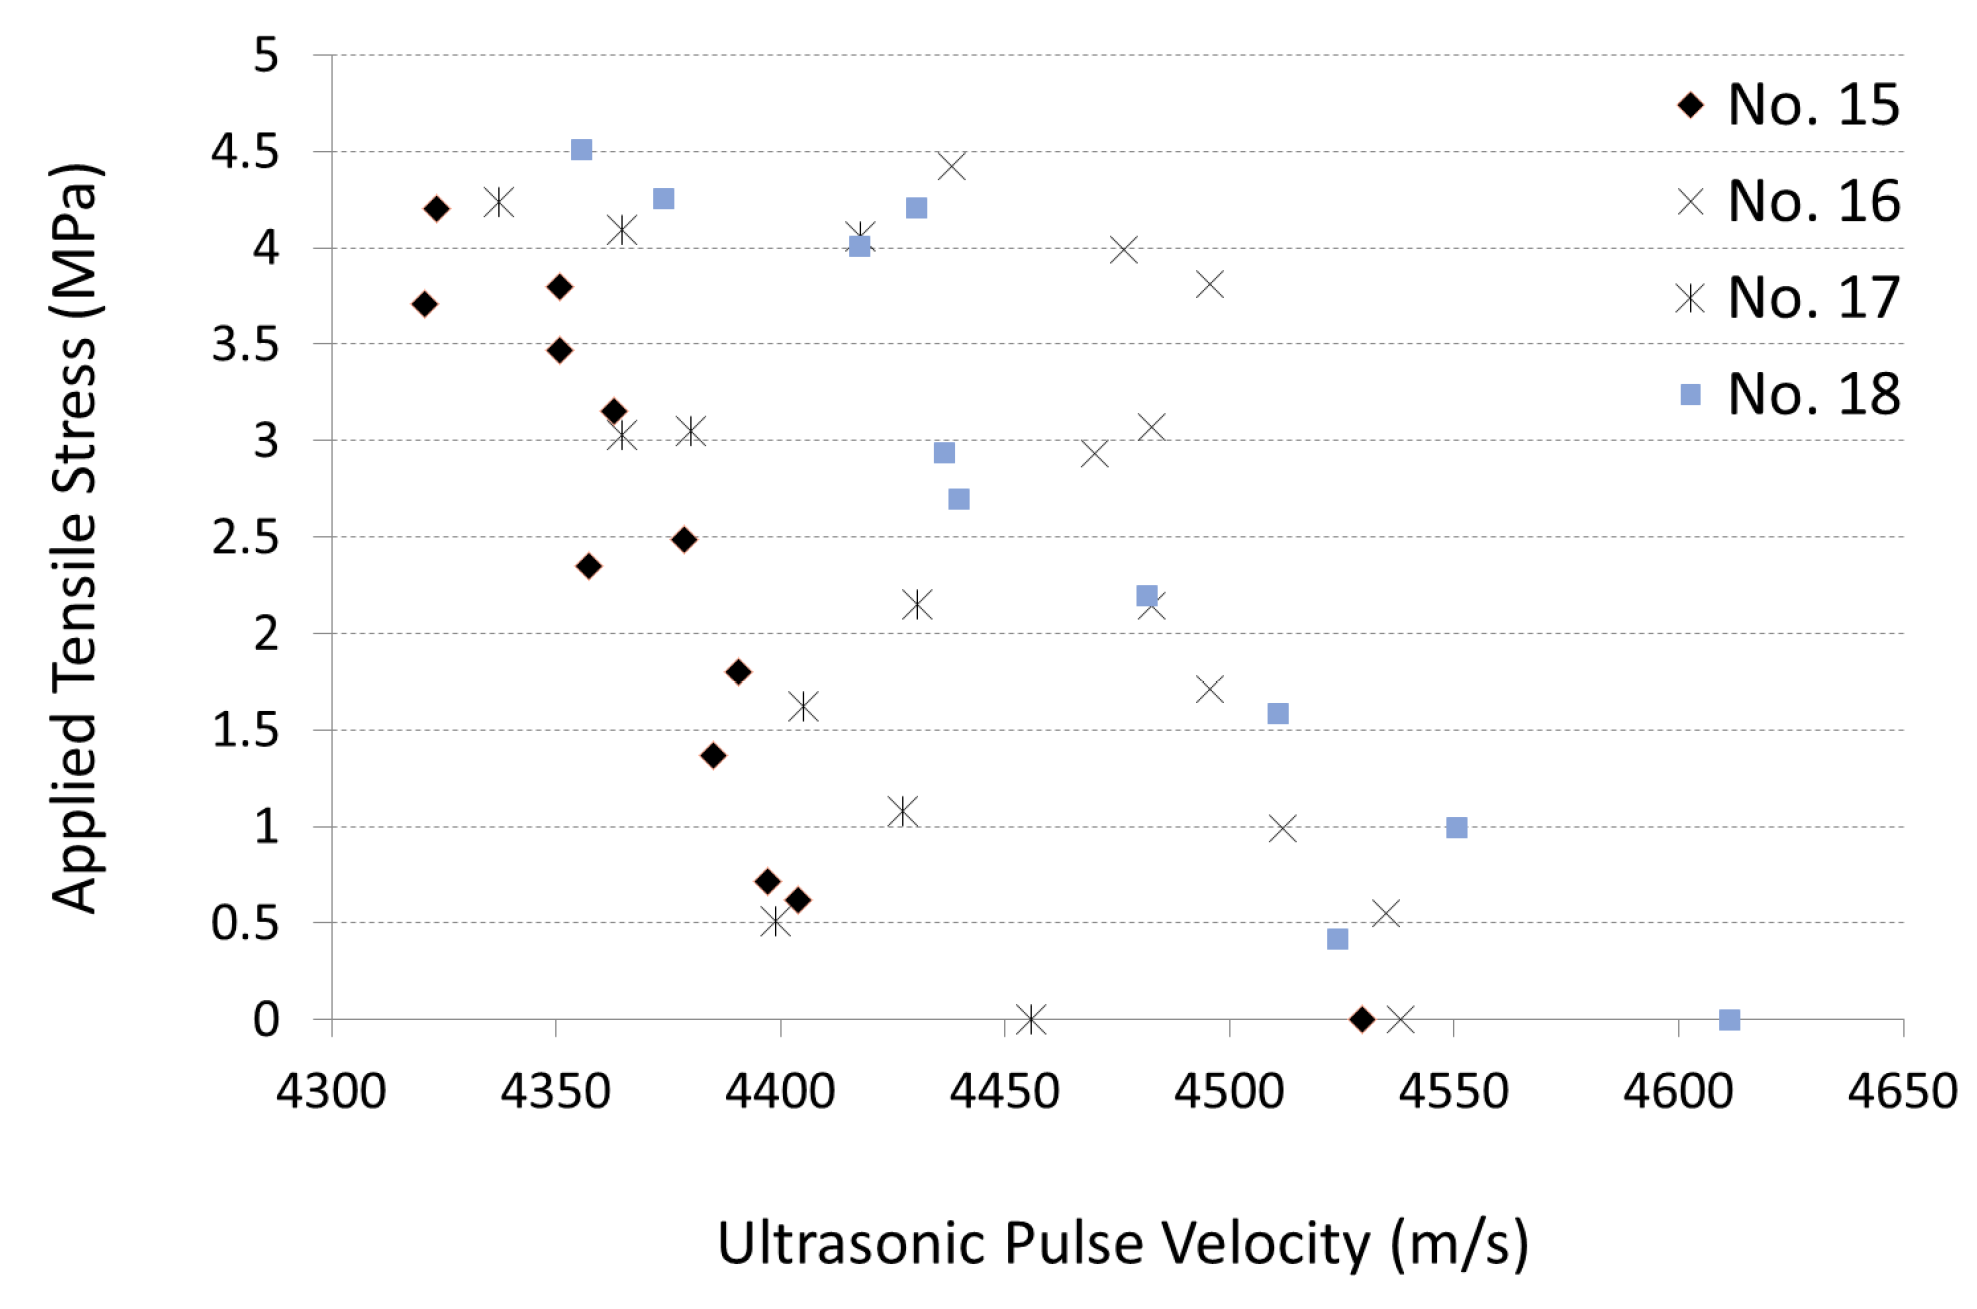
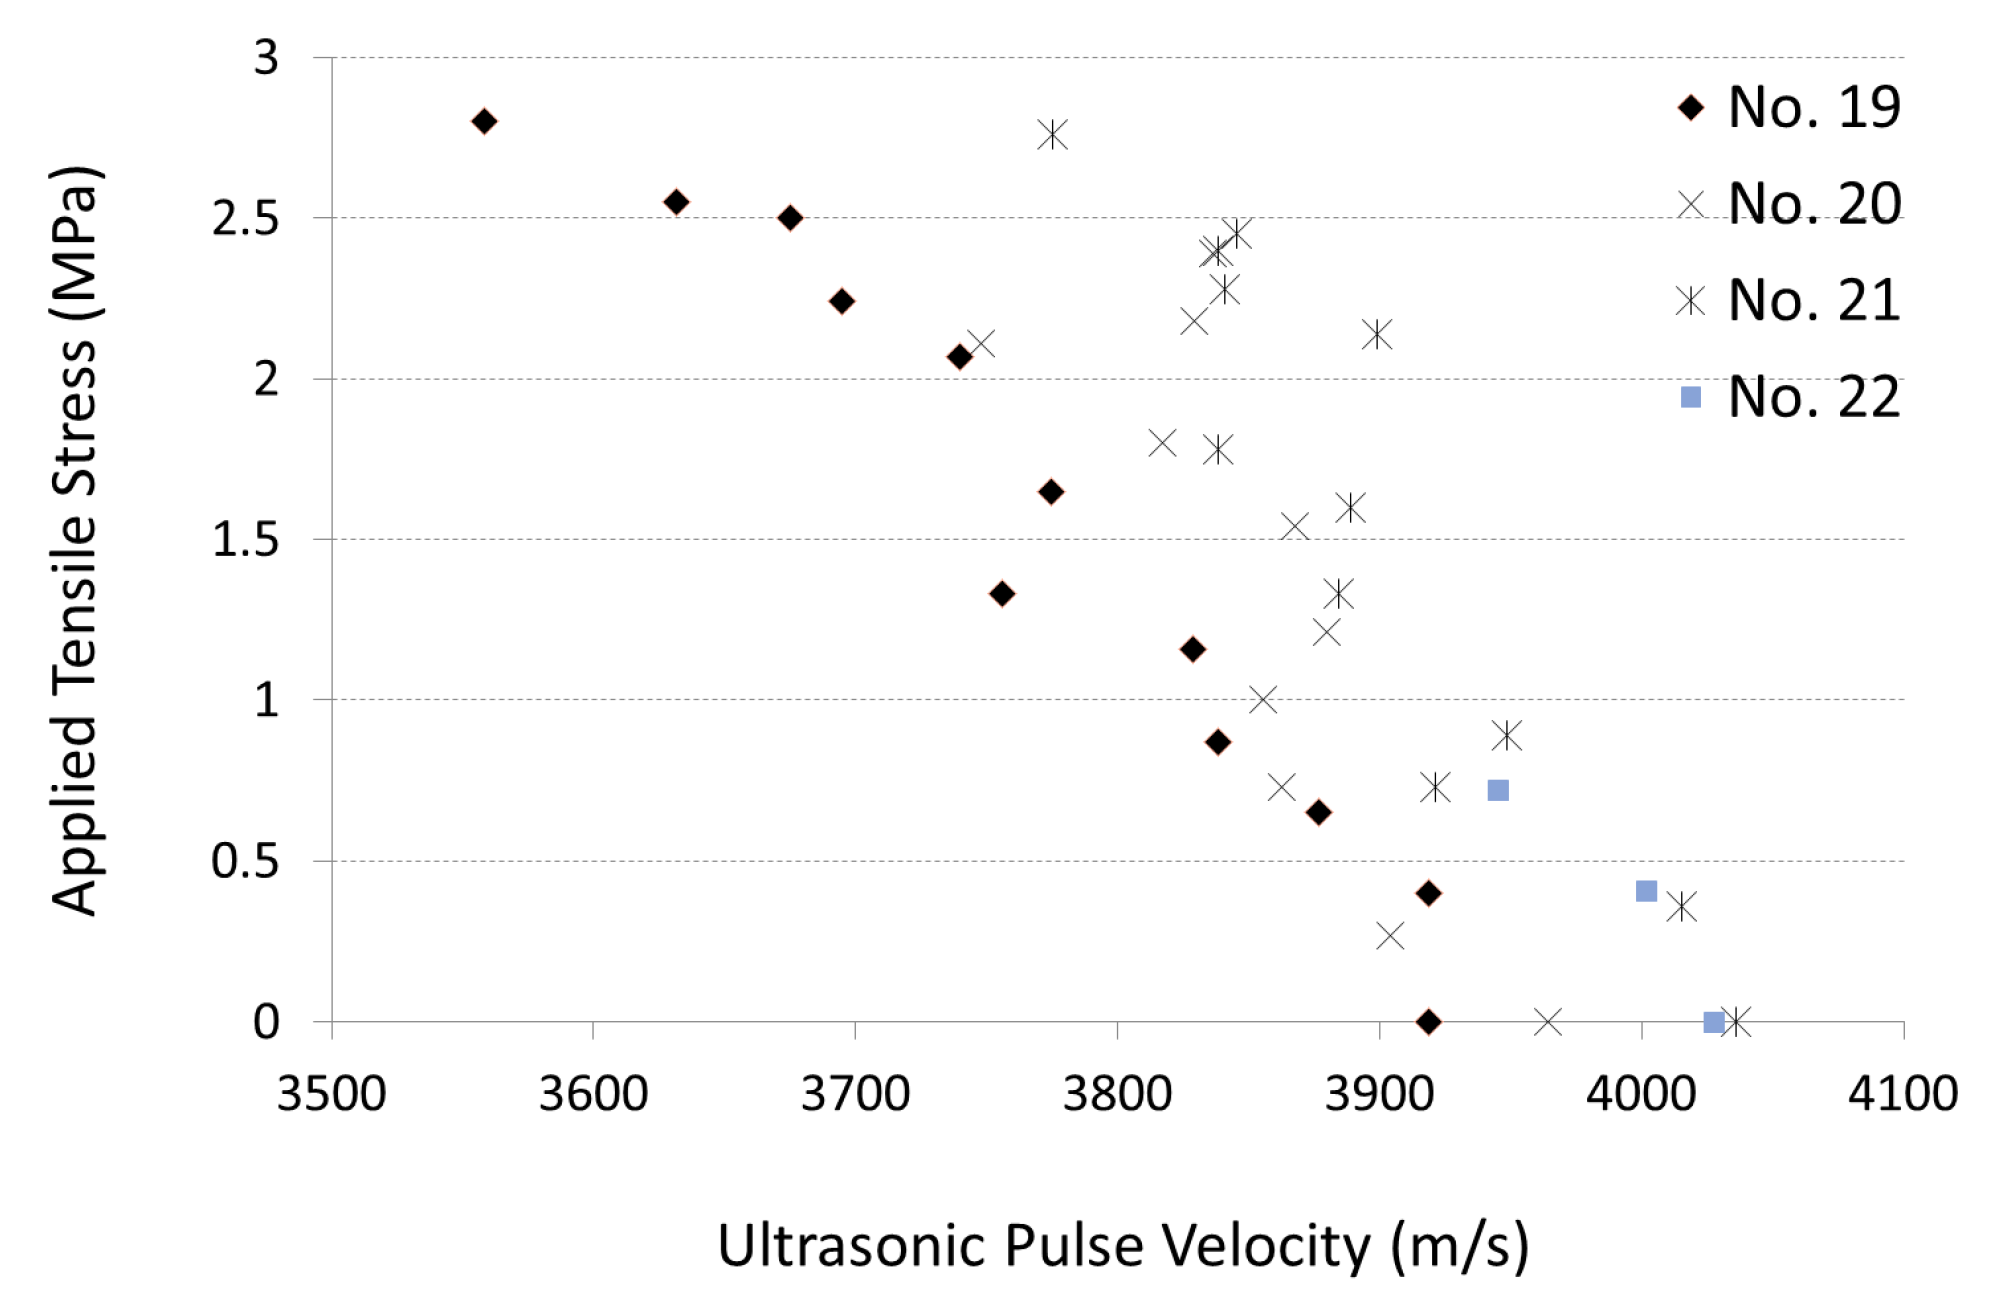
The average ultrasonic pulse velocity measurements (the mean value of three measurements) versus the applied tensile stress can be found in Figure 5, Figure 6 and Figure 7. The UPV measurements took place after the tensile force was removed. For all cases, a general downward trend is apparent from the data, indicating decreased pulse velocities associated with an increasing of the applied tensile stresses. Higher UPV measurements are indicative of an internal structure which is relatively denser (thus allowing for faster transmission of the pulse). A downward trend as seen in Figure 4, Figure 5 and Figure 6 shows that the application of a tensile stress on a concrete cylinder is affecting the internal structure so as to cause an increase in travel times and a lower UPV measurement.
4. Finite Element Modeling
ABAQUS FEA software, a commercially available finite-element analysis program, was used to model the concrete cylinder. The Concrete Damage Plasticity Model (CDPM) was used to define the parameters of the concrete—these parameters are computed using MATLAB toolbox [16].
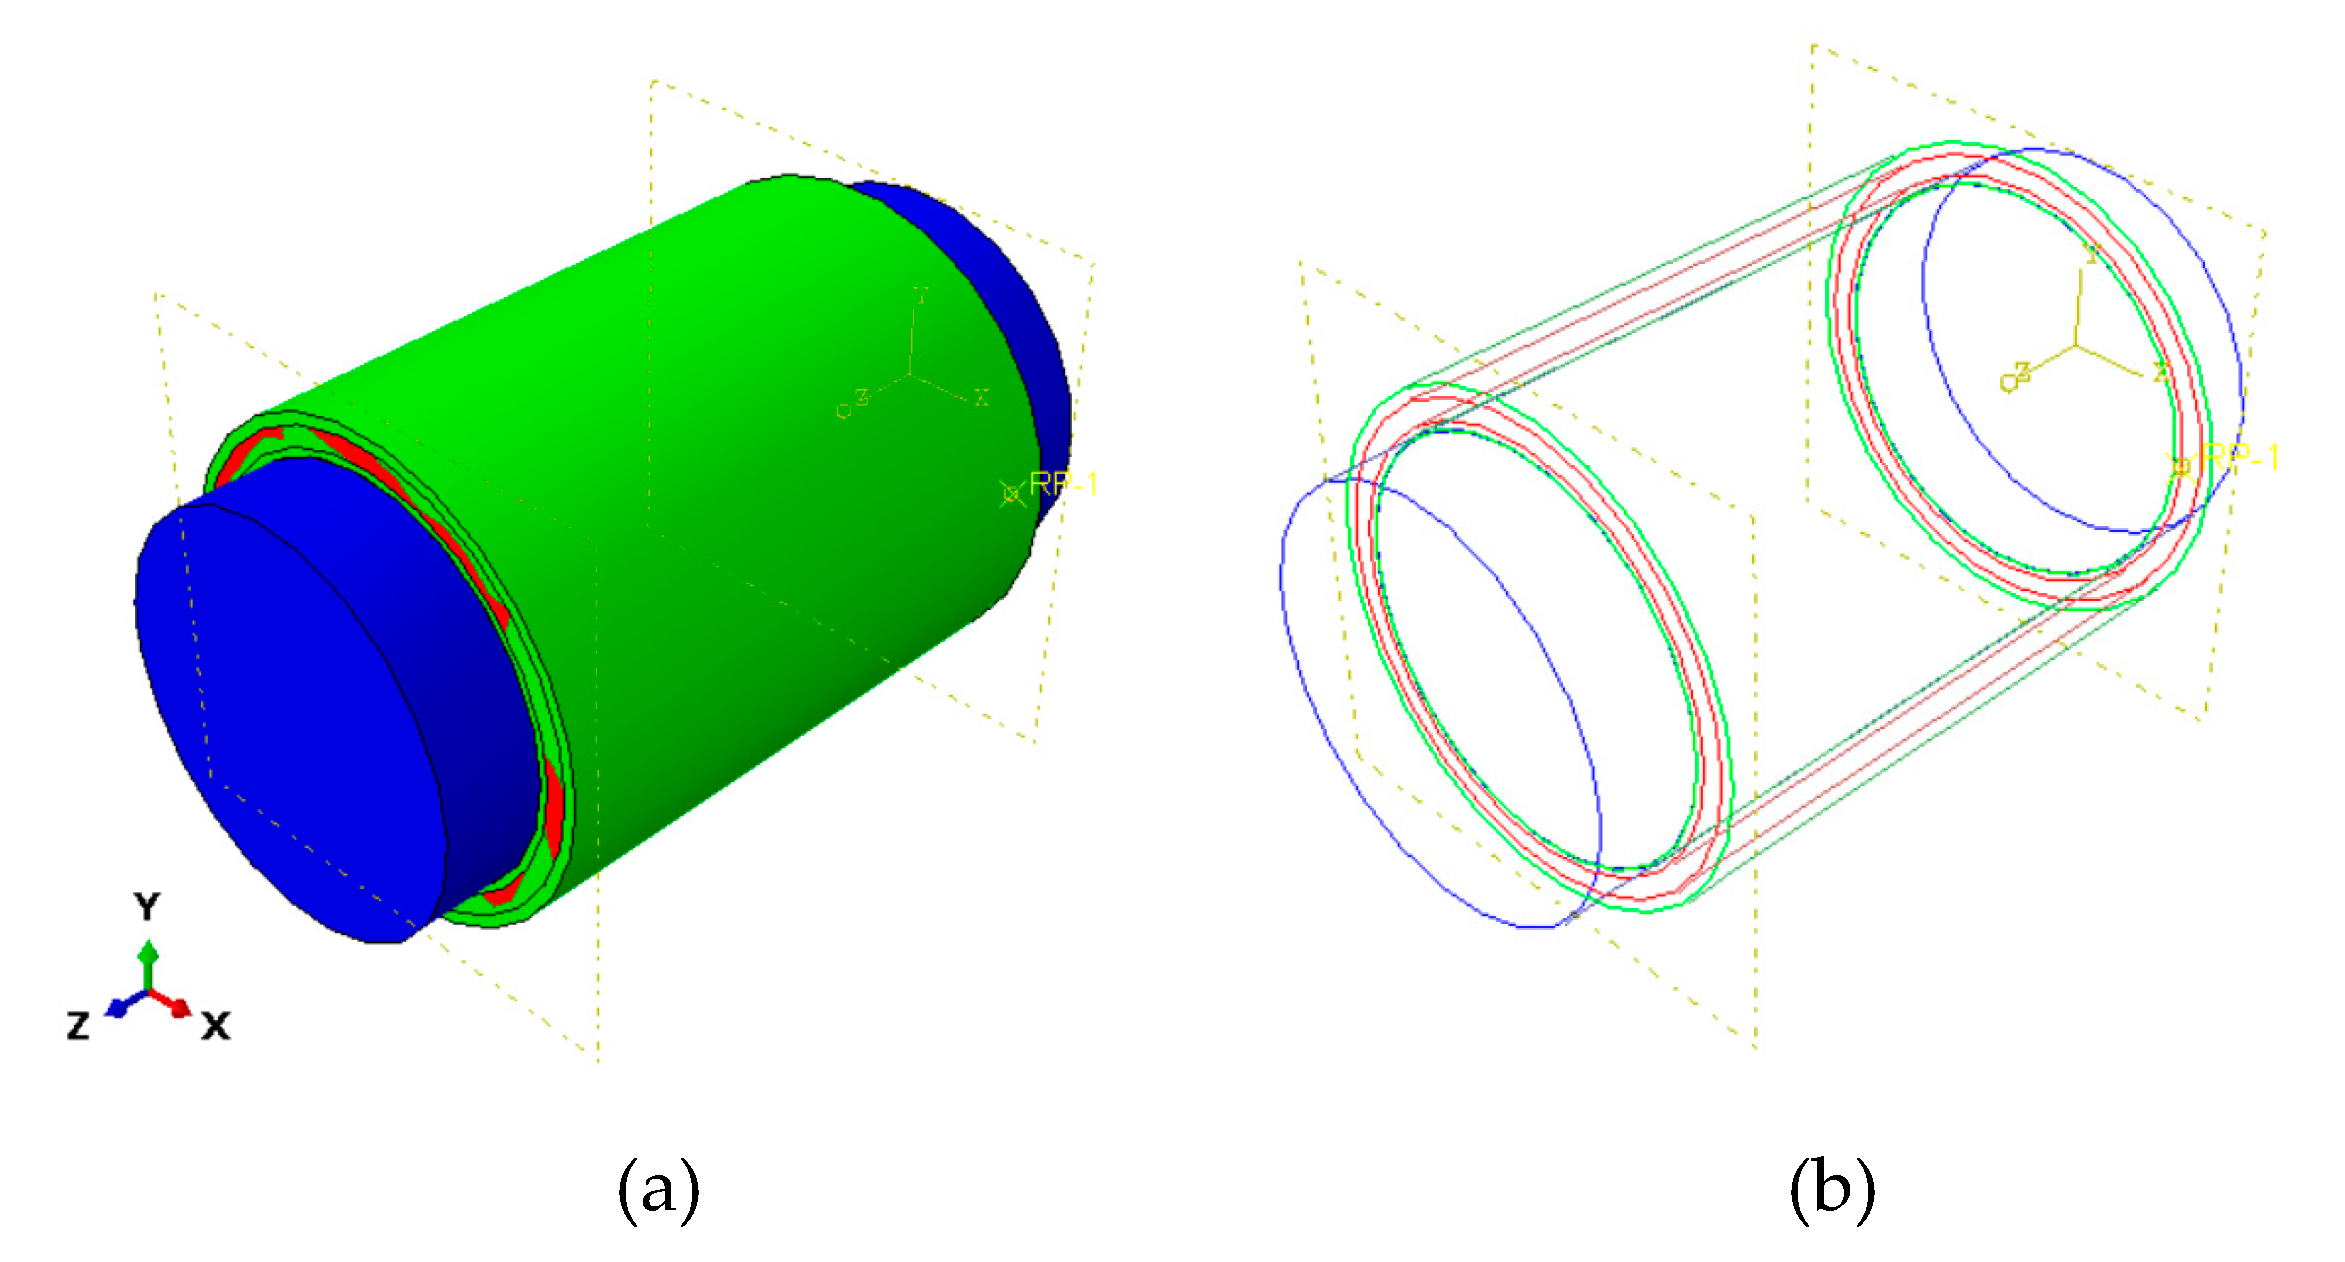
For concrete modeling, 3D 8-node Linear Isoparametric Elements with reduced integration (C3D8R) have been utilized. In order to model the gas pressure, two parts are defined; first a solid element with C3D8R features; and second the Eulerian type with EC3D8R (an 8-node linear Eulerian brick, reduced integration, hourglass control). It should be noted that the solid part covers both Eulerian and concrete cylinder. Figure 8 displays the geometry of Finite Element Modeling (FEM).
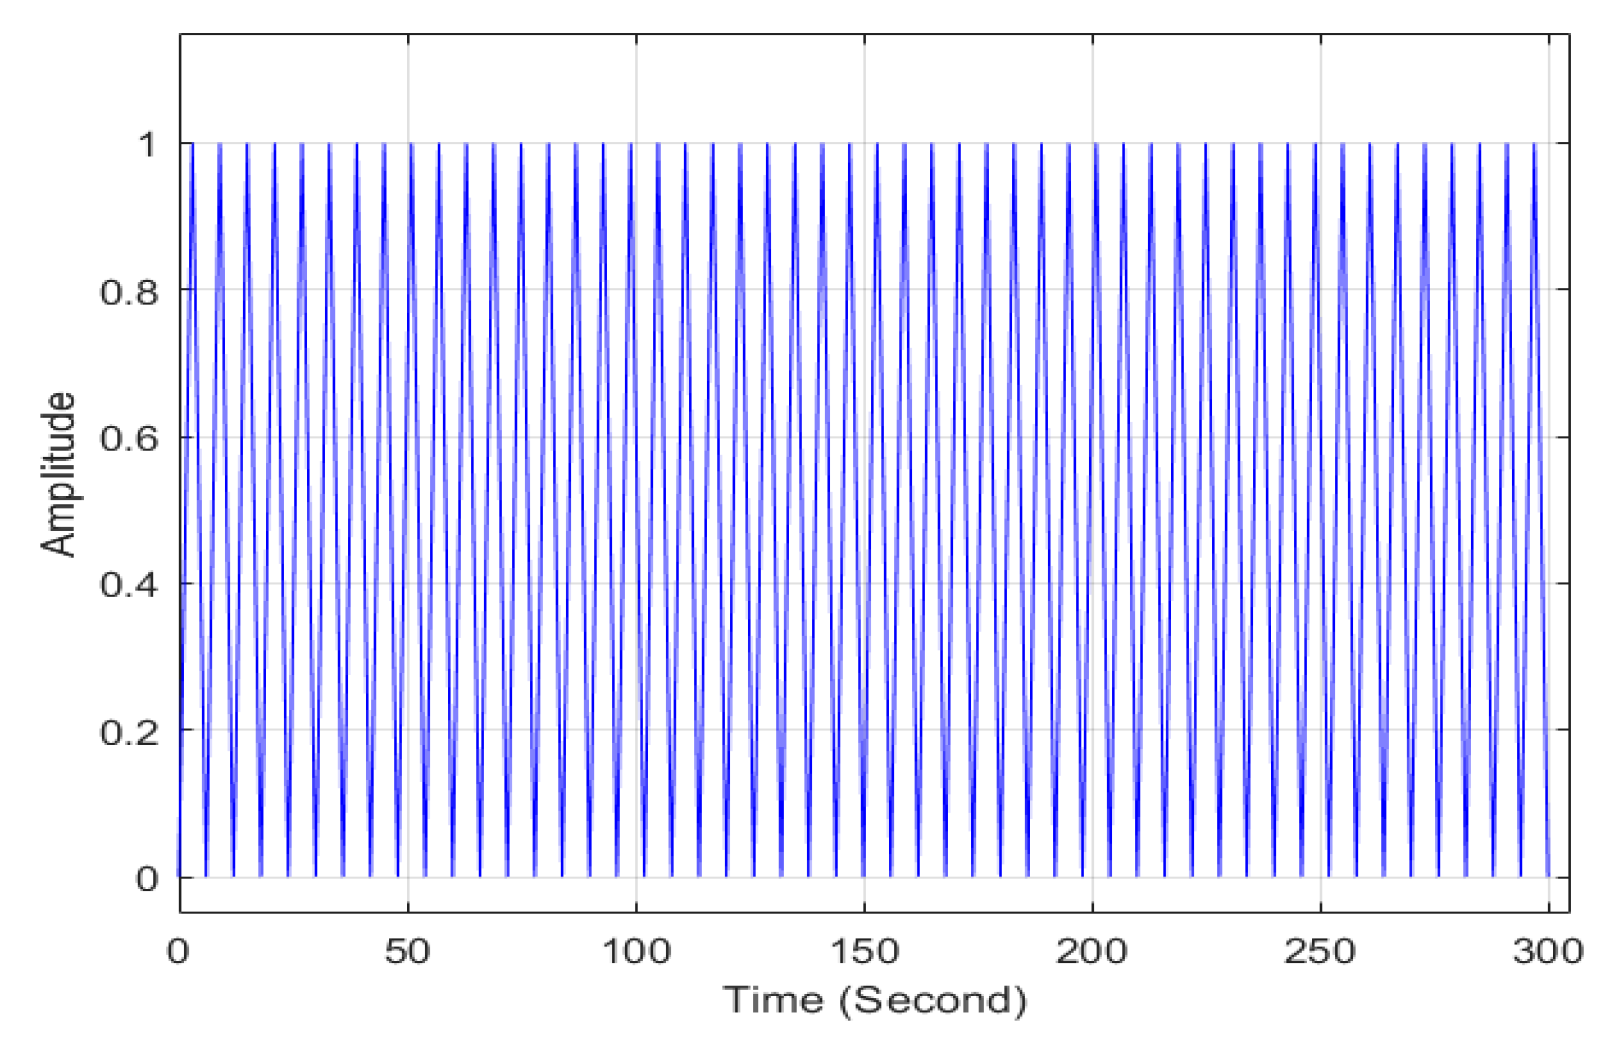
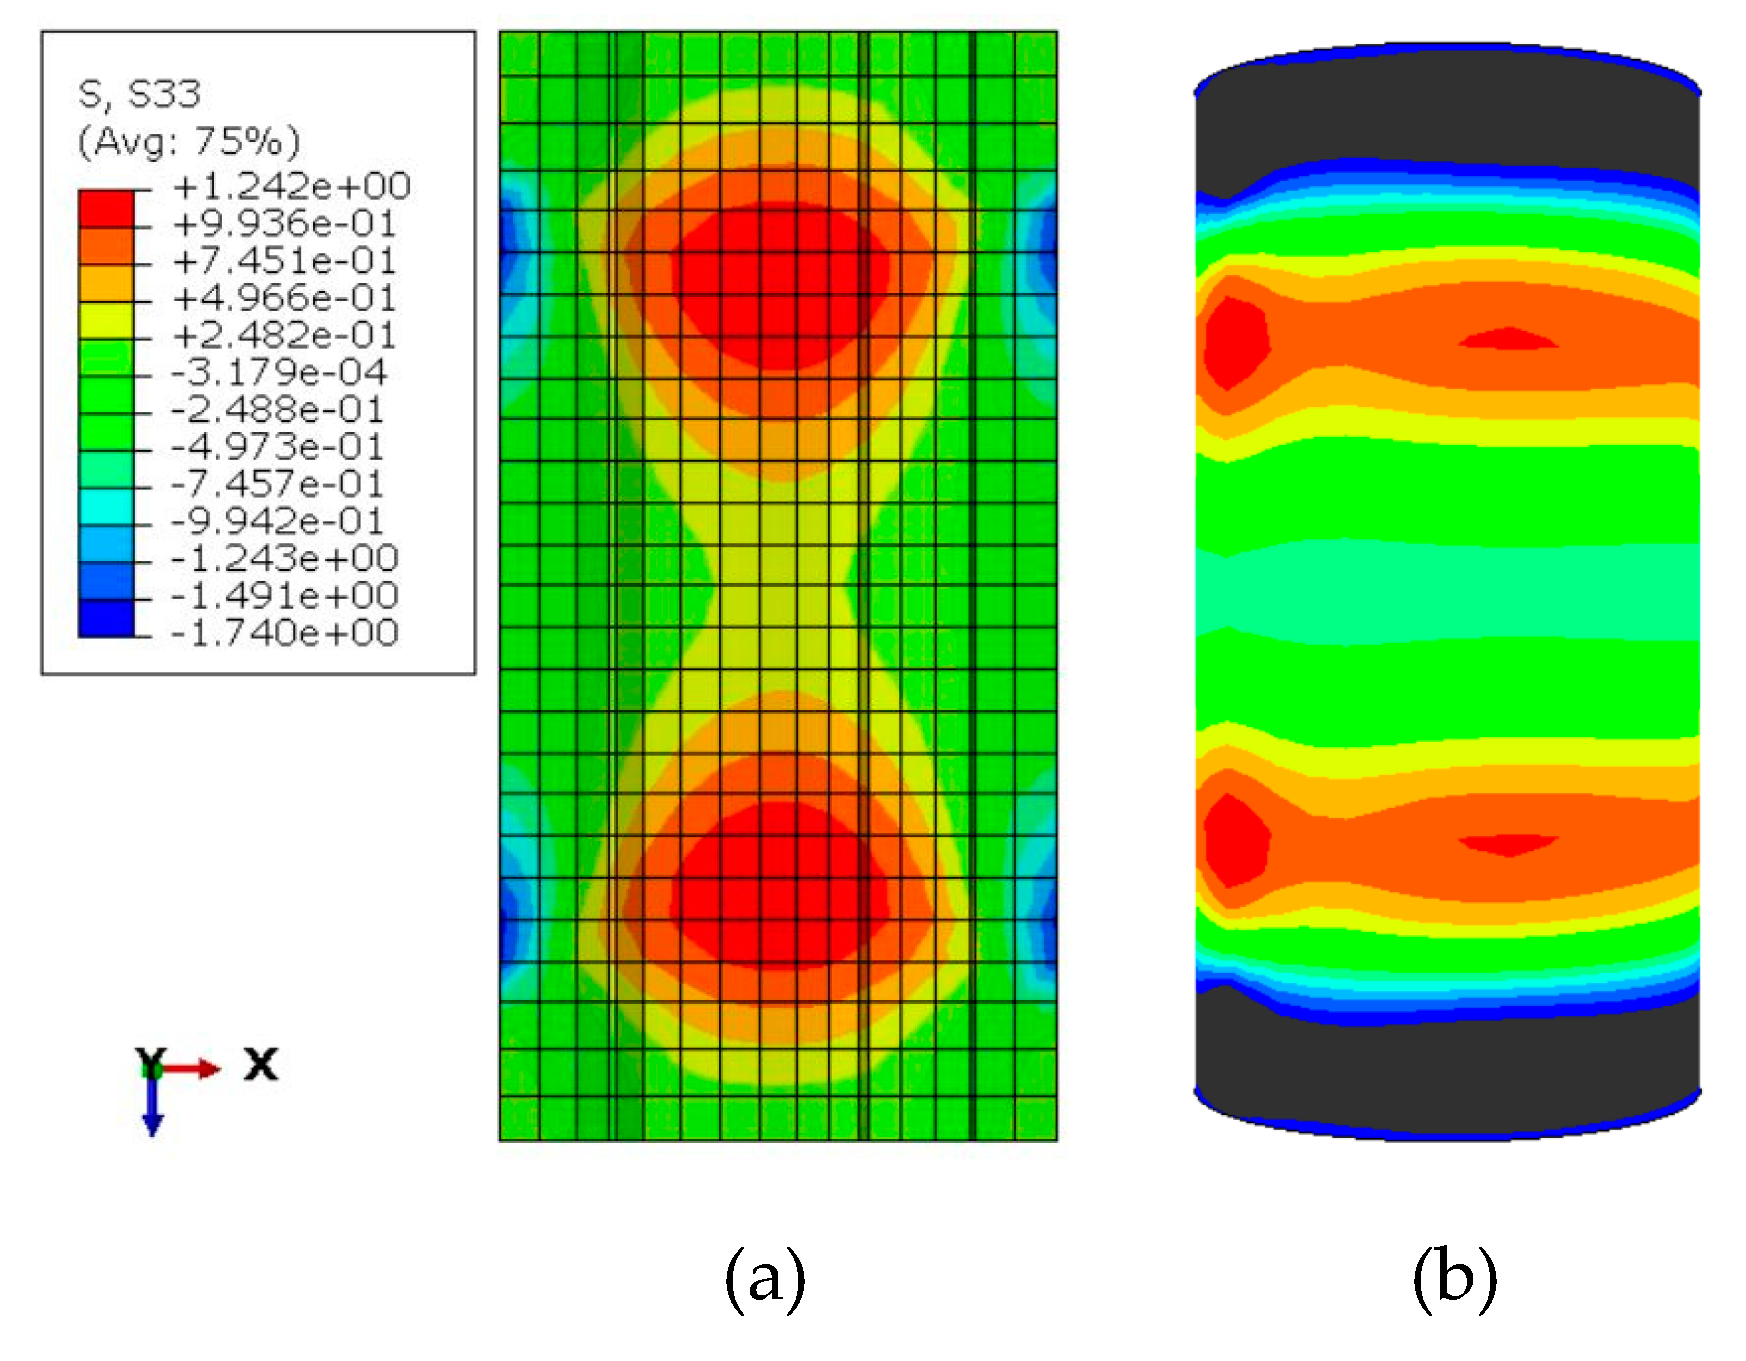
The material properties for gas pressure (Eulerian Type) is considered to be Equation of State (EOS) with the type of Ideal Gas. The gas constant and ambient pressure are 278 × 108 mJ/(tonne K) and 0.101325 MPa, respectively. Also, Non-Linear Dynamic Explicit analysis is used for simulation. The contact behavior has both Tangential (frictionless) and Normal (hard contact) behaviors. The Discrete Field was converted to Volume Fraction Tools to make Eulerian part as pressure. The initial gas pressure is applied as Predefined Stress and gravity load. Also, the cyclic pressure is assigned based on the amplitude. The amplitude is displayed in Figure 9 and the stress distribution in concrete cylinder is shown in Figure 10.
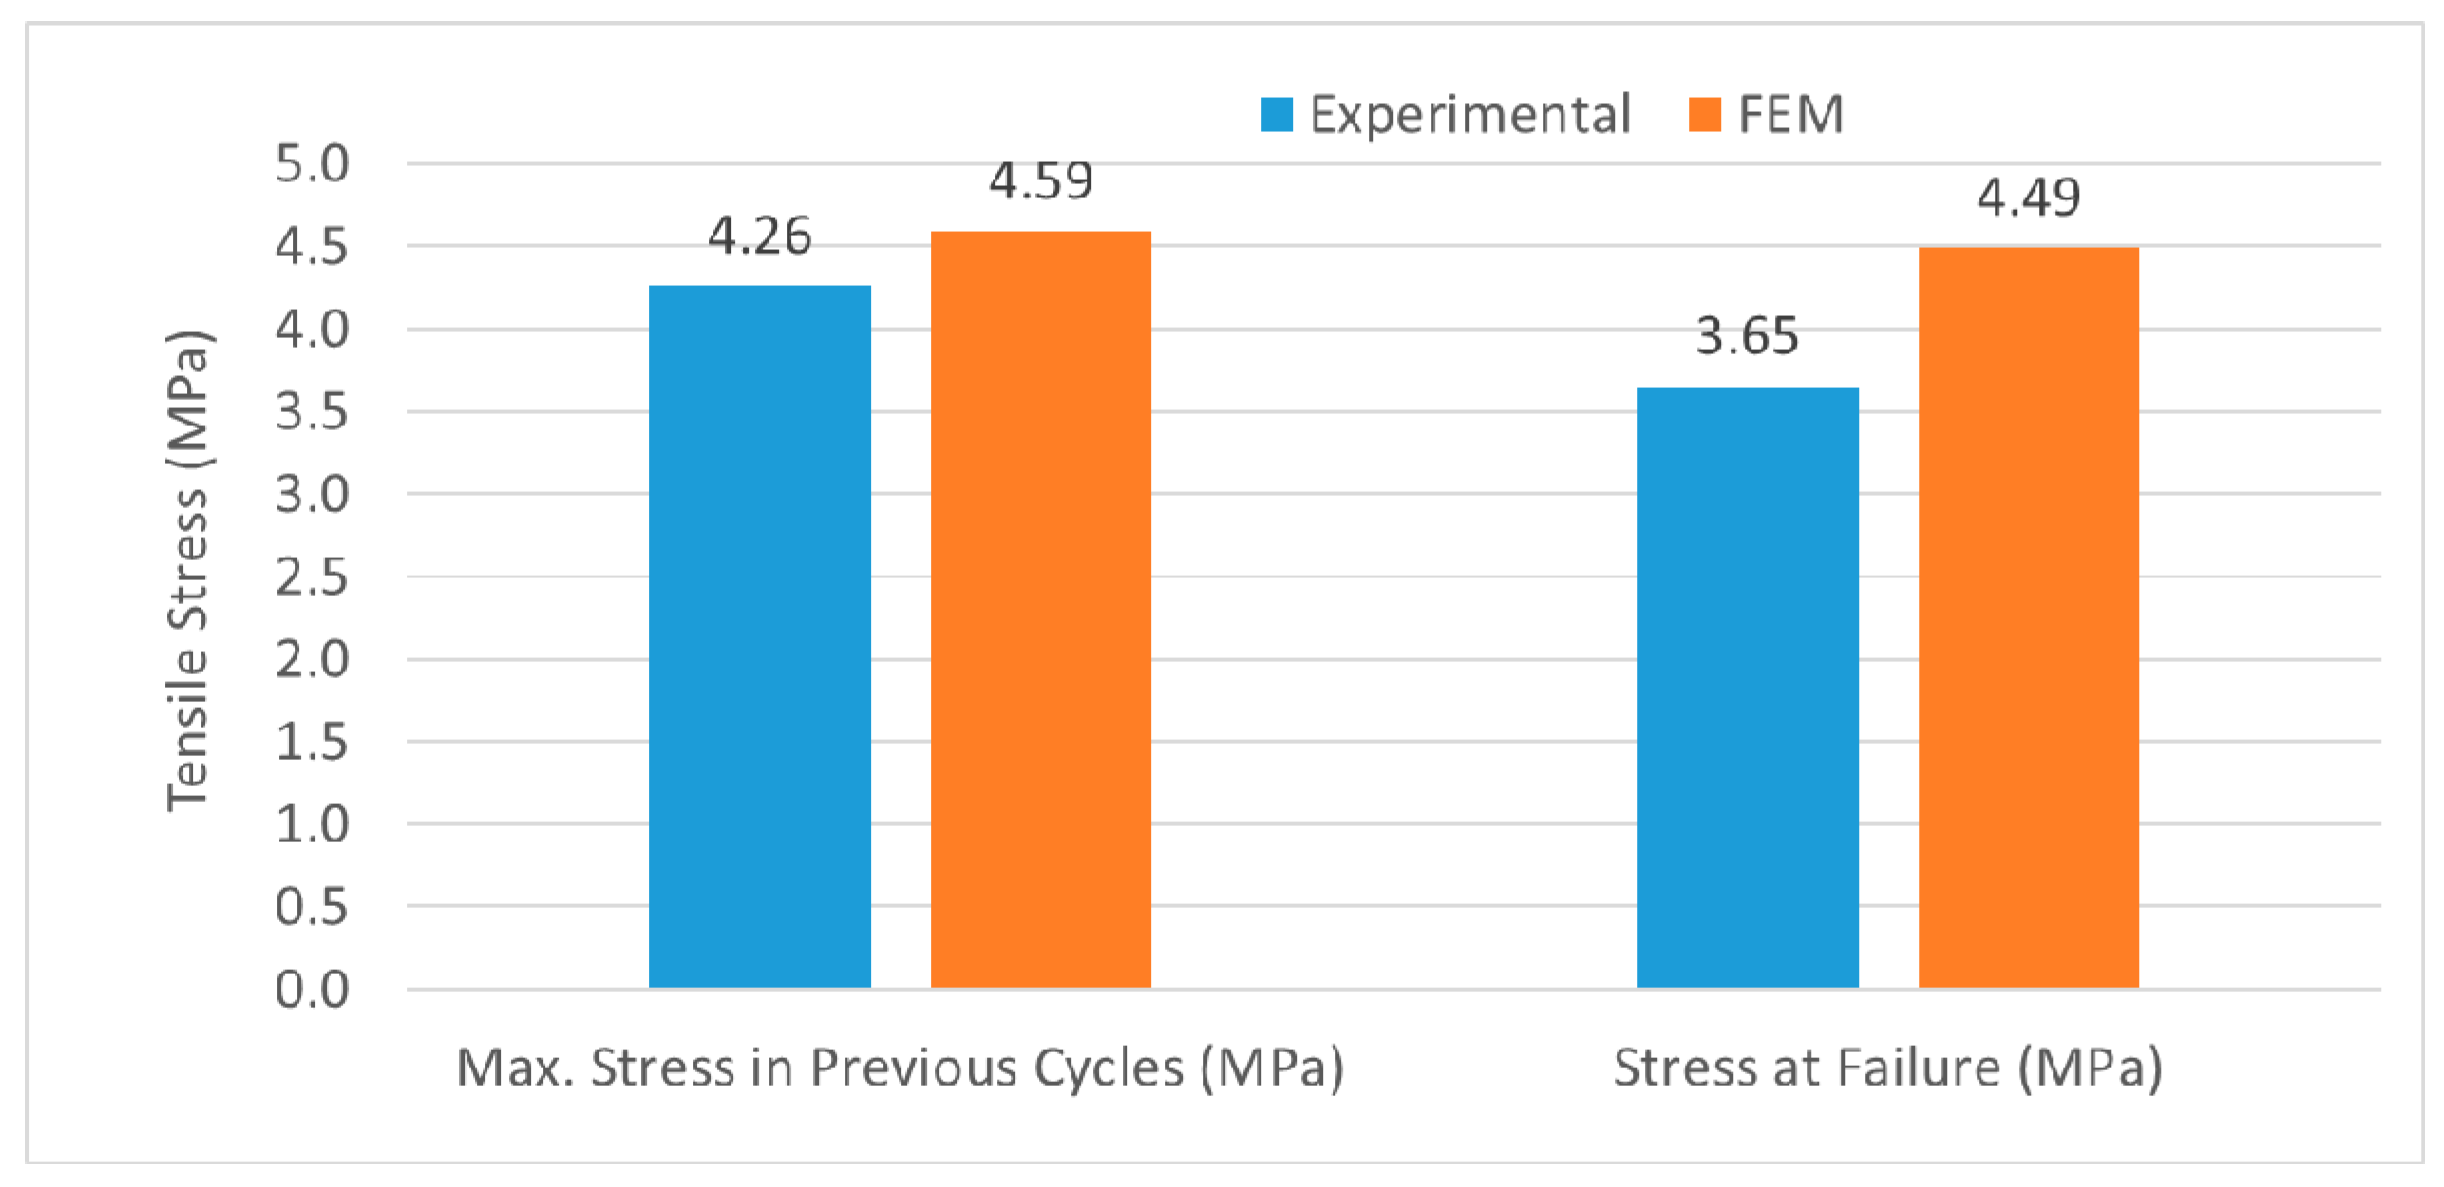
When cyclic loading was applied at low pressure, the concrete sample did not fail in tension. Then, the maximum pressure in the cyclic loading was increased step-by-step in the FEM sample until the observation of fatigue failure after few cycles to simulate the low-cycle fatigue failure. Interestingly, the FEM sample failed after 13 cycles that is very similar to the experimental result of sample 17 (Table 5). Also, the sample in FEM failed under a pressure that was lower than the maximum applied pressure in previous cycles. FEM and experimental results of specimen No. 17 are compared in Figure 11.
5. Conclusions
A total of 22 standard concrete cylinders were tested under tension using a pressure-tension apparatus. Based on the limited number of test results reported in this paper, one can conclude that the tensile strength of the dry specimens was lower than that of the wet specimens with a lower coefficient of variation in the test results. Therefore, it will be safer and more reliable to test the specimens in dry conditions.
It was shown that failure in tension due to fatigue can happen as early as the second cycle of loading if the concrete specimen has been loaded up to a high percentage of its tensile capacity (most probably more than 62% of its tensile capacity).
ABAQUS FEA software was used to model the pressure-tension test. It was shown that the failure under low-cycle tensile force can be predicted using appropriate parameters in the software. It was also found that concrete specimens subjected to a low-cycle loading protocol always fail at a lower stress level compared to the maximum value applied in the previous cycles. This was the case for both the experimental results as well as the FEM. With respect to the quantification of the effects of fatigue on the performance of concrete, comparison of the experimental and FEM results illuminates the maximum stress before failure to be 7.7% higher in FEM. Additionally, the stress at failure was 23.0% higher in FEM compared to the experimental result.
NDT was also employed to evaluate the progressive damage inflicted by tensile load in concrete using the UPV apparatus. It was shown that the application of a tensile stress on a concrete affects its internal structure and causes an increase in travel times and a lower UPV measurement. The experimental results presented in this paper prove that the UPV method can be used effectively for the detection of cracks in hardened concrete subject to tensile stresses—as low as about 0.4 MPa.
Author Contributions
S.M.S. and A.J.K.K. carried out the tests. S.M.S. and A.J.B. supervised the project. S.M.S. prepared the manuscript and analyzed the data. S.S.R. conducted the finite element analysis. All authors read and approved the final manuscript.
Funding
This research received no external funding.
Conflicts of Interest
The authors declare no conflict of interest.
References
- Clayton, N.; Grimer, F. The diphase concept, with particular reference to concrete. In Developments in Concrete Technology; Lydon, F.D., Ed.; Applied Science Publisher: Basel, Switzerland, 1979; pp. 283–317. [Google Scholar]
- Komar, A.J.K. Development of Evaluation Procedures for Evaporative Transport Based Deterioration. Ph.D. Thesis, McGill University, Montreal, QC, Canada, 2017. [Google Scholar]
- Terzaghi, K.; Peck, R.B. Soil Mechanics in Engineering Practice; Wiley: New York, NY, USA, 1967. [Google Scholar]
- Uno, T.; Fujikake, K.; Mindess, S.; Xu, H. The nitrogen gas tension test of concrete, Part 1: Effect of boundary conditions and axial strain response. Mater. Struct. 2010, 44, 857–864. [Google Scholar] [CrossRef]
- Rashidi, M.; Ashtiani, R.S.; Si, J.; Izzo, R.P.; McDaniel, M. A Practical Approach for the Estimation of Strength and Resilient Properties of Cementitious Materials. Transp. Res. Rec. J. Transp. Res. Board 2018, 2672, 152–163. [Google Scholar] [CrossRef]
- Komar, A.J.K.; Hartell, J.; Boyd, A.J. Pressure Tension Test: Reliability for Assessing Concrete Deterioration. In Proceedings of the 7th International Conference on Concrete under Severe Conditions—Environment and Loading, RILEM, Nanjing, China, 23–25 September 2013. [Google Scholar]
- ASTM International. ASTM C31/C31M-19, Standard Practice for Making and Curing Concrete Test Specimens in the Field; ASTM International: West Conshohocken, PA, USA, 2019. [Google Scholar]
- Xu, G.W.; Komar, A.J.K.; Boyd, A.J. Tensile Strength of Plain Concrete under Sustained Loading by PT Machine. Constr. Build. Mater. 2019, 209, 260–269. [Google Scholar] [CrossRef]
- Saito, M. Characteristics of microcracking in concrete under static and repeated tensile loading. Cem. Concr. Res. 1987, 17, 211–218. [Google Scholar] [CrossRef]
- Cornelissen, H.A.W. Fatigue failure of concrete in tension. Heron 1984, 29, 1–68. [Google Scholar]
- Zhang, J.; Stang, H.; Li, V.C. Experimental study on crack bridging in FRC under uniaxial fatigue tension. J. Mater. Civ. Eng. 2000, 12, 66–73. [Google Scholar] [CrossRef]
- Chen, X.; Shi, D.; Li, S.; Fan, X.; Lu, J. Influence of Loading Sequence on Low Cycle Fatigue Behavior of Normal Weight Concrete under Direct Tension. J. Test. Eval. 2019, 47, 19. [Google Scholar] [CrossRef]
- Chen, X.; Bu, J.; Fan, X.; Lu, J.; Xu, L. Effect of Loading Frequency and Stress Level on Low Cycle Fatigue Behavior of Plain Concrete in Direct Tension. Constr. Build. Mater. 2017, 133, 367–375. [Google Scholar] [CrossRef]
- Isojeh, B.; El-Zeghayar, M.; Vecchio, F.J. Fatigue Behavior of Steel Fiber Concrete in Direct Tension. J. Mater. Civ. Eng. 2017, 29, 4017130. [Google Scholar] [CrossRef]
- Zhao, D.; Gao, H.; Liu, H.; Jia, P.; Yang, J. Fatigue Properties of Plain Concrete under Triaxial Tension-Compression-Compression Cyclic Loading. Shock Vib. 2017, 2017, 1–10. [Google Scholar] [CrossRef]
- Sayyar Roudsari, S.; Hamoush, S.A.; Soleimani, S.M.; Madandoust, R. Evaluation of large-size reinforced concrete columns strengthened for axial load using fiber reinforced polymers. Eng. Struct. 2019, 178, 680–693. [Google Scholar] [CrossRef]
Figure 1.
(a) Photograph of pressure-tension testing machine; (b) Exploded view of the pressure-tension apparatus with concrete cylinder in machine; (c) Cross section of pressure-tension apparatus and concrete cylinder [2].
Figure 1.
(a) Photograph of pressure-tension testing machine; (b) Exploded view of the pressure-tension apparatus with concrete cylinder in machine; (c) Cross section of pressure-tension apparatus and concrete cylinder [2].

Figure 2.
Pressure tension effect [2].
Figure 2.
Pressure tension effect [2].

Figure 3.
Broken specimen under tension using pressure-tension apparatus: (a) Elevation view; (b) Cross-sectional view.
Figure 3.
Broken specimen under tension using pressure-tension apparatus: (a) Elevation view; (b) Cross-sectional view.

Figure 4.
Cyclic loading on specimen No. 19 (failed during the 6th cycle).

Figure 5.
Ultrasonic Pulse Velocity (UPV) (m/s) vs. applied tensile stress (MPa) for Specimens No. 9 to No. 14.
Figure 5.
Ultrasonic Pulse Velocity (UPV) (m/s) vs. applied tensile stress (MPa) for Specimens No. 9 to No. 14.

Figure 6.
UPV (m/s) vs. applied tensile stress (MPa) for Specimens No. 15 to No. 18.

Figure 7.
UPV (m/s) vs. applied tensile stress (MPa) for Specimens No. 19 to No. 22.

Figure 8.
Geometrical feature of the Finite Element Modeling (FEM): (a) Solid volume representation; (b) Outline representation.
Figure 8.
Geometrical feature of the Finite Element Modeling (FEM): (a) Solid volume representation; (b) Outline representation.

Figure 9.
Time vs. amplitude graph.

Figure 10.
Stress distribution in the FEM: (a) Longitudinal section; (b) Volumetric view.

Figure 11.
Comparison between FEM and experimental results for Specimen No. 17.


Table 1.
Mix design of the concrete specimens for this study (water-to-cement ratio = 0.45).
| Component | Amount | Unit |
|---|---|---|
| Water | 15.866 | kg |
| Cement | 29.282 | kg |
| Coarse aggregates | 72.872 | kg |
| Fine aggregates | 79.093 | kg |
| Superplasticizer | 0.146 | Liter |
Table 2.
Tensile strength of concrete exposed to ambient conditions for two years.
| Specimen No. | Condition | Ultimate Tensile Strength (MPa) | Average (MPa) | Standard Deviation (MPa) | Coefficient of Variation (%) |
|---|---|---|---|---|---|
| 1 | Dry | 2.90 | 3.02 | 0.16 | 5.39 |
| 2 | Dry | 3.13 | |||
| 3 | Wet | 3.83 | 4.45 | 0.76 | 17.15 |
| 4 | Wet | 4.33 | |||
| 5 | Wet | 4.08 | |||
| 6 | Wet | 5.55 |
Table 3.
Cyclic load results for specimens 7 and 8.
| Specimen No. | Condition | Failed during the Load Cycle No. | Max. Tensile Stress Applied in Previous Cycles (MPa) | Stress at Failure (MPa) |
|---|---|---|---|---|
| 7 | Wet | 2 | 3.43 | 3.23 |
| 8 | Wet | 12 | 3.13 | 3.03 |
Table 4.
Cyclic load results for specimens 9 to 14.
| Specimen No. | Condition | Max. Tensile Stress Applied in a Cyclic Loading of 100 Cycles (MPa) [A] | Stress at Failure (MPa) [B] | [A]/[B] |
|---|---|---|---|---|
| 9 | Wet | 2.23 | 5.37 | 0.42 |
| 10 | Wet | 2.67 | 4.34 | 0.62 |
| 11 | Wet | 2.72 | 4.89 | 0.56 |
| 12 | Wet | 2.83 | 4.74 | 0.60 |
| 13 | Wet | 2.88 | 5.62 | 0.51 |
| 14 | Wet | 3.01 | 6.05 | 0.50 |
Table 5.
Cyclic load results for specimens 15 to 18.
| Specimen No. | Condition | Failed during the Load Cycle No. | Max. Tensile Stress Applied in Previous Cycles (MPa) | Stress at Failure (MPa) |
|---|---|---|---|---|
| 15 | Wet | 2 | 4.20 | 4.15 |
| 16 | Wet | 2 | 4.42 | 4.40 |
| 17 | Wet | 14 | 4.59 | 4.49 |
| 18 | Wet | 3 | 4.87 | 4.10 |
Table 6.
Cyclic load results for specimens 19 to 22.
| Specimen No. | Condition | Failed during the Load Cycle No. | Max. Tensile Stress Applied in Previous Cycles (MPa) | Stress at Failure (MPa) |
|---|---|---|---|---|
| 19 | Dry | 6 | 3.11 | 2.90 |
| 20 | Dry | 3 | 2.39 | 2.23 |
| 21 | Dry | 5 | 2.96 | 2.80 |
| 22 | Dry | 4 | 2.85 | 2.72 |
© 2019 by the authors. Licensee MDPI, Basel, Switzerland. This article is an open access article distributed under the terms and conditions of the Creative Commons Attribution (CC BY) license (http://creativecommons.org/licenses/by/4.0/).
Share and Cite
MDPI and ACS Style
Soleimani, S.M.; Boyd, A.J.; Komar, A.J.K.; Roudsari, S.S. Fatigue in Concrete under Low-Cycle Tensile Loading Using a Pressure-Tension Apparatus. Appl. Sci. 2019, 9, 3217. https://doi.org/10.3390/app9163217
AMA Style
Soleimani SM, Boyd AJ, Komar AJK, Roudsari SS. Fatigue in Concrete under Low-Cycle Tensile Loading Using a Pressure-Tension Apparatus. Applied Sciences. 2019; 9(16):3217. https://doi.org/10.3390/app9163217
Chicago/Turabian StyleSoleimani, Sayed M., Andrew J. Boyd, Andrew J.K. Komar, and Sajjad S. Roudsari. 2019. "Fatigue in Concrete under Low-Cycle Tensile Loading Using a Pressure-Tension Apparatus" Applied Sciences 9, no. 16: 3217. https://doi.org/10.3390/app9163217
Note that from the first issue of 2016, this journal uses article numbers instead of page numbers. See further details here.