Multivariate Statistical Analysis of Surface Enhanced Raman Spectra of Human Serum for Alzheimer’s Disease Diagnosis


Abstract
:Featured Application
Abstract
1. Introduction
2. Materials and Methods
2.1. Chemicals
2.2. Human Blood Serum Samples
2.3. Colloidal Silver Nanoparticles (AgNPs)
2.4. Sample Preparation
2.5. Spectroscopic Measurements
2.6. Data Treatment
2.7. Genetic Algorithm
2.8. Artificial Neural Networks
3. Results and Discussion
4. Conclusions
Supplementary Materials
Author Contributions
Funding
Conflicts of Interest
References
- Farlow, M.R. Etiology and pathogenesis of Alzheimer’s disease. Am. J. Health Pharm. 1998, 55, S5–S10. [Google Scholar] [CrossRef] [PubMed]
- Zellner, M.; Veitinger, M.; Umlauf, E. The role of proteomics in dementia and Alzheimer’s disease. Acta Neuropathol. 2009, 118, 181–195. [Google Scholar] [CrossRef] [PubMed]
- Irizarry, M.C. Biomarkers of Alzheimer disease in plasma. NeuroRX 2004, 1, 226–234. [Google Scholar] [CrossRef] [PubMed]
- Doecke, J.D.; Laws, S.M.; Faux, N.G.; Wilson, W.; Burnham, S.C.; Lam, C.P.; Mondal, A.; Bedo, J.; Bush, A.I.; Brown, B.; et al. Blood-based protein biomarkers for diagnosis of Alzheimer disease. Arch. Neurol. 2012, 69, 1318–1325. [Google Scholar] [CrossRef] [PubMed]
- Teunissen, C.E.; Lutjohann, D.; von Bergmann, K.; Verhey, F.; Vreeling, F.; Wauters, A.; Bosmans, E.; Bosma, H.; van Boxtel, M.P.; Maes, M.; et al. Combination of serum markers related to several mechanisms in Alzheimer’s disease. Neurobiol. Aging 2003, 24, 893–902. [Google Scholar] [CrossRef]
- Blennow, K.; Hampel, H.; Weiner, M.; Zetterberg, H. Cerebrospinal fluid and plasma biomarkers in Alzheimer disease. Nat. Rev. Neurol. 2010, 6, 131–144. [Google Scholar] [CrossRef] [PubMed]
- Rosén, C.; Hansson, O.; Blennow, K.; Zetterberg, H. Fluid biomarkers in Alzheimer’s disease—Current concepts. Mol. Neurodegener. 2013, 8, 20. [Google Scholar] [CrossRef]
- Britschgi, M.; Wyss-Coray, T. Blood Protein Signature for the Early Diagnosis of Alzheimer Disease. Arch. Neurol. 2009, 66, 161. [Google Scholar] [CrossRef]
- Mapstone, M.; Cheema, A.K.; Fiandaca, M.S.; Zhong, X.; Mhyre, T.R.; MacArthur, L.H.; Hall, W.J.; Fisher, S.G.; Peterson, D.R.; Haley, J.M.; et al. Plasma phospholipids identify antecedent memory impairment in older adults. Nat. Med. 2014, 20, 415–418. [Google Scholar] [CrossRef]
- Burns, D.H.; Rosendahl, S.; Bandilla, D.; Maes, O.C.; Chertkow, H.M.; Schipper, H.M. Near-infrared spectroscopy of blood plasma for diagnosis of sporadic Alzheimer’s disease. J. Alzheimer’s Dis. 2009, 17, 391–397. [Google Scholar] [CrossRef]
- Lee, K.S.; Chung, J.H.; Lee, K.H.; Shin, M.J.; Oh, B.H.; Hong, C.H. Bioplex analysis of plasma cytokines in Alzheimer’s disease and mild cognitive impairment. Immunol. Lett. 2008, 121, 105–109. [Google Scholar] [CrossRef] [PubMed]
- Tu, Q.; Chang, C. Diagnostic applications of Raman spectroscopy. Nanomedicine 2012, 8, 545–558. [Google Scholar] [CrossRef] [PubMed]
- Krafft, C. Bioanalytical applications of Raman spectroscopy. Anal. Bioanal. Chem. 2004, 378, 60–62. [Google Scholar] [CrossRef] [PubMed]
- Baena, J.R.; Lendl, B. Raman spectroscopy in chemical bioanalysis. Curr. Opin. Chem. Biol. 2004, 8, 534–539. [Google Scholar] [CrossRef] [PubMed]
- Manoharan, R.; Wang, Y.; Feld, M.S. Histochemical analysis of biological tissues using Raman spectroscopy. Spectrochim. Acta Part A Mol. Biomol. Spectrosc. 1996, 52, 215–249. [Google Scholar] [CrossRef]
- Sikirzhytski, V.; Sikirzhytskaya, A.; Lednev, I.K. Multidimensional Raman Spectroscopic Signatures as a Tool for Forensic Identification of Body Fluid Traces: A Review. Appl. Spectrosc. 2011, 65, 1223–1232. [Google Scholar] [CrossRef] [PubMed]
- Koo, T.W.; Berger, A.J.; Itzkan, I.; Horowitz, G.; Feld, M.S. Reagentless Blood Analysis by Near-Infrared Raman Spectroscopy. Diabetes Technol. Ther. 1999, 1, 153–157. [Google Scholar] [CrossRef]
- McLaughlin, G.; Doty, K.C.; Lednev, I.K. Raman spectroscopy of blood for species identification. Anal. Chem. 2014, 86, 11628–11633. [Google Scholar] [CrossRef]
- Sikirzhytski, V.; Sikirzhytskaya, A.; Lednev, I.K. Multidimensional Raman spectroscopic signature of sweat and its potential application to forensic body fluid identification. Anal. Chim. Acta 2012, 718, 78–83. [Google Scholar] [CrossRef]
- Pichardo-Molina, J.L.; Frausto-Reyes, C.; Barbosa-Garcí, O.; Huerta-Franco, R.; González-Trujillo, J.L.; Ramírez-Alvarado, C.A.; Gutiérrez-Juárez, G.; Medina-Gutiérrez, C. Raman spectroscopy and multivariate analysis of serum samples from breast cancer patients. Lasers Med. Sci. 2007, 22, 229–236. [Google Scholar] [CrossRef]
- Ralbovsky, N.M.; Lednev, I.K. Raman spectroscopy and chemometrics: A potential universal method for diagnosing cancer. Spectrochim. Acta Part A Mol. Biomol. Spectrosc. 2019, 219, 463–487. [Google Scholar] [CrossRef] [PubMed]
- Bispo, J.A.M.; Vieira, E.E.D.S.; Silveira, J.L.; Fernandes, A.B. Correlating the amount of urea, creatinine, and glucose in urine from patients with diabetes mellitus and hypertension with the risk of developing renal lesions by means of Raman spectroscopy and principal component analysis. J. Biomed. Opt. 2013, 18, 087004. [Google Scholar] [CrossRef] [PubMed]
- Han, H.W.; Yan, X.L.; Dong, R.X.; Ban, G.; Li, K. Analysis of serum from type II diabetes mellitus and diabetic complication using surface-enhanced Raman spectra (SERS). Appl. Phys. B 2009, 94, 667–672. [Google Scholar] [CrossRef]
- Basar, G.; Parlatan, U.; Seninak, S.; Gunel, T.; Benian, A.; Kalelioglu, I. Investigation of Preeclampsia Using Raman Spectroscopy. Spectrosc. Int. J. 2012, 27, 239–252. [Google Scholar] [CrossRef] [Green Version]
- Lattermann, A.; Matthäus, C.; Bergner, N.; Beleites, C.; Romeike, B.F.; Krafft, C.; Brehm, B.R.; Popp, J. Characterization of atherosclerotic plaque depositions by Raman and FTIR imaging. J. Biophotonics 2013, 6, 110–121. [Google Scholar] [CrossRef]
- Carmona, P.; Molina, M.; Calero, M.; Bermejo-Pareja, F.; Martínez-Martín, P.; Toledano, A. Discrimination Analysis of Blood Plasma Associated with Alzheimer’s Disease Using Vibrational Spectroscopy. J. Alzheimer’s Dis. 2013, 34, 911–920. [Google Scholar] [CrossRef] [PubMed]
- Ryzhikova, E.; Kazakov, O.; Halamkova, L.; Celmins, D.; Malone, P.; Molho, E.; Zimmerman, E.A.; Lednev, I.K. Raman spectroscopy of blood serum for Alzheimer’s disease diagnostics: Specificity relative to other types of dementia. J. Biophotonics 2015, 8, 584–596. [Google Scholar] [CrossRef]
- Ralbovsky, N.M.; Lednev, I.K. Raman hyperspectroscopy shows promise for diagnosis of Alzheimer’s. Biophotonics 2018, 4, 33–37. [Google Scholar]
- Schipper, H.M.; Kwok, C.S.; Rosendahl, S.M.; Bandilla, D.; Maes, O.; Melmed, C.; Rabinovitch, D.; Burns, D.H. Spectroscopy of human plasma for diagnosis of idiopathic Parkinson’s disease. Biomark. Med. 2008, 2, 229–238. [Google Scholar] [CrossRef]
- Henry, M.S.; Passmore, A.P.; Todd, S.; McGuinness, B.; Craig, D.; Johnston, J.A. The development of effective biomarkers for Alzheimer’s disease: A review. Int. J. Geriatr. Psychiatry 2013, 28, 331–340. [Google Scholar] [CrossRef]
- Krafft, C.; Steiner, G.; Beleites, C.; Salzer, R. Disease recognition by infrared and Raman spectroscopy. J. Biophotonics 2009, 2, 13–28. [Google Scholar] [CrossRef] [PubMed]
- Monien, B.H.; Apostolova, L.G.; Bitan, G. Early diagnostics and therapeutics for Alzheimer’s disease—How early can we get there? Expert Rev. Neurother. 2006, 6, 1293–1306. [Google Scholar] [CrossRef] [PubMed]
- Das, R.S.; Agrawal, Y.K. Raman spectroscopy: Recent advancements, techniques and applications. Vib. Spectrosc. 2011, 57, 163–176. [Google Scholar] [CrossRef]
- Larmour, I.A.; Graham, D. Surface enhanced optical spectroscopies for bioanalysis. Analyst 2011, 136, 3831–3853. [Google Scholar] [CrossRef] [PubMed]
- Negri, P.; Dluhy, R.A. Ag nanorod based surface-enhanced Raman spectroscopy applied to bioanalytical sensing. J. Biophotonics 2013, 6, 20–35. [Google Scholar] [CrossRef]
- Wabuyele, M.B.; Vo-Dinh, T. Detection of Human Immunodeficiency Virus Type 1 DNA Sequence Using Plasmonics Nanoprobes. Anal. Chem. 2005, 77, 7810–7815. [Google Scholar] [CrossRef] [PubMed]
- Bonifacio, A.; Dalla Marta, S.; Spizzo, R.; Cervo, S.; Steffan, A.; Colombatti, A.; Sergo, V. Surface-enhanced Raman spectroscopy of blood plasma and serum using Ag and Au nanoparticles: A systematic study. Anal. Bioanal. Chem. 2014, 406, 2355–2365. [Google Scholar] [CrossRef]
- Feng, S.; Chen, R.; Lin, J.; Pan, J.; Chen, G.; Li, Y.; Cheng, M.; Huang, Z.; Chen, J.; Zeng, H. Nasopharyngeal cancer detection based on blood plasma surface-enhanced Raman spectroscopy and multivariate analysis. Biosens. Bioelectron. 2010, 25, 2414–2419. [Google Scholar] [CrossRef]
- Feng, S.; Pan, J.; Wu, Y.; Lin, D.; Chen, Y.; Xi, G.; Lin, J.; Chen, R. Study on gastric cancer blood plasma based on surface-enhanced Raman spectroscopy combined with multivariate analysis. Sci. China Life Sci. 2011, 54, 828–834. [Google Scholar] [CrossRef] [Green Version]
- Solomon, P.R.; Murphy, C.A. Early diagnosis and treatment of Alzheimer’s disease. Expert Rev. Neurother. 2008, 8, 769–780. [Google Scholar] [CrossRef]
- Morris, J.C. The Clinical Dementia Rating (CDR): Current version and scoring rules. Neurology 1993, 43, 2412–2414. [Google Scholar] [CrossRef] [PubMed]
- McKhann, G.; Drachman, D.; Folstein, M.; Katzman, R.; Price, D.; Stadlan, E.M. Clinical diagnosis of Alzheimer’s disease: Report of the NINCDS-ADRDA Work Group under the auspices of Department of Health and Human Services Task Force on Alzheimer’s Disease. Neurology 1984, 34, 939–944. [Google Scholar] [CrossRef] [PubMed]
- Movement Disorder Society Task Force on Rating Scales for Parkinson’s Disease. The Unified Parkinson’s Disease Rating Scale (UPDRS): Status and recommendations. Mov. Disord. 2003, 18, 738–750. [Google Scholar] [CrossRef] [PubMed]
- Goetz, C.G.; Tilley, B.C.; Shaftman, S.R.; Stebbins, G.T.; Fahn, S.; Martinez-Martin, P.; Poewe, W.; Sampaio, C.; Stern, M.B.; Dodel, R.; et al. Movement Disorder Society-sponsored revision of the Unified Parkinson’s Disease Rating Scale (MDS-UPDRS): Scale presentation and clinimetric testing results. Mov. Disord. 2008, 23, 2129–2170. [Google Scholar] [CrossRef] [PubMed]
- McKeith, I.G.; Dickson, D.W.; Lowe, J.; Emre, M.; O’Brien, J.T.; Feldman, H.; Cummings, J.; Duda, J.E.; Lippa, C.; Perry, E.K.; et al. Diagnosis and management of dementia with Lewy bodies: Third report of the DLB Consortium. Neurology 2005, 65, 1863–1872. [Google Scholar] [CrossRef] [PubMed]
- Neary, D.; Snowden, J.S.; Gustafson, L.; Passant, U.; Stuss, D.; Black, S.; Freedman, M.; Kertesz, A.; Robert, P.H.; Albert, M.; et al. Frontotemporal lobar degeneration: A consensus on clinical diagnostic criteria. Neurology 1998, 51, 1546–1554. [Google Scholar] [CrossRef] [PubMed] [Green Version]
- Leopold, N.; Lendl, B. A New Method for Fast Preparation of Highly Surface-Enhanced Raman Scattering (SERS) Active Silver Colloids at Room Temperature by Reduction of Silver Nitrate with Hydroxylamine Hydrochloride. J. Phys. Chem. B 2003, 107, 5723–5727. [Google Scholar] [CrossRef]
- Zhang, Z.M.; Chen, S.; Liang, Y.Z. Baseline correction using adaptive iteratively reweighted penalized least squares. Analyst 2010, 135, 1138–1146. [Google Scholar] [CrossRef]
- Wise, B.M.; Gallagher, N.B.; Bro, R.; Shaver, J.M.; Windig, W.; Koch, R.S.; OÕSullivan, D. PLS_Toolbox 6 for Use with Matlab; Software, Eigenvector Research, Inc.: Wenatchee, WA, USA, 2011. [Google Scholar]
- Niazi, A.; Leardi, R. Genetic algorithms in chemometrics. J. Chemom. 2012, 26, 345–351. [Google Scholar] [CrossRef]
- Bishop, C.M. Neural Networks for Pattern Recognition; Oxford University Press: Oxford, UK, 1995. [Google Scholar]
- Smith, A.; Nugent, C.; McClean, S.; Nugent, C.; McClean, S. Evaluation of inherent performance of intelligent medical decision support systems: Utilising neural networks as an example. Artif. Intell. Med. 2003, 27, 1–27. [Google Scholar] [CrossRef]
- Tung, W.L.; Quek, C.; Cheng, P. GenSo-EWS: A novel neural-fuzzy based early warning system for predicting bank failures. Neural Netw. 2004, 17, 567–587. [Google Scholar] [CrossRef] [PubMed]
- Wall, R.; Cunningham, P.; Walsh, P.; Byrne, S. Explaining the output of ensembles in medical decision support on a case by case basis. Artif. Intell. Med. 2003, 28, 191–206. [Google Scholar] [CrossRef] [Green Version]
- Everitt, B.S.; Dunn, G. Applied Multuvariate Data Analysis; John Wiley & Son, Ltd.: Hoboken, NJ, USA, 2001; pp. 248–268. [Google Scholar]
- Cheng, B.; Titterington, D.M. Neural Networks: A Review from a Statistical Perspective. Stat. Sci. 1994, 9, 2–30. [Google Scholar] [CrossRef]
- Chernushevich, I.V.; Loboda, A.V.; Thomson, B.A. An introduction to quadrupole–time-of-flight mass spectrometry. J. Mass Spectrom. 2001, 36, 849–865. [Google Scholar] [CrossRef] [PubMed]
- Eftekhar, B.; Mohammad, K.; Ardebili, H.E.; Ghodsi, M.; Ketabchi, E. Comparison of artificial neural network and logistic regression models for prediction of mortality in head trauma based on initial clinical data. BMC Med. Inform. Decis. Mak. 2005, 5, 3. [Google Scholar] [CrossRef]
- Shen, L.; Tan, E.C. Reducing multiclass cancer classification to binary by output coding and SVM. Comput. Biol. Chem. 2006, 30, 63–71. [Google Scholar] [CrossRef]
- Ablameyko, S. Neural Networks for Instrumentation, Measurement and Related Industrial Applications; IOS Press: Amsterdam, The Netherlands, 2003. [Google Scholar]
- Guenther, F.; Fritsch, S. Neuralnet: Training of Neural Networks. R J. 2010, 2, 30–38. [Google Scholar] [CrossRef]
- De Gelder, J.; De Gussem, K.; Vandenabeele, P.; Moens, L. Reference database of Raman spectra of biological molecules. J. Raman Spectrosc. 2007, 38, 1133–1147. [Google Scholar] [CrossRef]
- Movasaghi, Z.; Rehman, S.; Rehman, I.U. Raman spectroscopy of biological tissues. Appl. Spectrosc. Rev. 2007, 42, 493–541. [Google Scholar] [CrossRef]
- Dietterich, T.G. Approximate statistical tests for comparing supervised classification learning algorithms. Neural Comput. 1998, 10, 1895–1923. [Google Scholar] [CrossRef]
- Guevara, E.; Torres-Galván, J.C.; Ramírez-Elías, M.G.; Luevano-Contreras, C.; González, F.J. Use of Raman spectroscopy to screen diabetes mellitus with machine learning tools. Biomed. Opt. Express 2018, 9, 4998–5010. [Google Scholar] [CrossRef] [PubMed]
- Robin, X.; Turck, N.; Hainard, A.; Tiberti, N.; Lisacek, F.; Sanchez, J.C.; Müller, M. pROC: An open-source package for R and S+ to analyze and compare ROC curves. BMC Bioinform. 2011, 12, 77. [Google Scholar] [CrossRef] [PubMed]

| AMC Subjects (Serum Samples) | |||||
|---|---|---|---|---|---|
| AD | HC (n = 10) | OD (n = 18) | |||
| Moderate Stage (n = 10) | Mild Stage (n = 10) | Total AD (n = 20) | |||
| Age in years ± STD | 76 ± 10 | 72.4 ± 8.4 | 74 ± 9.3 | 68 ± 11 | 73 ± 7 |
| Male (%) | 40 | 60 | 50 | 50 | 78 |
| Female (%) | 60 | 40 | 50 | 50 | 22 |
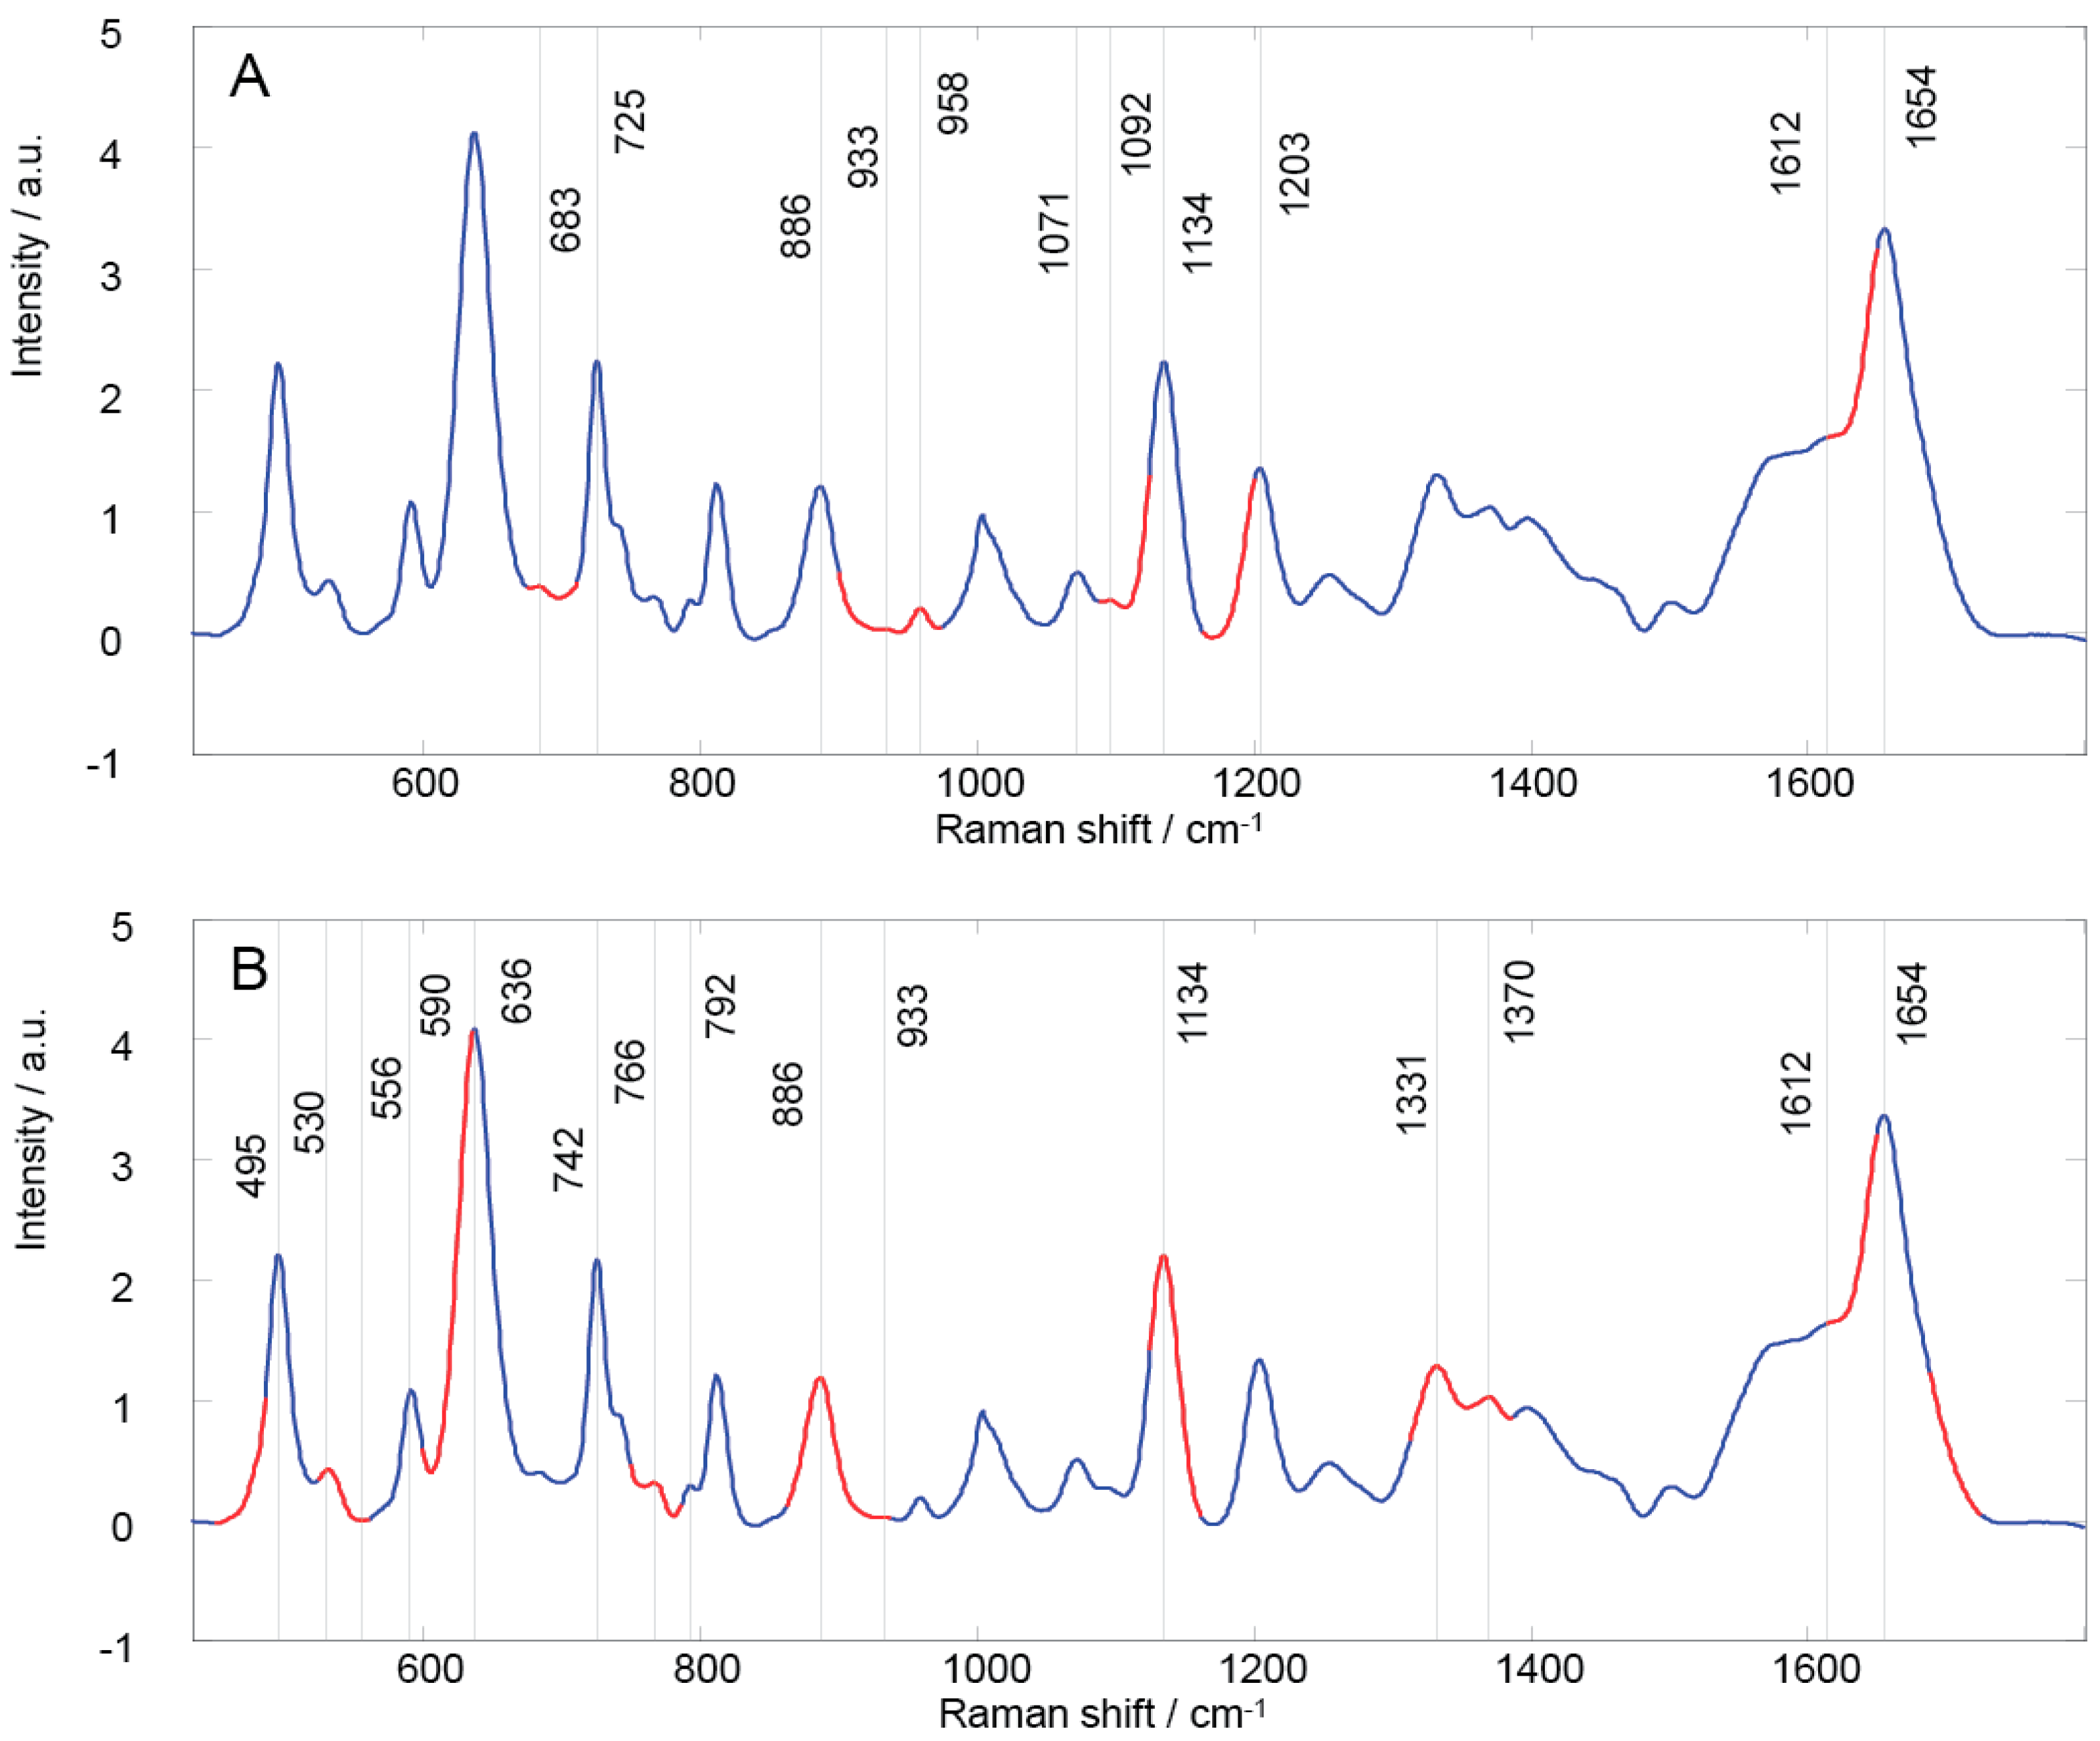
| GA Region | Peak Position | Vibrational Mode | Contributions [15,20,24,62,63] | |
|---|---|---|---|---|
| 1 | 674–710 | 683 725 | υ(C-S), υ(C-C), (C-N), (CH2), CN-(CH3)3, N+(CH3)3 | adenine, glycine, tryptophan, histidine, proline, oleic acid, triolein, mannose, citric acid, coenzyme A, acetyl coenzyme A, glutathione, phospholipids |
| 2 | 899–973 | 886 933 958 | δ(C-O-H), υ(C-C), υ(CH3), δRing vibration, (CH2), (C-O-C) | guanine, glycine, valine, histidine, proline, hydroxyproline, gluthatione, α helix, fatty acids, cholesterol, mannose, galactosamine, N-acetyl-D-glucosamine |
| 3 | 1087–1123 | 1071 1092 1134 | υ(C-N), υ(C-C), υ(C-O) | adenine, glycine, serine, glutamate, tryptophan, histidine, fatty acids, mannose, glucose, lactose, galactosamine, N-acetyl-D-glucosamine, acetyl coenzyme A, D-fructose-6-phosphate, glutathione, phospholipids |
| 4 | 1162–1199 | 1203 | υ(C-N), (N-H), (CH2), | tyrosine, phenylalanine, tryptophan, glycine, proline, amide III, N-acetyl-D-glucosamine, coenzyme A, acetyl coenzyme A, |
| 5 | 1613–1649 | 1612 1654 | υ(C=O), (NH2), υ(C=C) | adenine, cytosine, thymine, tryptophan, tyrosine, fatty acids, galactosamine, pyruvate, coenzyme A, acetoacetate, ascorbic acid, amide I, α helix, phospholipid |
| GA Region | Peak Position | Vibrational Mode | Contributions [15,20,24,62,63] | |
|---|---|---|---|---|
| 1 | 448–485 | 495 | Ring torsion vibration, υ(N-C-S) | guanine, arginine, valine, glutamate, tyrosine, tryptophan, mannose, glycogen, acetyl coenzyme A, acetoacetate |
| 2 | 523–560 | 530 | υ(S-S) disulfide stretching in proteins | uracil, alanine, phenylalanine, glutamate, tyrosine, tryptophan, cysteine, mannose, fructose, galactosamine, N-acetyl-D-glucosamine, phosphoenolpyruvate, acetyl coenzyme A, D-fructose-6-phosphate, riboflavin, phosphatidylserine |
| 3 | 598–635 | 590 636 | υ(C-S), υ4(PO43-) | ascorbic acid, glutamate, tryptophan, methionine, tyrosine, lactose, N-acetyl-D-glucosamine, pyruvate, acetyl coenzyme A, phosphatidylinositol |
| 4 | 749–785 | 742 766 792 | δRing vibration | cytosine, thymine, uracil, glutamate, tyrosine, tryptophan, proline, N-acetyl-D-glucosamine, phosphoenolpyruvate, acetoacetate, phospholipids, riboflavin, pyrimidine, phosphatidylserine |
| 5 | 861–936 | 886 933 | δ(C-O-H), υ(C-C), δRing vibration, (CH2), (C-O-C) | guanine, glycine, valine, histidine, proline, hydroxyproline, gluthatione, α helix, fatty acids, mannose, galactosamine, N-acetyl-D-glucosamine |
| 6 | 1124–1161 | 1134 | υ(C-N), υ(C-C) | adenine, glycine, serine, fatty acids, mannose, phospholipids |
| 7 | 1312–1386 | 1331 1370 | υ(C-H), (C3-C3), (C5-O5), (CHα), (CH3CH2), δ(CH3), δ(CH2), υ(CH3), | adenine, thymine, guanine, valine, serine, arginine, phenylalanine, tyrosine, tryptophan, histidine, proline, fatty acids, lactose, mannose, galactosamine, N-acetyl-D-glucosamine, acetyl coenzyme A, gluthatione, phospholipids, amid III |
| 8 | 1613–1649 | 1612 1654 | υ(C=O), (NH2), υ(C=C) | adenine, cytosine, thymine, tryptophan, tyrosine, fatty acids, galactosamine, pyruvate, coenzyme A, acetoacetate, ascorbic acid, amide I, α helix, phospholipids |
| 9 | 1688–1724 |
| Binary Model | |||
| Predicted/Actual | AD | HC | |
| AD | 27 | 1 | |
| HC | 0 | 12 | |
| Tertiary Model–AD | |||
| Predicted/Actual | Mild AD | Moderate AD | HC |
| Mild AD | 11 | 0 | 0 |
| Moderate AD | 1 | 14 | 0 |
| HC | 0 | 0 | 14 |
| Tertiary Model–OD | |||
| Predicted/Actual | AD | HC | OD |
| AD | 28 | 0 | 0 |
| HC | 1 | 6 | 0 |
| OD | 0 | 0 | 13 |
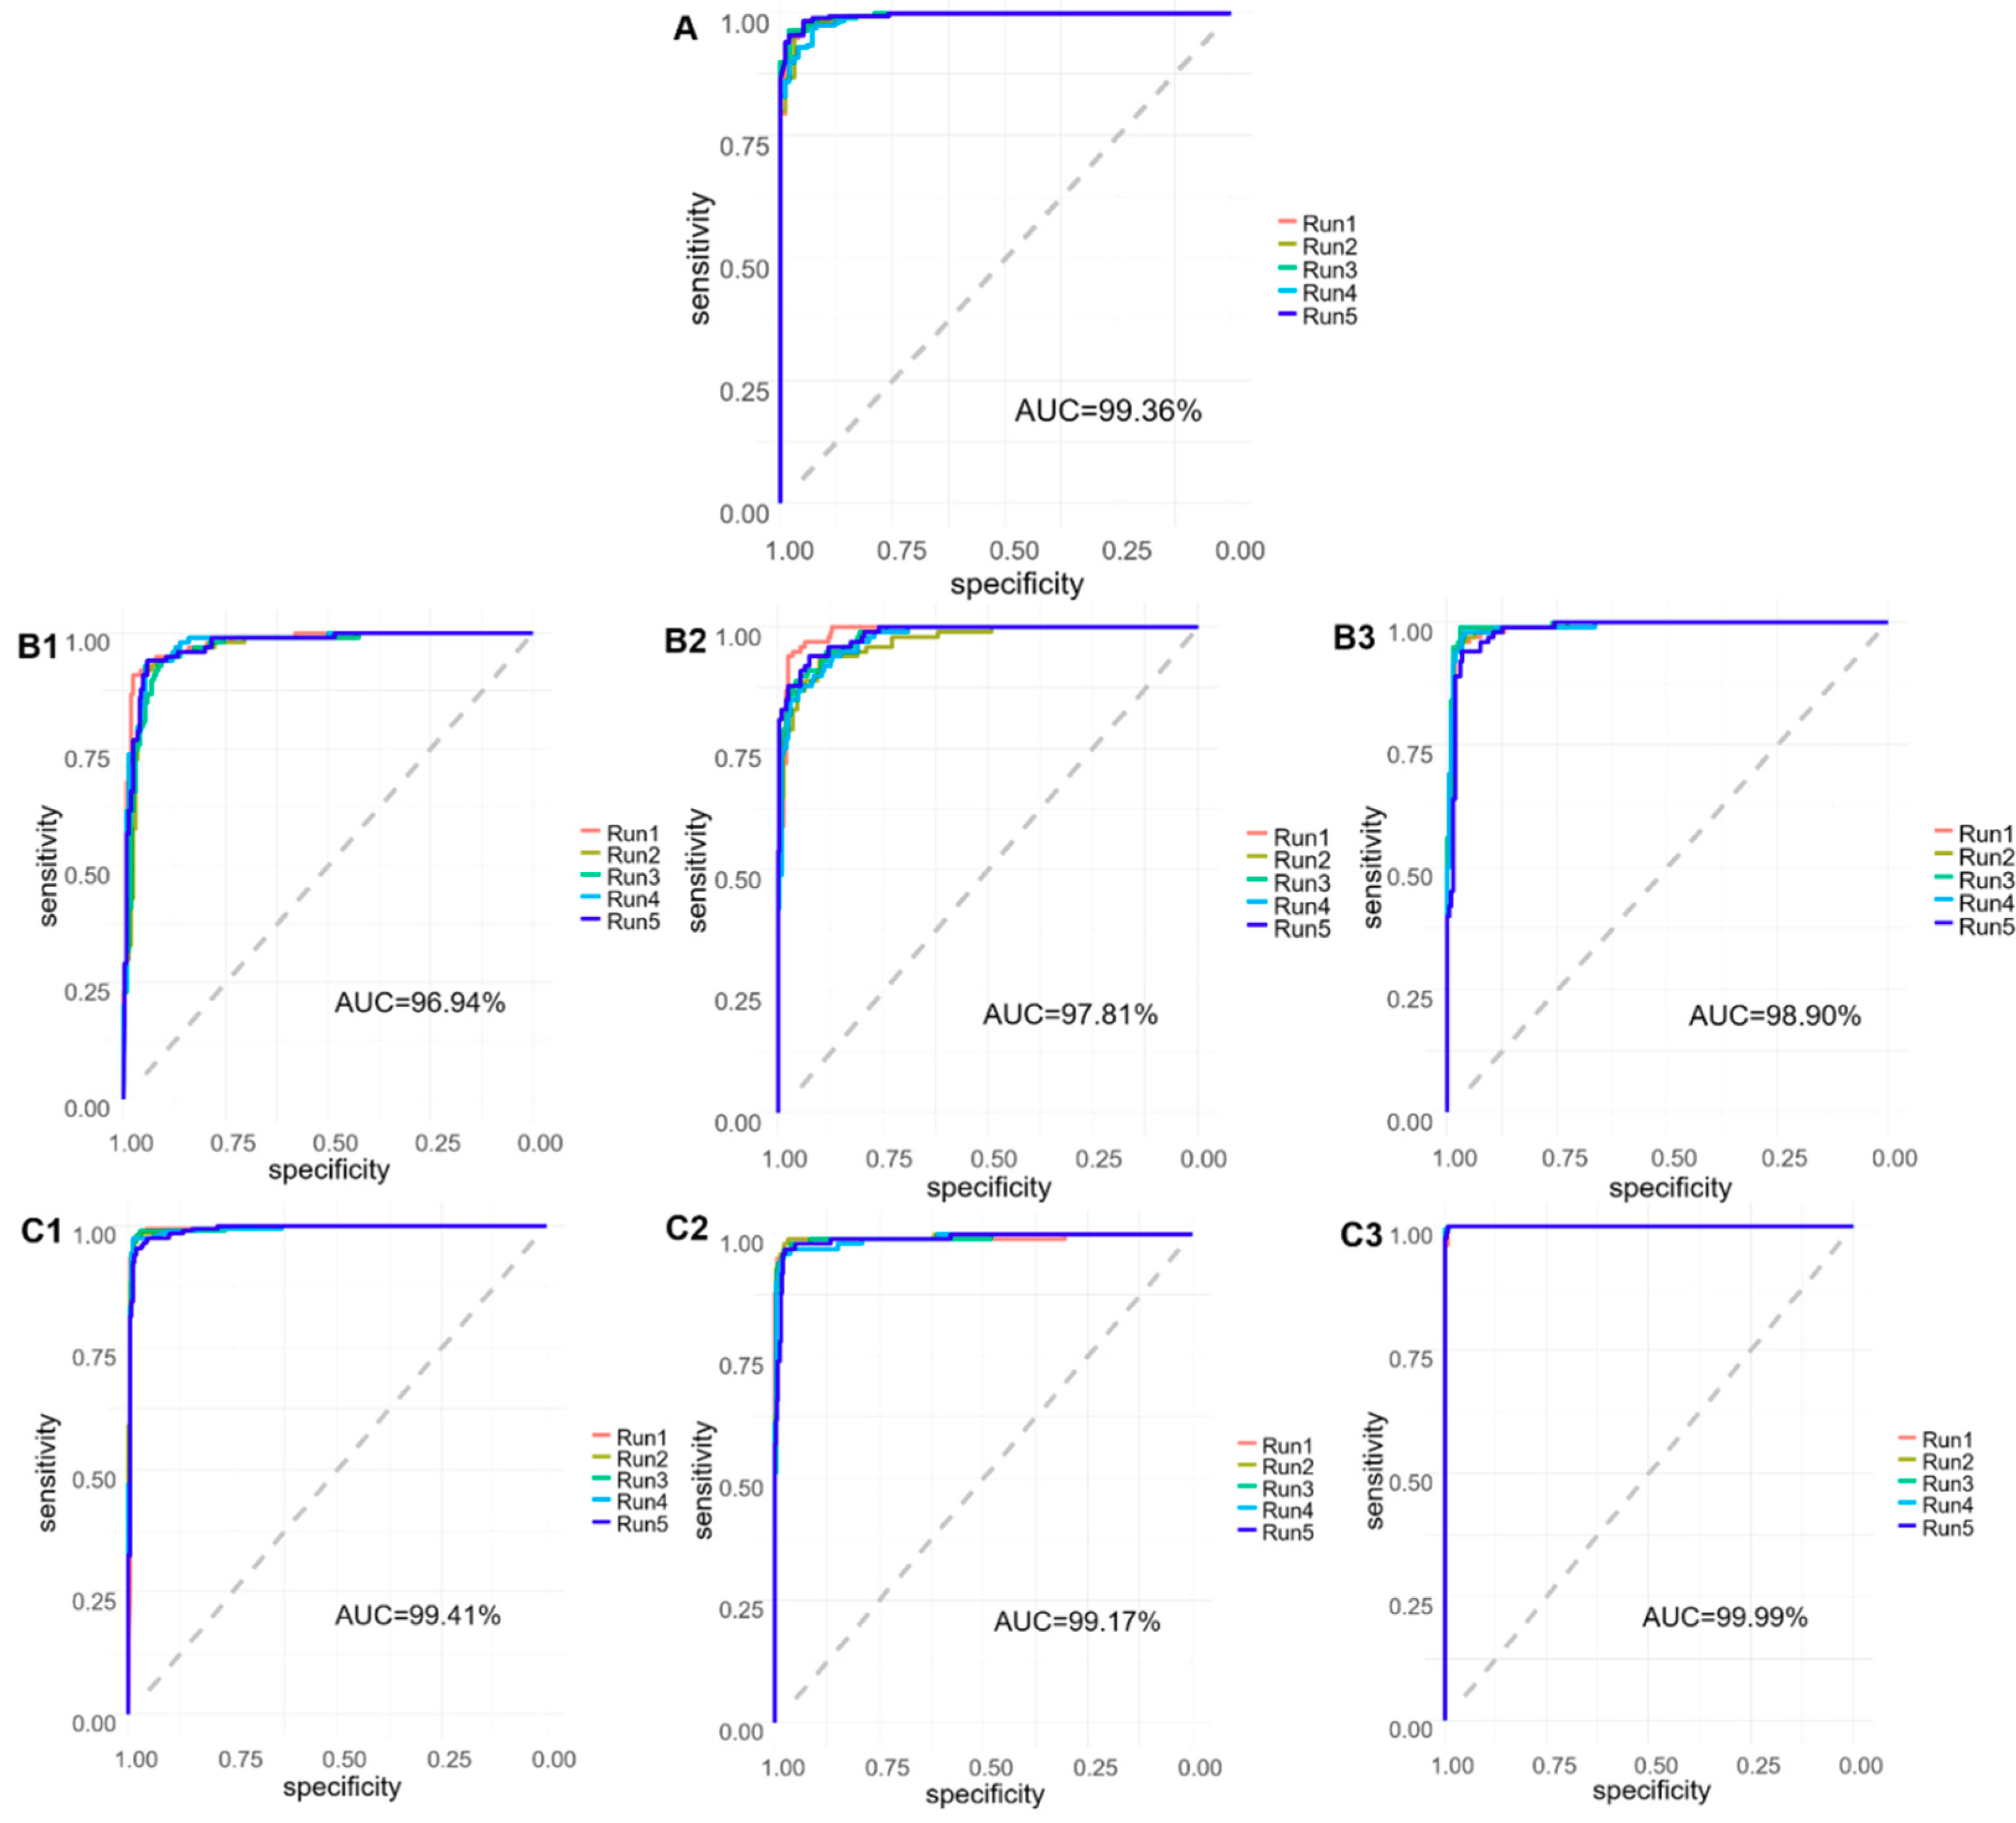
| Binary Model | |||
| Sensitivity (±STD) | Specificity (±STD) | Accuracy (±STD) | |
| AD vs. HC | 98.00 (0.447) | 93.40 (1.497) | 96.47 (0.688) |
| Tertiary Model–AD | |||
| Sensitivity (±STD) | Specificity (±STD) | Accuracy (±STD) | |
| Mild AD | 88.80 (0.047) | 94.50 (0.025) | 93.13 (0.010) |
| Moderate AD | 90.80 (0.025) | 96.80 (0.007) | 94.79 (0.010) |
| HC | 97.20 (0.010) | 96.30 (0.009) | 96.60 (0.006) |
| Tertiary Model–OD | |||
| Sensitivity (±STD) | Specificity (±STD) | Accuracy (±STD) | |
| AD | 96.40 (0.015) | 98.21 (0.003) | 97.46 (0.006) |
| HC | 95.00 (0.007) | 98.79 (0.007) | 98.00 (0.006) |
| OD | 100.00 (0.000) | 99.13 (0.002) | 99.46 (0.001) |
© 2019 by the authors. Licensee MDPI, Basel, Switzerland. This article is an open access article distributed under the terms and conditions of the Creative Commons Attribution (CC BY) license (http://creativecommons.org/licenses/by/4.0/).
Share and Cite
Ryzhikova, E.; Ralbovsky, N.M.; Halámková, L.; Celmins, D.; Malone, P.; Molho, E.; Quinn, J.; Zimmerman, E.A.; Lednev, I.K. Multivariate Statistical Analysis of Surface Enhanced Raman Spectra of Human Serum for Alzheimer’s Disease Diagnosis. Appl. Sci. 2019, 9, 3256. https://doi.org/10.3390/app9163256
Ryzhikova E, Ralbovsky NM, Halámková L, Celmins D, Malone P, Molho E, Quinn J, Zimmerman EA, Lednev IK. Multivariate Statistical Analysis of Surface Enhanced Raman Spectra of Human Serum for Alzheimer’s Disease Diagnosis. Applied Sciences. 2019; 9(16):3256. https://doi.org/10.3390/app9163256
Chicago/Turabian StyleRyzhikova, Elena, Nicole M. Ralbovsky, Lenka Halámková, Dzintra Celmins, Paula Malone, Eric Molho, Joseph Quinn, Earl A. Zimmerman, and Igor K. Lednev. 2019. "Multivariate Statistical Analysis of Surface Enhanced Raman Spectra of Human Serum for Alzheimer’s Disease Diagnosis" Applied Sciences 9, no. 16: 3256. https://doi.org/10.3390/app9163256