Fabric Defect Detection Using L0 Gradient Minimization and Fuzzy C-Means


College of Electronics and Information, Xi’an Polytechnic University, Xi’an 710048, China
*
Author to whom correspondence should be addressed.
Appl. Sci. 2019, 9(17), 3506; https://doi.org/10.3390/app9173506
Submission received: 8 July 2019
/
Revised: 15 August 2019
/
Accepted: 20 August 2019
/
Published: 26 August 2019
(This article belongs to the Special Issue New Industry 4.0 Advances in Industrial IoT and Visual Computing for Manufacturing Processes)
Abstract
:In this paper, we present a robust and reliable framework based on L0 gradient minimization (LGM) and the fuzzy c-means (FCM) method to detect various fabric defects with diverse textures. In our framework, the L0 gradient minimization is applied to process the fabric images to eliminate the influence of background texture and preserve sharpened significant edges on fabric defects. Then, the processed fabric images are clustered by using the fuzzy c-means. Through continuous iterative calculation, the clustering centers of fabric defects and non-defects are updated to realize the defect regions segmentation. We evaluate the proposed method on various samples, which include plain fabric, twill fabric, star-patterned fabric, dot-patterned fabric, box-patterned fabric, striped fabric and statistical-texture fabric with different defect types and shapes. Experimental results demonstrate that the proposed method has a good detection performance compared with other state-of-the-art methods in terms of both subjective and objective tests. In addition, the proposed method is applicable to industrial machine vision detection with limited computational resources.
1. Introduction
Fabric defect detection plays a crucial role in the automatic inspection in textile production processes. However, traditional fabric defect defection is often dependent on human inspection, and quality controls often rely to experience of specialized workers. It is noted that the human workers are prone to fatigue and boredom due to the repetitive nature of their tasks [1]. Thus, the human inspection involves limitations in terms of accuracy, coherence, and efficiency when detecting defects. Since the fabric textures are so complicated (including plain weave fabric, knitted fabric, twill fabric, laces, and pattern fabric) [2], the fabric colors are variable, and the contrasts between fabric defects and background are low, generalized defect detection exploration is highly challenging.
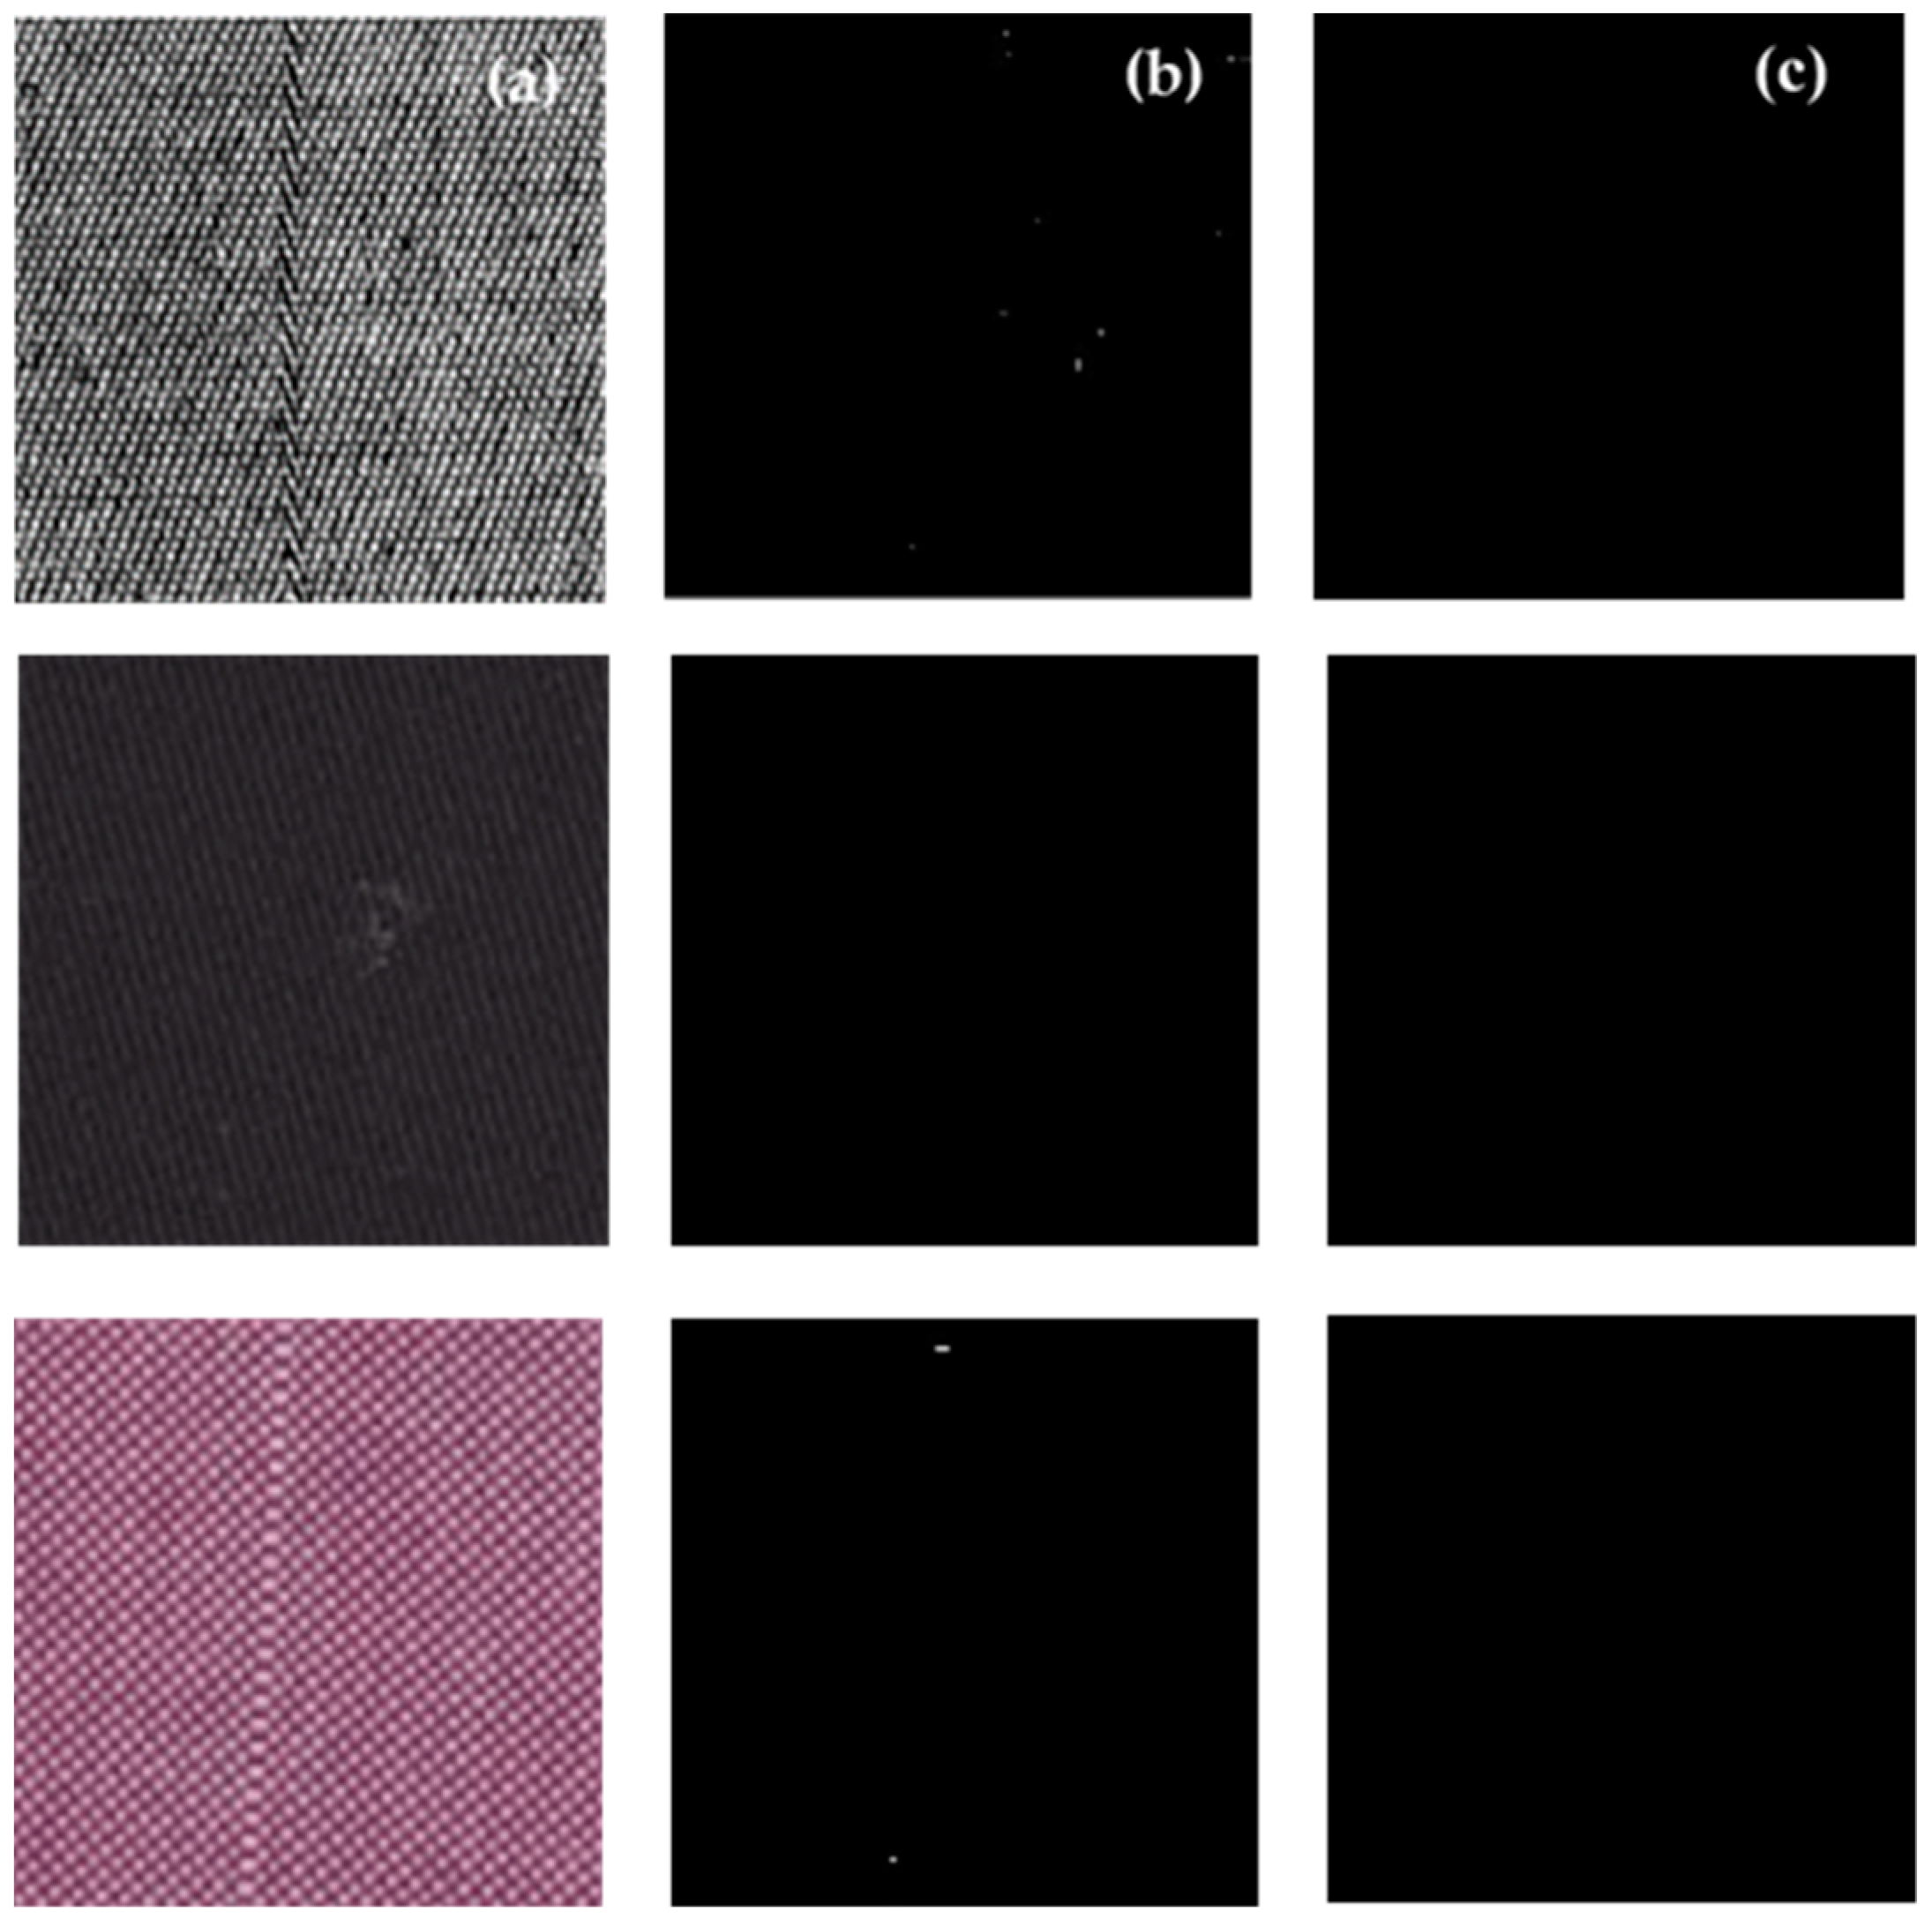
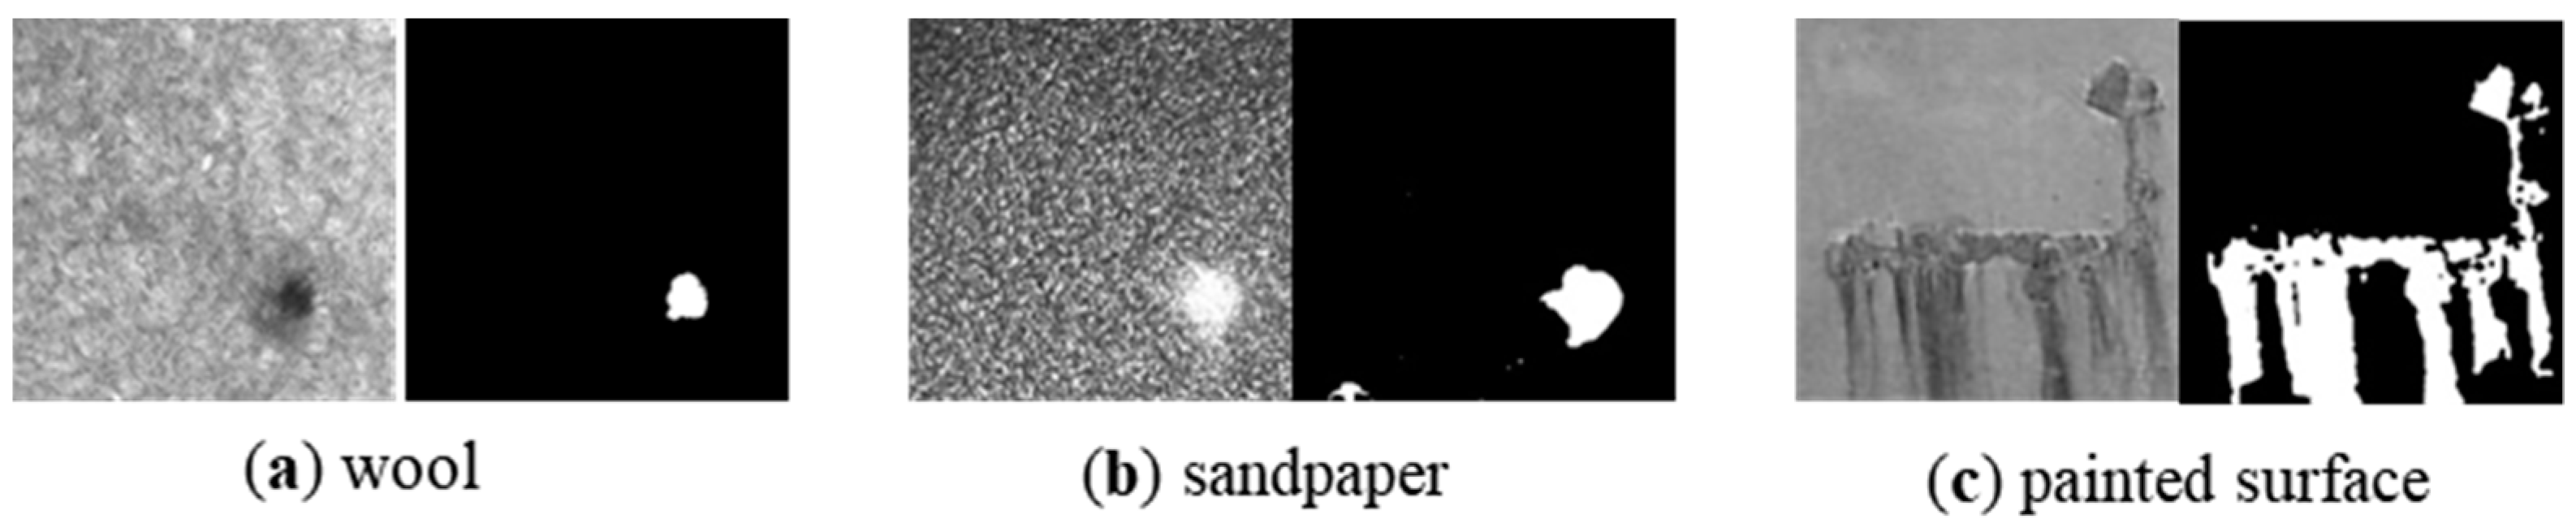
Currently, automated defect detection methods based on machine vision have drawn much attention. Gaussian mixture entropy modeling [3] and wavelet transform [4] were used to detect defect in simple plain and twill fabric images via transformation and reconstruction processes. However, most of these methods designed for the simplest plain and twill fabrics, which cannot be effectively applied on complicated patterns fabric, such as the dot-patterned fabric, star-patterned fabrics and statistical-texture fabrics. The entropy-based automatic selection of the wavelet decomposition level (EADL) [5] method and the automatic band selection method [6] achieved defect defection in statistical and structural textures. Bollinger bands (BB) [7] and image decomposition (ID) methods [8] have been shown to perform robustly for dot-patterned, star-patterned and box-patterned fabrics. However, it remains unknown whether these two methods can be used for plain, twill, and statistical-texture fabrics. In a preliminary evaluation, the BB and ID methods failed to recognize some defective samples. As shown in Figure 1, the BB and ID methods are weak at differentiating defects with directional features. These methods achieve good results on a certain texture, but it remains challenging to robustly and accurately handle the fabric defect image if it has a complicated patterns texture, low contrast between defect object and background, various colors, and a low signal-to-noise ratio.
To address these problems, we present a novel method based on L0 gradient minimization (LGM) and fuzzy c-means (FCM), which provides a new perspective for the detection of fabric defects. Usually, a defect-free fabric image in industrial products has consistent texture, and the defect can be considered as the defective structure information and texture information. In our work, we first used the LGM method to filter the input image to eliminate the influence of texture information on fabric defects. Then, the filtered results with just defective information were segmented by applying the FCM. The proposed method can handle the defect with the plain fabric, twill fabric, star-patterned fabric, dot-patterned fabric, box-patterned fabric, striped fabric, and statistical-texture fabric (as shown in Figure 2).
The remainder of this paper is organized as follows. Section 2 briefly discusses some related works. Section 3 mainly focuses on presents the proposed method. The experiment results and discussions are given in Section 4. Conclusions and future works pertaining to this work are presented in Section 5.
2. Related Works
Plain and twill fabric detection methods can be classified into five aspects: Spectral [9,10], learning [11,12], statistical [13,14,15], model-based [16,17], and structural methods [18,19]. The spectral method based on the Wavelet transform [20] achieved 97.5% detection accuracy with five known defect types and a 93.3% detection accuracy (a slight drop) with three unknown defect types in an evaluation. The statistical method applied gray relational analysis with co-occurrence Matrix (CM) features [21] on Jacquard fabric images, reaching 94% detection accuracy for 50 defective samples. The learning method via three-layer back-propagation neural network and thresholding of the image analysis [22] was tested on the same kind of fabric; it achieved 94.38% accuracy, using 240 samples of the four defect classes. The limitation of their method includes a longer training time, because of the larger number of inner layers and the danger of over-training. In addition, model-based approach using the Gaussian mixture model [23] was successfully applied to Brodatz mosaic image segmentation and fabric defect detection. Structural approaches based on normalized cross-correlation algorithm [24] obtained a higher detection success rate of 95% on twelve defective plain and twill fabrics’ images. In general, many pieces of research on plain and twill fabric inspection works have achieved fruitful results; however, these methods were not efficiently evaluated on complicated patterned fabrics and statistical-texture fabrics.
The defect detection of complicated patterned fabric has been increasing during the last decade. The Bollinger bands (BB) and regular bands (RB) [25] methods employed the regularity property in the patterned texture to carry out defect detection on dot-, box- and star-patterned fabrics. They also obtained accuracy rates of 98.59% (167 defect-free and 171 defective images) and 99.4% (80 defect-free and 86 defective images), respectively. The wavelet-preprocessing golden image subtraction (WGIS) method [20] achieved 96.7% accuracy on 30 defect-free and 30 defective patterned images by using a golden image to perform moving subtraction of each pixel along each row of every wavelet-pre-processed tested image. The ID [8] method obtained the detection accuracies range from 94.9–99.6% for dot- (110 defect-free and 120 defective samples), star- (25 defect-free and 25 defective samples) and box-patterned fabrics (30 defect-free and 26 defective samples), which decomposed a fabric image into structures of cartoon (defective objects) and texture (repeated patterns). A recent Elo rating method [26] achieved an overall 97.07% detection success rate based on databases of [8]. However, it remains unknown whether the patterned fabric defect detection method can also be applied to twill, plain fabric, and statistical-texture fabrics.
In our work, we take full consideration of the original fabric images, which can be seen as defective structure information and texture information. Texture information often affects the fabric defect detection. LGM is used to filter the images to remove the texture information. In this way, the filtered fabric images would quickly locate and segment the defects. The proposed method can detect the defect in the plain fabric, twill fabric, star-patterned fabric, dot-patterned fabric, box-patterned fabric, striped fabric, and statistical-texture fabric.
3. Methods
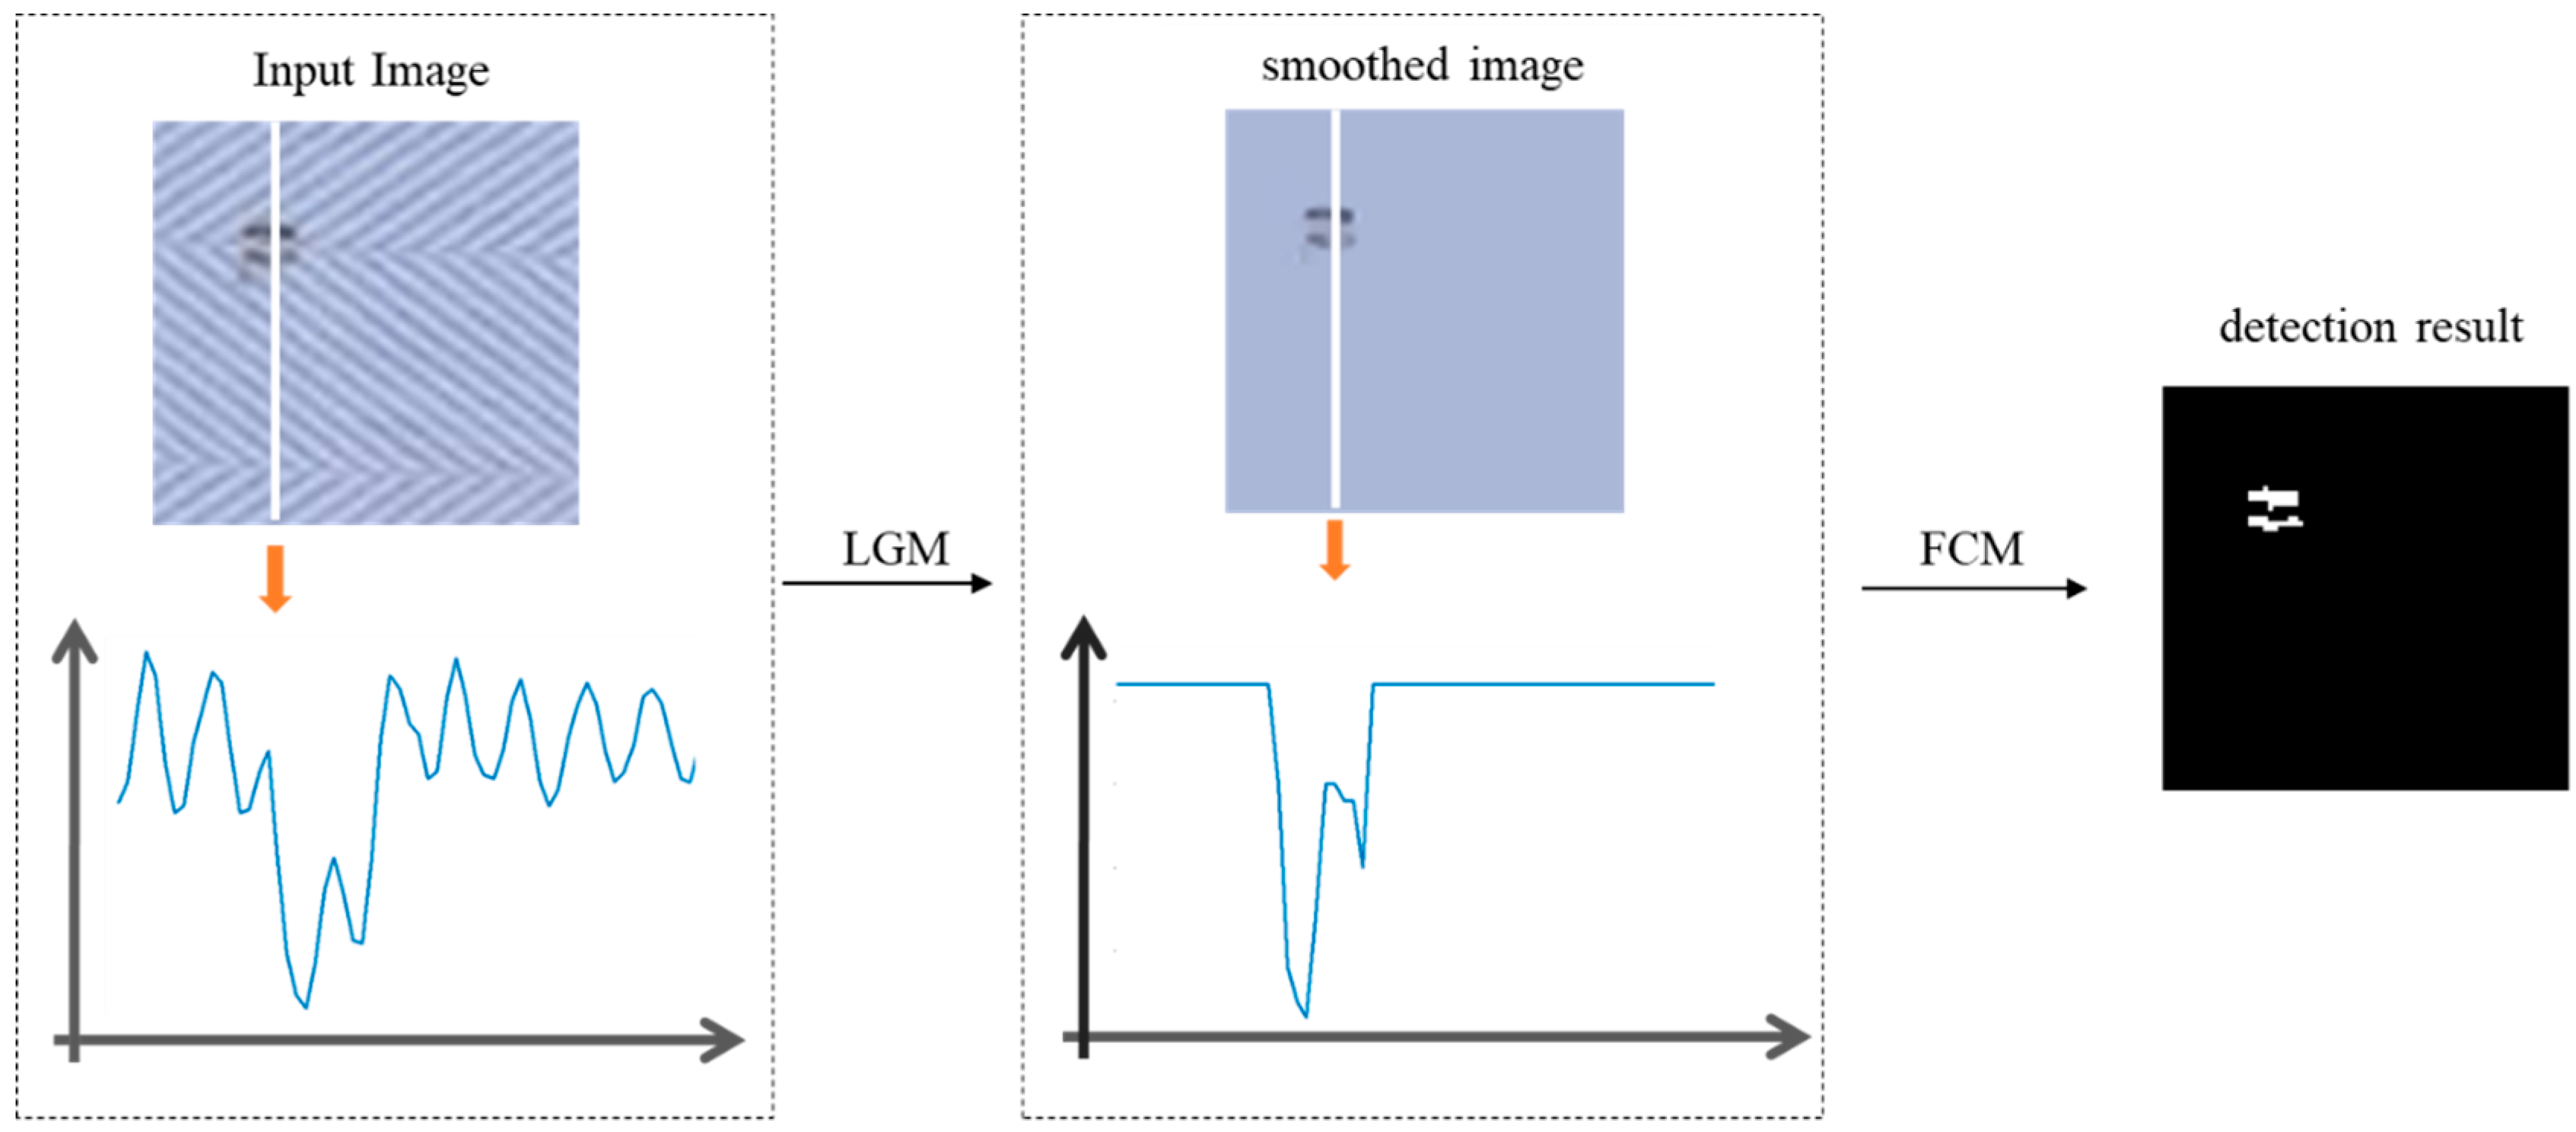
In this section, procedures of the proposed LCM and FCM algorithm are described in detail. Figure 3 shows the overview of the presented method. It consists of two steps: Firstly, the L0 gradient minimization is applied to eliminate the influence of the background texture of fabric defects. Then the fuzzy c-means clustering is used to determine whether each pixel is defective.
3.1. Texture Removal by the L0 Gradient Minimization (LGM)
Due to the complexity of background texture information, it often increases the challenge of fabric defect detection. The L0 gradient minimization method [27] is widely used to smooth texture information. It is often adopted for filtering the image while preserving edge feature. The L0 gradient minimization method enhances the significant edge portion of the image by increasing the steepness of the transition portion of the image while removing the low-amplitude detail portions. Inspired by the L0 gradient minimization, we apply it to remove the background texture of fabric.
As shown in Figure 4a, the fabric defect sample has three different directions of texture, and it is a mesh diagram, as shown in Figure 5a. After smoothing via LGM, the unimportant background texture of the fabric is removed, as shown in Figure 4b. Notice that the high-contrast edges on the defect are preserved, and the defect feature is more prominent, as shown in Figure 5b.
In order to illustrate the method clearly, we briefly summarize the theory of the L0 gradient minimization model. Let I be the input fabric image, its smoothed output result is S, and are the partial derivative of the processed image in the x and y directions at p respectively, and the gradient of image S at pixel p is denoted by . The image L0 gradient specific objective function is defined as:
where λ is a non-negative parameter, which directly controls the weight of the smoothing term. β is an automatically adapting parameter. h is auxiliary variable. By alternatively computing h and S, it can obtain the output result. Figure 6 shows the result using the LGM method with their corresponding mesh diagrams. It is observed that the output result retains the defect information and removes the background texture information.
3.2. Fuzzy C-Means Clustering Algorithm (FCM)
The output results via LGM are obtained in the previous section. We can easily process the defect information, which becomes more obvious. Then the FCM algorithm is applied to segment the defects.
The FCM algorithm [28,29] is a fuzzy and unsupervised clustering algorithm. Its classification capacity is flexible and simple to implement. The FCM algorithm defines the objective function represented the sum of squares of the weighted distances from each pixel in the target image to each cluster center, which is given by:
where c is the number of clusters, n is the number of pixels in the image, is the membership degree of the i-th pixel belonging to the j-th class, normally and , b is a preset fuzzy factor which controls the degree of blur, normally b 1, and represents the Euclidean distance from the i-th pixel to the j-th class.
The physical meaning of the objective function J represents the sum of squares of the weighted distances from each pixel in the target image to each cluster center. When the Euclidean-distance-weighted value of each pixel-point in the target image to the cluster center is the minimum, and the Euclidean distance from other cluster centers is as large as possible. The basic principle of the FCM algorithm is to find a set of suitable clustering centers and the membership matrix, such that the objective function J takes the minimum value min (J).
When calculating the minimum value of the objective function, it is necessary to continuously update the membership matrix and the cluster center according to Equations (3) and (4) until the minimum value is obtained:
When the objective function obtains the minimum value, the membership degree is retained, and each pixel of the target image is clustered. In the iterative process, the appropriate iteration termination condition should be selected correctly, otherwise, it cannot obtain the ideal segmentation result. When the FCM algorithm is convergent, it can achieve the different clustering centers which are the clustering center of defects information and the clustering center of the normal fabric information.
4. Experimental Results and Discussion
The testing code was implemented under the MATLAB version R2014B. The proposed method was carried out on a standard workstation equipped with an Intel Core i5-4460 3.2 GHz CPU with 8 GB of main memory, an NVIDIA GeForce GT 745 graphics card and Windows 8.1 OS.
In our work, we used fabric defect images from the automation laboratory sample database of Hong Kong University, TILDA Textile Texture Database and Guang Dong Esquel Textiles with a resolution of 600 dpi, scanned by Canon Scanner 9000F. The images have a size of 256 × 256 pixels and an 8-bit grey level. Various fabric images (including plain fabric, twill fabric, star-patterned fabric, dot-patterned fabric, box-patterned fabric, striped fabric, and statistical-texture fabrics) were used for evaluating our method.
4.1. Parameter Setting
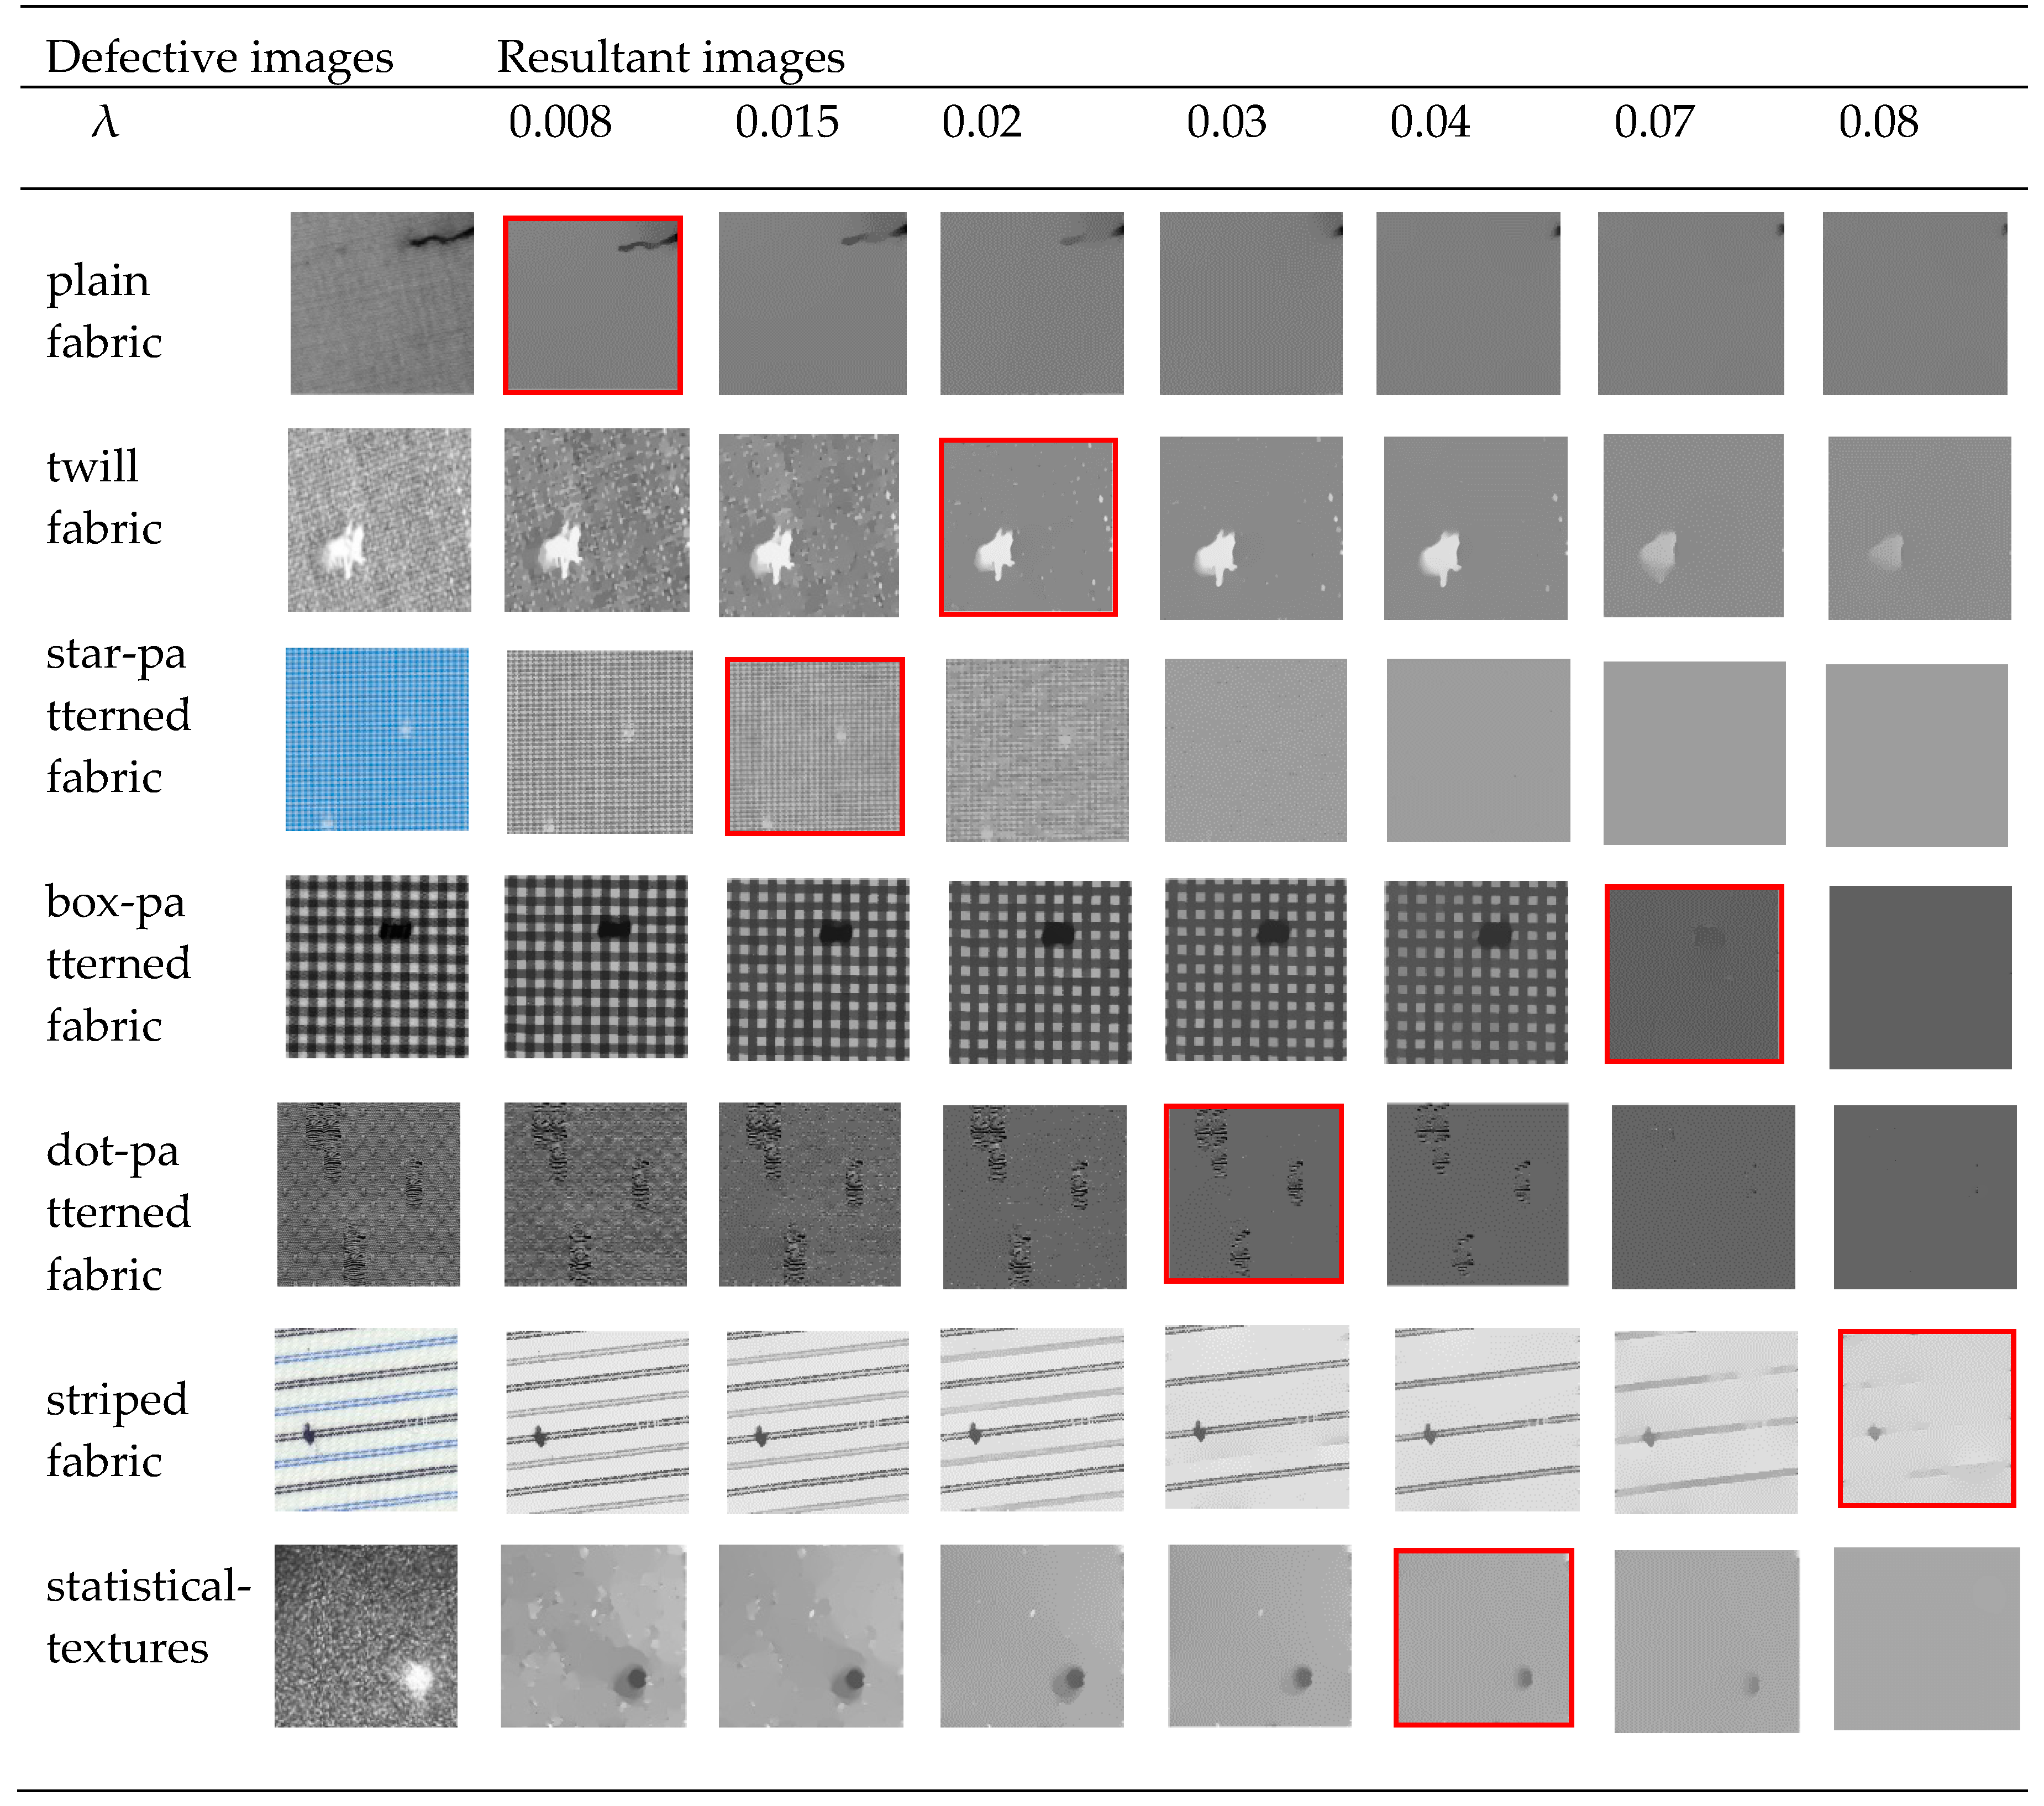
The parameter λ plays a key role in detecting defects accurately in our method. The influence of λ that changed the defection results is shown in Figure 7. The best filter results using LGM are marked with a red block. From the Figure 7, it can be seen that if the parameter λ is set too small, the noise and background texture are almost unchanged. On the contrary, if the parameter λ is set too large, the defect is smoothed over. If the parameter λ is set moderate, the defect area will be easily distinct from the surrounding background in the following segmentation, and we can obtain a better detection result, as shown in Figure 7.
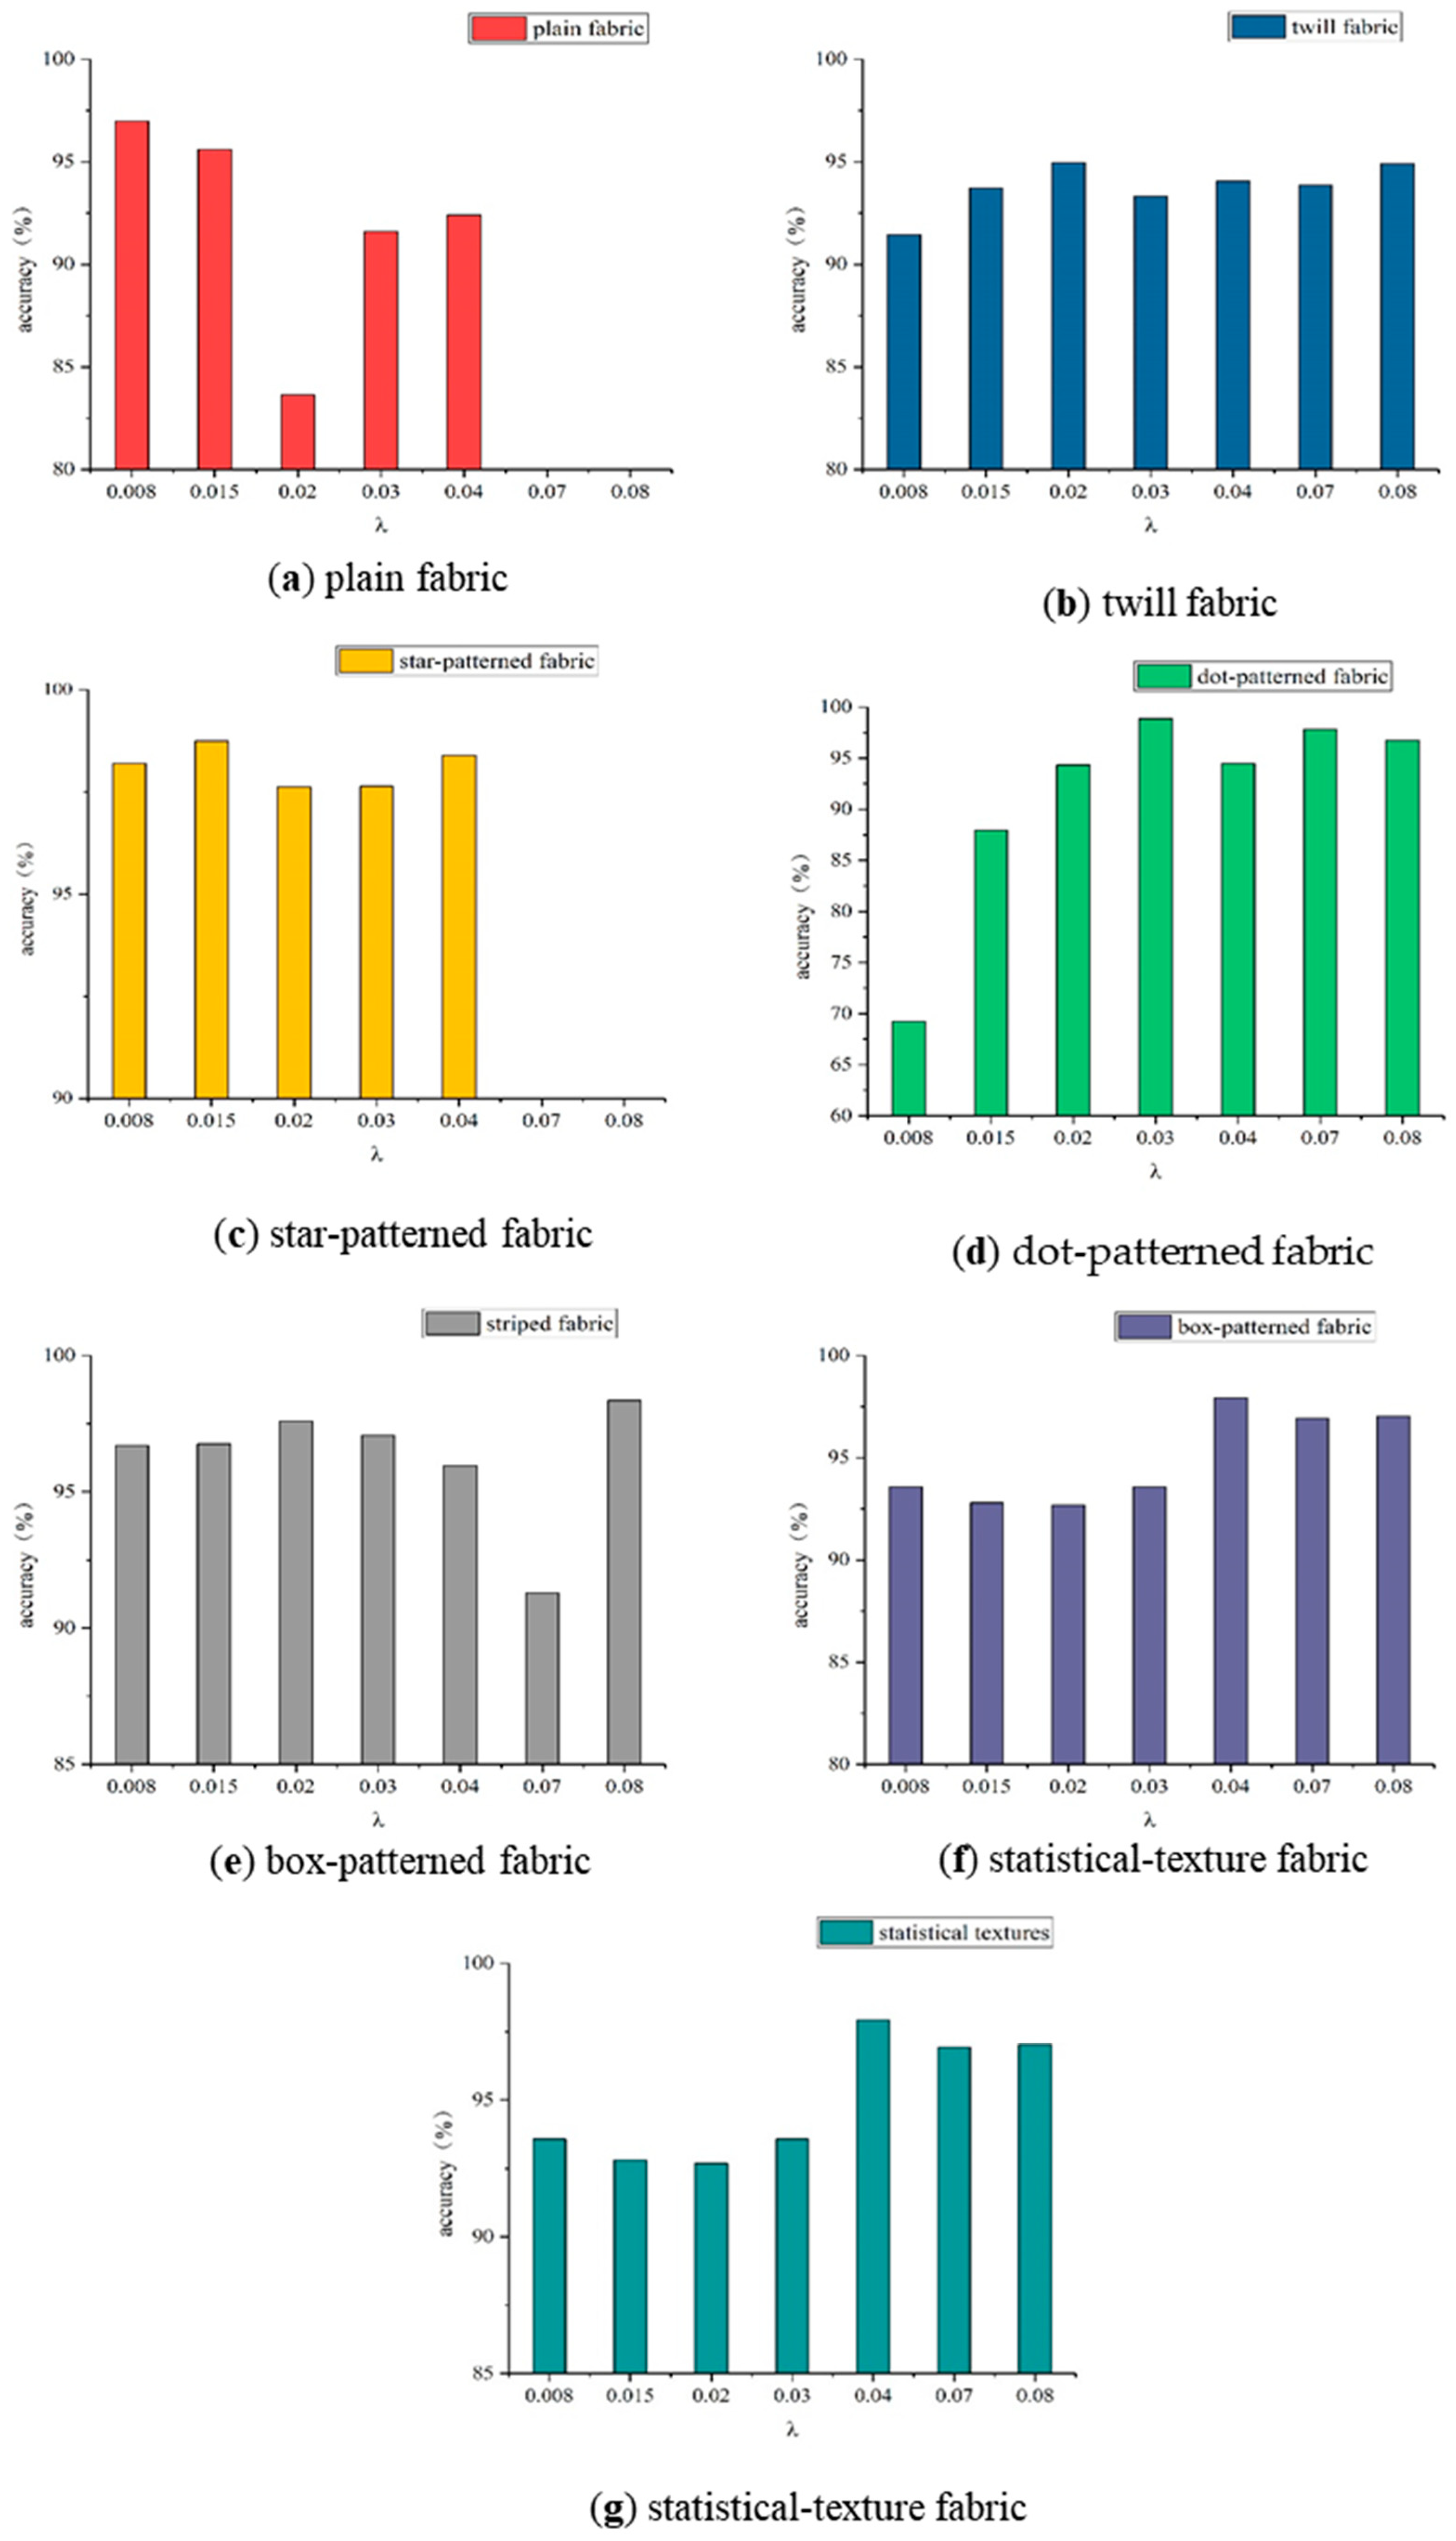
To verify the impact of value of parameter λ on various fabric types, the parameter λ is 0.008, 0.015, 0.02, 0.03, 0.04, 0.07, and 0.08 respectively, and the seven fabric types’ detection accuracies are presented by a bar chart as shown in Figure 8. The experiment proved that the number of λ selected should be between 0.008 and 0.08 to meet the requirements of various fabric types. As the Figure 8a,c shown, when λ is set between 0.07 and 0.08, the plain fabric and star-patterned fabric will be excessively smooth, so the accuracy rate cannot be detected.
4.2. Experimental Results
Figure 9 shows the results of plain fabric defect detection; it can be seen that the position and shape of fabric image defects have been successfully detected. Furthermore, nine twill fabric defects were tested, and the defect detection results are shown in Figure 10. The fabric defects were well detected; it reveals that the defection method can detect the twill fabric defects.
Star-patterned defects, such as linear defects and blob-shaped defects, are also successfully segmented using the proposed method, as shown in Figure 11. The results highlight the utility of our technique of accurate defect detection and segmentation. Our method can defect the box-patterned fabric defect, which includes broken ends, thick bars, and thin bars, as shown in Figure 12.
The Figure 13 shows a representative set of different types of defects in dot-patterned fabric obtained from a group of images. In addition, even in a complicated background with a pattern, striped fabric, and statistical-textures, our method also can achieve an outperform the results of others, as shown in Figure 14 and Figure 15. It can be seen that the proposed method can detect a variety of fabric samples with different defect types, shapes and textured backgrounds.
We further provide the computational time complexity of the proposed method, which is shown in Figure 16. We fit the curve. From the trend of the curve, the time complexity is , where N is the size of image.
4.3. Qualitative Comparison
We compared our method with other state-of-the-art detection methods, including the EADL method [5] and the automatic band selection method [6], and detection carried out by human inspectors (the defects are marked by experienced factory workers). In each process, we used the parameters suggested in the original papers and followed the instructions provided in the authors’ code distributions. The comparison results are shown in Figure 17, where the input original seven texture types’ fabric defect images are given in Figure 17a. From top to bottom, they are plain fabric, twill fabric, star-patterned fabric, box-patterned fabric, dot-patterned fabric, statistical-texture fabric, and striped fabric respectively. The columns in Figure 17b–e are the defection results by our method, the ground-truth images from segmentation carried out by human inspectors, the Tsai [6], and the EADL method. It is found that the detection results using the EADL method [5] are located accuracy than using the automatic band selection method [6]. Figure 17b is the detection result using our method, it can be seen that the detection results are consistent with those carried out by human inspectors and outperform other methods.
4.4. Quantitative Comparison
Besides visual qualitative comparisons, we also did quantitative comparisons. A group of metrics, including accuracy (ACC), true positive rate (TPR), false positive rate (FPR), and positive predictive value (PPV), were employed to quantify the accuracies of the other methods. A number of measurement metrics; namely, true positive (TP), false positive (FP), true negative (TN), and false negative (FN), should be calculated. Based on those parameters, accuracy is calculated as: ACC = (TP + TN)/(TP + FN + FP + TN); true positive rate: TPR = TP/(TP + FN); false positive rate: FPR = FP/(FP + TN); positive predictive value: PPV = TP/(TP + FP). For these evaluation indicators, the proposed L0 gradient minimization and fuzzy c-means can obtain higher ACC and PPV values, and lower TPR, FPR values.
We also adopted the intersection-over-union (IOU) to quantitatively evaluate the performance of different methods. For the segmentation task, IOU is defined as: IOU = TP/(TP + FN + FP). For intersection-over-Union (IOU), the ideal case is a ratio of 100%, which usually stipulates that when the IOU value is greater than 50%, the detection is considered correct (which is also taken into consideration in the detection).
Figure 18 illustrates the ACC, TPR, FPR, PPV, and IOU results of the plain fabric, twill fabric, star-patterned fabric, dot-patterned fabric, box-patterned fabric, striped fabric, and statistical-texture fabric. Our method achieves most of the high scores in 35 testing items. The proposed method is better than other methods in Figure 18a,c–e. As shown in Figure 18a, the ACC by the proposed method, for the plain fabric dataset, twill fabric dataset, the dot-patterned fabric dataset, box-patterned fabric dataset, and statistical-textures defect dataset, are 96.99%, 98.40%, 98.87%, 96.13%, and 97.63%, respectively. As shown in Figure 18b, the proposed method can obtain the lowest TPR value for the star-patterned fabric defect detection. Figure 18c shows that the FPR values of our method are almost smaller than other approaches. Figure 18d shows that our method obtains the highest PPV value for the twill fabric, box-patterned fabric, striped fabric, and statistical-texture fabric. Figure 18e clearly indicates that our method provides the optimal IOU for all types of fabric. Furthermore, it can be observed that the proposed method obtains higher ACC, PPV, and IOU values, and lower TPR, and FPR values. These results verify the effectiveness of our proposed method, which performed better than the EADL method [5] and the automatic band selection method [6].
Considering the fact that the captured fabric images are often affected by noise, light intensity, and blurring, we analyzed the robustness of each method in different conditions. Table 1 shows the detection results of different methods (the proposed method, the EADL method [5], and the automatic band selection method [6]) in noisy, luminously intense, and blurry conditions. According to Table 1, when signal-noise ratio (SNR) decreases gradually, the ACC and IOU can remain a high level, especially when SNR = 10 dB; then, ACC can remain around 0.85. It was shown that the proposed method is robust when dealing with noise. In addition, we found that when luminous intensity decreases 20% or increases 20%, ACC can remain above 0.90. When increasing the blur with a radius of 20, the ACC and IOU can remain at a high level.
The computational comparison result is shown in the Table 2, which reports the average computational time (in seconds) of four methods while processing plain, twill, star-patterned, dot-patterned, box-patterned, striped, and statistical fabrics. As can be seen from Table 2, our method is faster than the automatic band selection method [6] and human inspectors. Even though the EADL method is faster than our method, it has fatal limitations. Their method cannot segment defects, as shown in Figure 17d, and cannot maintain high accuracy, as shown in Figure 18a. From the average calculation speed of the algorithm, the method proposed in this paper takes less time in comparison with the other methods when detecting various types of textured fabrics. In addition, our method performed better than Pedro [5] in terms of TPR, FPR, and IOU.
5. Conclusions
We have proposed a novel method based on LGM and the FCM for fabric defect detection of a wide variety of textures. Extensive experimental results demonstrate that the proposed method could be applied to detect and segment fabric defects from a broad range of fabric defects datasets: Plain fabric, twill fabric, star-patterned fabric, dot-patterned fabric, box-patterned fabric, striped fabric, and statistical-texture fabric, with different defect types and shapes. It can achieve more accurate defect detection than other state-of-art competitors. Despite the effectiveness of the proposed method for fabric images with complicated patterns, it is still clumsy in computational time for detecting the defects. Our future work will be to improve our algorithm, to reduce the computational time in a real-time fabric defect detection system.
Author Contributions
H.Z. and J.M. conceived and designed the experiments; H.Z. performed the experiments; H.Z., J.J., and P.L. analyzed the data; H.Z. and J.M. wrote the paper.
Funding
This research is supported in part by National Natural Science Foundation of China under Grant No.61902302; in part by grants from the Shaanxi Provincial College of Science and Technology Youth Talent Support Project (Grant Number 20180115), the Science Research Program Funded by Shaanxi Provincial Education Department (Grant number 18JK0338), and the Youth Innovation Team of Shaanxi Universities.
Conflicts of Interest
The authors declare no conflict of interest.
References
- Wang, M.J.J.; Huang, C.L. Evaluating the eye fatigue problem in wafer inspection. IEEE Trans. Semicond. Manuf. 2004, 17, 444–447. [Google Scholar] [CrossRef]
- Ngan, H.Y.T.; Pang, G.K.H.; Yung, N.H.C. Automated fabric defect detection-A review. Image Vis. Comput. 2011, 29, 442–458. [Google Scholar] [CrossRef]
- Susan, S.; Sharma, M. Automatic texture defect detection using Gaussian mixture entropy modeling. Neurocomputing 2017, 239, 232–237. [Google Scholar] [CrossRef]
- Chen, L.C.; Papandreou, G.; Kokkinos, I.; Murphy, K.; Yuille, A.L. DeepLab: Semantic image segmentation with deep convolutional nets, atrous convolution, and fully connected crfs. IEEE Trans. Pattern Anal. Mach. Intell. 2018, 40, 834–848. [Google Scholar] [CrossRef] [PubMed]
- Navarro, P.J.; Fernández-Isla, C.; Alcover, P.M.; Suardíaz, J. Defect detection in textures through the use of entropy as a means for automatically selecting the wavelet decomposition level. Sensors 2016, 16, 1178. [Google Scholar] [CrossRef] [PubMed]
- Tsai, D.M.; Chiang, C.H. Automatic band selection for wavelet reconstruction in the application of defect detection. Image Vis. Comput. 2003, 21, 413–431. [Google Scholar] [CrossRef]
- Ngan, H.Y.T.; Pang, G.K.H. Novel method for patterned fabric inspection using Bollinger bands. Opt. Eng. 2016, 45, 087202. [Google Scholar]
- Ng, M.K.; Ngan, H.Y.T.; Yuan, X.; Zhang, W. Patterned fabric inspection and visualization by the method of image decomposition. IEEE Trans. Autom. Sci. Eng. 2014, 11, 943–947. [Google Scholar] [CrossRef]
- Danesh, M.; Khalili, K. Determination of tool wear in turning process using undecimated wavelet transform and textural features. Procedia Technol. 2015, 19, 98–105. [Google Scholar] [CrossRef]
- Li, P.F.; Zhang, H.H.; Jing, J.F.; Li, R.Z.; Zhao, J. Fabric defect detection based on multi-scale wavelet transform and Gaussian mixture model. J. Text. Inst. 2014, 106, 1–6. [Google Scholar] [CrossRef]
- Qian, W. Research on Fabric Defect Detection Based on Neural Network. Master’s Thesis, Donghua University, Shanghai, China, 2018. [Google Scholar]
- Li, Y.; Zhao, W.; Pan, J. Deformable patterned fabric defect detection with fisher criterion-based deep learning. IEEE Trans. Autom. Sci. Eng. 2017, 14, 1256–1264. [Google Scholar] [CrossRef]
- Huang, X.; Chen, L.; Tian, J.; Zhang, X. Blind image noise level estimation using texture-based eigenvalue analysis. Multimed. Tools Appl. 2016, 75, 2713–2724. [Google Scholar] [CrossRef]
- Dutta, S.; Pal, S.K.; Sen, R. On-machine tool prediction of flank wear from machined surface images using texture analyses and support vector regression. Precis. Eng. 2015, 43, 34–42. [Google Scholar] [CrossRef]
- Hoseini, E.; Farhadi, F.; Tajeripour, F. Fabric defect detection using auto-correlation function. Int. J. Comput. Theory Eng. 2013, 5, 114–117. [Google Scholar] [CrossRef]
- Zhang, E.H.; Zhang, Y.; Duan, J.H. Color inverse half- toning method with the correlation of multi-color components based on extreme learning machine. Appl. Sci. 2019, 9, 841. [Google Scholar] [CrossRef]
- Singh, S.; Kaur, M. Machine vision system for automated visual inspection of tile’s surface quality. IOSR J. Eng. 2012, 2, 429–432. [Google Scholar] [CrossRef]
- Chetverikov, D. Pattern regularity as a visual key. Image Vis. Comput. 2000, 18, 975–985. [Google Scholar] [CrossRef]
- Narendra, V.G.; Hareesh, K.S. Study and comparison of various image edge detection techniques used in quality inspection and evaluation of agricultural and food products by computer vision. Int. J. Agric. Biol. Eng. 2011, 4, 83–90. [Google Scholar]
- Yang, X.Z.; Pang, G.K.H.; Yung, N.H.C. Discriminative fabric defect detection using directional wavelets. Opt. Eng. 2002, 41, 3116–3126. [Google Scholar] [CrossRef]
- Kuo, C.J.; Su, T.L. Gray relational analysis for recognizing fabric defects. Text. Res. J. 2003, 73, 461–465. [Google Scholar] [CrossRef]
- Kuo, C.F.J.; Lee, C. A back-propagation neural network for recognizing fabric defects. Text. Res. J. 2003, 73, 147–151. [Google Scholar] [CrossRef]
- Li, M.; Cui, S.; Xie, Z. Application of Gaussian mixture model on defect detection of print fabric. J. Text. Res. 2015, 36, 94–98. [Google Scholar]
- Bodnarova, A.; Bennamoun, M.; Kubik, K.K. Defect detection in textile materials based on aspects of the HVS. In Proceedings of the 1998 IEEE International Conference on Systems, Man, and Cybernetics (Cat. No.98CH36218), San Diego, CA, USA, 14 October 1998. [Google Scholar]
- Ngan, H.Y.H.; Pang, G.K.H. Regularity analysis for patterned texture inspection. IEEE Trans. Autom. Sci. Eng. 2009, 6, 131–144. [Google Scholar] [CrossRef]
- Kang, X.J.; Zhang, E.H. A universal defect detection approach for various types of fabrics based on the Elo-rating algorithm of the integral image. Text. Res. J. 2019. [Google Scholar] [CrossRef]
- Xu, L.; Lu, C.; Xu, Y.; Jia, J. Image smoothing via L0 gradient minimization. ACM Trans. Graph. 2011, 30, 1–12. [Google Scholar]
- Yang, M.S.; Nataliani, Y. Robust-learning fuzzy c-means clustering algorithm with unknown number of clusters. Pattern Recognit. 2017, 71, 45–59. [Google Scholar] [CrossRef]
- Ding, Y.; Fu, X. Kernel-Based fuzzy c-means clustering algorithm based on genetic algorithm. Neurocomputing 2015, 188, 233–238. [Google Scholar] [CrossRef]
Figure 1.
Failure of the BB and ID methods for detecting defects. (a) Defect sample, (b) detection result using the BB method, and (c) detection result using the ID method.
Figure 1.
Failure of the BB and ID methods for detecting defects. (a) Defect sample, (b) detection result using the BB method, and (c) detection result using the ID method.

Figure 2.
Various textures of fabric images. (a) Plain fabric, (b) twill fabric, (c) star-patterned fabric, (d) dot-patterned fabric, (e) statistical-texture fabrics, (f) box-patterned fabric, and (g) striped fabric.
Figure 2.
Various textures of fabric images. (a) Plain fabric, (b) twill fabric, (c) star-patterned fabric, (d) dot-patterned fabric, (e) statistical-texture fabrics, (f) box-patterned fabric, and (g) striped fabric.

Figure 3.
The framework of the proposed method.

Figure 4.
Smoothed fabric defect image using L0 gradient minimization (LGM). (a) Fabric defect image; (b) Smoothed fabric defect image.
Figure 4.
Smoothed fabric defect image using L0 gradient minimization (LGM). (a) Fabric defect image; (b) Smoothed fabric defect image.

Figure 5.
Detection effect of LGM. (a) Mesh diagram of fabric defect image; (b) Mesh diagram of smoothed fabric defect image.
Figure 5.
Detection effect of LGM. (a) Mesh diagram of fabric defect image; (b) Mesh diagram of smoothed fabric defect image.

Figure 6.
Results of fabric defect based on LGM.

Figure 7.
The optimum parameters about various fabric types.

Figure 8.
The accuracy bar chart of various fabric types’ detection under the number of different parameters λ.
Figure 8.
The accuracy bar chart of various fabric types’ detection under the number of different parameters λ.

Figure 9.
Plain fabric defect of detection results.

Figure 10.
Twill fabric defect of detection results.

Figure 11.
Star-patterned fabric defect of detection results.

Figure 12.
Box-patterned fabric defect of detection results.

Figure 13.
Dot-patterned fabric defect of detection results.

Figure 14.
Striped fabric defect of detection results.

Figure 15.
Statistical-texture defect of detection results.

Figure 16.
The computational time complexity curve line.

Figure 17.
Various texture fabric defect detection results using different methods (a). Different fabric type defects (b). Our method (c) carried out by human inspectors. (d) The automatic band selection method [6]. (e) The EADL method [5].

Figure 18.
Inspection results of defect inspection methods with different methods on different types of fabric.
Figure 18.
Inspection results of defect inspection methods with different methods on different types of fabric.


Table 1.
Experimental results with different conditions.
| Condition | Ours | Pedro [5] | Tsai [6] | ||||
|---|---|---|---|---|---|---|---|
| ACC | IOU | ACC | IOU | ACC | IOU | ||
| Normal | 0.9673 | 0.7575 | 0.9153 | 0.7707 | 0.9349 | 0.6599 | |
| SNR | 20 dB | 0.9489 | 0.6512 | 0.8346 | 0.7015 | 0.8773 | 0.5973 |
| 15 dB | 0.8976 | 0.6217 | 0.7793 | 0.6584 | 0.8315 | 0.5517 | |
| 10 dB | 0.8532 | 0.5576 | 0.7544 | 0.5542 | 0.7966 | 0.5044 | |
| Luminous intensity | +20% | 0.9245 | 0.6851 | 0.8972 | 0.6645 | 0.8645 | 0.5754 |
| −20% | 0.9097 | 0.6544 | 0.8733 | 0.6497 | 0.8142 | 0.5945 | |
| Blur | Radius = 20 | 0.9456 | 0.6956 | 0.8546 | 0.6701 | 0.8599 | 0.5482 |
© 2019 by the authors. Licensee MDPI, Basel, Switzerland. This article is an open access article distributed under the terms and conditions of the Creative Commons Attribution (CC BY) license (http://creativecommons.org/licenses/by/4.0/).
Share and Cite
MDPI and ACS Style
Zhang, H.; Ma, J.; Jing, J.; Li, P. Fabric Defect Detection Using L0 Gradient Minimization and Fuzzy C-Means. Appl. Sci. 2019, 9, 3506. https://doi.org/10.3390/app9173506
AMA Style
Zhang H, Ma J, Jing J, Li P. Fabric Defect Detection Using L0 Gradient Minimization and Fuzzy C-Means. Applied Sciences. 2019; 9(17):3506. https://doi.org/10.3390/app9173506
Chicago/Turabian StyleZhang, Huanhuan, Jinxiu Ma, Junfeng Jing, and Pengfei Li. 2019. "Fabric Defect Detection Using L0 Gradient Minimization and Fuzzy C-Means" Applied Sciences 9, no. 17: 3506. https://doi.org/10.3390/app9173506
Note that from the first issue of 2016, this journal uses article numbers instead of page numbers. See further details here.