Classification of Inter-Floor Noise Type/Position Via Convolutional Neural Network-Based Supervised Learning †


1
Department of Naval Architecture and Ocean Engineering, Seoul National University, Seoul 08826, Korea
2
Research Institute of Marine Systems Engineering, Seoul National University, Seoul 08826, Korea
*
Author to whom correspondence should be addressed.
†
This article is a re-written and extended version of “Classification of noise between floors in a building using pre-trained deep convolutional neural networks” presented at 16th International Workshop on Acoustic Signal Enhancement (IWAENC 2018), Tokyo, Japan on 20 September 2018.
Appl. Sci. 2019, 9(18), 3735; https://doi.org/10.3390/app9183735
Submission received: 9 August 2019
/
Revised: 4 September 2019
/
Accepted: 4 September 2019
/
Published: 7 September 2019
(This article belongs to the Section Acoustics and Vibrations)
Abstract
:Inter-floor noise, i.e., noise transmitted from one floor to another floor through walls or ceilings in an apartment building or an office of a multi-layered structure, causes serious social problems in South Korea. Notably, inaccurate identification of the noise type and position by human hearing intensifies the conflicts between residents of apartment buildings. In this study, we propose a robust approach using deep convolutional neural networks (CNNs) to learn and identify the type and position of inter-floor noise. Using a single mobile device, we collected nearly 2000 inter-floor noise events that contain 5 types of inter-floor noises generated at 9 different positions on three floors in a Seoul National University campus building. Based on pre-trained CNN models designed and evaluated separately for type and position classification, we achieved type and position classification accuracy of 99.5% and 95.3%, respectively in validation datasets. In addition, the robustness of noise type classification with the model was checked against a new test dataset. This new dataset was generated in the building and contains 2 types of inter-floor noises at 10 new positions. The approximate positions of inter-floor noises in the new dataset with respect to the learned positions are presented.
1. Introduction
1.1. Research Motivation
In apartment buildings, noise generated by residents or home appliances, called inter-floor noise, travels through structures and annoys residents on other floors [1,2,3,4]. In Korea, many people are exposed to inter-floor noise. Approximately 51.3% of residential buildings are multi-dwelling units, and 72.7% of them have at least five floors [5]; these buildings are classified as apartment buildings. Accordingly, the number of civil complaints of inter-floor noises has become a serious social issue in Korea [6]. To mediate disputes between residents in apartment buildings, the Korean government established the Floor Noise Management Center in 2012. The center is controlled by the Korea Environment Corporation under the Ministry of Environment. From 2012 to March 2018, the center received 119,500 complaints of inter-floor noise and visited 28.1% of victims to identify inter-floor noise [7].
It is difficult for humans to precisely identify the type/position of inter-floor noise, and some conflicts between residents have originated from this incorrect estimation of noise type/position. If possible, correctly identifying the type/position of inter-floor noise with a personal device can help prevent or reduce conflicts. Moreover, correctly identifying inter-floor noise type/position is considered to be the first step in solving the noise problem.
1.2. Related Literature
Related research in the literature [8,9,10] on indoor footstep localization is in the early stages, and a small number of reports are available [8]. These prior publications were motivated by indoor occupant localization for energy management, understanding occupant behavior, facility security, and other smart building applications. In the literature, a wave induced by a footstep in a building structure is considered to be a dispersive plate wave with signal distortion. Bahroun et al. [9] introduced the perceived propagation velocity, which reflects the dispersive nature of a wave propagating through a concrete slab. It was shown through an experiment that the perceived propagation velocity decreases as the wave propagates away from the source, which limits the performance of algorithms based on time difference of arrival (TDOA). To overcome this, a localization method that uses only the sign of the measured TDOA was proposed. Poston et al. [8] proposed a footstep localization method with enhanced TDOA, where two footstep-to-sensor interaction types were identified. Mirshekari et al. [10] used a decomposition-based dispersion mitigation technique to overcome the dispersive nature and enhance the localization performance. Footstep-induced vibrations were measured using accelerometers [8,9] or geophones [10] with multiple channels. Other related research is discussed in [11,12].
1.3. Research Approach
In this paper, we introduce an inter-floor noise type/position classification algorithm based on supervised learning. This method classifies a given inter-floor noise into a type and position. An intuitive explanation of the method is as follows: (1) inter-floor noises are generated and recorded with a single microphone, (2) the dataset is labeled and converted to time-frequency (TF) patches, (3) a convolutional neural network (CNN)-based model is trained on the TF patches, and (4) a new inter-floor noise is classified into a noise type/position with the trained model.
One unique feature of the method is that inter-floor noise measured with a single microphone is used to determine the position of the noise source rather than using signals over accelerometers or geophones with multiple channels. Instead of estimating the TDOA between multiple accelerometers or geophones, a signal over a single microphone with a sufficient duration is converted to a TF-patch and used as an input. The TF-patch might encode the dispersive nature of the plate wave, e.g., a change in propagation velocity or other unidentified features. At this point, the method can be considered to learn the response of a building observed with a single sensor for a given excitation [8].
Because this approach determines the type/position of a given inter-floor noise using a signal over a single microphone via supervised learning, there are some inherent limitations. Although sub-meter localization accuracy shown in the literature might not be necessary for inter-floor noise type/position classification, using a single microphone might provide an estimated position of a noise source with lower accuracy than using multiple densely installed sensors. The machine learning approach also requires collecting data from every building structure.
Despite these limitations, our method has some clear advantages. (1) A microphone embedded in a smartphone can be used for classifications. If the method is included in a mobile application, many people can use it to identify noises. (2) In the literature [8,9,10], only footstep-induced vibration is considered herein, whereas this method can be used to identify the type of noise, as shown in Section 3.4 and Section 4.1. (3) Management and implementation of a single sensor is relatively easier than using multiple sensors.
1.4. Contributions of this Paper
The primary contributions of this paper can be summarized as follows. First, a dataset with 2950 inter-floor noises was built as part of this project. These noises can be classified into 5 noise types and 19 positions. Second, we propose a supervised learning-based inter-floor noise type/position classifier that uses a signal from a single microphone. Third, our method is an acoustic approach, whereas accelerometers or geophones were used in other studies.
The remainder of the paper is organized as follows. The inter-floor noise dataset is explained in Section 2. The inter-floor type/position classification via supervised learning is described in Section 3. the approach is evaluated on a newly generated inter-floor noise dataset in Section 4, and the paper is summarized in Section 5.
2. Inter-Floor Noise Dataset
An inter-floor noise dataset (SNU-B36-50) was built in our previous study on inter-floor noise type/position classification [13]. The inter-floor noise dataset is available at [14].
2.1. Selecting Type and Position of Noise Source
The inter-floor noise dataset was designed based on a report provided by the Floor Noise Management Center [7]. From 2012 to March 2018, the center received 119,500 complaints from residents suffering from inter-floor noise, and 28.1% of victims were visited to identify inter-floor noise. The identified noise types and their portions are footsteps (71.0%), hammering (3.90%), furniture (3.3%), home appliances (vacuum cleaner, laundry machines, and television) (3.3%), doors (2.0%), and so on. Unidentified or unrecorded noise types account for 10.1%. 79.4% of the identified inter-floor noises originated from residents on the upper floor, while 16.3% of the identified inter-floor noises originated from residents on the lower floor [7].
Based on the report, the top 4 noise types occupying 92.9% of the identified noise types were selected for classification. Because 95.7% of inter-floor noises were identified as noises from the upper floor and the lower floor, we focused on inter-floor noises generated on the two adjacent floors. In addition to these, inter-floor noises on the middle floor were also collected to check whether our model can distinguish noises generated on the same floor from noises generated on other floors.
Figure 1 shows 5 inter-floor noise types included in the dataset. They are a medicine ball falling to the floor from a height of 1.2 m (MB), a hammer dropped from 1.2 m above the floor (HD), hammering (HH), dragging a chair (CD), and running a vacuum cleaner (VC). Generating reproducible footstep noises is very challenging. Furthermore, it could hurt the person who generates them. Thus, an impact ball, a bang machine (a tire), or a tapping machine was usually used to produce impulsive footstep noise dominated by low-frequency components [15]. In the dataset, a 2 kg, 0.2 m diameter medicine ball, which generates noises with a frequency characteristic similar to that generated when an impact ball is dropped, was used to mimic footsteps. Because it is difficult to transport and install a laundry machine and television, only a vacuum cleaner was used to generate noise from home appliances.
2.2. Generating and Collecting Inter-Floor Noise
The inter-floor noise dataset was collected in building 36 at Seoul National University. The building is reinforced concrete frame structure. From statistics [16,17], this structure is the most widely used in modern buildings in South Korea. Our experimental building is partitioned with concrete walls. The corridor where the noises were generated is a slab covered by concrete terrazzo tiles.
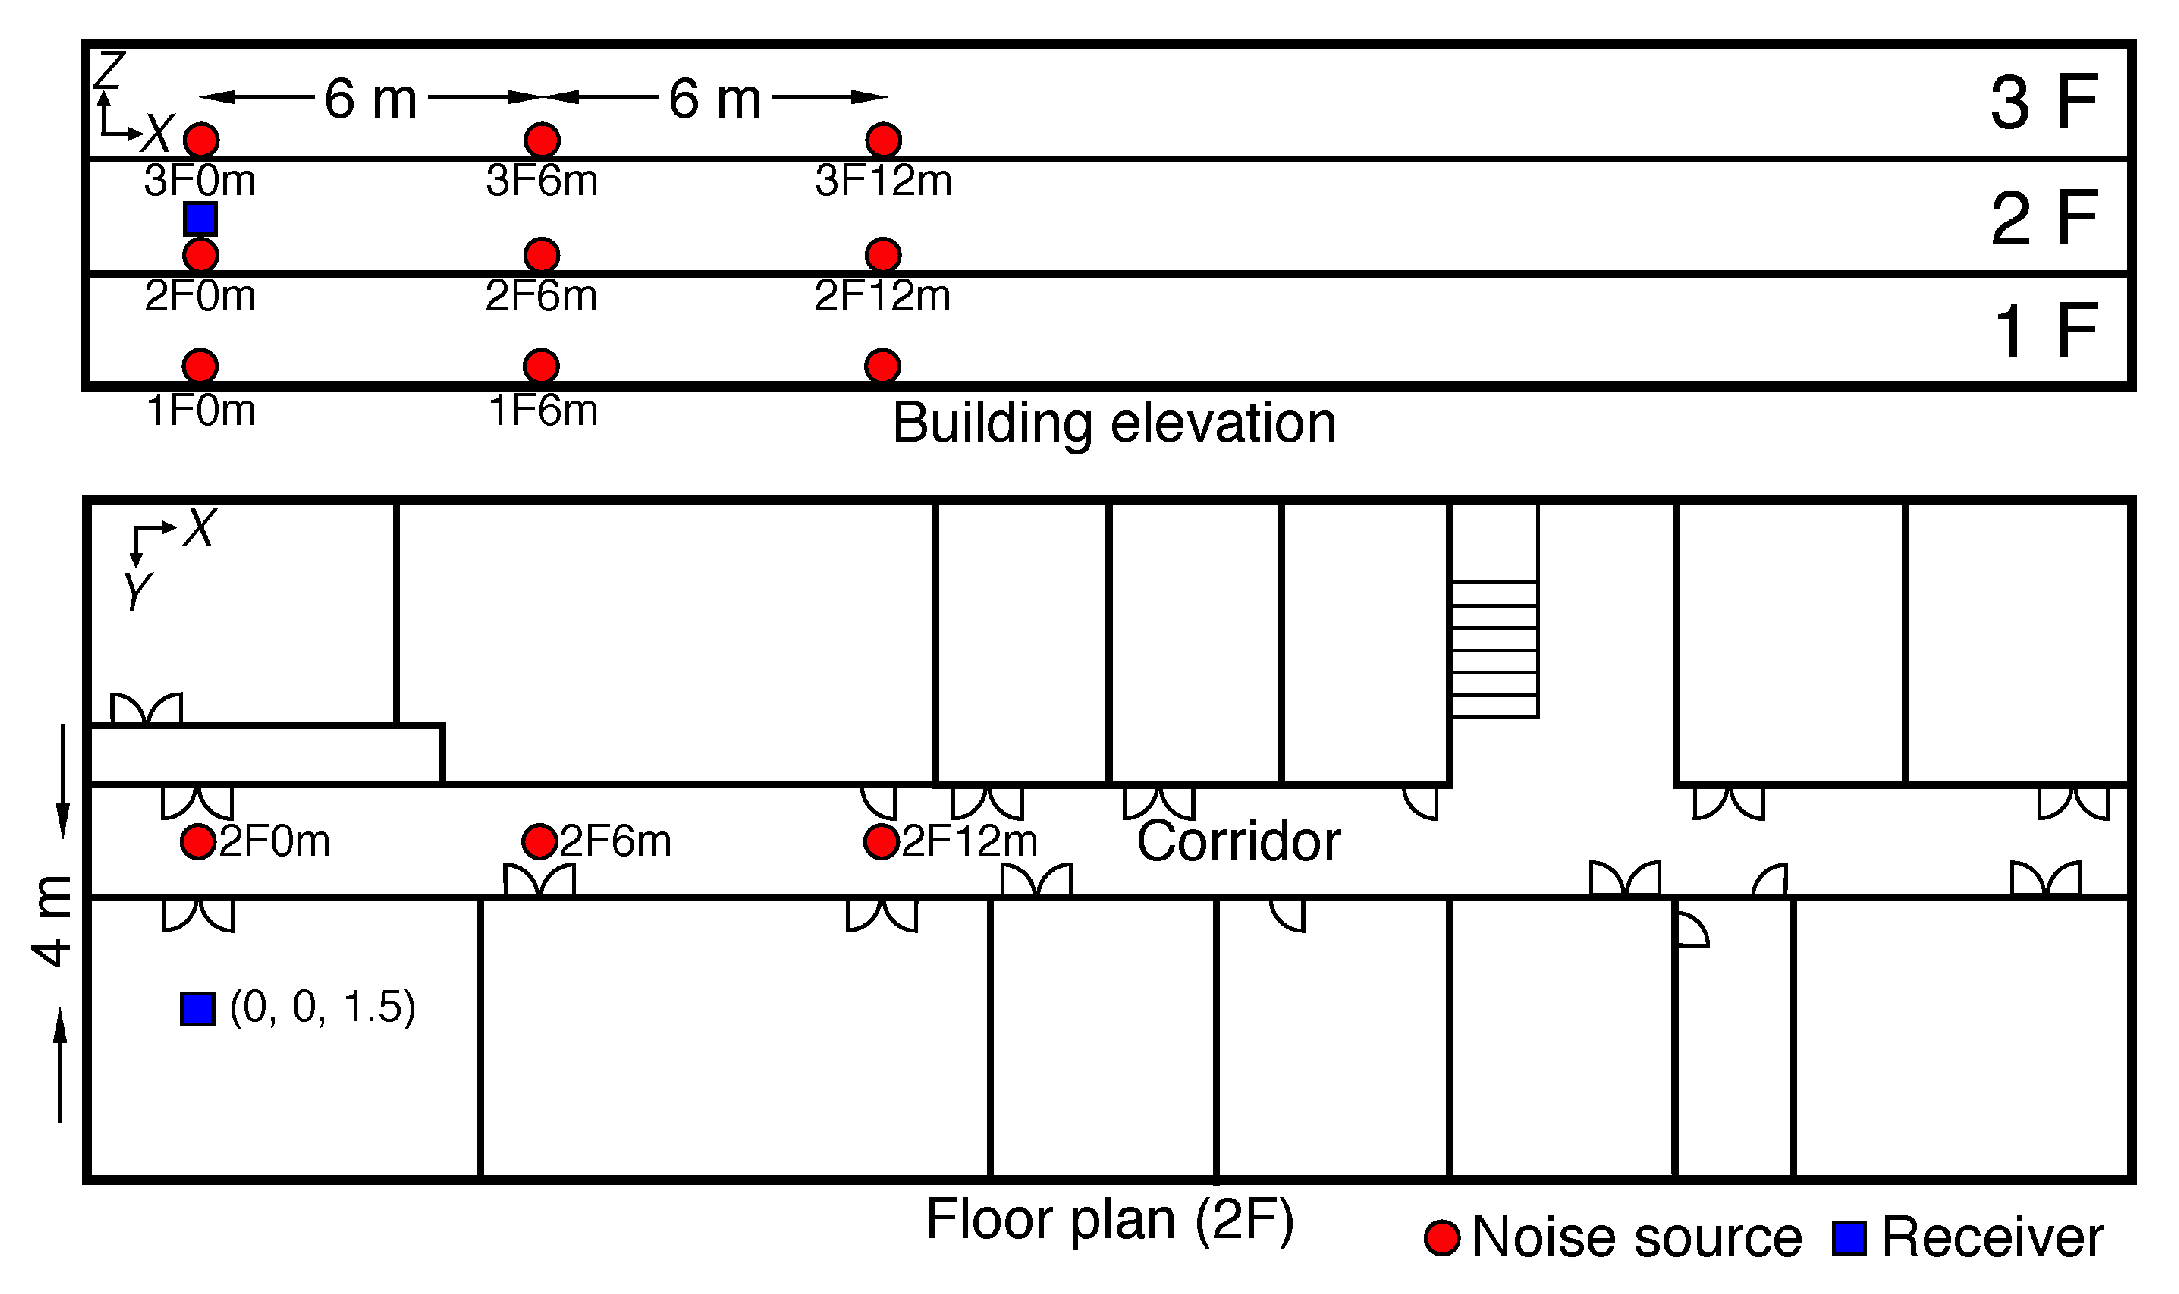
Figure 2 illustrates the noise source and receiver arrangement for generating and recording inter-floor noise. The 9 solid circles indicate selected positions for noise sources. The noise sources are separated by 6 m along the X axis. The notation around the noise sources indicate the floor and distance along the X axis, i.e., 2F0m denotes that position of a noise source is on the second floor and the distance from the origin along the X axis is 0 m. A single microphone in a smartphone (Samsung Galaxy S6 [18]) was used as a receiver to record inter-floor noises. The receiver was installed on 2 F to receive inter-floor noises from the upper and lower floors. The solid square in Figure 2 indicates the position of the receiver.
Photo of the corridor and the location of the receiver are shown in Figure 3. Inter-floor noises were sampled at = 44,100 Hz for approximately 5 s. 50 inter-floor noises were generated at each position and for each noise type. Because VC on 1 F and 3 F were barely audible at the receiver position, VC was generated only on 2 F. Table 1 shows the number of data in the inter-floor noise dataset.
One distinguishing feature of the dataset is that each inter-floor noise can be labeled as a noise type and a position of the noise source. Thus, this dataset can be used to learn the type and position of various noise sources in a building.
3. Supervised Learning of Inter-Floor Noises
In this section, we present a supervised learning method for inter-floor noise type/position classification using a CNN.
3.1. Convolutional Neural Networks for Acoustic Scene Classification
The superiority of using a CNN for image classification has already been discussed in the ImageNet Large Scale Visual Recognition Competition (ILSVRC) [19]. Following the successful use of a CNN for image classification, CNNs were also used for acoustic scene classification (ASC). CNN architectures used for ASC are fundamentally the same as those used in image classification. Audio samples were converted to 2-dimensional features and fed into the input instead of images.
The uses of CNNs for ASC are mostly focused on environmental sound classification [20,21] and automatic species classification of animal life [22,23]. These two areas were also the main interests in the Detection and Classification of Acoustic Scenes and Events challenge (DCASE) 2018 [24]. We extend these areas of CNNs used to inter-floor noise type/position classification.
3.2. Network Architecture
Figure 4 shows the architecture of the inter-floor noise type/position classifier. The classifier maps an inter-floor noise to a type/position through (1) conversion of an inter-floor noise into a log-scaled Mel-spectrogram, (2) input channels, (3) CNN, (4) adaptation layer, and (5) softmax classifier.
In [25], state-of-the-art CNNs for image classification in ILSVRC are examined and applied to audio classification. The models employed in the paper are AlexNet [26], VGGNet [27], and ResNet [28]. AlexNet was the first CNN-based winner in ILSVRC. VGGNet showed better image classification performance with the ImageNet dataset than AlexNet in ILSVRC 2014. ResNet was the winner of ILSVRC 2015 and showed better image classification performance than the other two models. VGGNet and ResNet can be classified based on the number of layers (depth) of their neural networks. VGG16 and ResNet V1 50, which are considered basic models from each group, were used in this study.
The inter-floor noises are converted to log-scaled Mel-spectrograms using LibROSA [29] to represent audio samples in 2 dimensions with size of , where H and W denote the height and the width, respectively. In the literature [20,21,25,30,31,32], a spectrogram, log-scaled Mel-spectrogram, and Mel-frequency cepstral coefficient are used as input features in ASC. They represent a signal in the TF domain and are acceptable CNN inputs. In our previous study [13], using a log-scaled Mel-spectrogram provided the best performance with the inter-floor noise dataset. Thus, we used a log-scaled Mel-spectrogram in this study.
A log-scaled Mel-spectrogram is obtained through the following steps. First, a signal is extracted from an audio clip in the inter-floor noise dataset. The sample length l is set to 132,300 samples (3 s in length). Second, is converted to a magnitude of short time Fourier transforms using a 2048 points fast Fourier transform with window size of and the same hop size, where rounds to the next largest integer. Third, a Mel-spectrogram is obtained using
where is a Mel-filter bank with frequency range of . This converts frequency scale of to the Mel-scale. Finally, is converted to a log-scaled Mel-spectrogram
where m is the largest element in . is given from the input size for a CNN. For example, VGG16 has input size of . Since the three CNNs (AlexNet, VGG16, and ResNet V1 50) are designed for image classification, they have 3 input channels (BGR). To take advantage of the knowledge learned from a large dataset, the weights between the three input channels and the following layer are preserved instead of modifying the input channels to a single channel. Consequently, is supplied to all the channels. Potential of this method against the inter-floor noise dataset was shown in [13] via performance comparison between a CNN with one input channel and VGG16 without knowledge transfer.
The three CNNs contain millions of learnable weights. Given the sparsity of the inter-floor noise dataset, it is difficult to train models with many weights. In such conditions, a CNN can be trained using transfer learning, as suggested in [33]. Transfer learning initializes a CNN with weights that are pre-trained on a large dataset (source) and fine-tunes them on a target dataset. The method assumes that the internal layers of a CNN can extract mid-level descriptors from a source that explain the distribution of the source. The distribution of a target dataset can be learned by sharing the mid-level descriptors [33,34]. In this study, a large image dataset is used as source for training a CNN via transfer learning. Usually, image and sound representations are considered different. However, low-level notions of images [34] such as edges and shapes can be found in and changes of lighting can be comparable to acoustic pressure changes in . Hence, can be considered to be an image with size of and the descriptors of the source could be shared to learn the distribution of the target. This approach for ASC can be found in [35,36].
The weights of the three CNNs are initialized using weights that are pre-trained on ImageNet (source). The pre-trained weights used in this study are from [37] for AlexNet and VGG16, and from [38] for ResNet V1 50. Because the three CNNs are designed for ILSVRC, each output from the three CNNs have size of I = 1000. The adaptation layer reduces the number of output dimensions in the lower layer to C, where C is the number of the inter-floor noise types/positions. The weights between the output of the CNNs and the adaptation layer are randomly drawn from a normal distribution with a fixed standard deviation of 0.01. This initialization is used in [26,27,39]. The bias is initialized with 1, as in [26].
In a classification problem, the output values are normalized using a softmax function (i.e., softmax classifier) to convert the output elements to pseudo probabilities. For a given , the softmax function is defined as
Let be a c-th output node of the adaptation layer
where is a weight between the i-th node of the former layer and c-th node of the adaptation layer. The predicted probabilities of given inter-floor noises with C type/position categories are . The loss function L selected for optimization of three CNNs is cross entropy loss and -regularization of
where is a regularization strength and is a one-hot encoded true label.
3.3. Evaluation
The performance of the three CNNs was evaluated using 5-fold cross validation. 5-fold cross validation divides the inter-floor noise dataset into 5 subsets of equal size. A model is optimized on a zero-centered training set , which is composed of the 4 subsets. The optimized model is validated on the remaining set , which is zero centered on the mean value of the training sets. These steps are repeated for the entire validation set.
Performance of a CNN model on a dataset can be measured by finding the minimum of
where is the optimal hyperparameter pair [40]. with smaller provides better performance. is composed of the optimal regularization strength and the optimal learning rate . The size of the hidden layer, the number of hidden units, and an activation function are not considered to be they are already decided by .
was estimated via random search
as introduced in [40] with 30 epochs. and () are generated log-uniformly from to . The weights of the CNN are optimized via mini-batch gradient descent (GD) to minimize L. The mini-batch size was set to 39. The CNNs and optimization were implemented with TensorFlow [38] and available at [41].
In the remaining subsections, inter-floor noises were classified into type/position using the three CNNs. The performance of the three CNNs were measured and compared. Type and position were separately considered in Section 3.4 and Section 3.5, respectively.
3.4. Type Classification Results
The inter-floor noises in the dataset were labeled into the following type categories: MB, HD, HH, CD, and VC. The weights of the three CNNs with estimated optimal parameters were optimized to minimize L using GD for 30 epochs. This process is sufficient to minimize .
Table 2 shows the accuracy of type classification of the three CNNs using 5-fold cross validation. The first column in the table shows the name of the CNNs, and the first row of the table shows the 5 categories. VGG16 outperforms ResNet V1 50 for all categories. The performance of VGG16 is the same as that of AlexNet for 3 categories (HD, HH, and VC) and is slightly better for the remaining categories. All types of inter-floor noises are classified correctly using VGG16 with less than 1% error.
3.5. Position Classification Results
The inter-floor noises in the dataset were labeled into the following position categories: 1F0m, 1F6m, 1F12m, 2F0m, 2F6m, 2F12m, 3F0m, 3F6m, and 3F12m. The weights of the three CNNs with estimated optimal parameters were optimized to minimize L using GD for 50 epochs. This process is sufficient to minimize .
The accuracy of position classification with the three CNNs was evaluated using 5-fold cross validation. The accuracies are arranged in Table 3. The first column of the table shows the name of the three CNNs, and the first row of the table shows the 9 categories.
In position classification, VGG16 outperforms the other models, except for categories 2F and 3F0m. All models show comparatively poor performance for positions 1F0m and 1F6m. The models seem to confuse these two positions. The confusion in the position classification can be seen in Figure 5.
If confusion between positions on the same floor are ignored, the classification accuracy with the three CNNs increases. Table 4 shows the floor classification accuracy with the three CNNs. VGG16 shows an accuracy of 99.5% for floor classification.
Summarizing the results, our approach to type/position classification based on the three adapted CNNs with knowledge transfer were compared. The CNNs showed feasibility on type/position classification of inter-floor noises in the building. VGG16 showed the best performance on both type/position classification.
4. Type/Position Classification of Inter-Floor Noises Generated on Unlearned Positions
Inter-floor noises generated from 10 new positions in the same building are evaluated in this section. Their type/position are classified using VGG16, which was found to be the best performing model, as shown in Section 3.4 and Section 3.5. Through these steps, we attempt to address two questions related to the robustness of the model: (1) Can the model classify the type of the new inter-floor noise data correctly? (2) If an inter-floor noise is generated from an unlearned position, can the model classify the new data near the learned position?
These questions were investigated with a sparse dataset containing 1000 newly generated inter-floor noises. Figure 6 illustrates the noise source and receiver arrangement for generating and recording new inter-floor noises. The 10 circles in the grid pattern show the selected positions. The noise sources are 1 m apart along the X axis on 3 F, excluding the learned positions 3F0m, 3F6m, and 3F12m. MB and HH were selected and noise sources were finely positioned on 3 F. MB and HH are the top 2 noise types among the identified inter-floor noise types and 79.4% of noise source positions were identified on 3 F by the Floor Noise Management Center [7]. Table 5 shows the number of data in the new inter-floor noise dataset. This dataset is available at [42].
Classification of the new inter-floor noises into the 5 noise types and classification of the new inter-floor noises into the 9 learned positions are described in Section 4.1 and Section 4.2, respectively.
4.1. Type Classification of Inter-Floor Noises Generated from Unlearned Positions
To address the first question in Section 4, the optimized VGG16 with using noise type labels in Section 3.4 was evaluated against the new dataset. Because type classification with the model was evaluated using 5-fold cross validation in Section 3.4, there exists a model for each fold. Type classification accuracy was measured as follows: (1) The new inter-floor noise dataset with noise type labels was converted to . (2) zero centered on the mean value of was classified into type categories using for all models. (3) The average type classification accuracy was calculated.
4.2. Position Classification of Inter-Floor Noises Generated from Unlearned Positions
To address the second question in Section 4, the optimized VGG16 with using the position labels in Section 3.5 was evaluated on the new dataset. Because position classification with the model was evaluated using 5-fold cross validation in Section 3.5, there exists a model for each fold. and are mutually exclusive in the position domain, thus position classification accuracies cannot be quantified, but position classification results of into the learned 9 positions can be visualized. Position classification was evaluated as follows: (1) The new inter-floor noise dataset with position labels was converted to . (2) zero centered on the mean value of was classified into position categories using for all models. (3) Average position classification results were calculated and drawn in a confusion matrix. An average can be used to check the concentration of classification results into the three learned positions on 3 F.
Figure 7 shows the confusion matrix for position classification results. The vertical axis shows position labels of , and the horizontal axis shows position labels of . The value in each cell is an average of the corresponding classification results. Although the position classification results cannot be quantified, floor classification results can be quantified from the confusion matrix. One can see that 98.8% of the classifications are concentrated at the three learned positions near their true positions on 3F. This shows that is robust against position changes on 3 F.
Summarizing the results of the type/position classification, VGG16 showed the robustness to the inter-floor noises with the position errors. The tests validate the applicability of the proposed method to probable situations where almost of inter-floor noises as an input of the classifier are generated at unlearned positions.
5. Summary and Future Study
A CNN-based supervised learning method for classifying inter-floor noise types and positions is proposed in this paper. An inter-floor noise dataset was used to evaluate the proposed method. The dataset was built based on a report by the Floor Management Center. State-of-the-art CNNs for image classification (AlexNet, VGG16, and ResNet V1 50) were adapted and used for noise classification. The inter-floor noises were converted to log-scaled Mel-spectrograms and used as the input to the CNNs. The weights of each CNN were initialized with weights that were pre-trained on ImageNet. The hyperparameters in each CNN were optimized using random search. The CNN with the optimal hyperparameters was evaluated using 5-fold cross validation. VGG16 shows the best type classification performance with 99.5% accuracy and the best position classification performance with 95.3% accuracy for 9 positions included in the dataset.
To evaluate the robustness of the VGG16-based inter-floor noise type/position classification, the trained models were tested with the newly gathered dataset. The newly gathered dataset is composed of inter-floor noises generated at the unlearned positions near the learned positions. The VGG16-based model showed robust type classification against position change with 98.5% accuracy. The newly gathered dataset was classified into the learned position near their actual positions.
In summary, we presented a feasibility study of a convolutional neural network-based classifier for inter-floor noise type and position in a single building. Future study should focus on the generalizability of our results through the evaluation against new inter-floor noise datasets including diverse noise types. For example, HH can be generated with a new hammer. Also, inter-floor noises in other buildings can be gathered to evaluate the generality of the type/position classification. These can be improved in our future study and these improvements can contribute to other single sensor-based approaches for their evaluations.
Author Contributions
Conceptualization, H.Y. and W.S.; methodology, H.C., H.Y., S.L. and W.S.; software, H.C.; validation, H.Y., S.L. and W.S.; writing, H.C., H.Y. and W.S.
Funding
This research was funded by the National Research Foundation of Korea (NRF) grant funded by the Korea government (MSIT) (No. NRF-2017R1E1A2A01078766) and (No. NRF-2019R1F1A1058794).
Conflicts of Interest
The authors declare no conflict of interest.
References
- Jeon, J.Y. Subjective evaluation of floor impact noise based on the model of ACF/IACF. J. Sound Vib. 2001, 10, 147–155. [Google Scholar] [CrossRef]
- Jeon, J.Y.; Ryu, J.K.; Lee, P.J. A quantification model of overall dissatisfaction with indoor noise environment in residential buildings. Appl. Acoust. 2010, 71, 914–921. [Google Scholar] [CrossRef]
- Ryu, J.; Sato, H.; Kurakata, K.; Hiramitsu, A.; Tanaka, M.; Hirota, T. Relation between annoyance and single-number quantities for rating heavy-weight floor impact sound insulation in wooden houses. J. Acoust. Soc. Am. 2011, 129, 3047–3055. [Google Scholar] [CrossRef] [PubMed]
- Park, S.H.; Lee, P.J.; Yang, K.S.; Kim, K.W. Relationships between non-acoustic factors and subjective reactions to floor impact noise in apartment buildings. J. Acoust. Soc. Am. 2016, 139, 1158–1167. [Google Scholar] [CrossRef] [PubMed] [Green Version]
- Statistics Korea. 2015 Population and Housing Census. Available online: http://www.census.go.kr/dat/ysr/ysrList.do?q_menu=5&q_sub=7 (accessed on 28 February 2019).
- Shin, J.; Song, H.; Shin, Y. Analysis on the characteristic of living noise in residential buildings. J. Korea Inst. Build. Constr. 2015, 15, 123–131. [Google Scholar] [CrossRef]
- Floor Noise Management Center. Monthly Report (March 2018). Available online: http://www.noiseinfo.or.kr/about/data_view.jsp?boardNo=199&keyfield=whole&keyword=&pg=2 (accessed on 28 December 2018).
- Poston, J.D.; Buehrer, R.M.; Tarazaga, P.A. Indoor footstep localization from structural dynamics instrumentation. Mech. Syst. Signal Process. 2017, 88, 224–239. [Google Scholar] [CrossRef]
- Bahroun, R.; Michel, O.; Frassati, F.; Carmona, M.; Lacoume, J.L. New algorithm for footstep localization using seismic sensors in an indoor environment. J. Sound Vib. 2014, 333, 1046–1066. [Google Scholar] [CrossRef] [Green Version]
- Mirshekari, M.; Pan, S.; Fagert, J.; Schooler, E.M.; Zhang, P.; Noh, H.Y. Occupant localization using footstep-induced structural vibration. Mech. Syst. Signal Process. 2018, 112, 77–97. [Google Scholar] [CrossRef]
- Peck, L.; Lacombe, J. Seismic-based personnel detection. In Proceedings of the 41st Annual IEEE International Carnahan Conference on Security Technology, Ottawa, ON, Canada, 8–11 October 2007; pp. 77–97. [Google Scholar]
- Sabatier, J.M.; Ekimov, A.E. Range limitation for seismic footstep detection. In Proceedings of the Unattended Ground, Sea, and Air Sensor Technologies and Applications X, Orlando, FL, USA, 16–20 March 2008; p. 69630. [Google Scholar]
- Choi, H.; Lee, S.; Yang, H.; Seong, W. Classification of noise between floors in a building using pre-trained deep convolutional neural networks. In Proceedings of the 16th International Workshop on Acoustic Signal Enhancement (IWAENC), Tokyo, Japan, 17–20 September 2018; pp. 535–539. [Google Scholar]
- Choi, H.; Lee, S.; Yang, H.; Seong, W. SNU-B36-50. Available online: http://github.com/yodacatmeow/SNU-B36-50 (accessed on 10 January 2019).
- Jeon, J.Y.; Ryu, J.K.; Jeong, J.H.; Tachibana, H. Review of the impact ball in evaluating floor impact sound. Acta. Acust. United Ac. 2006, 92, 777–786. [Google Scholar]
- The Ministry of Land, Infrastructure and Transport Korea. Statistics of Housing Construction (Construction Consent). Available online: http://kosis.kr/statHtml/statHtml.do?orgId=116&tblId=DT_MLTM_564&conn_path=I2 (accessed on 24 June 2019).
- The Seoul Institute. Construction Consent. Available online: http://data.si.re.kr/node/344 (accessed on 24 June 2019).
- Samsung Electronics. Galaxy S6. Available online: https://www.samsung.com/global/galaxy/galaxys6/galaxy-s6 (accessed on 10 January 2019).
- Russakovsky, O.; Deng, J.; Su, H.; Krause, J.; Satheesh, S.; Ma, S.; Huang, Z.; Karpathy, A.; Khosla, A.; Bernstein, M.; et al. Imagenet large scale visual recognition challenge. Int. J. Comput. Vis. 2015, 115, 211–252. [Google Scholar] [CrossRef]
- Piczak, K.J. Environmental sound classification with convolutional neural networks. In Proceedings of the IEEE 25th International Workshop on Machine Learning for Signal Processing (MLSP), Boston, MA, USA, 17–20 September 2015; pp. 1–6. [Google Scholar]
- Salamon, J.; Bello, J.P. Deep convolutional neural networks and data augmentation for environmental sound classification. IEEE Signal Proc. Let. 2017, 24, 279–283. [Google Scholar] [CrossRef]
- Salamon, J.; Bello, J.P.; Farnsworth, A.; Kelling, S. Fusing shallow and deep learning for bioacoustic bird species classification. In Proceedings of the 2017 IEEE International Conference on Acoustics, Speech and Signal Processing (ICASSP), New Orleans, LA, USA, 5–9 March 2017; pp. 141–145. [Google Scholar]
- Ibrahim, A.K.; Zhuang, H.; Chérubin, L.M.; Schärer-Umpierre, M.T.; Erdol, N. Automatic classification of grouper species by their sounds using deep neural networks. J. Acoust. Soc. Am. 2018, 144, EL196–EL202. [Google Scholar] [CrossRef] [Green Version]
- Plumbley, M.D.; Kroos, C.; Bello, J.P.; Richard, G.; Ellis, D.P.; Mesaros, A. Proceedings of the Detection and Classification of Acoustic Scenes and Events 2018 Workshop (DCASE2018). In Proceedings of the Detection and Classification of Acoustic Scenes and Events 2018 Workshop (DCASE2018), Surrey, UK, 19–20 November 2018. [Google Scholar]
- Hershey, S.; Chaudhuri, S.; Ellis, D.P.; Gemmeke, J.F.; Jansen, A.; Moore, R.C.; Plakal, M.; Platt, D.; Saurous, R.A.; Seybold, B.; et al. CNN architectures for large-scale audio classification. In Proceedings of the 2017 IEEE International Conference on Acoustics, Speech and Signal Processing (ICASSP), New Orleans, LA, USA, 5–9 March 2017; pp. 131–135. [Google Scholar]
- Krizhevsky, A.; Sutskever, I.; Hinton, G.E. Imagenet classification with deep convolutional neural networks. In Proceedings of the 25th International Conference on Neural Information Processing Systems (NIPS), Lake Tahoe, NV, USA, 3–6 December 2012; pp. 1097–1105. [Google Scholar]
- Simonyan, K.; Zisserman, A. Very deep convolutional networks for large-scale image recognition. arXiv 2014, arXiv:1409.1556. [Google Scholar]
- He, K.; Zhang, X.; Ren, S.; Sun, J. Deep residual learning for image recognition. In Proceedings of the IEEE conference on computer vision and pattern recognition (CVPR), Las Vegas, NV, USA, 26 June–1 July 2016; pp. 770–778. [Google Scholar]
- McFee, B.; Raffel, C.; Liang, D.; Ellis, D.P.; McVicar, M.; Battenberg, E.; Nieto, O. librosa: Audio and music signal analysis in python. In Proceedings of the Proceedings of the 14th python in science conference (SCIPY), Austin, TX, USA, 6–12 July 2015; pp. 18–25. [Google Scholar]
- Chu, S.; Narayanan, S.; Kuo, C.-C.J. Environmental sound recognition with time–frequency audio features. IEEE/ACM Trans. Audio Speech Lang. Process. 2009, 17, 1142–1158. [Google Scholar] [CrossRef]
- Rakotomamonjy, A.; Gasso, G. Histogram of gradients of time-frequency representations for audio scene classification. IEEE/ACM Trans. Audio Speech Lang. Process. 2015, 23, 142–153. [Google Scholar]
- Khunarsal, P.; Lursinsap, C.; Raicharoen, T. Very short time environmental sound classification based on spectrogram pattern matching. Inf. Sci. 2013, 243, 57–74. [Google Scholar] [CrossRef]
- Oquab, M.; Bottou, L.; Laptev, I.; Sivic, J. Learning and transferring mid-level image representations using convolutional neural networks. In Proceedings of the IEEE conference on computer vision and pattern recognition (CVPR), Columbus, OH, USA, 23–28 June 2014; pp. 1717–1724. [Google Scholar]
- Goodfellow, I.; Bengio, Y.; Courville, A. Representation learning. In Deep Learning; Dietterich, T., Bishop, C., Heckerman, D., Jordan, M., Kearns, M., Eds.; The MIT Press: Cambridge, MA, USA; London, UK, 2017; pp. 517–547. [Google Scholar]
- Amiriparian, S.; Gerczuk, M.; Ottl, S.; Cummins, N.; Freitag, M.; Pugachevskiy, S.; Baird, A.; Schuller, B. Snore sound classification using image-based deep spectrum features. In Proceedings of the INTERSPEECH, Stockholm, Sweden, 20–24 August 2017; pp. 3512–3516. [Google Scholar]
- Ren, Z.; Cummins, N.; Pandit, V.; Han, J.; Qian, K.; Schuller, B. Learning image-based representations for heart sound classification. In Proceedings of the Proceedings of the 2018 International Conference on Digital Health, Lyon, France, 23–26 April 2018; pp. 143–147. [Google Scholar]
- Jia, Y.; Shelhamer, E.; Donahue, J.; Karayev, S.; Long, J.; Girshick, R.; Guadarrama, S.; Darrell, T. Caffe: Convolutional architecture for fast feature embedding. arXiv 2014, arXiv:1408.5093. [Google Scholar]
- Abadi, M.; Agarwal, A.; Barham, P.; Brevdo, E.; Chen, Z.; Citro, C.; Corrado, G.S.; Davis, A.; Dean, J.; Devin, M.; et al. TensorFlow: Large-Scale Machine Learning on Heterogeneous Systems. Available online: https://www.tensorflow.org (accessed on 10 January 2019).
- He, K.; Zhang, X.; Ren, S.; Sun, J. Delving deep into rectifiers: Surpassing human-level performance on imagenet classification. In Proceedings of the IEEE conference on computer vision and pattern recognition (CVPR), Boston, MA, USA, 7–12 June 2015; pp. 1026–1034. [Google Scholar]
- Bergstra, J.; Bengio, Y. Random search for hyper-parameter optimization. J. Mach. Learn. Res. 2012, 13, 281–305. [Google Scholar]
- Choi, H.; Yang, H.; Lee, S.; Seong, W. Inter-Floor Noise Classification. Available online: https://github.com/yodacatmeow/indoor-noise/tree/master/inter-floor-noise-classification (accessed on 25 April 2019).
- Choi, H.; Yang, H.; Lee, S.; Seong, W. SNU-B36-50E. Available online: https://github.com/yodacatmeow/indoor-noise/tree/master/indoor-noise-set/SNU-B36-50E (accessed on 9 August 2019).
Figure 1.
Five noise types included in the inter-floor noise dataset.

Figure 2.
Noise sources and the receiver arrangement for inter-floor noise generation and recording [13].
Figure 2.
Noise sources and the receiver arrangement for inter-floor noise generation and recording [13].

Figure 3.
(a) Photo of the corridor on 2F. (b) The receiver is held 1.5 m above the floor.

Figure 4.
Architecture of the inter-floor noise type/position classifier.

Figure 5.
Confusion matrices of the position classification results (%). (a) AlexNet, (b) VGG16, and (c) ResNet V1 50.
Figure 5.
Confusion matrices of the position classification results (%). (a) AlexNet, (b) VGG16, and (c) ResNet V1 50.

Figure 6.
Noise sources and the receiver arrangement for generating and recording new inter-floor noises.
Figure 6.
Noise sources and the receiver arrangement for generating and recording new inter-floor noises.

Figure 7.
Position classification of the new inter-floor noise dataset into the learned 9 positions (%).
Figure 7.
Position classification of the new inter-floor noise dataset into the learned 9 positions (%).


Table 1.
The number of data in the inter-floor noise dataset for 5 types and 9 positions.
| 1F0m | 1F6m | 1F12m | 2F0m | 2F6m | 2F12m | 3F0m | 3F6m | 3F12m | |
|---|---|---|---|---|---|---|---|---|---|
| MB | 50 | 50 | 50 | 50 | 50 | 50 | 50 | 50 | 50 |
| HD | 50 | 50 | 50 | 50 | 50 | 50 | 50 | 50 | 50 |
| HH | 50 | 50 | 50 | 50 | 50 | 50 | 50 | 50 | 50 |
| CD | 50 | 50 | 50 | 50 | 50 | 50 | 50 | 50 | 50 |
| VC | 50 | 50 | 50 |
Table 2.
Type classification accuracy (%) with the three CNNs.
| MB | HD | HH | CD | VC | Average | |
|---|---|---|---|---|---|---|
| AlexNet | 98.7 | 99.1 | 99.8 | 99.6 | 100 | 99.3 |
| VGG16 | 99.3 | 99.1 | 99.8 | 99.8 | 100 | 99.5 |
| ResNet V1 50 | 95.8 | 95.8 | 97.6 | 96.4 | 96.7 | 96.7 |
Table 3.
Position classification accuracy (%) with the three CNNs.
| 1F0m | 1F6m | 1F12m | 2F0m | 2F6m | 2F12m | 3F0m | 3F6m | 3F12m | Average | |
|---|---|---|---|---|---|---|---|---|---|---|
| AlexNet | 85.5 | 79.5 | 95.0 | 100 | 98.0 | 99.2 | 96.0 | 92.0 | 95.5 | 93.8 |
| VGG16 | 86.0 | 89.5 | 96.5 | 100 | 96.0 | 98.4 | 95.5 | 95.0 | 99.0 | 95.3 |
| ResNet V1 50 | 80.0 | 73.0 | 86.5 | 92.4 | 86.4 | 92.8 | 87.5 | 82.0 | 87.0 | 85.7 |
Table 4.
Floor classification accuracy (%) with the three CNNs.
| 1F | 2F | 3F | Average | |
|---|---|---|---|---|
| AlexNet | 98.7 | 100.0 | 98.8 | 99.2 |
| VGG16 | 99.0 | 100.0 | 99.5 | 99.5 |
| ResNet V1 50 | 95.8 | 98.5 | 95.2 | 96.7 |
Table 5.
The number of data in the new inter-floor noise dataset for 2 types of noise sources at 10 positions.
Table 5.
The number of data in the new inter-floor noise dataset for 2 types of noise sources at 10 positions.
| 3F1m | 3F2m | 3F3m | 3F4m | 3F5m | 3F7m | 3F8m | 3F9m | 3F10m | 3F11m | |
|---|---|---|---|---|---|---|---|---|---|---|
| MB | 50 | 50 | 50 | 50 | 50 | 50 | 50 | 50 | 50 | 50 |
| HH | 50 | 50 | 50 | 50 | 50 | 50 | 50 | 50 | 50 | 50 |
Table 6.
Confusion matrix for type classification results (%) against the new inter-floor noise dataset.
Table 6.
Confusion matrix for type classification results (%) against the new inter-floor noise dataset.
| Predicted Label | ||||||
|---|---|---|---|---|---|---|
| MB | HD | HH | CD | VC | ||
| True label | MB | 97.7 | 0.00 | 1.20 | 1.10 | 0.00 |
| HH | 0.60 | 0.00 | 99.4 | 0.00 | 0.00 | |
© 2019 by the authors. Licensee MDPI, Basel, Switzerland. This article is an open access article distributed under the terms and conditions of the Creative Commons Attribution (CC BY) license (http://creativecommons.org/licenses/by/4.0/).
Share and Cite
MDPI and ACS Style
Choi, H.; Yang, H.; Lee, S.; Seong, W. Classification of Inter-Floor Noise Type/Position Via Convolutional Neural Network-Based Supervised Learning. Appl. Sci. 2019, 9, 3735. https://doi.org/10.3390/app9183735
AMA Style
Choi H, Yang H, Lee S, Seong W. Classification of Inter-Floor Noise Type/Position Via Convolutional Neural Network-Based Supervised Learning. Applied Sciences. 2019; 9(18):3735. https://doi.org/10.3390/app9183735
Chicago/Turabian StyleChoi, Hwiyong, Haesang Yang, Seungjun Lee, and Woojae Seong. 2019. "Classification of Inter-Floor Noise Type/Position Via Convolutional Neural Network-Based Supervised Learning" Applied Sciences 9, no. 18: 3735. https://doi.org/10.3390/app9183735
Note that from the first issue of 2016, this journal uses article numbers instead of page numbers. See further details here.