Aerodynamic Sensitivity Analysis for a Wind Turbine Airfoil in an Air-Particle Two-Phase Flow


Key Laboratory of Unsteady Aerodynamics and Flow Control, Ministry of Industry and Information Technology, Nanjing University of Aeronautics and Astronautics, Yudao Street 29, Nanjing 210016, China
*
Author to whom correspondence should be addressed.
Appl. Sci. 2019, 9(18), 3909; https://doi.org/10.3390/app9183909
Submission received: 31 July 2019
/
Revised: 11 September 2019
/
Accepted: 12 September 2019
/
Published: 18 September 2019
(This article belongs to the Special Issue Advanced Solar–Wind–Hydro Hybrid Energy System)
Abstract
:In this paper, the Navier-Stokes equations coupled with a Lagrangian discrete phase model are described to simulate the air-particle flows over the S809 airfoil of the Phase VI blade, the NH6MW25 airfoil of a 6 MW wind turbine blade and the NACA0012 airfoil. The simulation results demonstrate that, in an attached flow, the slight performance degradation is caused by the boundary layer momentum loss. After flow separation, the performance degradation becomes significant and is dominated by a more extensive separation due to particles, since the aerodynamic coefficient increments and the moving distance of separation point present similar variation trends with increasing angle of attack. Unlike the NACA0012 airfoil, a most particle-sensitive angle of attack is found in the light stall region for a wind turbine airfoil, at which the lift decrement and the drag increment reach their peak values. For the S809 airfoil, the most sensitive angle of attack is about 3° higher than that for the maximum lift-to-drag ratio. Hence, the aerodynamic performance of a wind turbine is very susceptible to particles. Based on the most sensitive angles of attack, the more sensitive scope of angles of attack of a blade airfoil and the more sensitive range of rotor tip speed ratios are predicted sequentially. The present study clarifies the principles for the performance degradation of a wind turbine airfoil due to particles and the conclusions are useful for the wind turbine design reducing the particle influences.
1. Introduction
Wind energy is one of the most important renewable energy resources. However, the performance of a wind turbine is greatly affected by the extremely complex operating environments, such as common sandstorm and rain. For high stability, high efficiency and long life, it is necessary to study the effects of sand particles or rain droplets on the wind turbine aerodynamic performance.
In recent decades, the methodology of computational fluid dynamics (CFD) has become increasingly popular to wind turbine aerodynamics [1,2,3,4], and various CFD methods, including Reynolds-Averaged Navier-Stokes (RANS) equations [5], Detached-Eddy Simulation (DES) [6], Large-Eddy Simulation (LES) [2], transition prediction [7], overset grid [8] and hybrid scheme of CFD and blade element momentum (BEM) [9], have been developed. Especially, a handful of CFD-based studies have been conducted to investigate the effects of sand or rain on the airfoil aerodynamic performance.
In aviation applications, Valentine and Decker [10,11] developed an iterative, two-way momentum coupled, two-phase flow scheme by linking a thin-layer incompressible Navier-Stokes (N-S) CFD code with a Lagrangian particle tracking algorithm, and successfully simulated the rain phenomenon and the aerodynamic efficiency degradation of the NACA64-210 airfoil in heavy rain. For the same airfoil, Wan and Pan [12] combined the CFD package of FLUENT with a discrete phase model (DPM) to analyze the aerodynamic influences due to heavy rain and demonstrated that the degradation rate of aerodynamic efficiency increases with the rain rate. Wu and Cao [13] simulated the flow over the NACA0012 airfoil in heavy rain by a two-way momentum coupled Eulerian-Lagrangian approach. Their results showed significant aerodynamic penalties at low angles of attack due to rain effects and an about 3° rain-induced increase in stall angle of attack.
In the field of wind turbine aerodynamics, Salem et al. [14] proposed a CFD model coupled with a deposition model to assess the performance degradation of the wind turbine blade NACA63-215 airfoil, and demonstrated that the operation in the dusty environments can lead to a severe loss of power due to the dust accumulation on the blade surface. Khakpour et al. [15] employed FLUENT together with a Lagrangian particle tracking scheme to study the effects of sand particles on the aerodynamic performance of the S819 airfoil, including the influences of sand dimensions, sand/air drift velocity and sand/air mass flow rate ratio. Cai et al. [16] presented a multiphase CFD model based on the coupled Lagrangian-Eulerian approach to capture the water-film formation over the S809 airfoil and stated that heavy rain could result in a significant performance loss. Cohan and Arastoopour [17] developed a multiphase CFD model to estimate the effect of rain by simulating the water-film formation using the Lagrangian DPM and the Eulerian Volume of Fluid (VOF) model, and observed that the S809 airfoil performance is highly sensitive to the rainfall rate at low rainfall rates. However, if the rainfall rate is high enough to immerse most of the airfoil surface under water, a further increase in the rainfall rate does not have a substantial effect. Douvi et al. [18] computed the air-sand particle two-phase flow over the S809 airfoil by combining the N-S equations with a Lagrangian DPM via FLUENT and found that there was an increase in drag as well as a decrease in lift caused by increasing particle concentrations.
Most of the above-mentioned studies are limited to the prediction of aerodynamic performance loss for an airfoil in an air-particle flow, and the more sensitive region to particles and the difference between aviation and wind turbine type airfoils are still unclear. In this work, the incompressible N-S equations coupled with a Lagrangian DPM will be presented to simulate the air-particle two-phase flow over the S809 airfoil at different Reynolds numbers, particle concentrations and various angles of attack. For comparison, an airfoil of a 6 MW wind turbine and the NACA0012 airfoil will also be included. The particle influences on aerodynamic parameters and especially on flow separation will be analyzed in detail, and the more sensitive range of angles of attack to particles will then be determined. Finally, the angle of attack of a wind turbine blade airfoil will be related to the rotor tip speed ratio in order to predict the more sensitive region of tip speed ratios.
2. Numerical Method for Air-Particle Two-Phase Flow Simulation
The continuum air phase is simulated by solving the following incompressible N-S equations written in coordinate invariant formulation
where stands for a coordinate direction, denotes a component of fluid velocity vector, , and are the fluid density, pressure and kinematic viscosity coefficient, respectively, represents the Laplace operator, and refers to the momentum source/sink “body force” term accounting for the particle effect on the fluid phase.
The Shear-Stress Transport (SST) two-equation model [19] is employed in the turbulence modeling, which combines the positive features of model and a high Reynolds number model. The SST model has been proven to work well for wind turbine applications [20]. The transport equations for the turbulent kinetic energy and the specific dissipation of turbulence read in differential form
where is the turbulent kinetic energy, is the rate of dissipation per unit turbulent kinetic energy. The terms on the right-hand side of Equation (2) represent conservative diffusion, eddy-viscosity production and dissipation, respectively, and the last term in the ω-equation describes the cross diffusion. More details about the SST model can be found in Ref. [19].
For the continuum phase, the SIMPLEC (Semi-Implicit Method for Pressure-Linked Equations-Consistent) algorithm [21] and the second-order upwind scheme are used for the pressure-velocity coupling and the convection terms, respectively. An implicit method is applied to the time discretization.
For the dispersed phase, a two-way coupled scheme is adopted and particles are assumed to be non-interacting, non-deforming and non-evaporating spheres. Then, the particle trajectories can be solved from the following DPM [13] formulated in a Lagrangian reference frame
where the subscript denotes the particle phase, is the velocity vector, is the acceleration of gravity, is the particle position, and the term is the drag of per unit particle mass with being calculated from
where is the particle diameter, is the particle drag coefficient estimated by using the spherical drag law of Morsi and Alexander [22].
Particle drag acts as the momentum coupling between the fluid and particulate phases. It is explicitly considered in the particle equation of motion. As for the continuous phase, the additional momentum source/sink term in Equation (1) can be then evaluated from
where is the volume of the grid cell, is the particle mass, and the sum is over all particles that traverse the cell.
3. Validation of Numerical Method
3.1. One-Phase Air Flow Simulation for S809 Airfoil
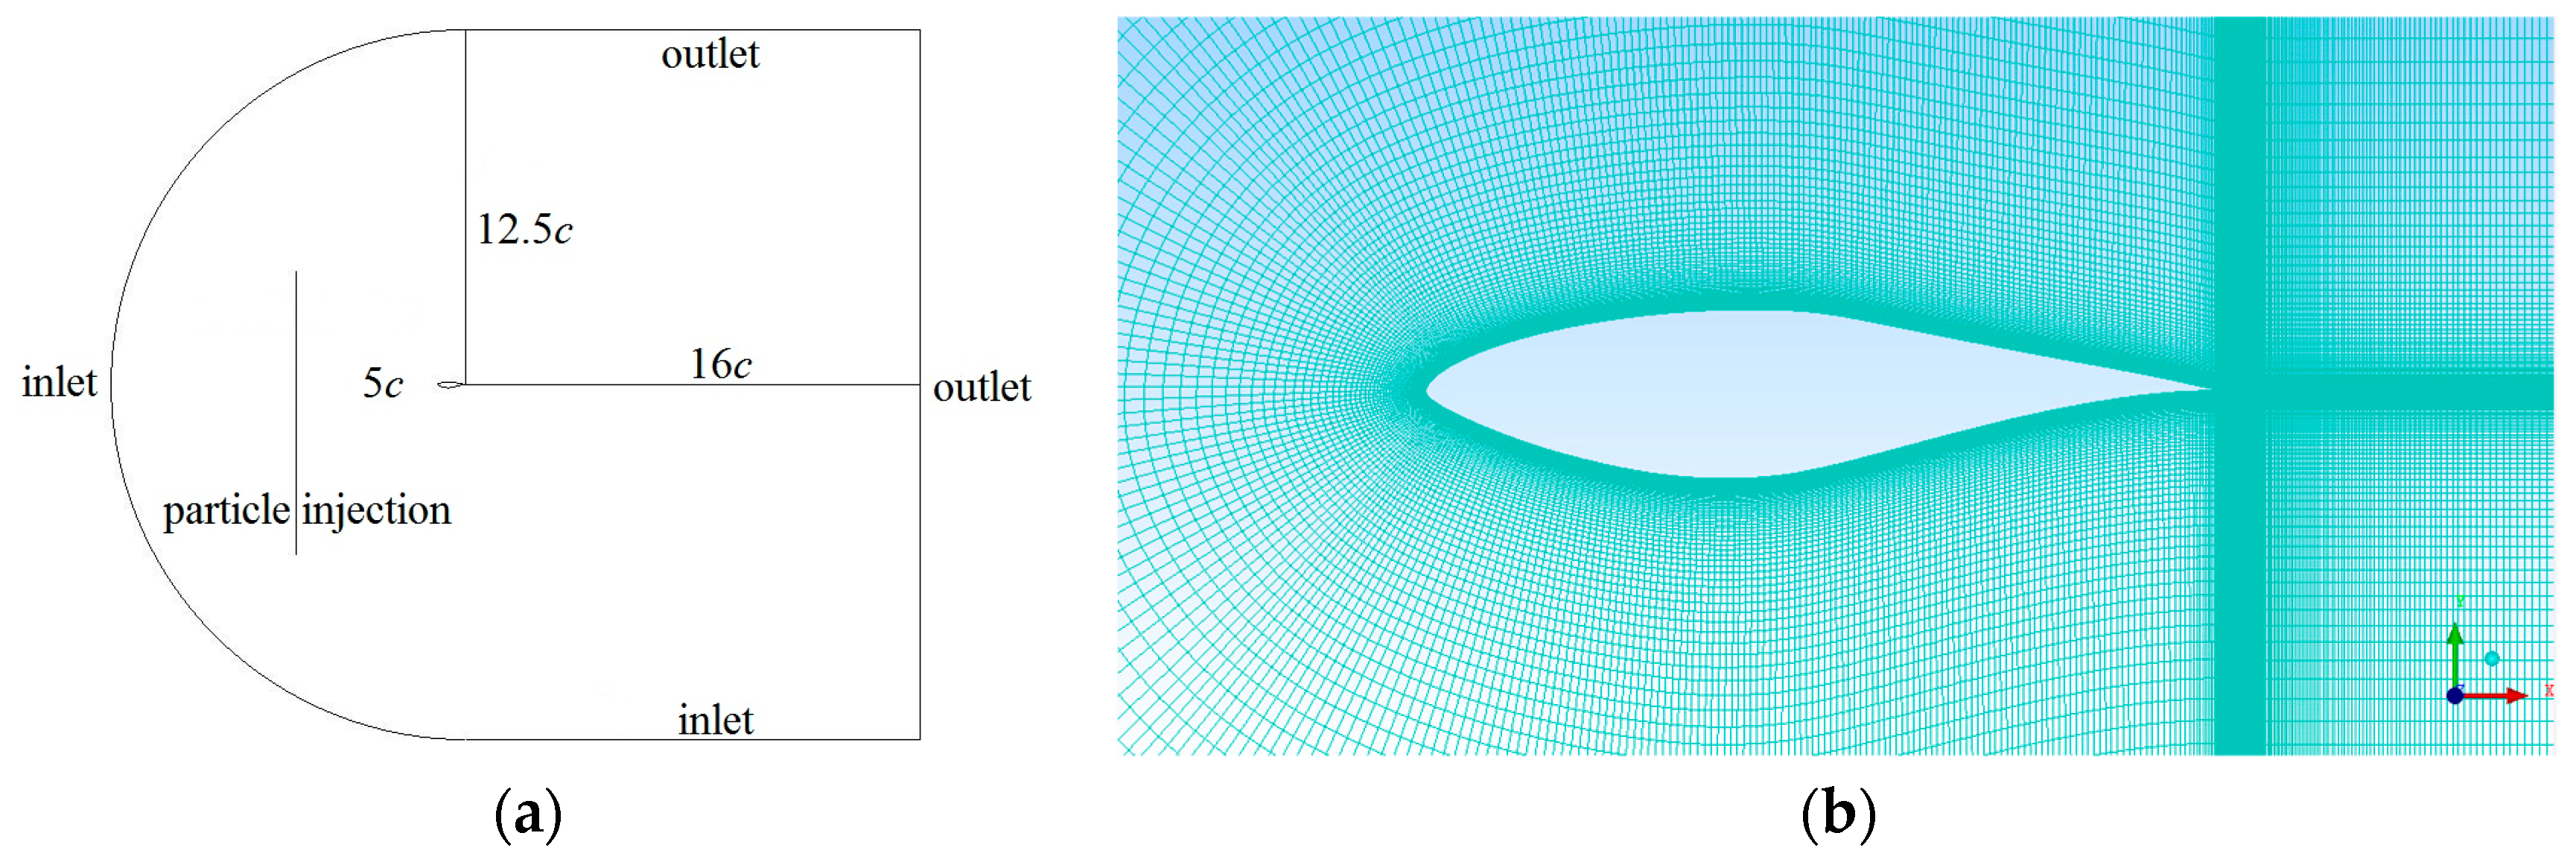
The present CFD method is validated by applying it to simulate the one-phase air flow over the S809 airfoil of the NREL Phase VI wind turbine blade. This airfoil has a thickness of 21%. Figure 1 displays the computational domain and structured C-grid with 147,552 cells, where c denotes the airfoil chord. The first grid node is located at the distance y+ ≤ 1 from the wall with y+ denoting the non-dimensional wall coordinate.
Figure 2 shows the Reynolds (Re) number distributions of the Phase VI blade sections at different tip speed ratios defined as
where denotes the tip speed ratio, and are the rotor radius and angular velocity, respectively, and is the wind speed.
The one-phase air flows over the S809 airfoil are computed at four Re numbers of 0.75 × 10⁶, 1 × 10⁶, 1.25 × 10⁶ and 1.5 × 10⁶, which respectively correspond to the velocities: 10.955 m/s, 14.607 m/s, 18.259 m/s and 21.911 m/s. The velocity inlet and pressure outlet conditions are respectively implemented at the inlet and outlet boundaries shown in Figure 1a, and the no-slip condition is imposed on the solid wall. Figure 3 compares the computed lift (CL) and drag coefficients (Cdp and Cdw) with the experimental data [23], where Cdp is the pressure drag coefficient and Cdw is the wake drag coefficient. In Figure 3, the computed and experimental lift coefficients are in good agreement. Due to the lack of friction drag in Cdp, the computed drag coefficients are closer to Cdw. In Ref. [18], the same numerical method was applied to the S809 airfoil, and a similar difference in drag between computation and experiment was obtained. In the rest of the paper, only the increments of lift and drag coefficients due to particles are discussed, but for the lift-to-drag ratio.
3.2. Gas-Solid Two-Phase Flow Simulation for a Circular Cylinder
The present numerical method is further applied to simulate the unsteady gas-solid two-phase flow over a circular cylinder. The Stokes (St) number is a critical parameter for quantifying the resistance of the particles to changes in their translational and rotational velocities due to the surrounding fluid flow, which is defined as the ratio of the particle relaxation time to the fluid relaxation time
where denotes the diameter of the circular cylinder.
In the experiment [24], D = 10 mm, the Re number based on and equals 2125, = 2500 kg/m3, and three St numbers of 0.98, 6.5 and 19.7 are investigated by using different particle diameters at a fixed particle concentration m = 10%, where m is defined as the mass flux percentage of particle phase to air phase. The same parameters are considered in the numerical simulations. Figure 5 presents the particle dispersion pictures at three St numbers. As can be observed, the computed flow patterns are similar to the experimental results; with increasing St, the interaction between the particles and the vortices decreases.
4. Aerodynamic Sensitivity Analysis to Particles for S809 Airfoil
To investigate the aerodynamic sensitivity to particles, an air-particle two-phase flow over the S809 airfoil is simulated at different Re numbers, particle concentrations and angles of attack. In this work, the particle diameter and density are set as 50 μm and 1000 kg/m3, respectively. As sketched in Figure 1a, particles are injected from an upstream plane with a 5c distance from the airfoil. The injection velocity of particle is equal to the wind speed.
4.1. Particle Effects at Different Re Numbers
Four Re numbers of 0.75 × 10⁶, 1 × 10⁶, 1.25 × 10⁶ and 1.5 × 10⁶ are computed at a fixed particle concentration m = 1%. Figure 6 shows the variations of lift and drag coefficient increments with the angle of attack α, where the relative increments are calculated from
with the subscripts and denoting the flows with and without particles, respectively.
As can be observed from Figure 6, the particle phase leads to a lift decrease and a drag increase; with increasing angle of attack, the lift decrement and drag increment present similar variation trends, i.e., from increasing to decreasing and to increasing again, and there is a most sensitive angle of attack at which the increments of aerodynamic coefficients reach their peak values; with Re increasing from 0.75 × 10⁶ to 1.5 × 10⁶, the most sensitive angle of attack increases from 8.6° to 10.1° roughly; in all cases, the maximum increments of lift and drag coefficients are −5.74% and 21.19%, respectively. Considering the actual Re range shown in Figure 2, the more sensitive region of angles of attack is conservatively determined as from 7.1° to 11.1°, which is marked by a square in Figure 6.
In Figure 6, the aerodynamic coefficient increments change slowly in the range of small angles of attack without flow separation. In an attached flow, the airfoil aerodynamic performance is affected by the boundary layer momentum loss due to particles. Figure 7 illustrates the velocity profiles at three positions on the S809 airfoil surface with relatively large curvatures, where the legends of upper and lower refer to the upper and lower surfaces, respectively. The particle phase makes the velocity in the boundary layer decrease, and the influence near the leading edge is greater.
With a further increase in the angle of attack in Figure 6, flow separation occurs and the magnitudes of lift and drag increments increase sharply till the most sensitive angle of attack. Figure 8 plots the location of separation point and its dimensionless moving distance defined as
with and being the coordinates of separation point in the air-particle and air flows, respectively.
As can be found from Figure 8, the particle phase causes the separation point to move upstream, that is to say, flow separation becomes more extensive. In Figure 6 and Figure 8b, the separation point moving distance and the aerodynamic coefficient increments have similar variation trends with the angle of attack, and at each Re number, there is a about 1° angle difference between the maximum upstream-moving distance of separation point and the maximum lift decrement. Consequently, in the case of flow separation, it can be concluded that the particle influences on flow separation dominate the variations of aerodynamic coefficient increments and result in the severer aerodynamic performance degradation in Figure 6.
4.2. Effects of Particle Concentration
The particle concentration m is related to a specific environment. It may be less than 0.5% and more than 2% under the sandstorm and rain conditions, respectively. In this subsection, three particle concentrations of 0.5%, 1% and 2% are considered at Re = 1 × 10⁶. As displayed in Figure 9, a higher concentration leads to a greater influence. The maximum lift and drag coefficient increments are respectively −2.6% and 10% at m = 0.5%, and they are −9.7% and 37.4% at m = 2%. The most sensitive angle of attack maintains a fixed value of 9.1° for three particle concentrations, which means that the particle concentration does not affect the most sensitive angle of attack.
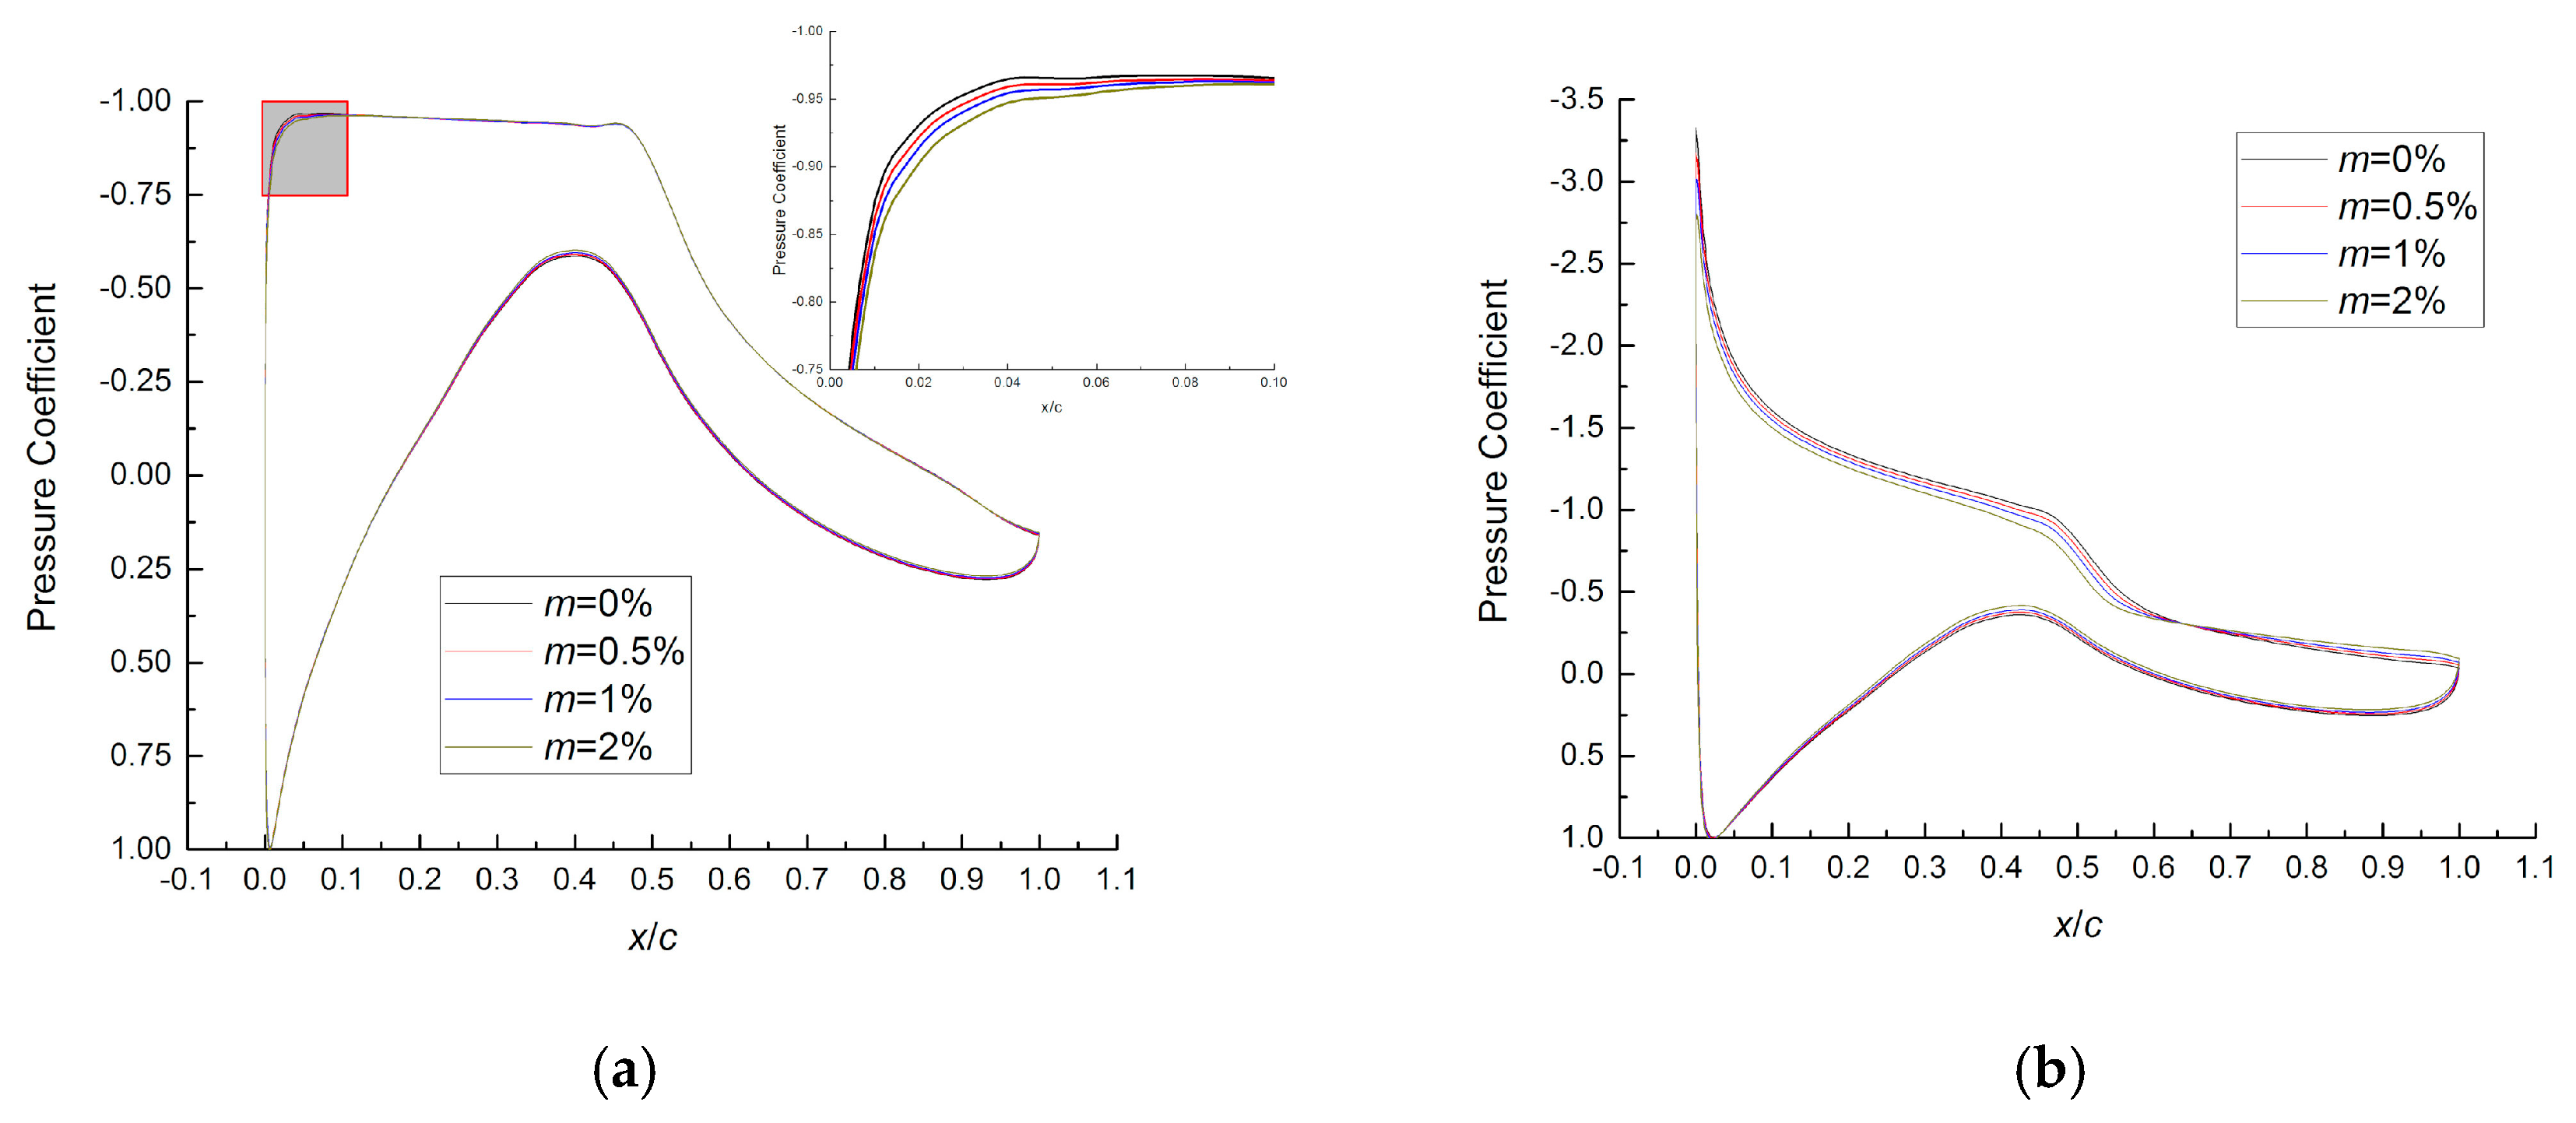
Figure 10 shows the effects of particle concentration on the surface pressure distribution. The pressure difference between these particle concentrations is slight at α = 4.1°, while it is significant at α = 9.1° since a larger concentration leads to a more extensive flow separation.
Figure 11 gives the moving distance of separation point at three particle concentrations and Re = 1 × 10⁶. Likewise, a larger particle concentration causes a larger moving distance. The maximum upstream-moving distance increases from 5% at m = 0.5% to 17.2% at m = 2%. For three particle concentrations, the angle of attack corresponding to the maximum moving distance also equals a constant value of 8.1°, which is 1° smaller than the most sensitive angle of attack of 9.1°. So, this angle difference is not influenced by the particle concentration, which has been verified to be independent of Re number in Section 4.1.
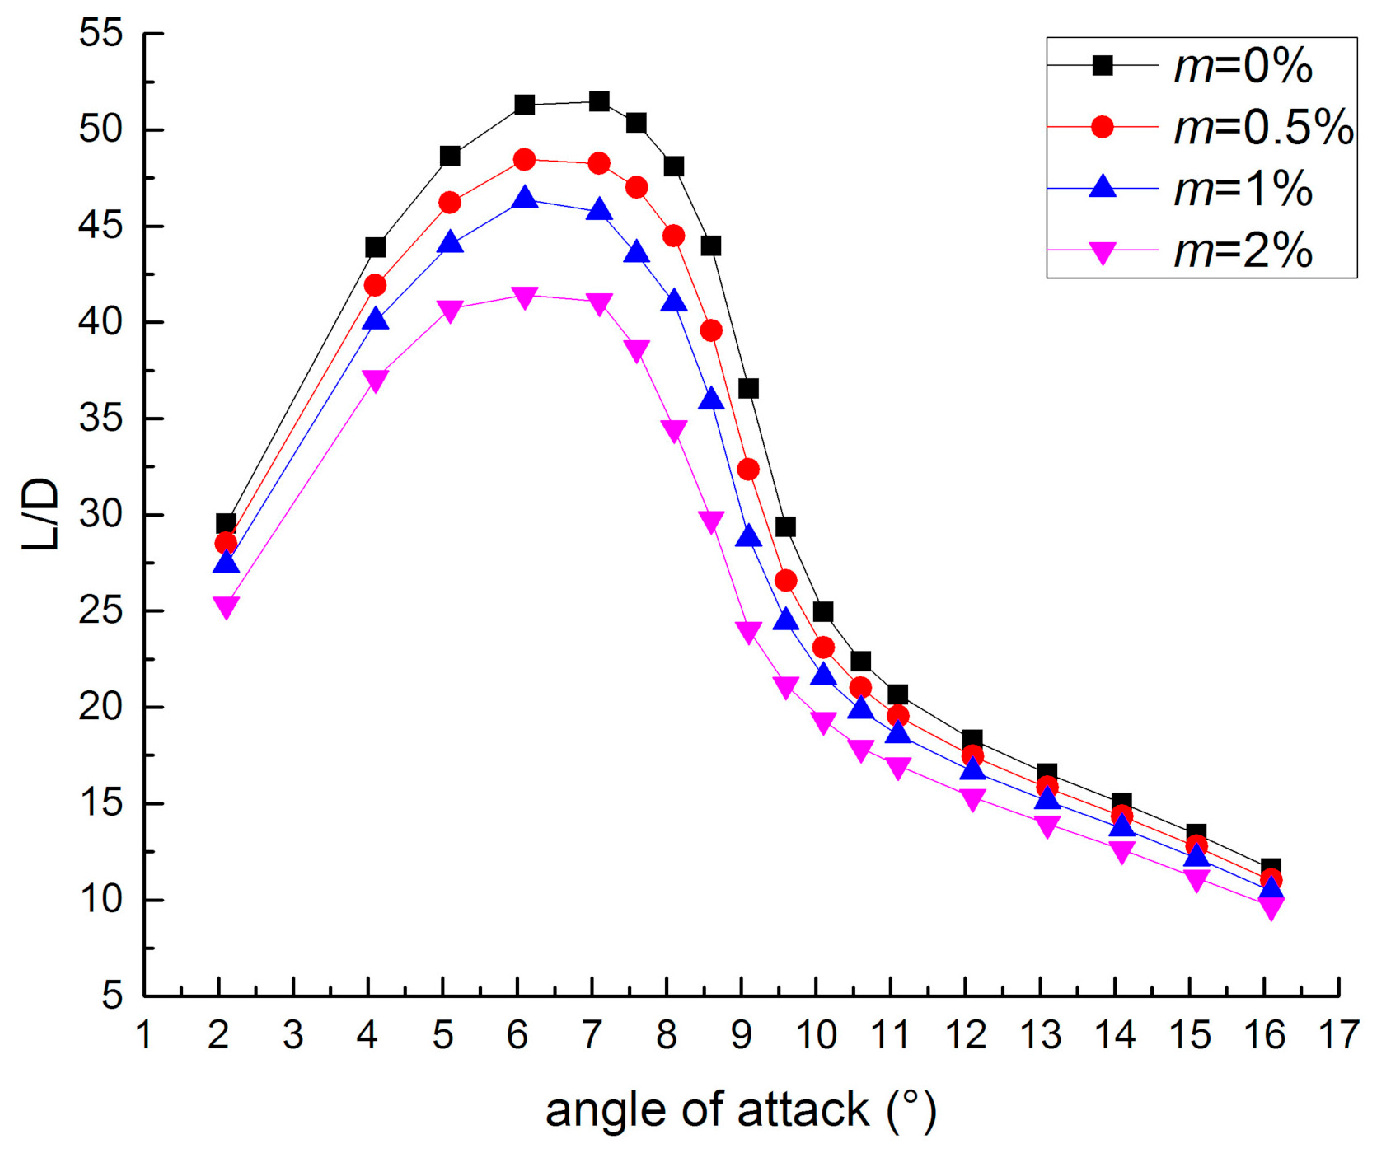
A wind turbine generally operates around the maximum lift-to-drag ratio. Figure 12 illustrates the lift-to-drag ratio of the S809 airfoil at different particle concentrations and Re = 1 × 10⁶. As can be seen, the lift-to-drag ratio decreases with increasing particle concentration, the peak angle of attack is between 6.1° and 7.1° approximately, which is about 3° smaller than the most sensitive angle of attack of 9.1°. Hence, the aerodynamic performance of a wind turbine is susceptible to particles considering its operating state, environments as well as pitch control.
A wind turbine generally operates around the maximum lift-to-drag ratio. Figure 12 illustrates the lift-to-drag ratio of the S809 airfoil at different particle concentrations and Re = 1 × 10⁶. As can be seen, the lift-to-drag ratio decreases with increasing particle concentration, the peak angle of attack is between 6.1° and 7.1° approximately, which is about 3° smaller than the most sensitive angle of attack of 9.1°. Hence, the aerodynamic performance of a wind turbine is susceptible to particles considering its operating state, environments as well as pitch control.
5. Particle Effects on Other Two Airfoils
For a further verification, the NACA0012 airfoil and the NH6MW25 airfoil of a 6 MW wind turbine blade are introduced. The NH6MW25 airfoil sketched in Figure 13 has a thickness of 25%.
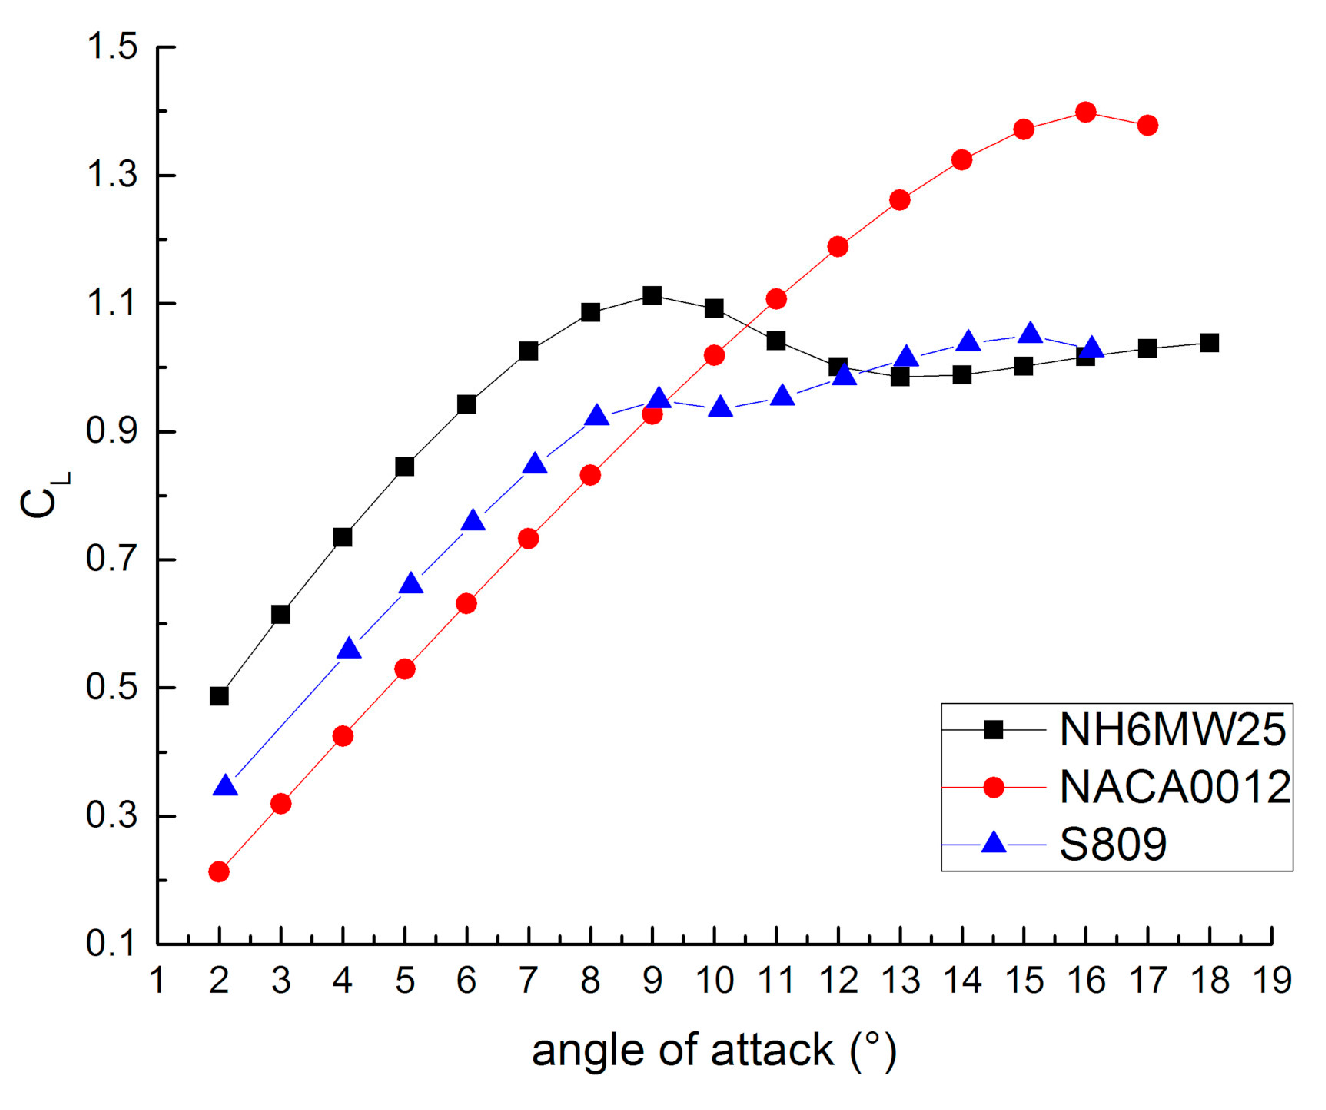
Figure 14 compares the lift coefficient curves at Re = 1 × 10⁶ between the NACA0012 airfoil and two wind turbine airfoils of S809 and NH6MW25. Different from the NACA0012 airfoil, the flow over a wind turbine airfoil separates at a smaller angle of attack and its typical lift curve consists of the linear, light stall and deep stall sections. As can be seen from Figure 14, for the S809 airfoil at Re = 1 × 10⁶, the most sensitive angle of attack of 9.1° is just located in the light stall section.
The air-particle flows over the NH6MW25 and NACA0012 airfoils are simulated at m = 1% and Re = 1 × 10⁶. Figure 15 and Figure 16 show the lift and drag coefficient increments for the NH6MW25 and NACA0012 airfoils, respectively. For the NH6MW25 airfoil, the variation trends of aerodynamic coefficient increments with the angle of attack are similar to those of the S809 airfoil displayed in Figure 6, and the most sensitive angles of attack for lift and drag equal 10° and 9°, respectively, which also locates in the light stall section (see Figure 14). However, for the NACA0012 airfoil, there is not a most sensitive angle of attack and the particle influences increase with increasing angle of attack due to the lack of light stall.
Figure 17 compares the location and moving distance of separation point between three airfoils. Likewise, due to the light stall phenomenon, a maximum moving distance can only be observed for the S809 and NH6MW25 airfoils. In Figure 15 and Figure 17b, there is still an angle difference between the maximum increments of aerodynamic coefficients and the maximum moving distance of separation point for the NH6MW25 airfoil. Figure 18 displays the pressure distributions over the S809 and NH6MW25 airfoils at Re = 1 × 10⁶ and m = 0%. Due to the difference in the position of the highest point on the upper airfoil surface as well as the curvature difference between these two airfoils (see Figure 13), the adverse pressure gradient in the vicinity of the highest point on the upper surface of the S809 airfoil in Figure 18 locates farther downstream and is stronger compared with the NH6MW25 airfoil. So, in Figure 17a, the separation point on the S809 airfoil moves upstream much faster while the angle of attack approaches the angle for maximum lift, and the curves for these two airfoils intersect.
6. Sensitive Tip Speed Ratios to Particles for Phase VI
The angle of attack of each blade section can be related to the tip speed ratio by
where is the sum of the twist angle and the pitch angle, is the dimensionless radius defined as with being the local radius.
The more sensitive tip speed ratios can be then predicted from the more sensitive angles of attack by using Equation (10). Figure 19 shows the angles of attack of the Phase VI blade sections at different tip speed ratios and a zero pitch angle. In Section 4, the more sensitive range of angles of attack of the S809 airfoil has been determined as from 7.1° to 11.1°. Subsequently, it can be analyzed from Figure 19 that the more sensitive region of tip speed ratios of Phase VI is from 7 to 12.
7. Conclusions
To investigate the aerodynamic sensitivity to particles for a wind turbine airfoil, the incompressible RANS equations have been coupled with a DPM model, and the air-particle flows have been simulated for the S809 airfoil of the Phase VI blade, the NH6MW25 airfoil of a 6 MW wind turbine and the NACA0012 airfoil. According to the numerical results and analyses, the following conclusions can be drawn.
- (1)
- In an attached flow, the particle-induced aerodynamic performance degradation is relatively slight and is caused by the boundary layer momentum loss. In the case of flow separation, a significant degradation is induced by a more severe separation due to particles.
- (2)
- For a wind turbine airfoil in an air-particle flow, the lift decrement, drag increment and the upstream-moving distance of separation point vary with the increasing angle of attack from increasing to decreasing and to increasing again. A most sensitive angle of attack to particles is found in the light stall region, and it is about 3° higher than the angle of attack for the maximum lift-to-drag ratio for the S809 airfoil. Hence, the aerodynamic performance of a wind turbine is very susceptible to particles considering its operating state, environments as well as pitch control.
- (3)
- For the S809 airfoil, the most sensitive angle of attack is not affected by the particle concentration within the considered range of m ≤ 2%.
- (4)
- Unlike a wind turbine airfoil, there is not a most sensitive angle of attack to particles for the NACA0012 airfoil due to the lack of light stall.
Author Contributions
Conceptualization, T.G., J.J. and Z.L.; data curation, D.Z.; methodology, T.G., J.J. and Z.L.; project administration, Z.L.; software, T.G. and J.J.; validation, T.G., J.J., Z.L., D.Z. and T.W.; writing—original draft, T.G. and J.J.; writing—review & editing, Z.L., D.Z. and T.W.
Funding
This research was funded by the National Natural Science Foundation of China, grant number 51566011 and a project funded by the Priority Academic Program Development of Jiangsu Higher Education Institutions.
Conflicts of Interest
The authors declare no conflict of interest.
References
- Quarton, D.C. The evolution of wind turbine design analysis—A twenty year progress review. Wind Energy 1998, 1, 5–24. [Google Scholar] [CrossRef]
- Sanderse, B.; Pijl, S.; Koreň, B. Review of computational fluid dynamics for wind turbine wake aerodynamics. Wind Energy 2011, 14, 799–819. [Google Scholar] [CrossRef] [Green Version]
- Wang, T.G.; Wang, L.; Zhong, W.; Xu, B.F.; Chen, L. Large-Scale Wind Turbine Blade Design and Aerodynamic Analysis. Chin. Sci. Bull. 2012, 57, 466–472. [Google Scholar] [CrossRef]
- Guo, T.Q.; Lu, Z.L.; Tang, D.; Wang, T.G.; Dong, L. A CFD/CSD Model for Aeroelastic Calculations of Large-Scale Wind Turbines. Sci. China Technol. Sci. 2013, 56, 205–211. [Google Scholar] [CrossRef]
- Benjanirat, S.; Sankar, L.N.; Xu, G. Evaluation of Turbulence Models for the Prediction of Wind Turbine Aerodynamics. In Proceedings of the ASME 2003 Wind Energy Symposium, Reno, NV, USA, 6–9 January 2003; pp. 73–83. [Google Scholar]
- Johansen, J.; Sørensen, N.N.; Michelsen, J.A.; Schreck, S. Detached-eddy simulation of flow around the NREL Phase VI blade. Wind Energy 2002, 5, 185–197. [Google Scholar] [CrossRef]
- Langtry, R.; Gola, J.; Menter, F. Predicting 2D Airfoil and 3D Wind Turbine Rotor Performance using a Transition Model for General CFD Codes. In Proceedings of the 44th AIAA Aerospace Sciences Meeting and Exhibit, Reno, Nevada, 9–12 January 2006. [Google Scholar]
- Zahle, F.; Sørensen, N.N.; Johansen, J. Wind turbine rotor-tower interaction using an incompressible overset grid method. Wind Energy 2009, 12, 594–619. [Google Scholar] [CrossRef]
- Madsen, H.A.; Bak, C.; Døssing, M.; Mikkelsen, R.; Øye, S. Validation and modification of the Blade Element Momentum theory based on comparisons with actuator disc simulations. Wind Energy 2010, 13, 373–389. [Google Scholar] [CrossRef]
- Valentine, J.R. Airfoil Performance in Heavy Rain. Transp. Res. Rec. 1994, 1428, 26–35. [Google Scholar]
- Valentine, J.; Decker, R. A Lagrangian-Eulerian scheme for flow around an airfoil in rain. Int. J. Multiph. Flow 1995, 21, 639–648. [Google Scholar] [CrossRef]
- Wan, T.; Pan, S.P. Aerodynamic Efficiency Study under the Influence of Heavy Rain via Two-Phase Flow Approach. In Proceedings of the 27th International Congress of the Aeronautical Sciences, Cancun, Mexico, 7–13 March 2010. [Google Scholar]
- Wu, Z.; Cao, Y. Numerical simulation of flow over an airfoil in heavy rain via a two-way coupled Eulerian–Lagrangian approach. Int. J. Multiph. Flow 2015, 69, 81–92. [Google Scholar] [CrossRef]
- Salem, H.; Diab, A.; Ghoneim, Z. CFD Simulation and Analysis of Performance Degradation of Wind Turbine Blades in Dusty Environments. In Proceedings of the 2013 International Conference on Renewable Energy Research and Applications, Madrid, Spain, 20–23 October 2013. [Google Scholar]
- Khakpour, Y.; Bardakji, S.; Nair, S. Aerodynamic Performance of Wind Turbine Blades in Dusty Environments. In Proceedings of the 2007 ASME International Mechanical Engineering Congress and Exposition, Seattle, WA, USA, 11–15 November 2007. [Google Scholar]
- Cai, M.; Abbasi, E.; Arastoopour, H. Analysis of the Performance of a Wind-Turbine Airfoil under Heavy-Rain Conditions Using a Multiphase Computational Fluid Dynamics Approach. Ind. Eng. Chem. Res. 2013, 52, 3266–3275. [Google Scholar] [CrossRef]
- Cohan, A.C.; Arastoopour, H. Numerical simulation and analysis of the effect of rain and surface property on wind-turbine airfoil performance. Int. J. Multiph. Flow 2016, 81, 46–53. [Google Scholar] [CrossRef]
- Douvi, D.C.; Margaris, D.P.; Davaris, A.E. Aerodynamic Performance of a NREL S809 Airfoil in an Air-Sand Particle Two-Phase Flow. Computation 2017, 5, 13. [Google Scholar] [CrossRef]
- Menter, F.R. Two-equation eddy-viscosity turbulence models for engineering applications. AIAA J. 1994, 32, 1598–1605. [Google Scholar] [CrossRef] [Green Version]
- Chitsomboon, T.; Thamthae, C. Adjustment of k-ω SST Turbulence Model for an Improved Prediction of Stalls on Wind Turbine Blades. In Proceedings of the World Renewable Energy Congress-Sweden, Linköping, Sweden, 8–13 May 2011. [Google Scholar]
- Van Doormaal, J.P.; Raithby, G.D. enhancements of the simple method for predicting incompressible fluid flows. Numer. Heat Transf. 1984, 7, 147–163. [Google Scholar] [CrossRef]
- Morsi, S.A.; Alexander, A.J. An investigation of particle trajectories in two-phase flow systems. J. Fluid Mech. 1972, 55, 193. [Google Scholar] [CrossRef]
- Ramsay, R.; Hoffman, M.; Gregorek, G. Effects of Grit Roughness and Pitch Oscillations on the S809 Airfoil; No. NREL/TP-442-7817; National Renewable Energy Lab.: Golden, CO, USA, 1995. [Google Scholar]
- Luo, K.; Chen, S.; Cai, D.Y.; Fan, J.R.; Cen, K.F. Experimental Study of Flow Characteristics in the Near Field of Gas-Solid Two-Phase Circular Cylinder Wakes. Proc. Chin. Soc. Electr. Eng. 2006, 26, 116–120. (In Chinese) [Google Scholar] [CrossRef]
Figure 1.
Computational domain and structured grid of S809 airfoil: (a) Computational model; (b) structured C-grid.
Figure 1.
Computational domain and structured grid of S809 airfoil: (a) Computational model; (b) structured C-grid.

Figure 2.
Re number distributions of Phase VI blade sections at different tip speed ratios and rated rotational speed of 72 rpm.
Figure 2.
Re number distributions of Phase VI blade sections at different tip speed ratios and rated rotational speed of 72 rpm.
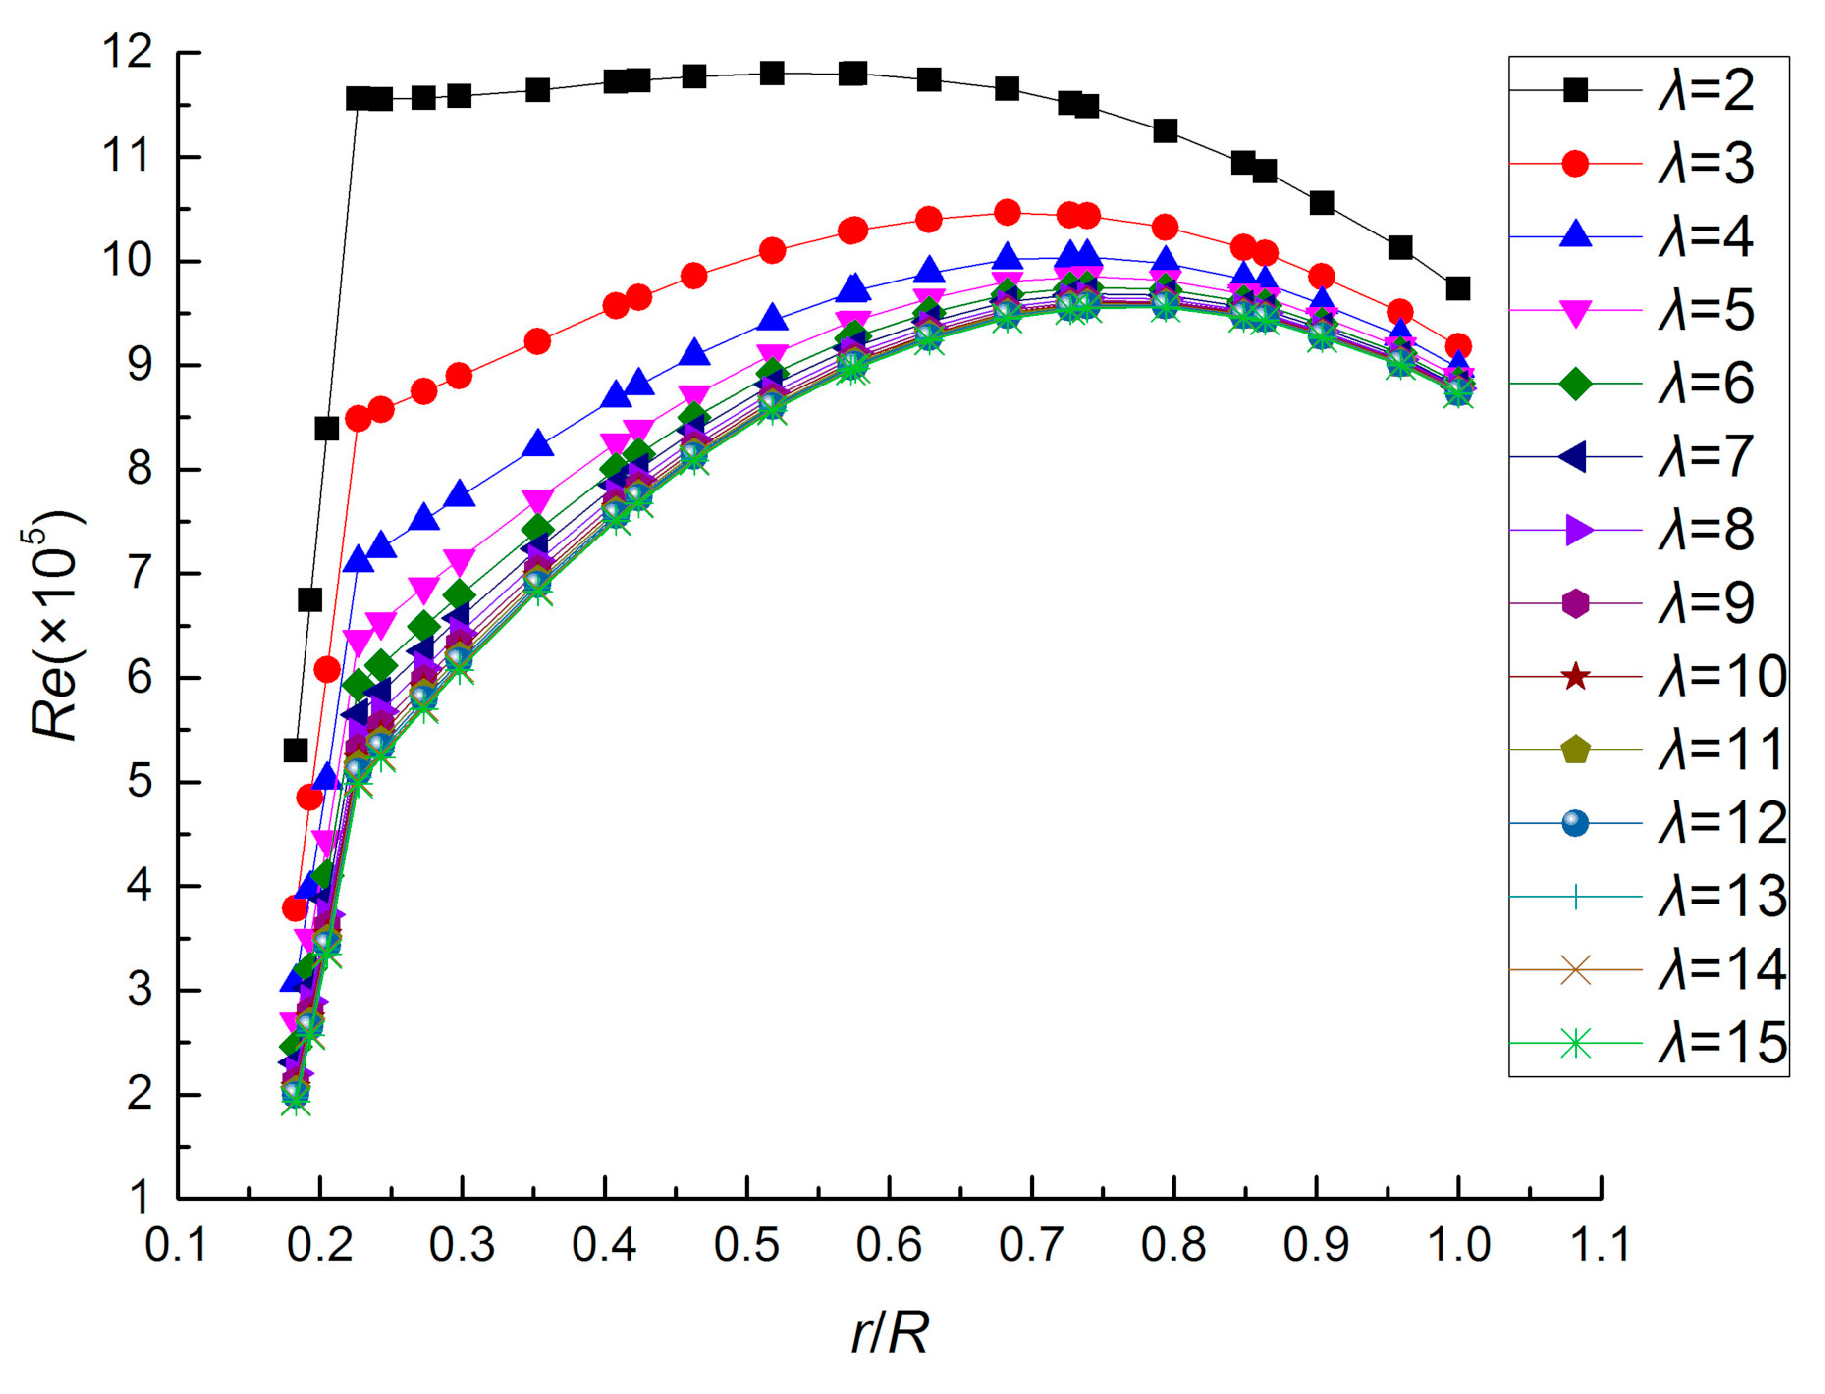
Figure 3.
Lift and drag coefficient comparisons for S809 airfoil in one-phase air flow: (a) CL at Re = 0.75 × 10⁶; (b) CL at Re = 1 × 10⁶; (c) CL at Re = 1.25 × 10⁶; (d) CL at Re = 1.5 × 10⁶; (e) CD at Re = 0.75 × 10⁶; (f) CD at Re = 1 × 10⁶; (g) CD at Re = 1.25 × 10⁶; (h) CD at Re = 1.5 × 10⁶.
Figure 3.
Lift and drag coefficient comparisons for S809 airfoil in one-phase air flow: (a) CL at Re = 0.75 × 10⁶; (b) CL at Re = 1 × 10⁶; (c) CL at Re = 1.25 × 10⁶; (d) CL at Re = 1.5 × 10⁶; (e) CD at Re = 0.75 × 10⁶; (f) CD at Re = 1 × 10⁶; (g) CD at Re = 1.25 × 10⁶; (h) CD at Re = 1.5 × 10⁶.


Figure 4.
Pressure coefficient distribution comparison for S809 airfoil in one-phase air flow at Re = 1 × 10⁶: (a) α = 8.2°; (b) α = 10.1°; (c) α = 12.2°; (d) α = 14.2°.
Figure 4.
Pressure coefficient distribution comparison for S809 airfoil in one-phase air flow at Re = 1 × 10⁶: (a) α = 8.2°; (b) α = 10.1°; (c) α = 12.2°; (d) α = 14.2°.

Figure 5.
Particle dispersion pictures at three St numbers: (a) Experiment at St = 0.98; (b) computation at St = 0.98; (c) experiment at St = 6.5; (d) computation at St = 6.5; (e) experiment at St = 19.7; (f) computation at St = 19.7.
Figure 5.
Particle dispersion pictures at three St numbers: (a) Experiment at St = 0.98; (b) computation at St = 0.98; (c) experiment at St = 6.5; (d) computation at St = 6.5; (e) experiment at St = 19.7; (f) computation at St = 19.7.
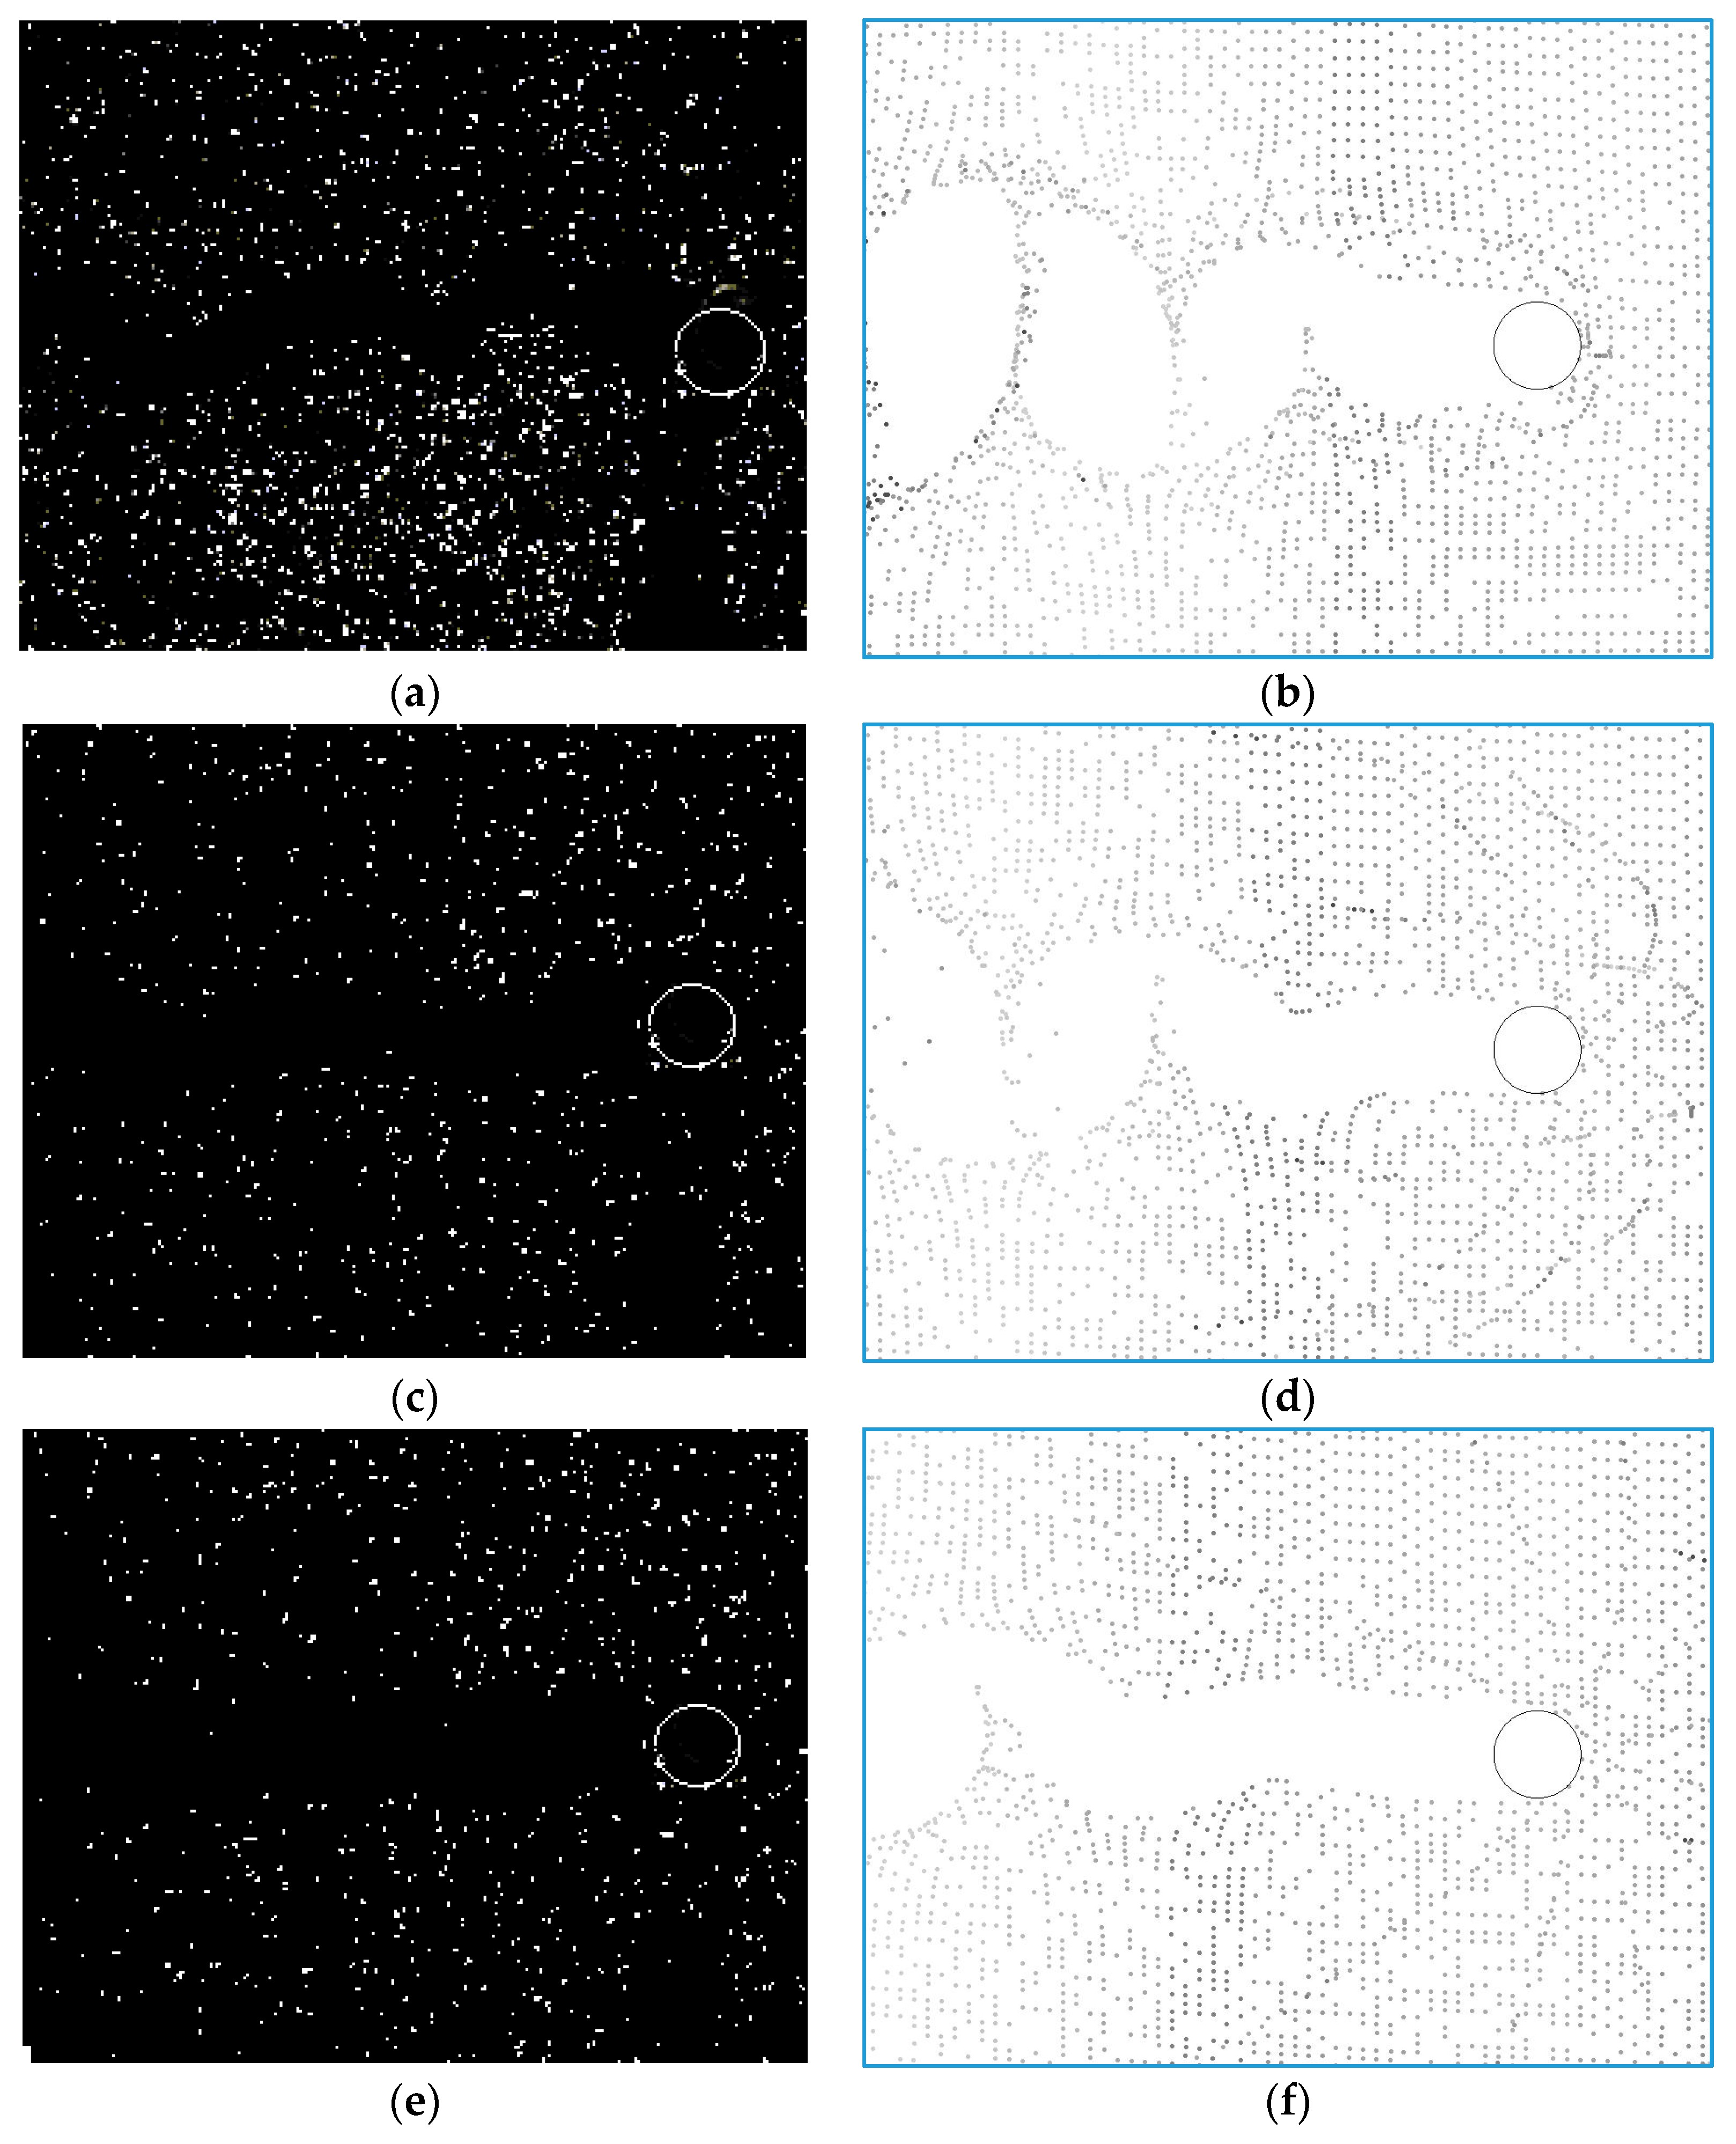
Figure 6.
Re effects on lift and drag coefficient increments of S809 airfoil at m = 1%: (a) Lift coefficient increment; (b) drag coefficient increment.
Figure 6.
Re effects on lift and drag coefficient increments of S809 airfoil at m = 1%: (a) Lift coefficient increment; (b) drag coefficient increment.
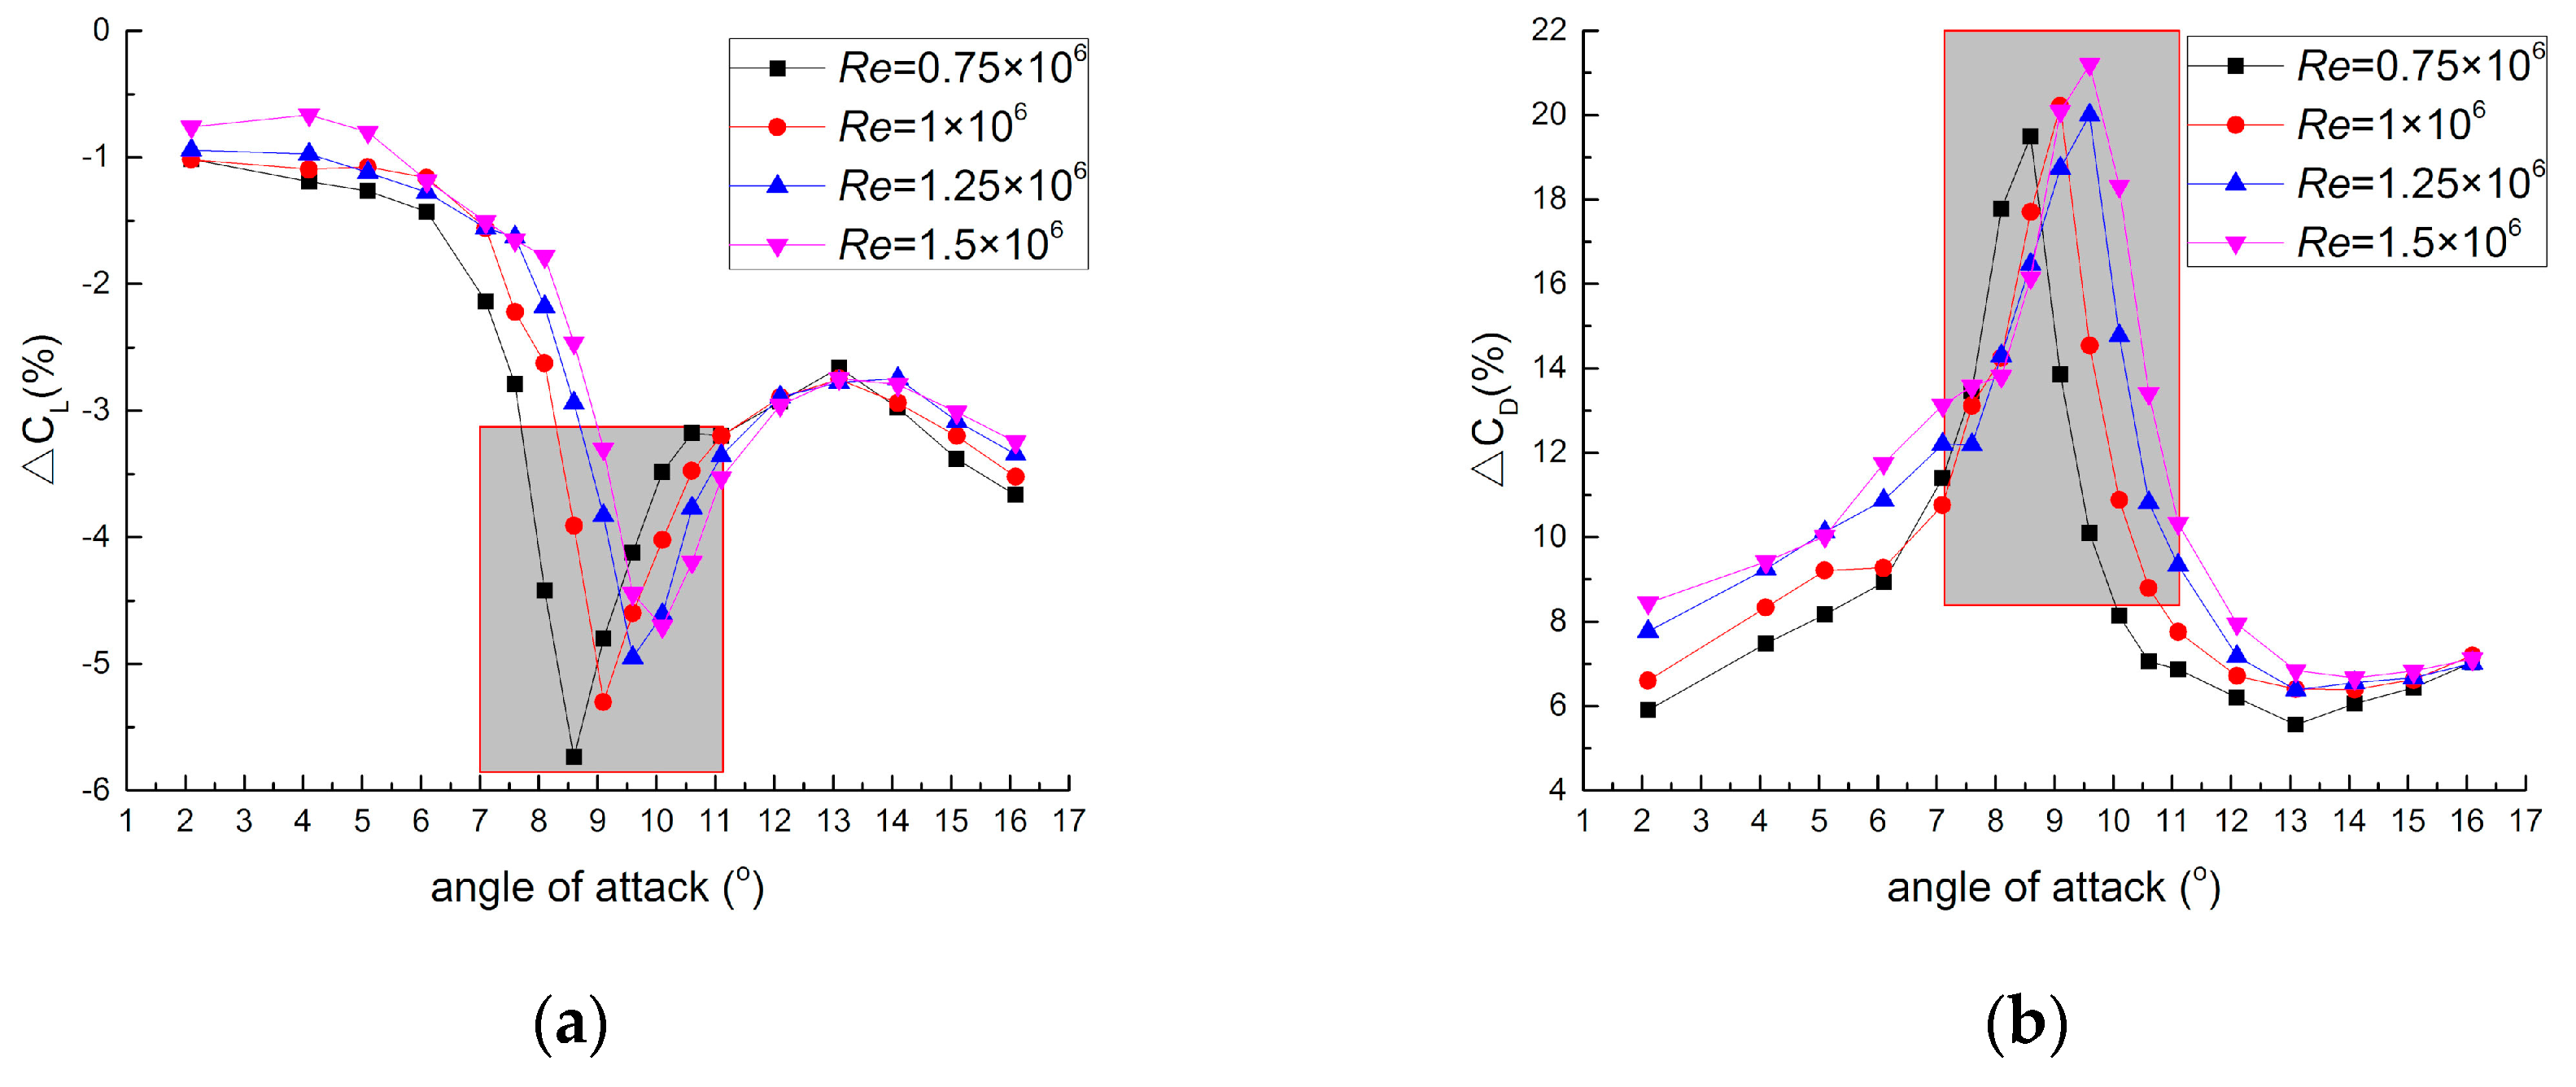
Figure 7.
Velocity profiles for S809 airfoil flow at α = 4.1° and Re = 1.5 × 10⁶.
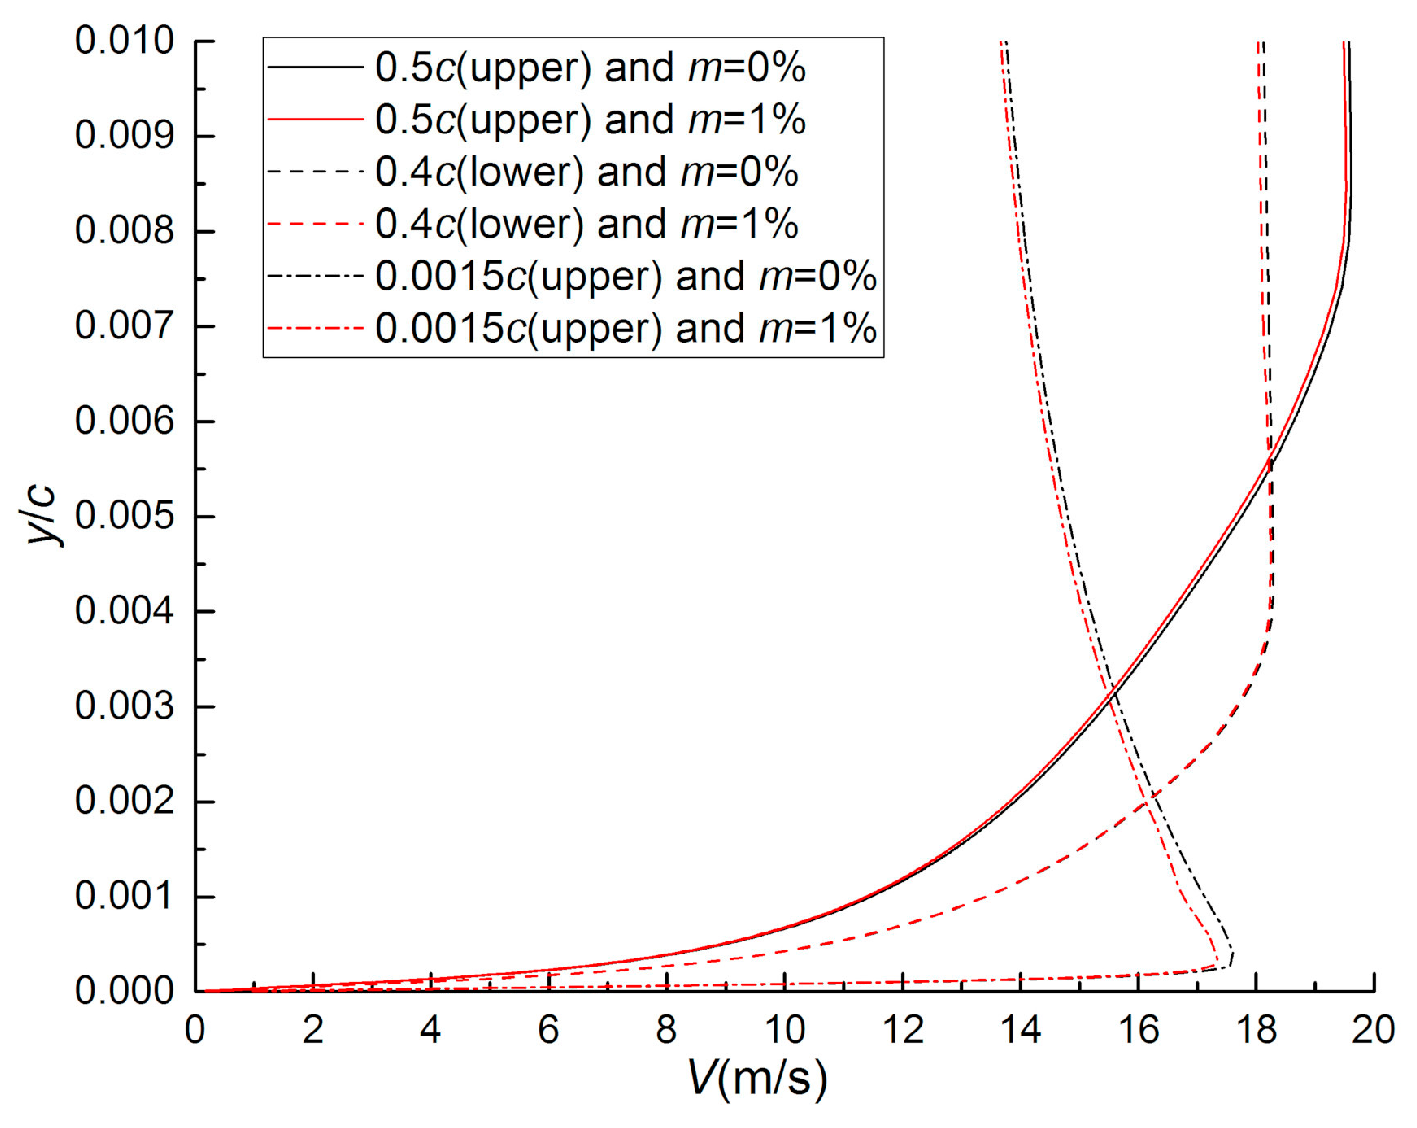
Figure 8.
Re effects on location and moving distance of separation point on S809 airfoil: (a) Location of separation point; (b) moving distance of separation point.
Figure 8.
Re effects on location and moving distance of separation point on S809 airfoil: (a) Location of separation point; (b) moving distance of separation point.
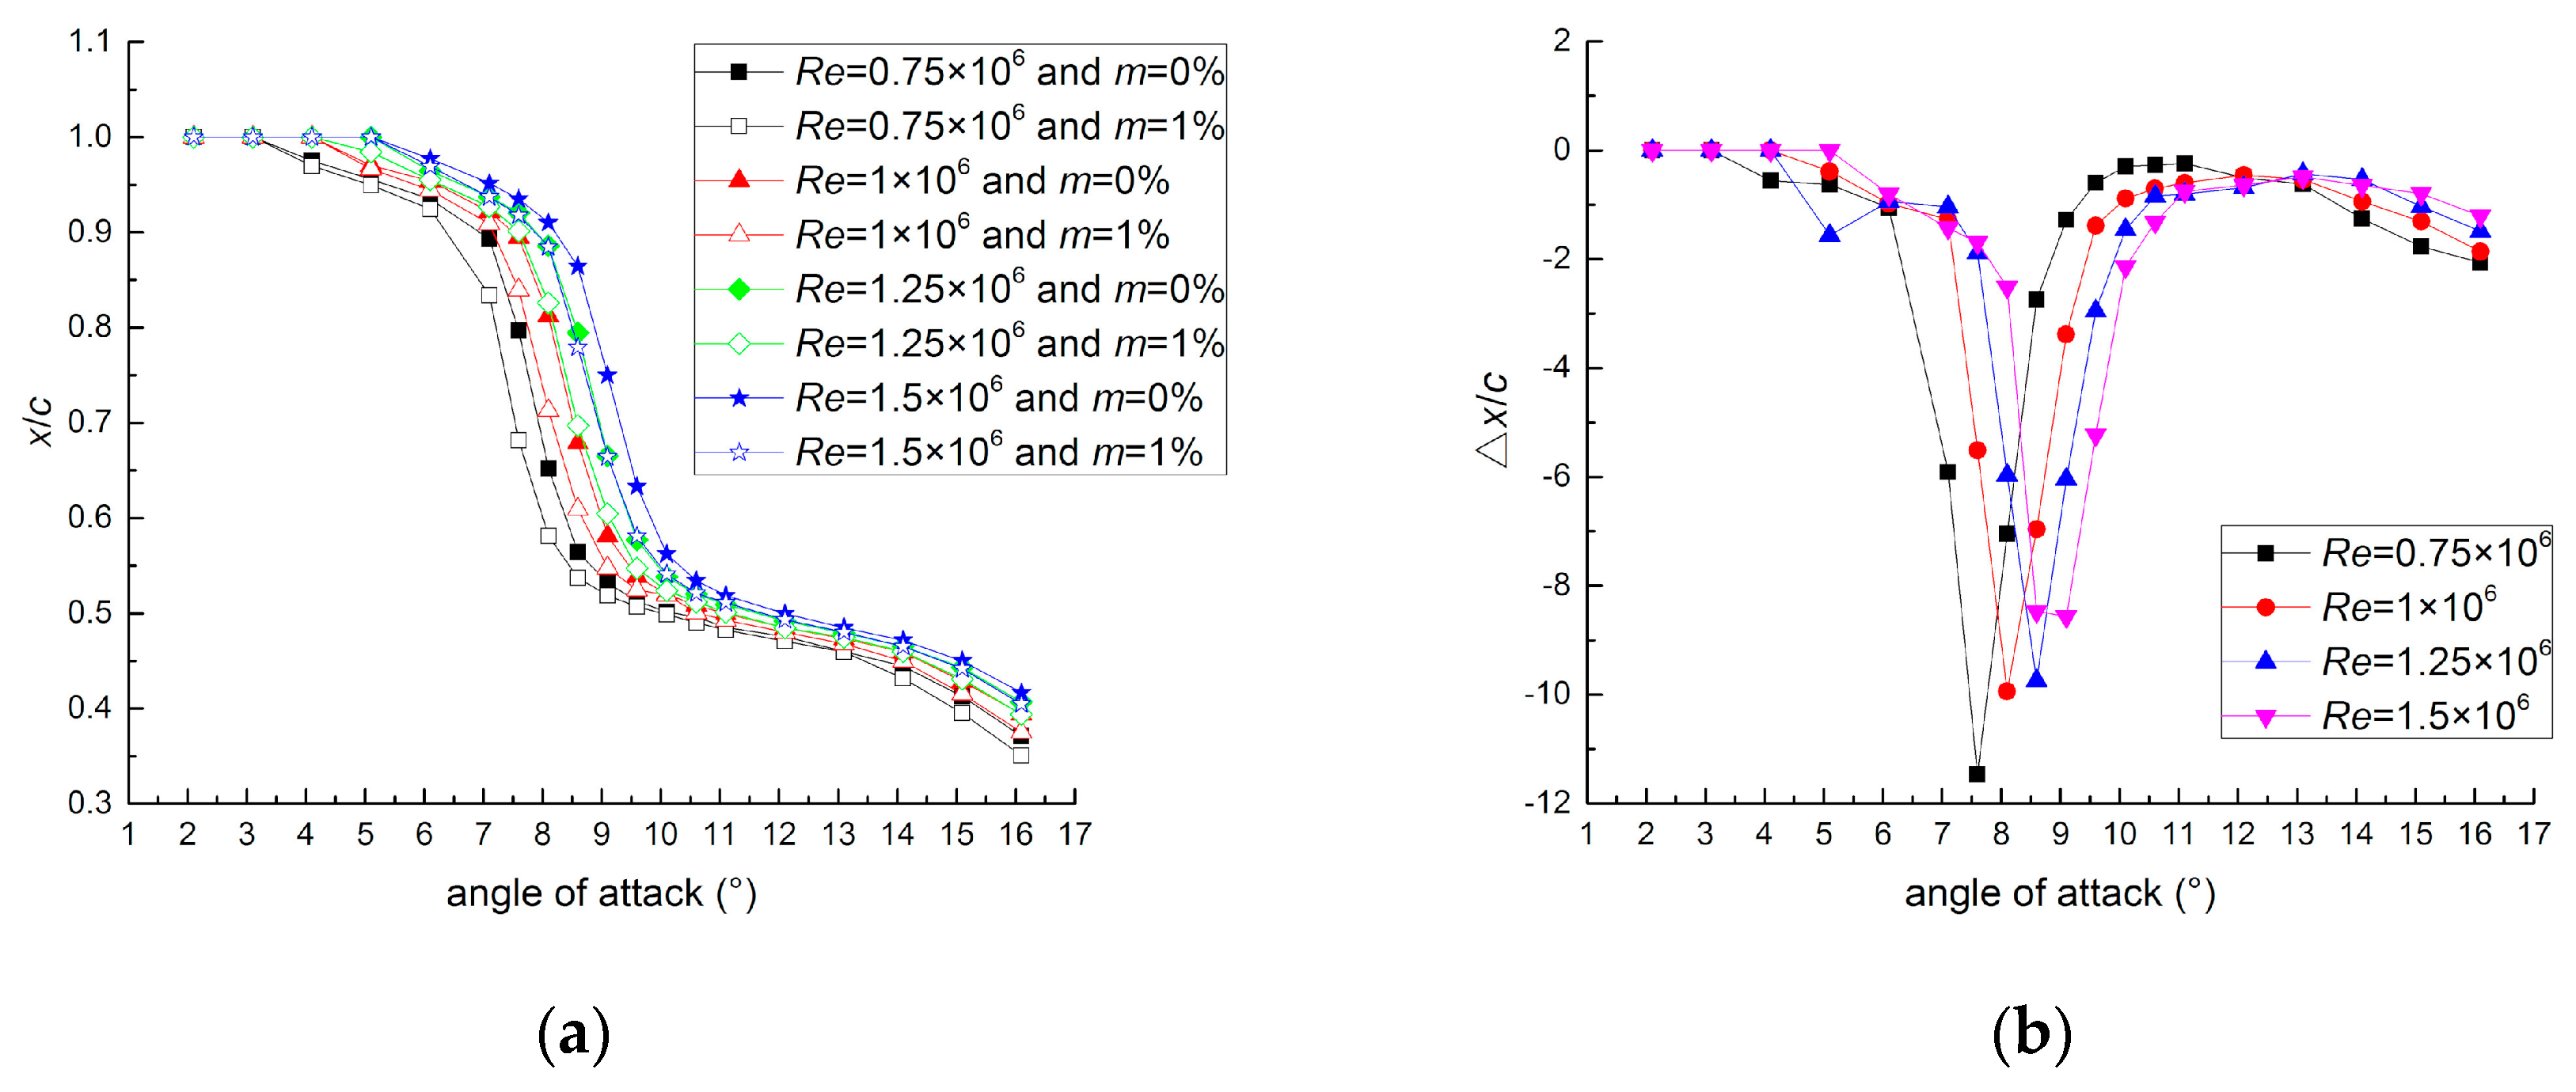
Figure 9.
Particle concentration effects on lift and drag coefficient increments of S809 airfoil at Re = 1 × 10⁶: (a) Lift coefficient increment; (b) drag coefficient increment.
Figure 9.
Particle concentration effects on lift and drag coefficient increments of S809 airfoil at Re = 1 × 10⁶: (a) Lift coefficient increment; (b) drag coefficient increment.
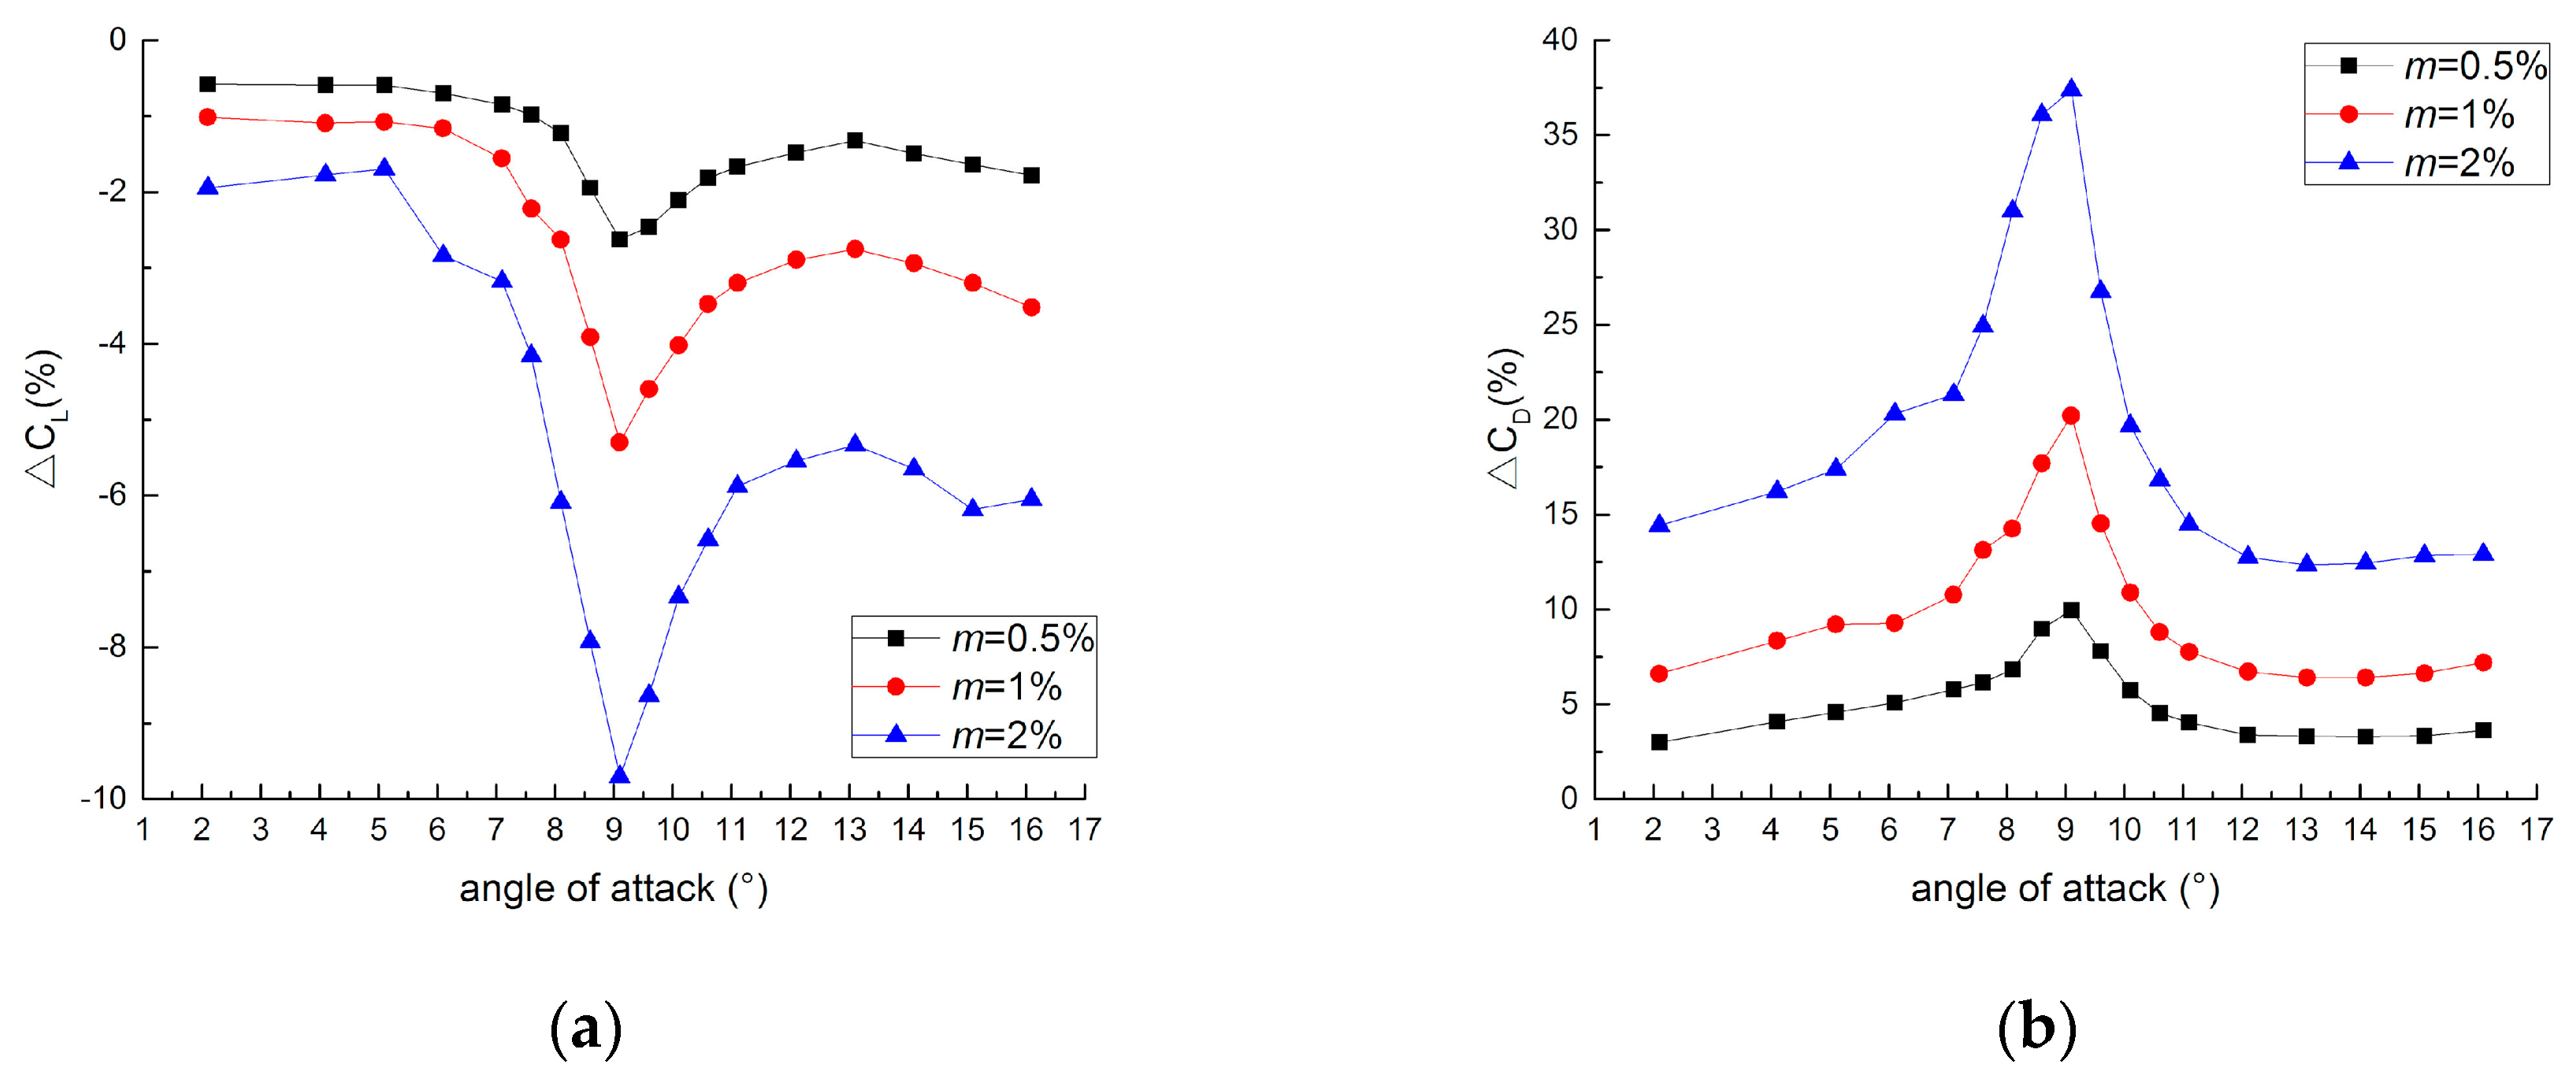
Figure 10.
Particle concentration effects on pressure coefficient distribution over S809 airfoil at Re = 1 × 10⁶: (a) α = 4.1°; (b) α = 9.1°.
Figure 10.
Particle concentration effects on pressure coefficient distribution over S809 airfoil at Re = 1 × 10⁶: (a) α = 4.1°; (b) α = 9.1°.

Figure 11.
Particle concentration effects on moving distance of separation point on S809 airfoil at Re = 1 × 10⁶.
Figure 11.
Particle concentration effects on moving distance of separation point on S809 airfoil at Re = 1 × 10⁶.
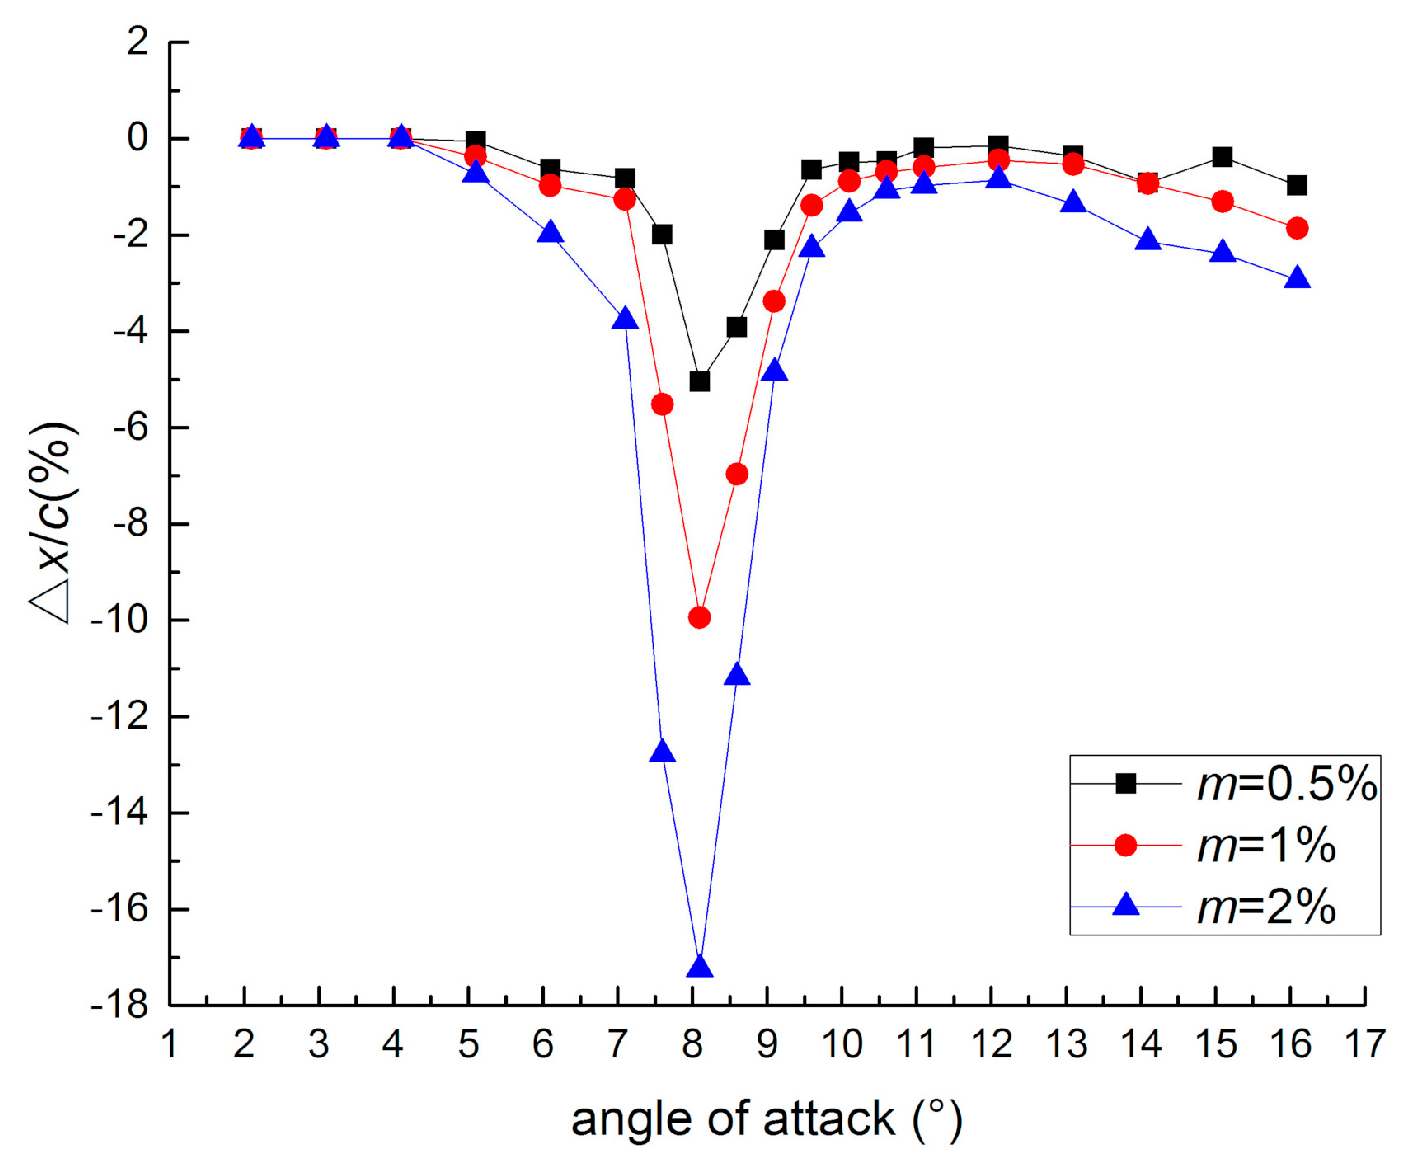
Figure 12.
Particle concentration effects on lift-to-drag ratio of S809 airfoil at Re = 1 × 10⁶.

Figure 13.
Configurations of NH6MW25 and S809 airfoils.
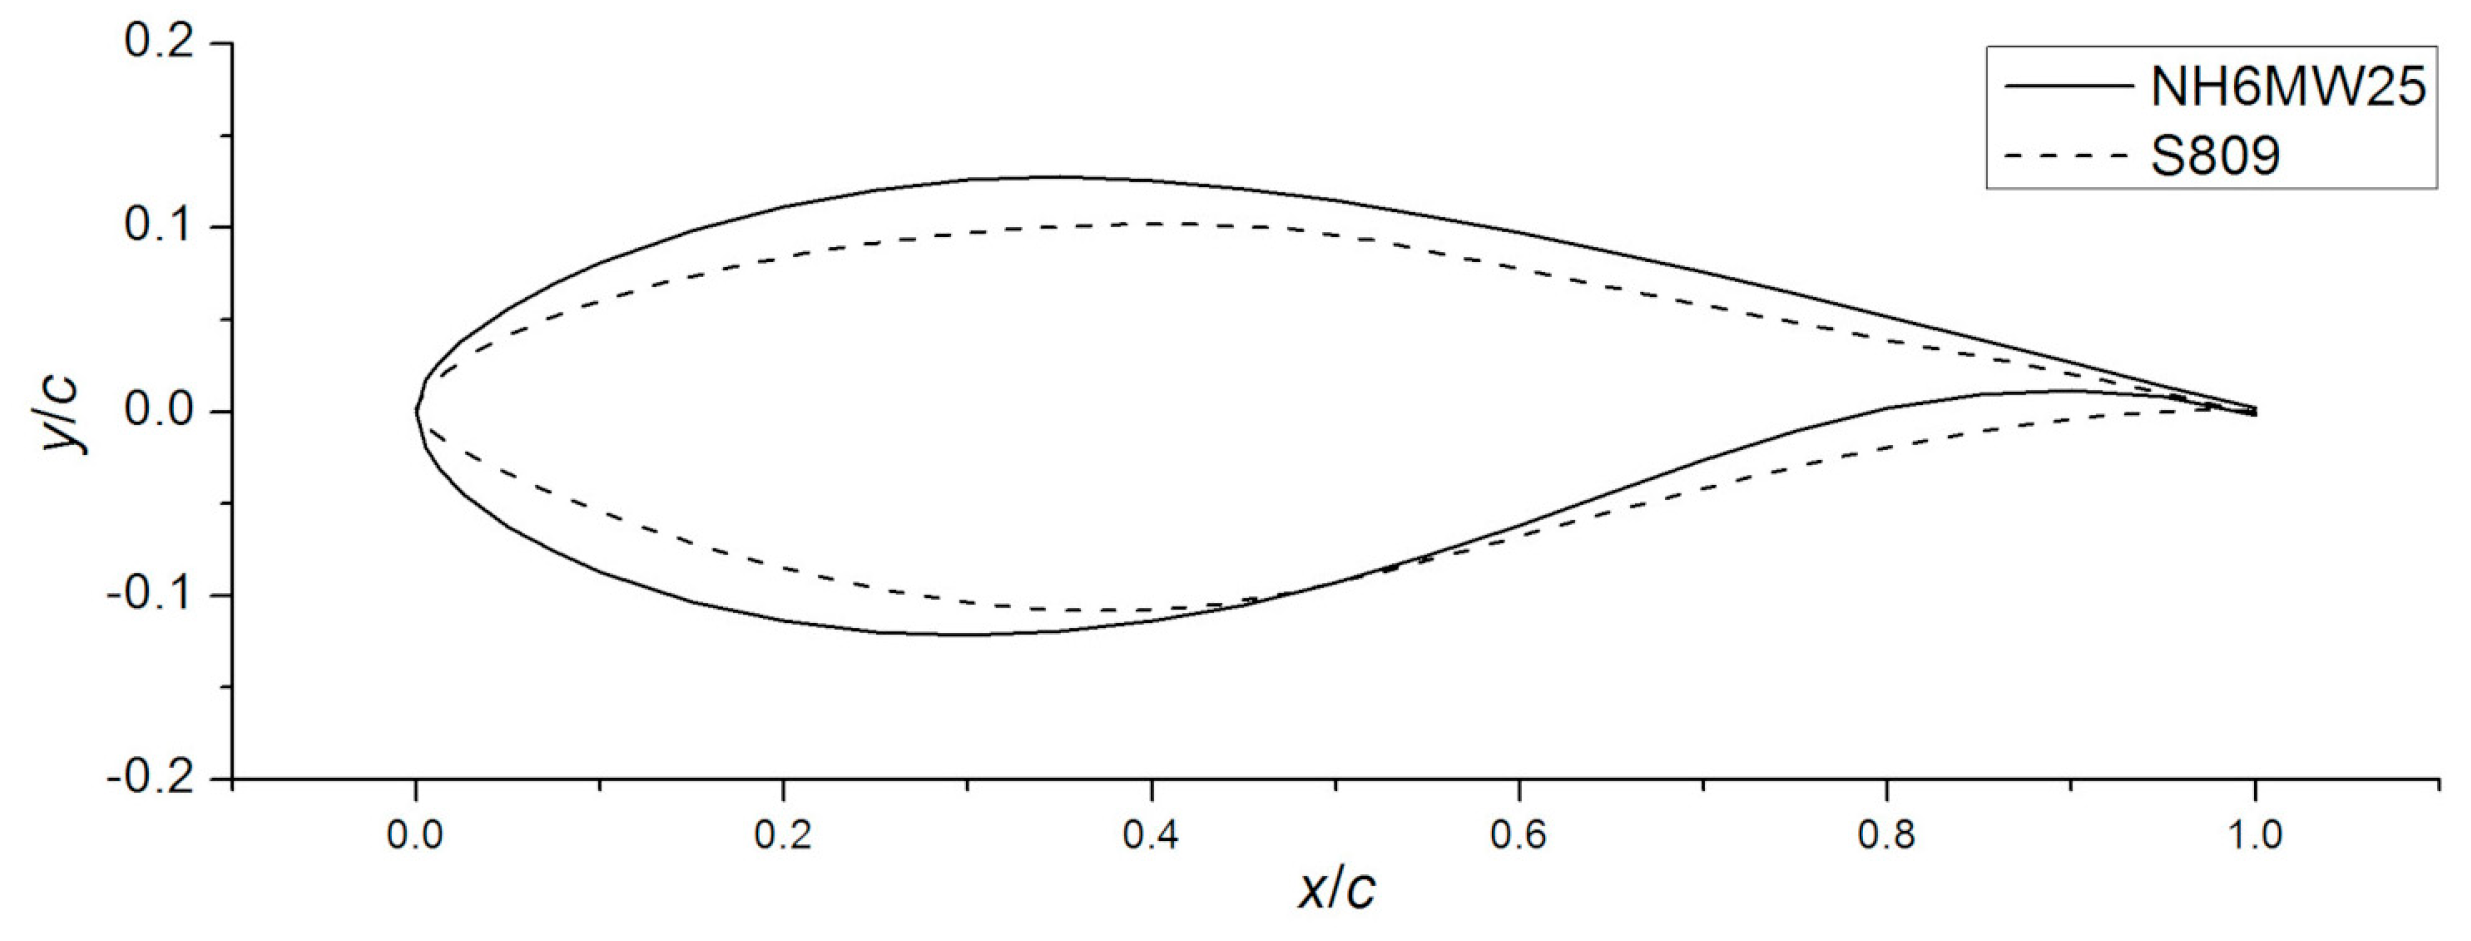
Figure 14.
Comparison of lift coefficient curves between three airfoils at Re = 1 × 10⁶.

Figure 15.
Lift and drag coefficient increments of NH6MW25 at m = 1% and Re = 1 × 10⁶.
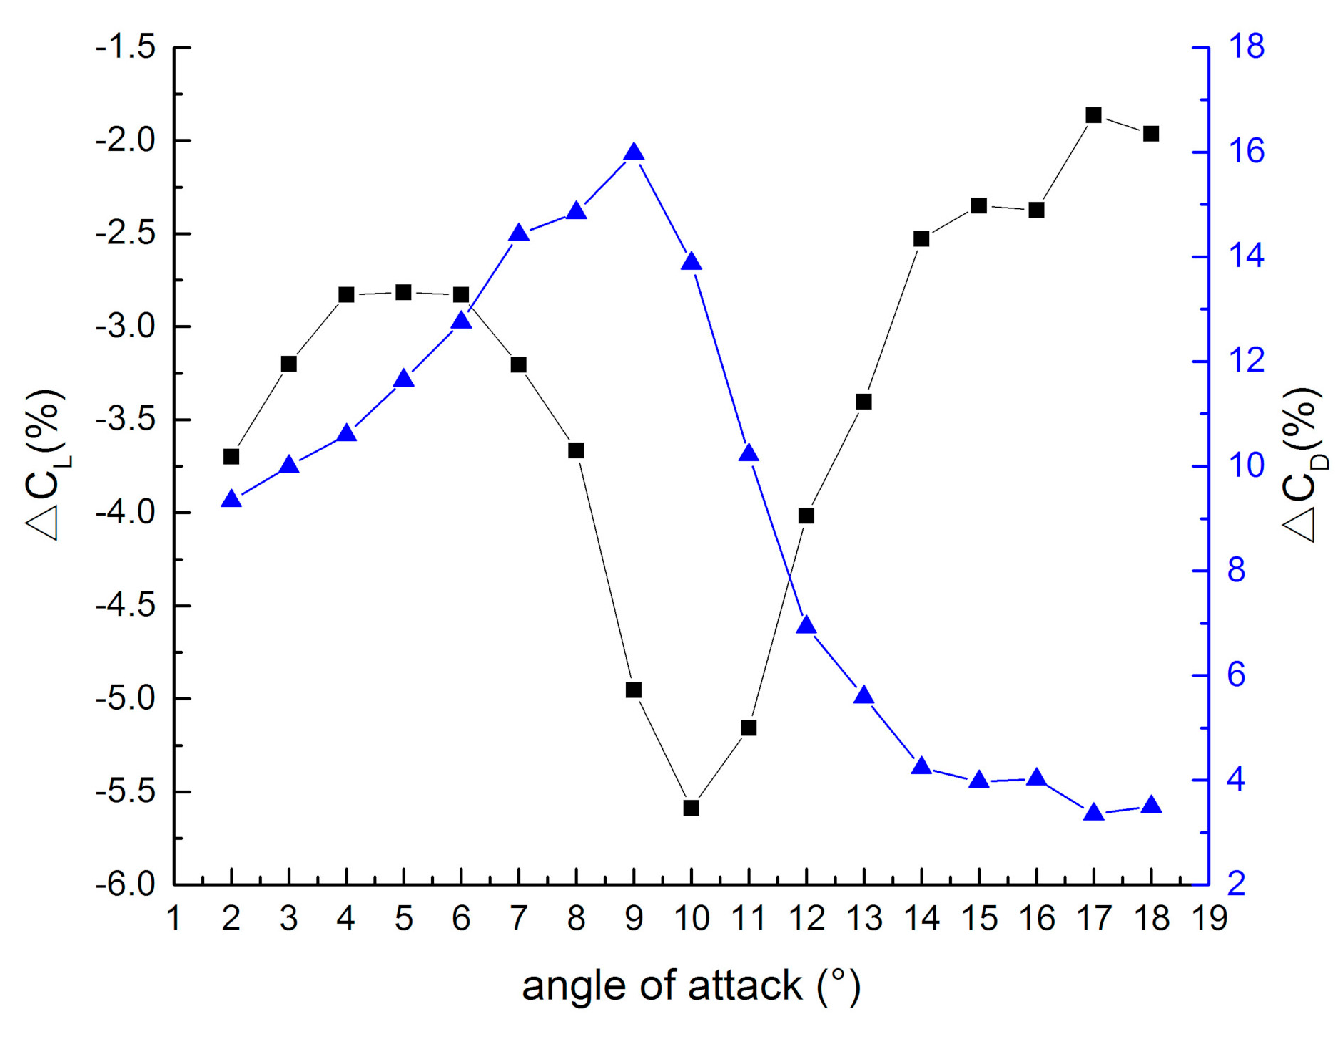
Figure 16.
Lift and drag coefficient increments of NACA0012 at m = 1% and Re = 1 × 10⁶.
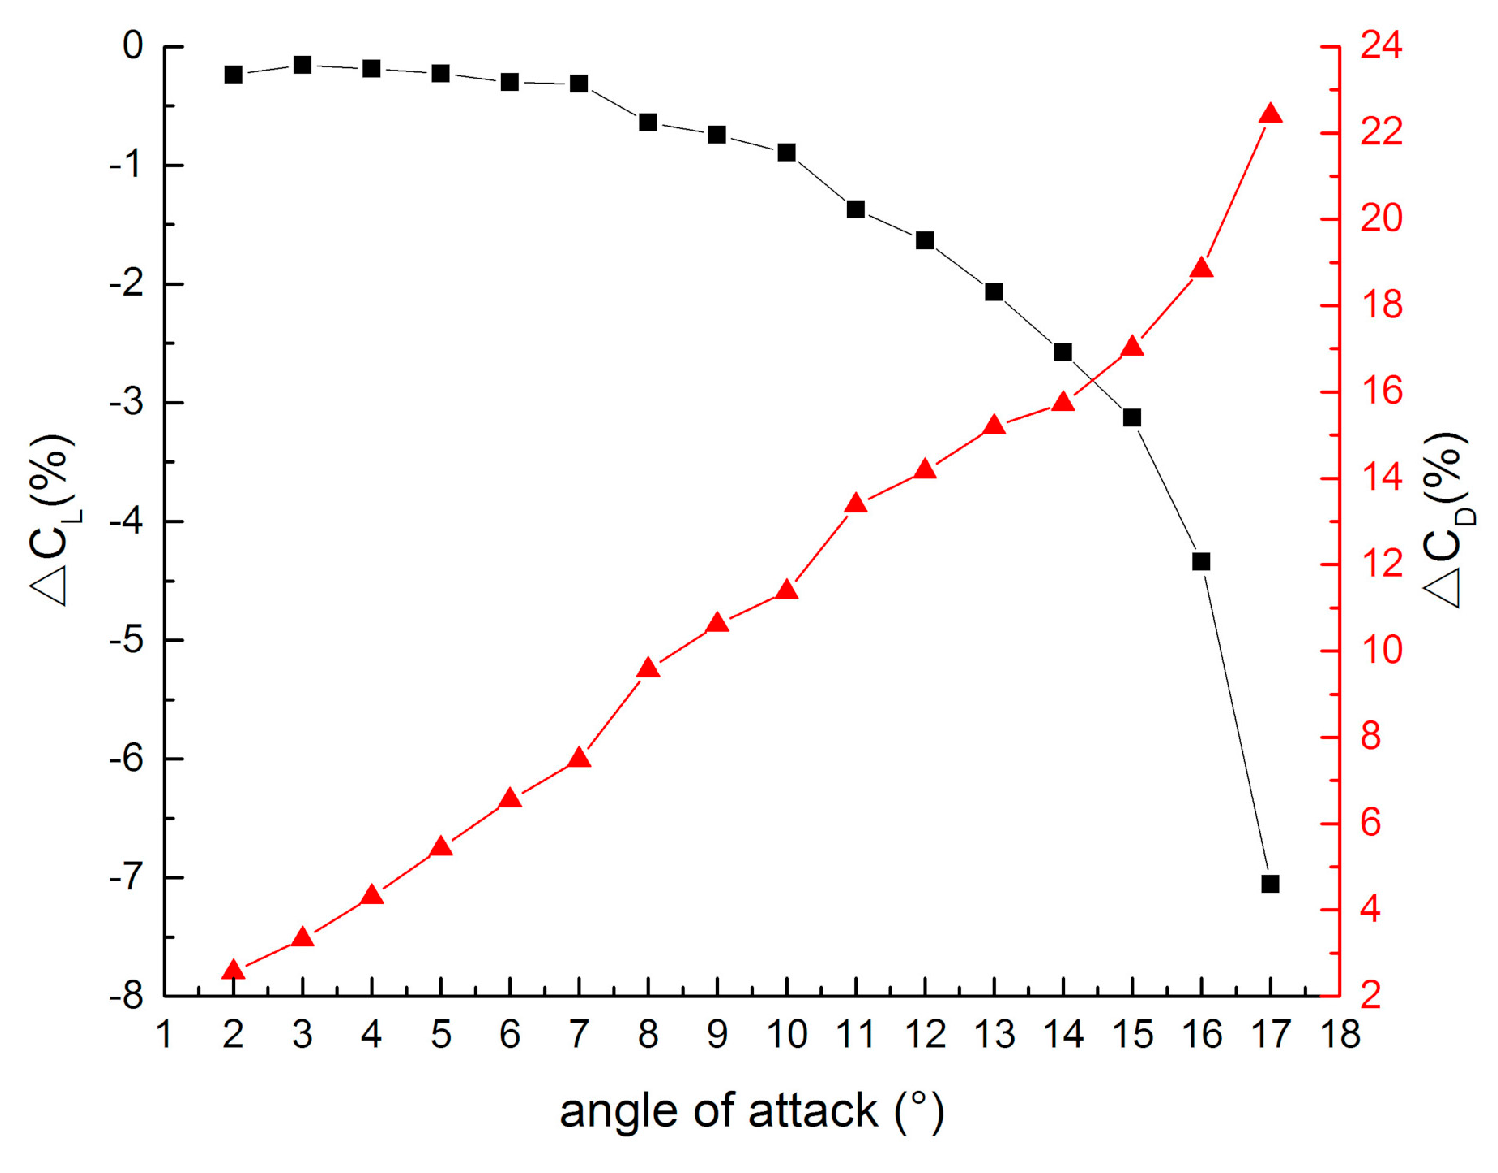
Figure 17.
Location and moving distance of separation point for three airfoils at Re = 1 × 10⁶: (a) Location of separation point; (b) moving distance of separation point.
Figure 17.
Location and moving distance of separation point for three airfoils at Re = 1 × 10⁶: (a) Location of separation point; (b) moving distance of separation point.
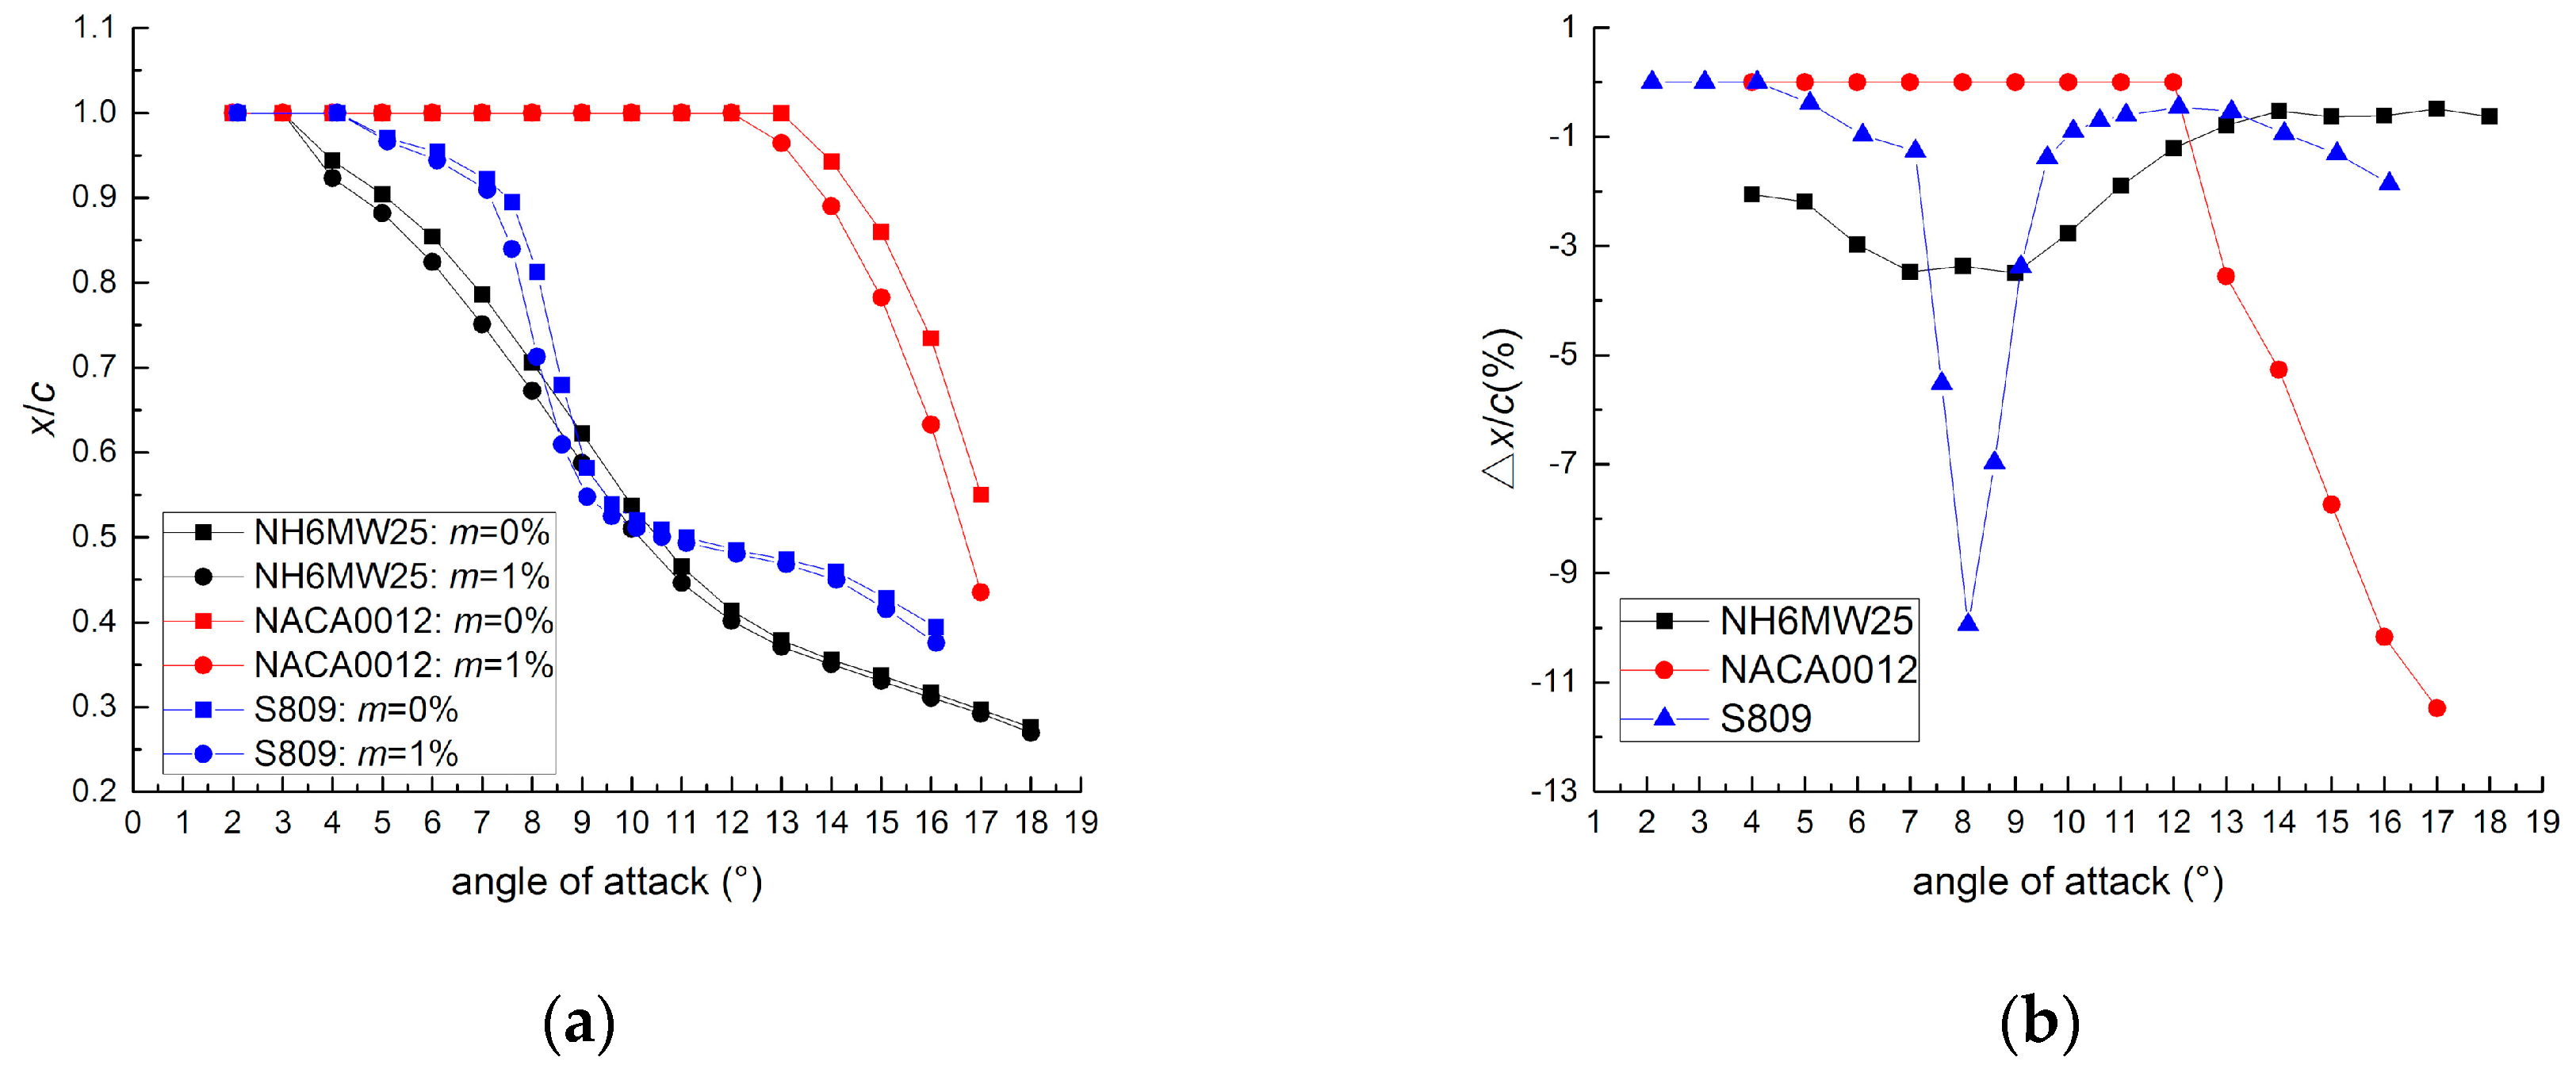
Figure 18.
Pressure coefficient distributions over two airfoils at Re = 1 × 10⁶ and m = 0%: (a) NH6MW25 airfoil; (b) S809 airfoil.
Figure 18.
Pressure coefficient distributions over two airfoils at Re = 1 × 10⁶ and m = 0%: (a) NH6MW25 airfoil; (b) S809 airfoil.

Figure 19.
Angles of attack of Phase VI blade sections at different tip speed ratios.

© 2019 by the authors. Licensee MDPI, Basel, Switzerland. This article is an open access article distributed under the terms and conditions of the Creative Commons Attribution (CC BY) license (http://creativecommons.org/licenses/by/4.0/).
Share and Cite
MDPI and ACS Style
Guo, T.; Jin, J.; Lu, Z.; Zhou, D.; Wang, T. Aerodynamic Sensitivity Analysis for a Wind Turbine Airfoil in an Air-Particle Two-Phase Flow. Appl. Sci. 2019, 9, 3909. https://doi.org/10.3390/app9183909
AMA Style
Guo T, Jin J, Lu Z, Zhou D, Wang T. Aerodynamic Sensitivity Analysis for a Wind Turbine Airfoil in an Air-Particle Two-Phase Flow. Applied Sciences. 2019; 9(18):3909. https://doi.org/10.3390/app9183909
Chicago/Turabian StyleGuo, Tongqing, Junjun Jin, Zhiliang Lu, Di Zhou, and Tongguang Wang. 2019. "Aerodynamic Sensitivity Analysis for a Wind Turbine Airfoil in an Air-Particle Two-Phase Flow" Applied Sciences 9, no. 18: 3909. https://doi.org/10.3390/app9183909
Note that from the first issue of 2016, this journal uses article numbers instead of page numbers. See further details here.