Double-Diffracted Spatially Separated Heterodyne Grating Interferometer and Analysis on its Alignment Tolerance


1
School of Instrumentation Science and Engineering, Harbin Institute of Technology, Harbin 150080, China
2
Key Lab of Ultraprecision Intelligent Instrumentation, Ministry of Industry and Information Technology, Harbin 150080, China
*
Author to whom correspondence should be addressed.
†
These authors contribute equally to this work.
Appl. Sci. 2019, 9(2), 263; https://doi.org/10.3390/app9020263
Submission received: 5 December 2018
/
Revised: 31 December 2018
/
Accepted: 8 January 2019
/
Published: 13 January 2019
(This article belongs to the Special Issue Precision Dimensional Measurements)
Abstract
:An optical configuration of double-diffracted spatially separated heterodyne grating interferometer with a mechanical fixture was designed. To further investigate its features and provide robust measurements, the alignment tolerance in double-diffracted spatially separated heterodyne grating interferometer was qualitatively and quantitatively analyzed. Except for the offset error causing no influence on the interfering signal, the effect of the other four errors, roll, yaw, pitch angles, and stand-off error were geometrically analyzed and mathematically modeled. The simulation result quantified the position mismatches of output beams in a double-diffracted configuration and found the crucial structural parameters related to the intensity of interfering signals. Experiments based on the grating interferometer with a mechanical fixture and the same optical configuration built by independent optical components were implemented, whose results agreed with the simulation. Besides, the results showed that the proposed grating interferometer structure could tolerate the ±1100 arcsec roll movement, ±440 arcsec yaw movement, ±280 arcsec pitch movement, and ±0.6 mm stand-off error when -10 dB intensity loss is afforded.
1. Introduction
Nowadays, development in modern technology and industry requires more precise displacement measurement and nanopositioning sensors. Taking semiconductor manufacturing as an example, because of the decreasing node size, measuring the spatial position and attitude of a wafer stage in lithography will be a challenge for high accuracy and stability [1].
The trend towards a stable sub-nanometer accuracy measurement propels grating interferometer, a substitution for a laser interferometer, to be the solution of displacement measurement in a lithography machine. Advantages of the grating interferometer mainly have two aspects.
One is the resistance to ambient disturbance, especially to the fluctuation of the air refractive index, which makes it convenient to achieve accuracy in the sub-nanometer scale. Referring to the work of Gao et al., the measuring uncertainty of a laser interferometer is mainly caused by air the refractive index error and wavelength error, while the influences of a grating interferometer are manufacturing errors and thermal expansion of the scale [2]. Compared with those influencing factors in a laser interferometer, the manufacturing errors and thermal expansion of the grating are easier to control by the use of zero thermal expansion materials and the development of a fabrication technique of gratings. Recently, Deng et al. achieved linear displacement measurement with 68.6 pm resolution by using eightfold optical construction equipping a 1780 lines/mm high-density grating [3].
Another advantage is that the utilization of optical components such as large planar gratings makes grating interferometer easy to implement an additional measuring dimension. Considering a measured rigid body, its spatial degree of freedoms (DOF) include three translational DOFs and three rotational DOFs. The grating interferometer has been widely used in multi-DOF metrology systems. For instance, Huang et al. proposed a 3-DOF homodyne laser encoder using grating interferometry and quadrant detectors (QD) to measure movement along the x-direction and rotation around the x-axis and y-axis; the angular measuring ranges were ±100 arcsec [4]. Lee et al. designed a similar 6-DOF optical encoder with ±200 arcsec angular measuring ranges [5]. Li et al. reported researches on 6-DOF homodyne surface encoders in a multi-probe all-interferometric configuration and a grating-QD combination, the angular measuring ranges of which were over 60 arcsec [6,7]. The limitation of these ranges mentioned above could be attributed to angular mismatches—the beam misalignment caused by the rotations of the grating.
As a common method to attain a high fold factor, the double-diffraction structure also has the feature of effectively enhancing the alignment tolerance (also written head-to-scale tolerance in some references) [8,9,10]. Feng et al. proposed a 2-DOF double-diffracted heterodyne grating interferometer in common optical path configuration. However, the specific alignment tolerance was not mentioned [9]. Because the output beams are parallel with the incident beams, the double-diffraction structure is capable of turning the angular mismatches into the position mismatches—the deviations of output beams. However, it is worth emphasizing that the position mismatches will still cause intensity loss of interfering beams so that further analyses still need to be investigated.
Currently, as a newly proposed concept, spatially separated heterodyne grating interferometer, which focuses on eliminating the periodic nonlinear errors from several to tens of nanometers, has become an effective approach to sub-nanometer scale measurement accuracy [11,12,13]. Compared with a typical common optical path grating interferometer, being spatially separated means it has two parallel modulated laser beams with frequency differences. To further improve its performance and lay a foundation for future multi-DOF measurements, the alignment tolerance of spatially separated heterodyne grating interferometer was analyzed on the structure with a mechanical fixture of our design. Qualitative analysis, quantitative simulations and experiments are implemented and described in the following sections.
2. Optical Configuration and Mechanical Fixture of the Proposed Grating Interferometer
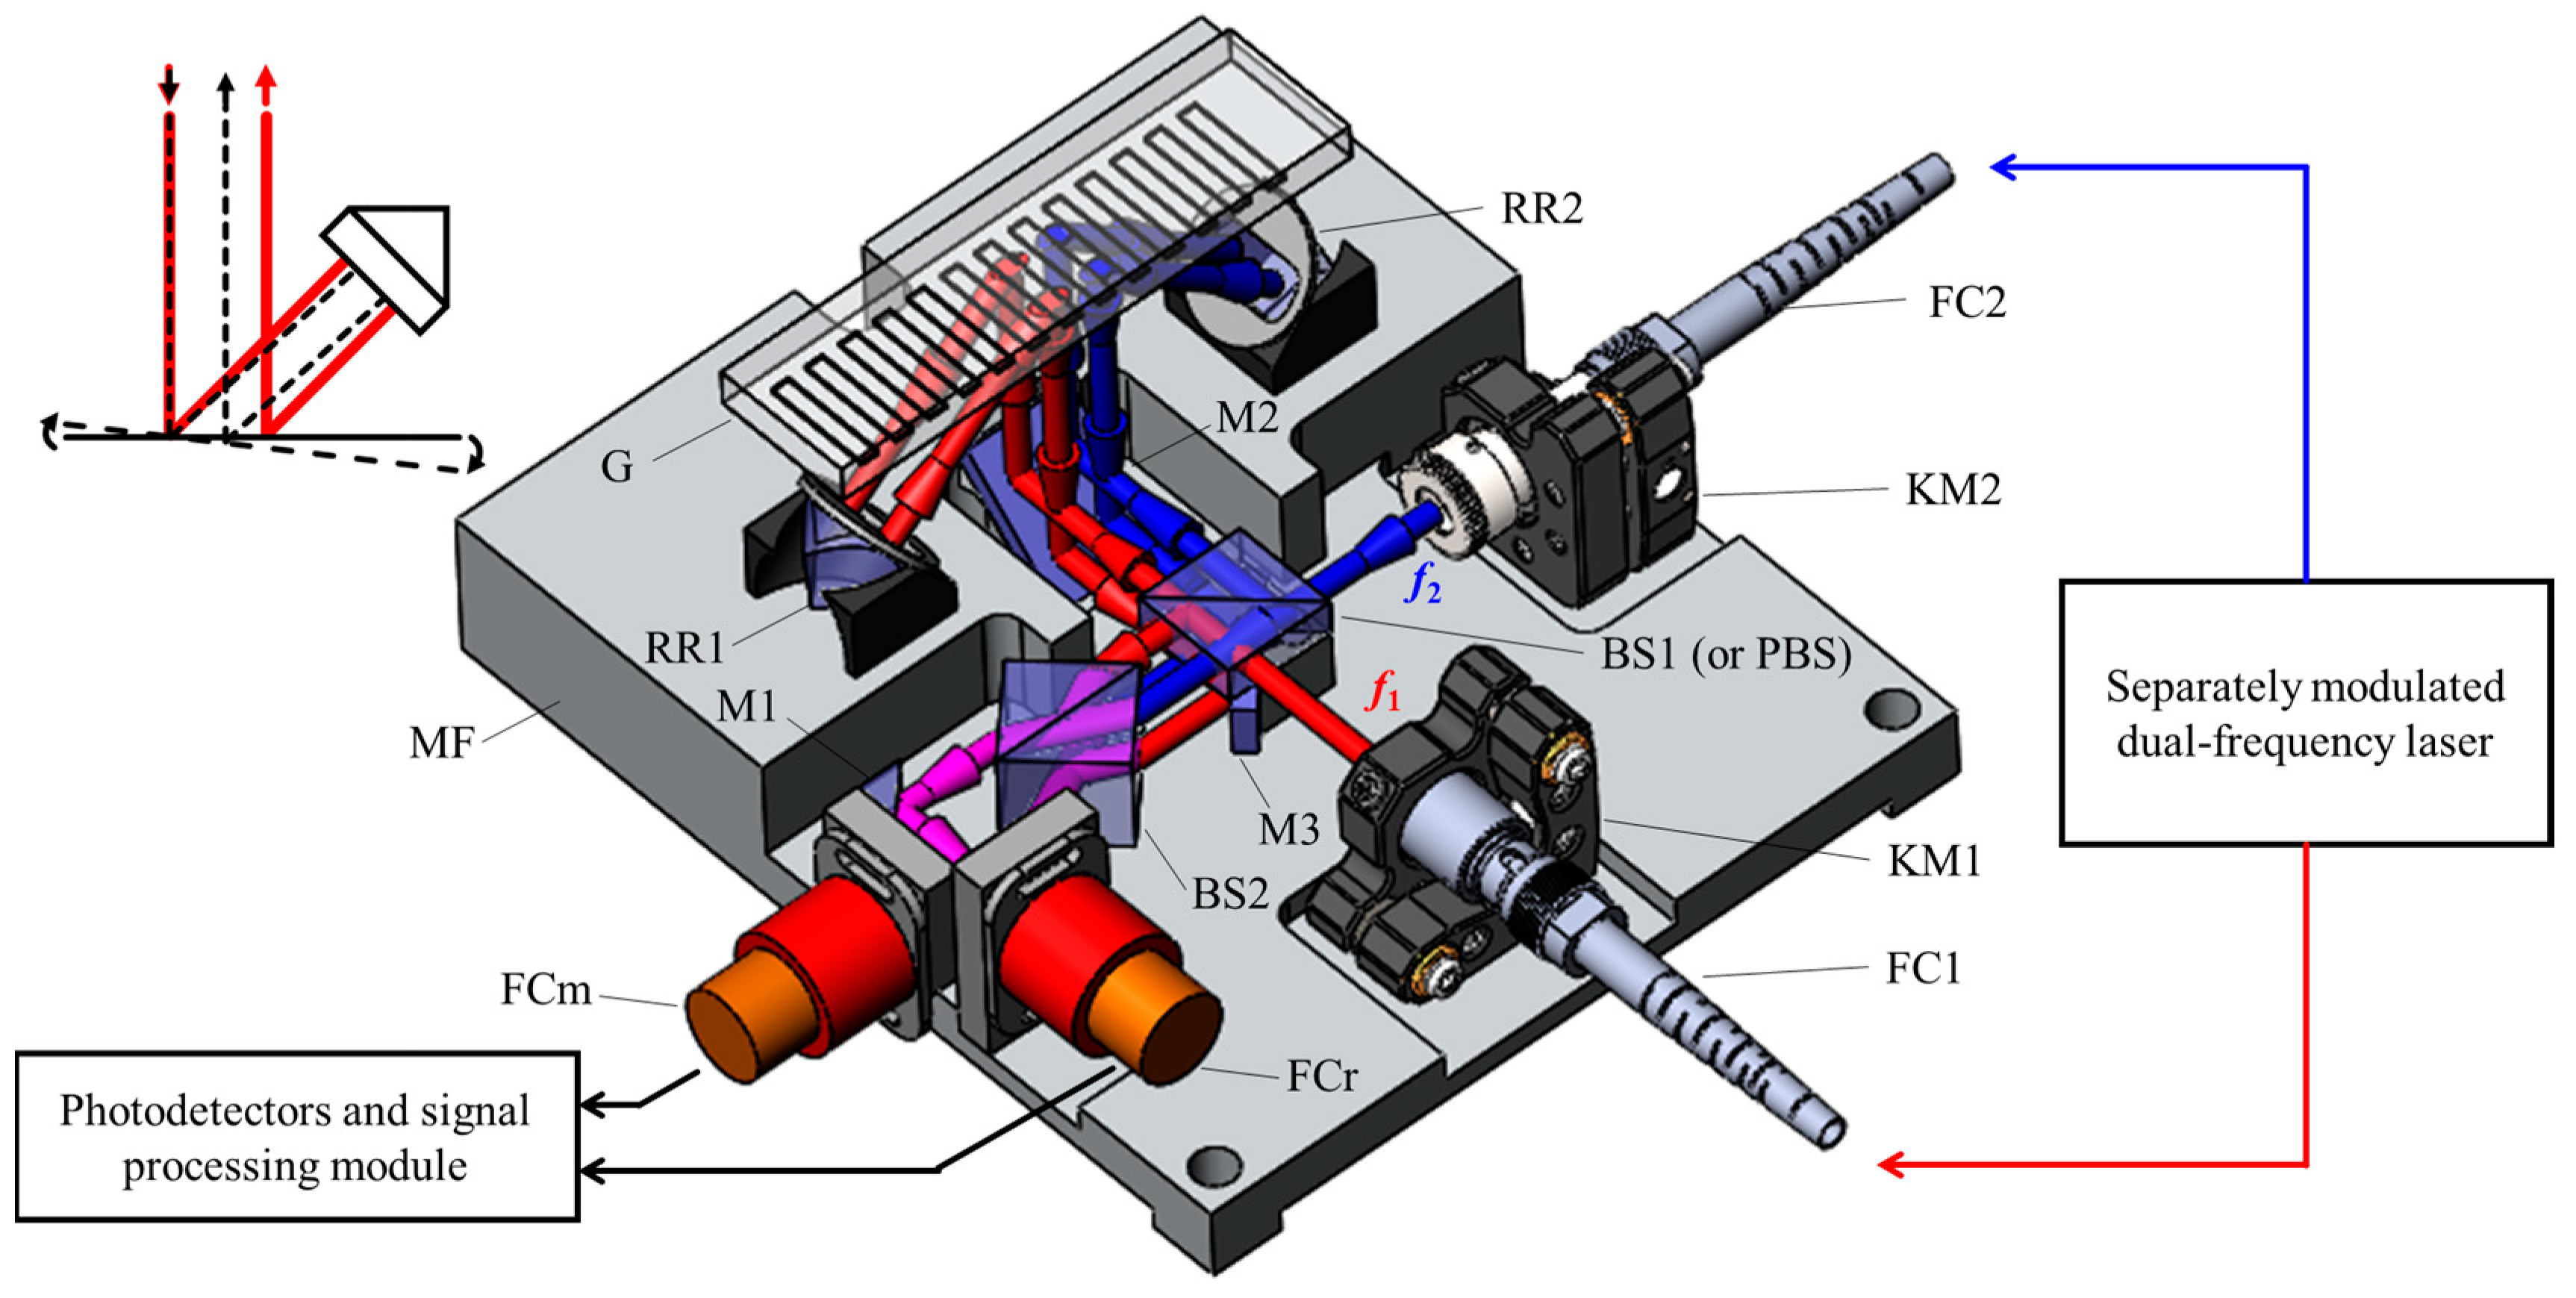
Based on the concept of spatially separated heterodyne grating interferometer reported in our previous study [12], the optical configuration of the proposed grating interferometer is shown in Figure 1. Considering the real sizes of all components, several changes and adjustments were made to form a compact layout.
From a typical separately modulated heterodyne laser source, beams at different frequencies were transferred into the optical reading head via polarization maintaining optical fibers. Instead of a parallel distribution, two fiber collimators (FC1 and FC2) in vertical distribution guaranteed enough space for mounting and adjusting. The beams were divided into two parts, the reference part and measurement part, in the beam splitter (BS1). Then, the reference beam was combined in the upper part of the beam splitter (BS2), reflected at the surface of the mirror (M1), entered into the fiber coupler (FCr), and transferred to the corresponding photodetector by a multi-mode optical fiber. Another part of the beams reflected at the mirror (M2) to change directions for a compact layout and diffracted by the linear grating (G) at a normal incident angle. In the diffraction, called the first diffraction here, each of the beams generated a pair of ±1st order diffracted beams following their diffraction angles. Choosing a +1st order and a −1st order diffracted beam with different modulated frequencies f1 and f2 propagating symmetrically, two corner-cube retro-reflectors (RR1 and RR2) were replaced to cause a U-turn of the chosen beams. Then, following the grating equation, these beams entered the grating at oblique incident angles and were diffracted again. To be unambiguous, this diffraction was called the second diffraction. Obviously, only two of all the diffracted beams spread away from the grating vertically, with fourfold Doppler frequency shifts. It is worth emphasizing that the retro-reflectors guarantee that the selected diffracted beams of the second diffraction are parallel with the incident beams of the first diffraction when unexpected tip and tilt of grating occur. After being reflected in proper order by mirrors M2 and M3, the measurement beam was generated in the lower part of BS2. Similar to the reference beam, it entered the fiber coupler (FCm) and transferred to its photodetector by another multi-mode optical fiber. Displacement information, contained in Doppler frequency shifts, was detected by photodetectors and extracted from electrical signals by the processing board.
Compared to our previous study [13], the biggest improvement in optical configuration was substituting a polarized beam splitter (PBS) and half wave plate by the beam splitter BS1 and the mirror M3. The advantages were that not only that less beam splitter was used, but also that it was a polarized-insensitive optical configuration. In particular, it could be configured into a polarized or non-polarized interferometer by using a PBS or a BS at the place of BS1, decreasing the requirement of the laser source.
The mechanical fixture is also displayed in Figure 1. As shown, a pedestal with holes for mounting is designed for supporting all optical and mechanical components. Two optical fiber collimators were fixed on matched kinematic mounts fastening onto the pedestal. The parallelism of beams was adjusted to several arc-seconds by kinematic mounts so that the assembling error could be omitted in simulations and experiments below. Optical components, including beam splitters, mirrors and corner-cube retro-reflectors, were glued on the pedestal by ultraviolet curable adhesive. Moreover, two optical fiber couplers mounted on custom mechanical components (red and orange columns) were also glued onto the pedestal. The grating interferometer assembly was convenient for mounting on moving stages or linear guide rails.
3. Analysis of Alignment Tolerance on the Double-Diffracted Grating Interferometer
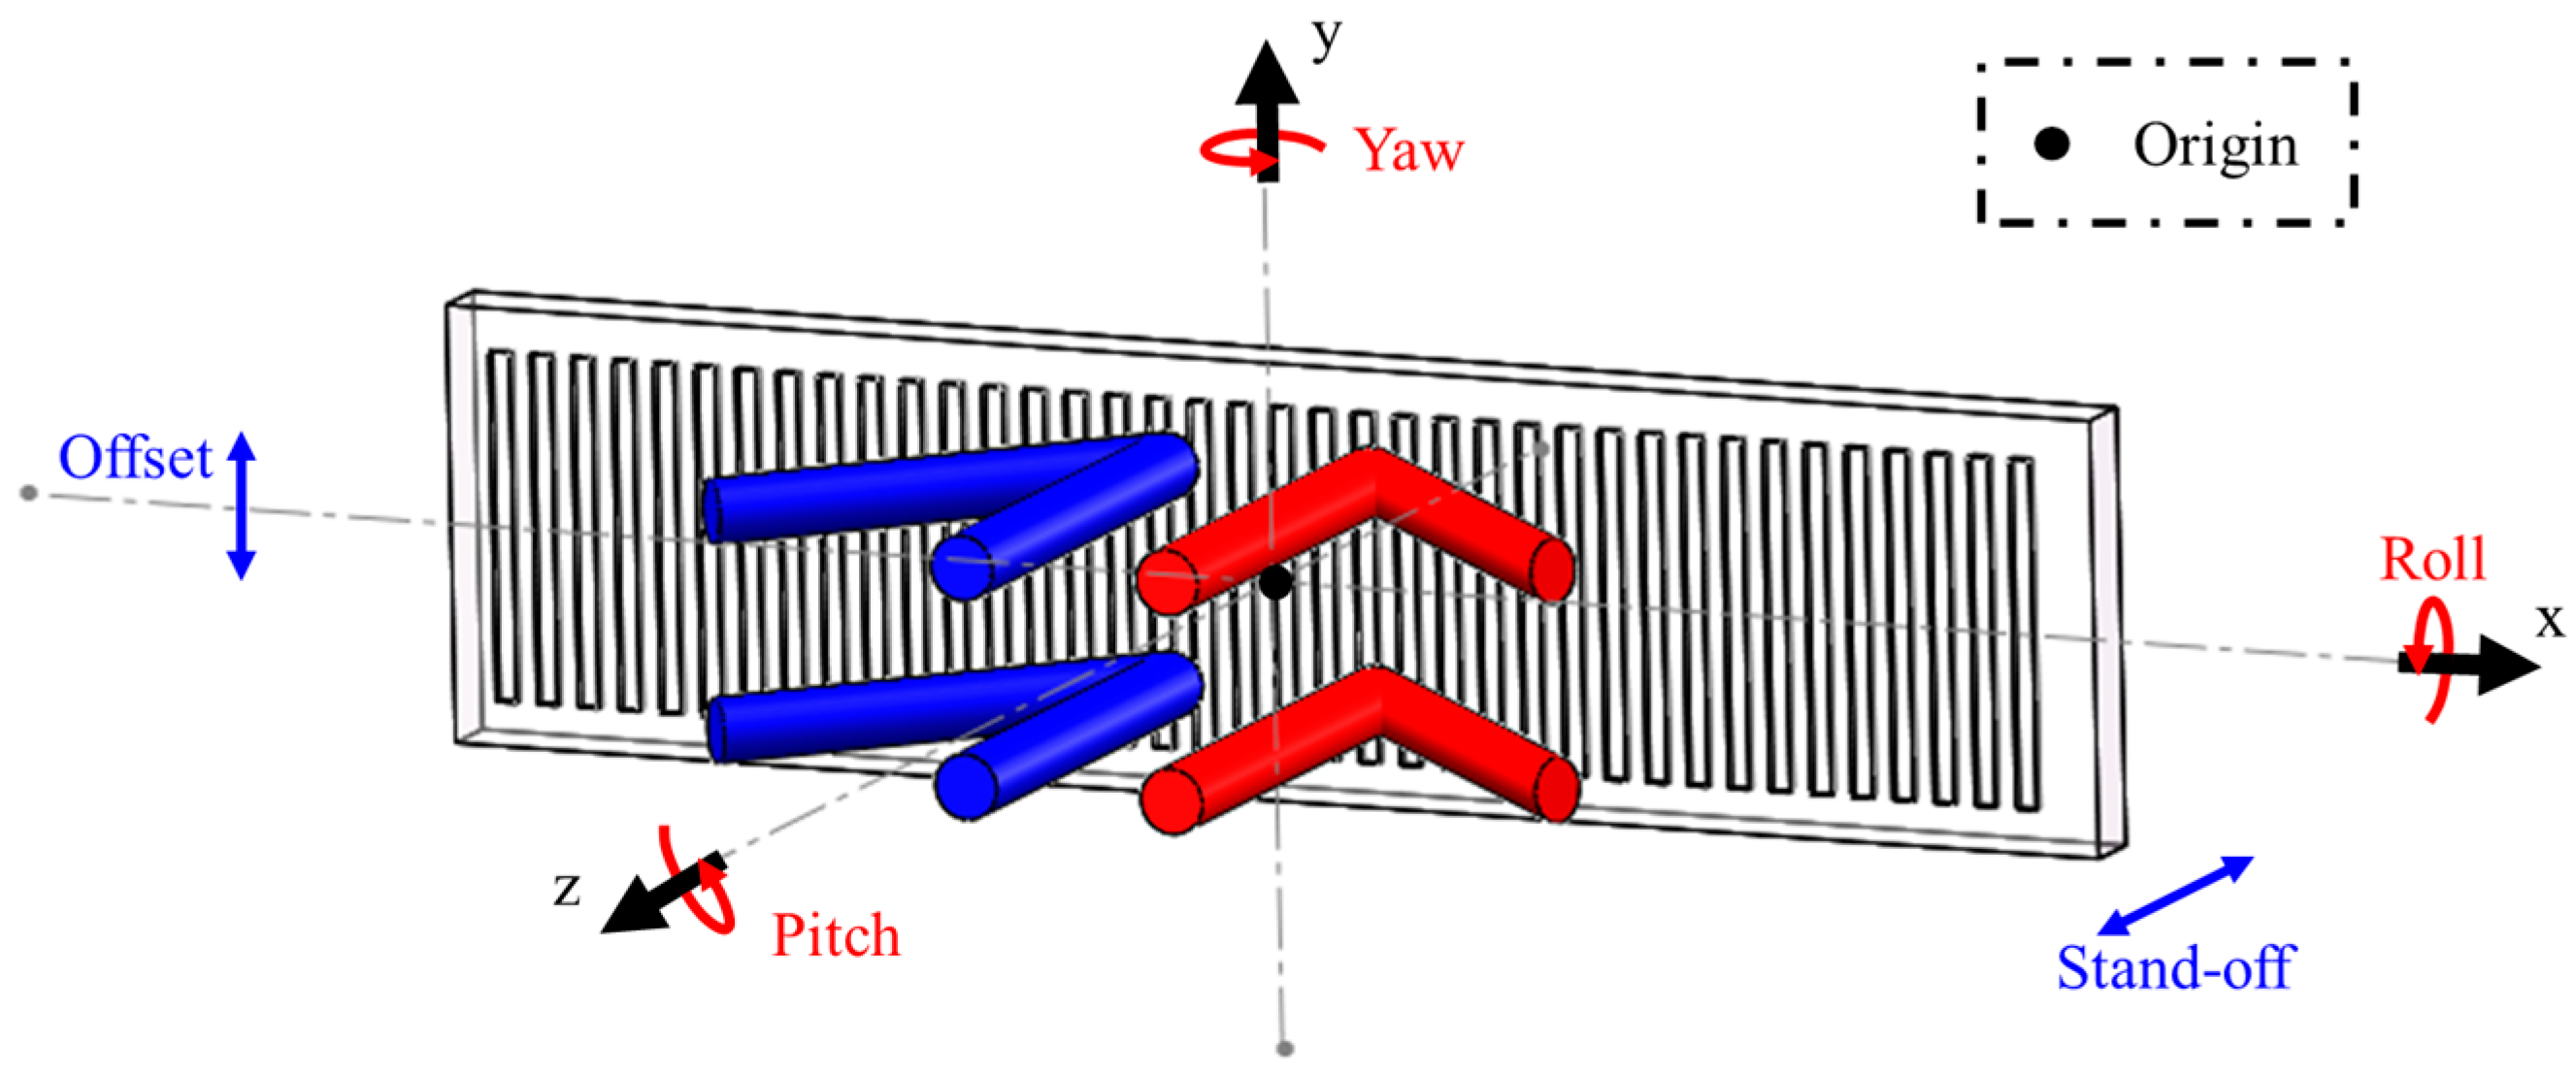
When a relative movement occurred between the fixed grating and moving interferometer, rotation angles of the interferometer would not be constant, but would fluctuate in a small range. The angles, distinguished by roll, yaw and pitch from the axes they rotate about, are illustrated in Figure 2. Besides, the slight translation in y and z directions, are defined as offset and stand-off errors respectively [14].
Also indicated by Figure 2, it is easy to visualize that the offset error is uninfluential as long as the spots remain in the ruling area. Actually, in a linear or planar grating interferometer, the translational movements along x and y directions do not cause errors. However, errors in the other four DOFs will worsen the interference signal as their values increase.
3.1. Analysis of the Stand-off Error
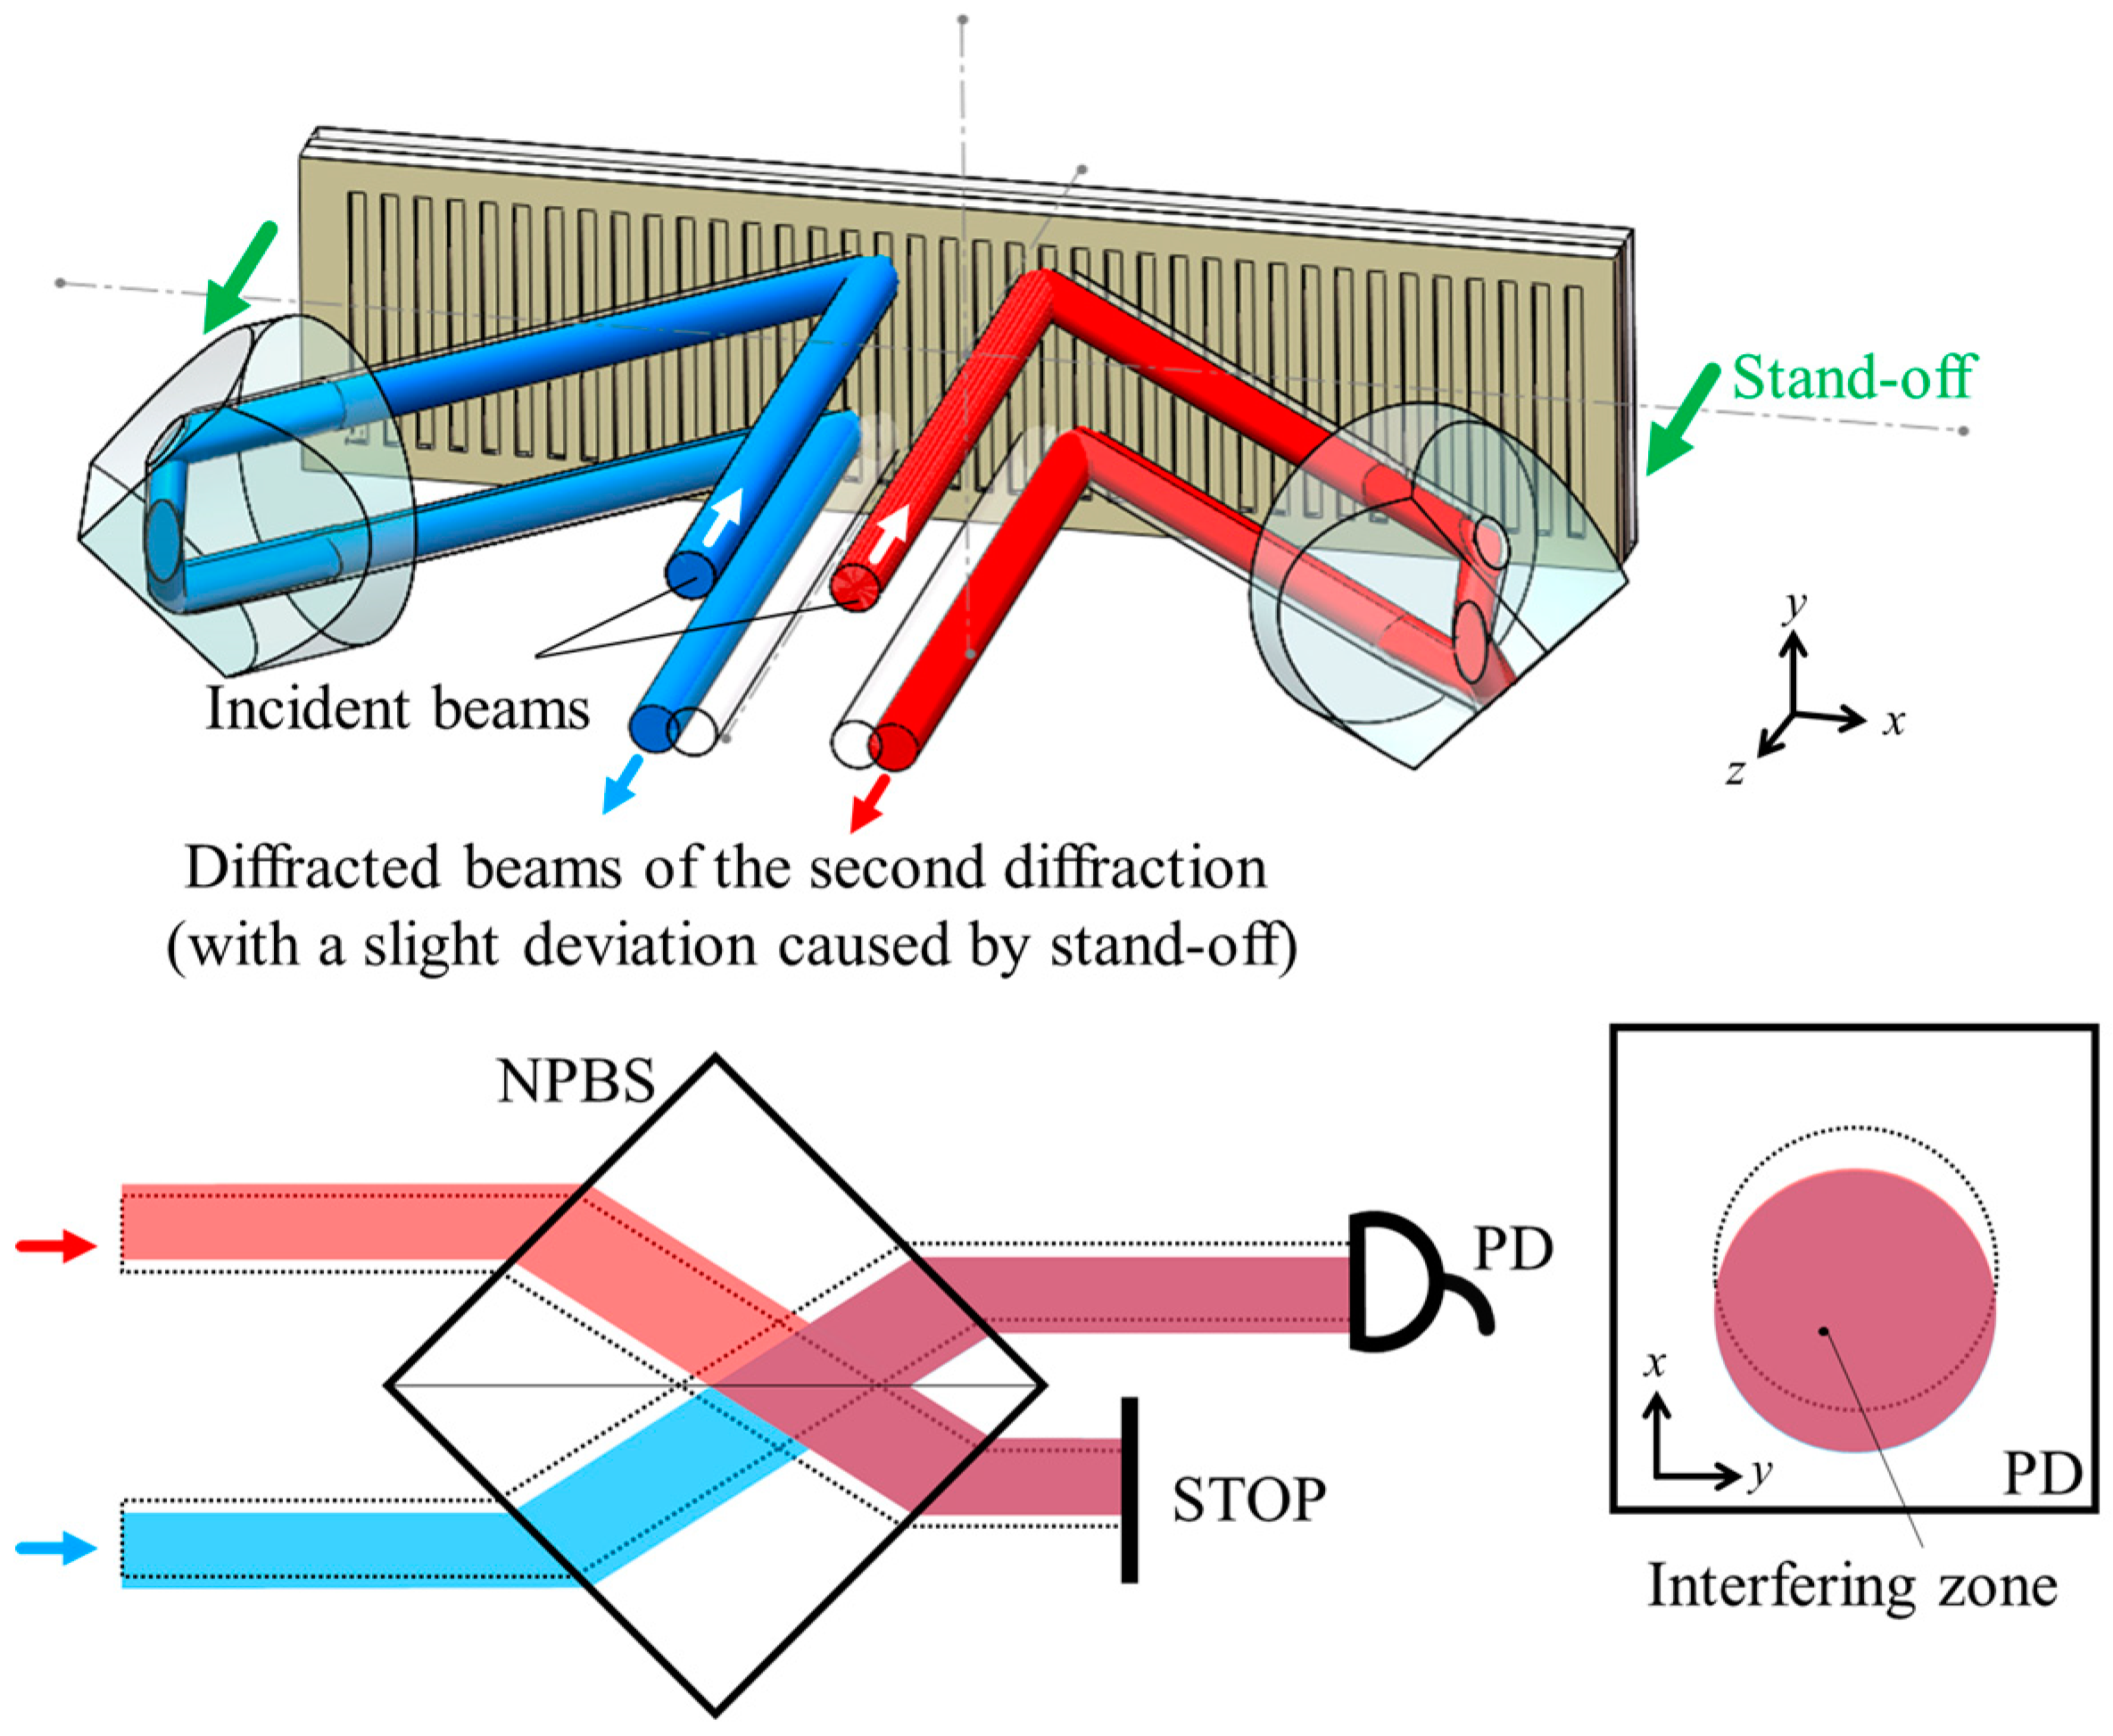
As Figure 3 shows, the stand-off error changes the distances between the grating and the reading-head while keeping the incident beams vertical. The diffracted beams of the first diffraction influenced by stand-off (shown in red or blue) and the original position of the diffracted beams (shown in transparent white) are parallel but with a deviation. The diffracted beams entered the retro-reflectors respectively, creating spot offsets in the surfaces of the RRs. Considering the center symmetry feature of corner-cube retro-reflectors [15], the output beams, as the oblique incident beams of the second diffraction, follow the offset and propagate in the opposite directions. Finally, the second diffraction beams vertically transmit away from the grating with symmetrical deviation. Qualitatively, the bigger stand-off error is, the larger the deviation that occurs. After the second diffraction, in a beam-combined prism implemented by a NPBS in the 45° position, the beams with symmetrical deviation can still entirely overlap (but with a deviation). Only when the actual interfering zone exceeds the boundary of the PD, can the stand-off error have no effect on the interference signal.
3.2. Analysis of the Roll, Yaw, and Pitch Angles
Compared to the translational errors discussed above, these three rotational errors are more complex with greater impact. Different from translational movement, rotation involves a rotating center. However, in the configuration of a spatially separated grating interferometer, more than one beam exists. Thus, a rotation center at the origin shown in Figure 2 is selected for the following analysis.
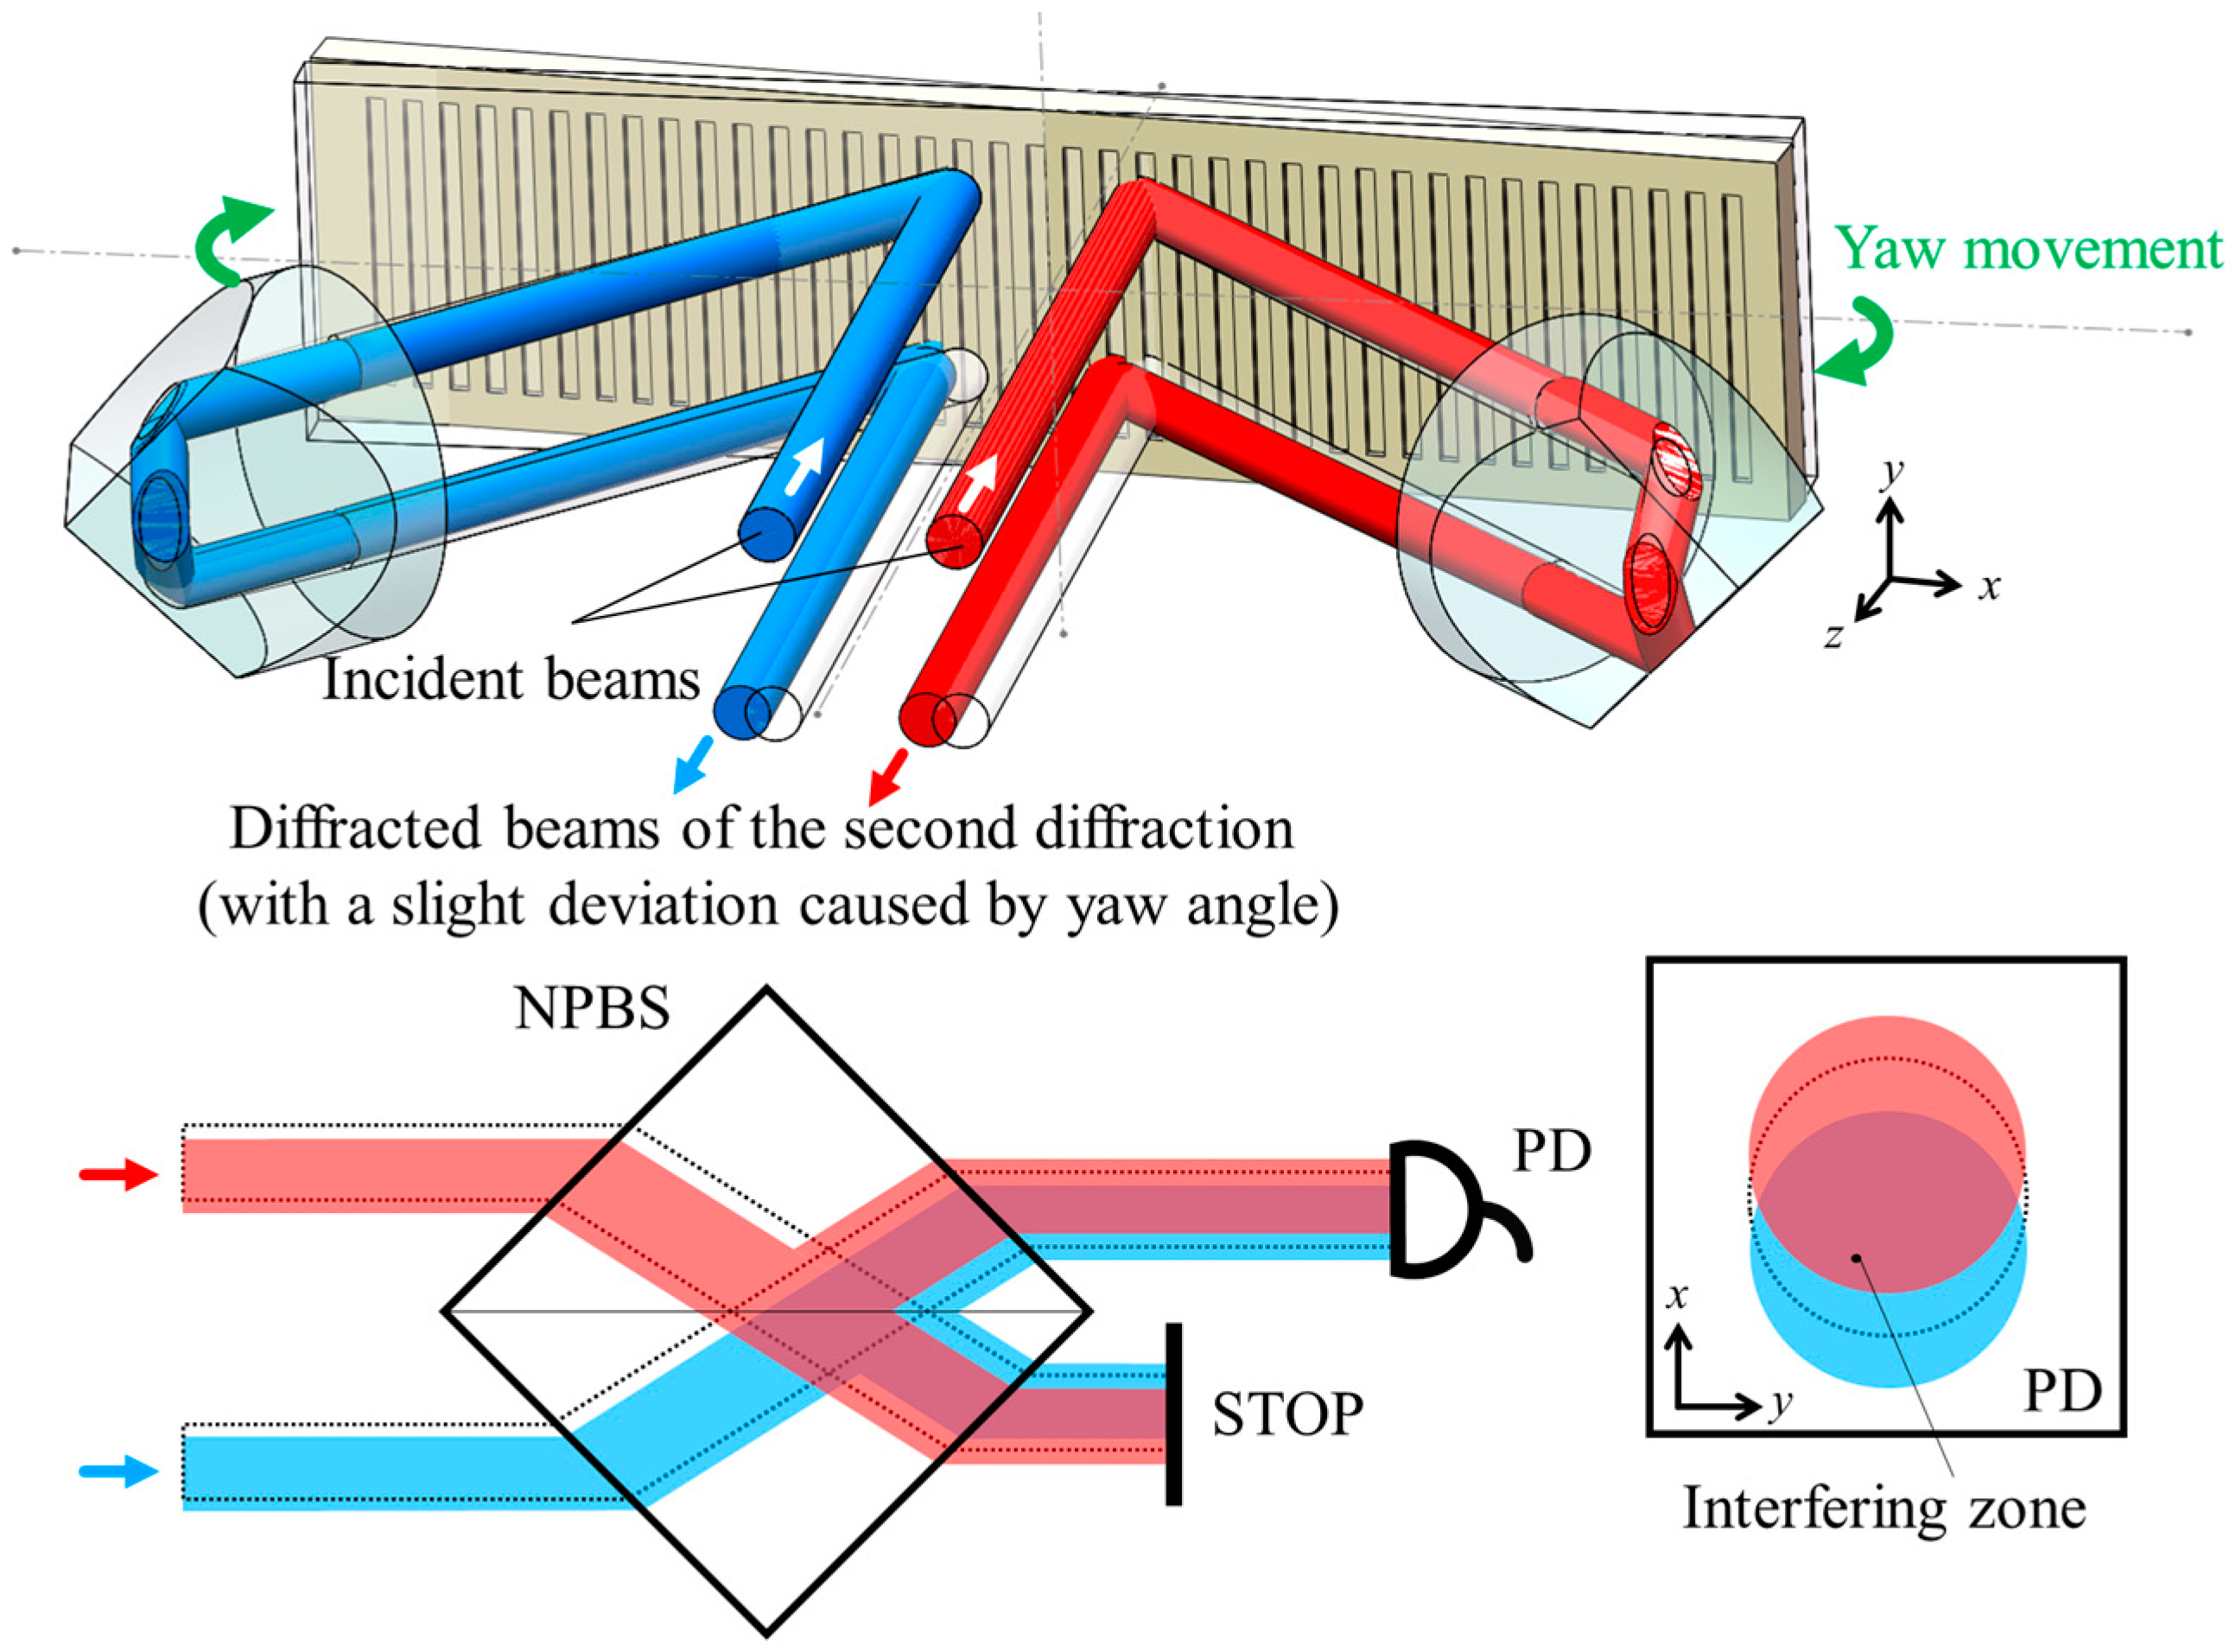
As Figure 4 shows, when a small yaw movement occurs, the incident angle will no longer be normal. Although the difference is slight, according to the grating equation, the absolute value of diffraction angles between +1st and −1st order diffracted beams are unequal. Similarly, the diffracted beams entered the retro-reflectors along their new angles respectively, creating offsets of spots on the surfaces of the RRs. After the second diffraction, deviations appear at the vertically transmitted beams. Through a beam-combined BS, the output measurement beams has a certain work-off. Although the deviations of the beams are in the same direction, the spots on the surface of PD move away from each other, resulting in a decreasing interference zone.
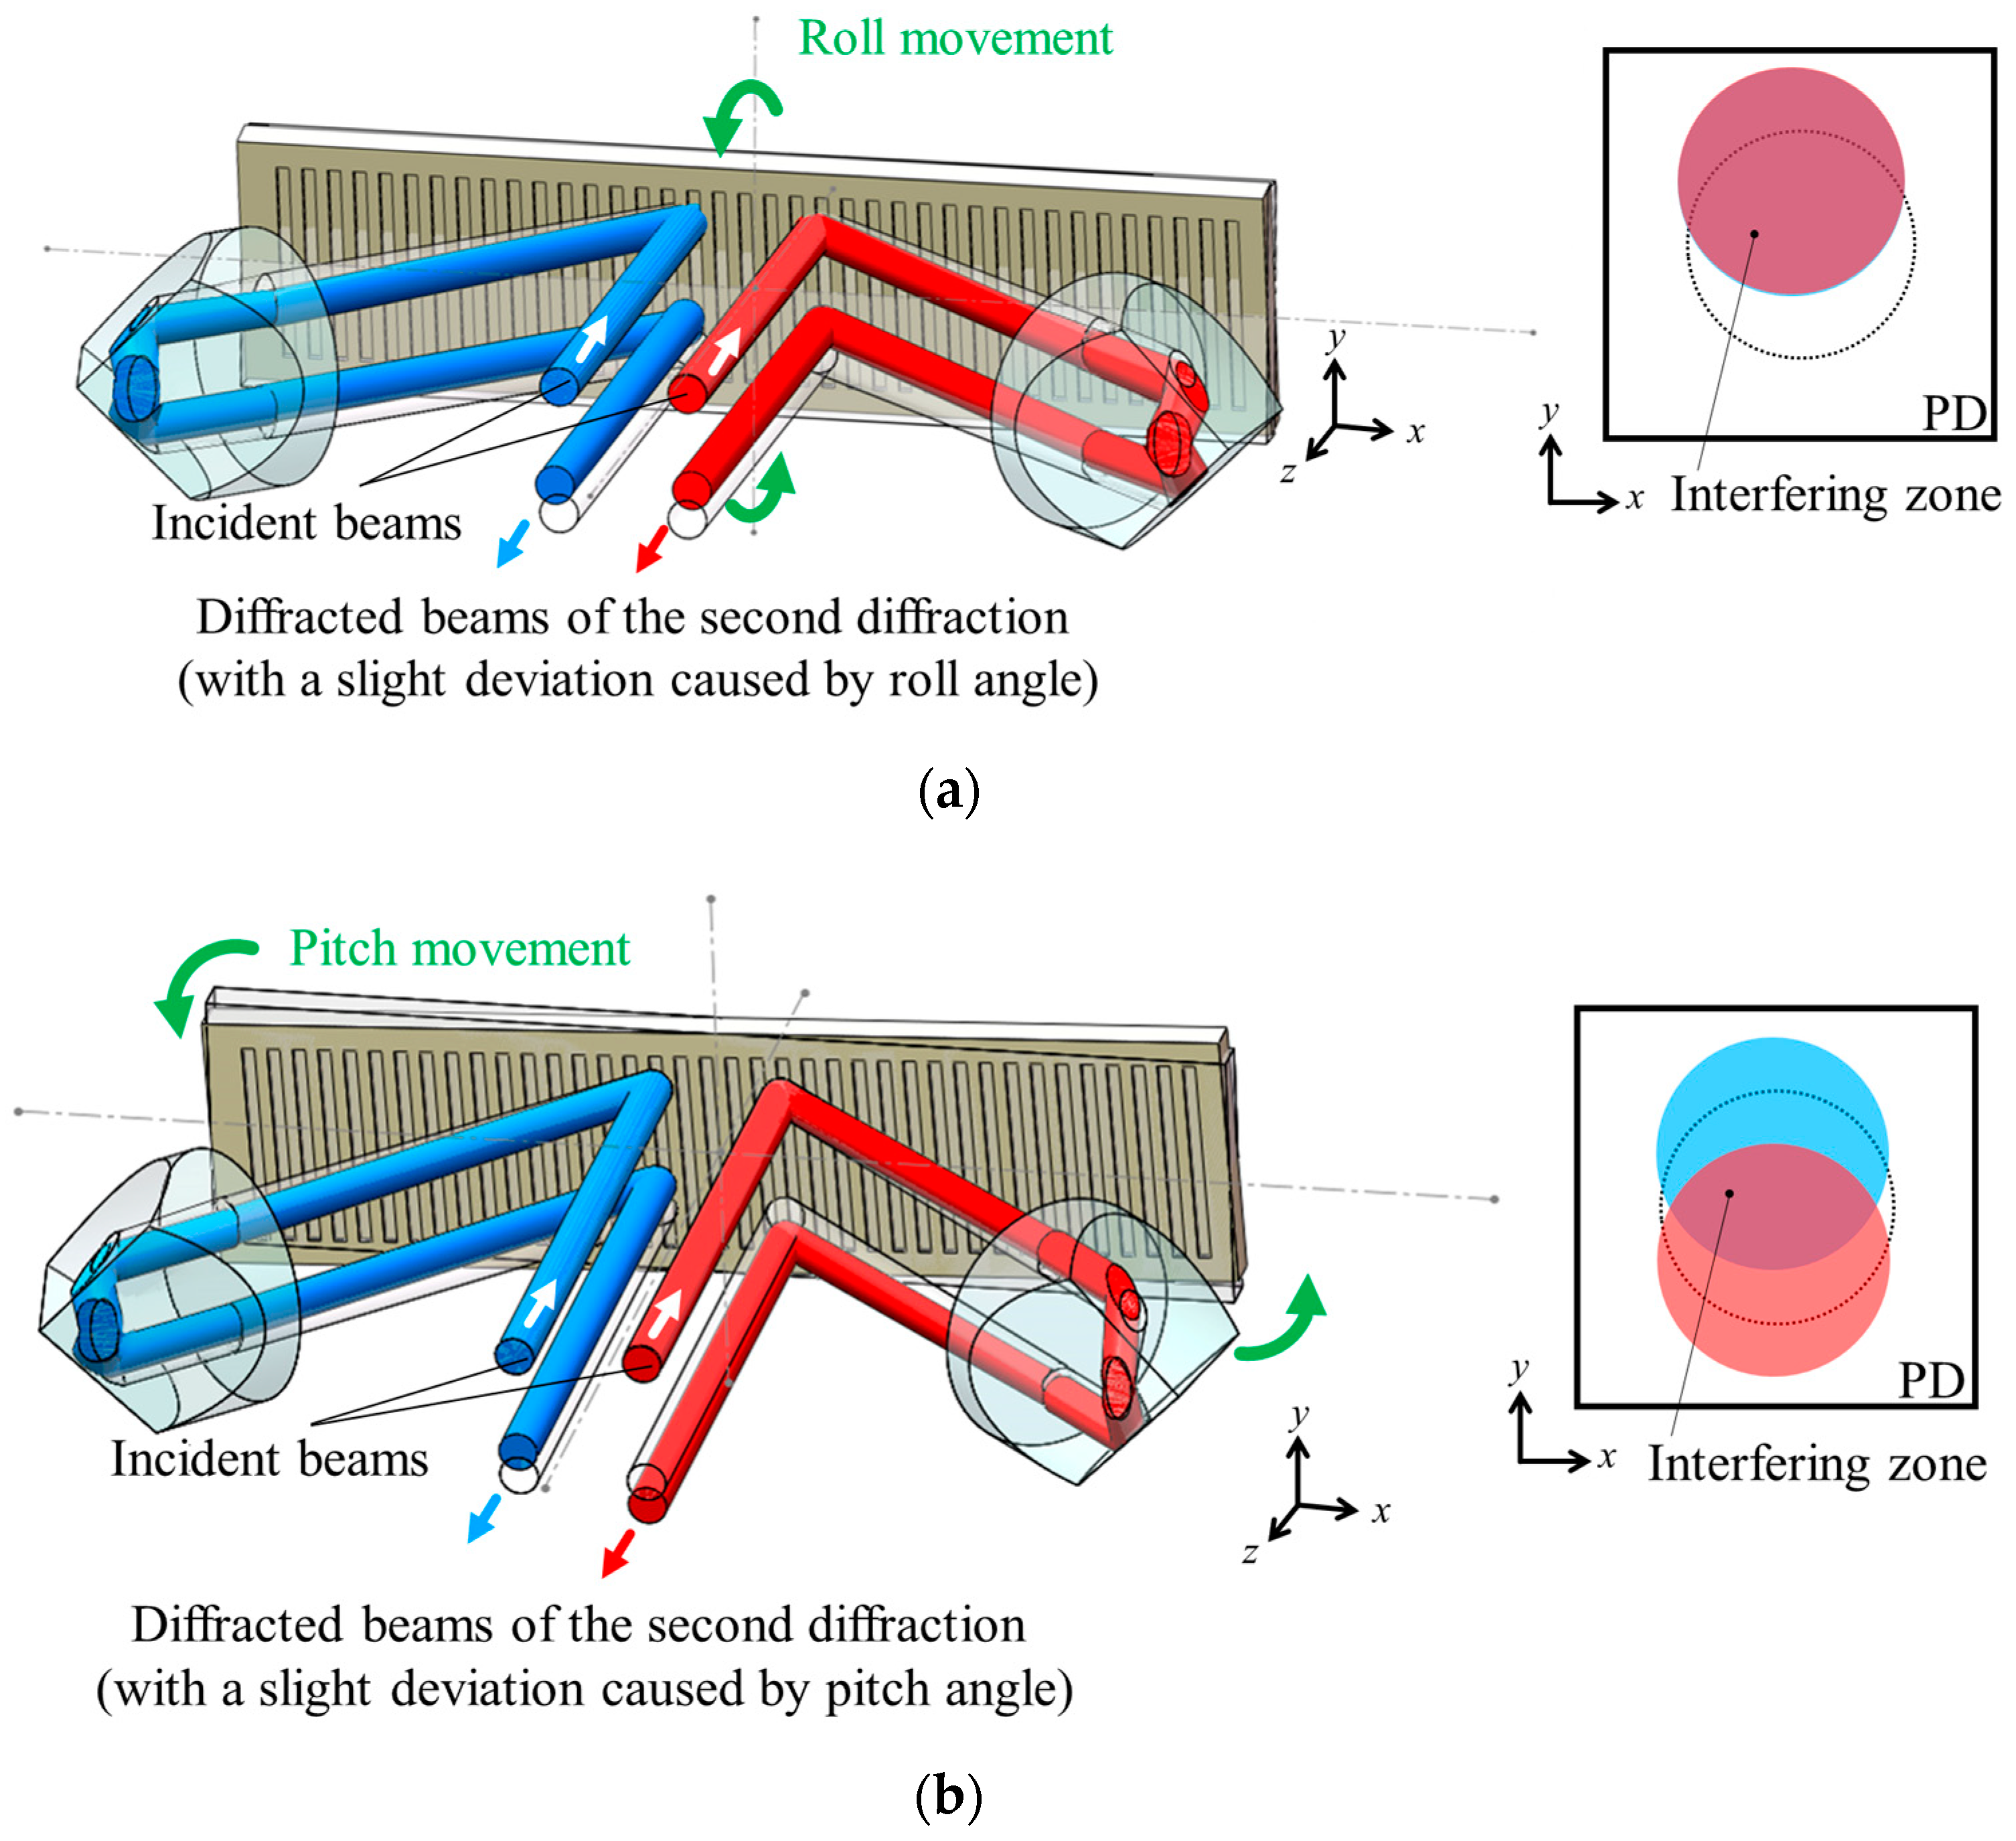
Similarly, the geometrical analyses and influences of roll and pitch angles are displayed in Figure 5. In these circumstances, the diffraction angle remains while the propagating directions are no longer parallel to the x-O-z plane of the coordinate. Caused by roll motion, the beams deviate in a similar direction in Figure 5a. However, the pitch motion leads to opposite deviations of the two beams in Figure 5b, resulting in a work-off of these two spots.
4. Simulations and Experiments
4.1. Simulations
To quantitatively describe the alignment tolerance, simulation codes for beam tracing were programmed with MATLAB. In the mathematical model, the O-x-y-z coordinate, optical interfaces, and vectors of incident beams were defined. The range of grating and apertures of the RRs are supposed to be infinite in the model, so that the influence and errors caused by out of clear apertures are not discussed.
In Figure 6, four crucial structural parameters of the spatially separated heterodyne grating interferometer are marked. Specifically, A is the separating distance of the incident beams, B represents the lengths of diffracted beams from planar grating to the surfaces of RRs, C is the offset between the input and the returned output beams of RRs, and D is the beam diameter. Since the divergence of beams for interferometers are generally small (within a couple of mrad/hundreds of arcsec), only the Gaussian distribution of the intensity is considered while the divergence is ignored, which implies that the Gaussian beam seems to be a column in the simulation. The diameter D is assumed as the beam waist of the Gaussian beam. Therefore, the optical structure showing in Figure 1 could be digitized as A = 7 mm, B = 30 mm, C = 7 mm, and D = 3 mm. The influence of the stand-off error and three misalignment angles to such a structure are simulated; these results are demonstrated in Figure 7.
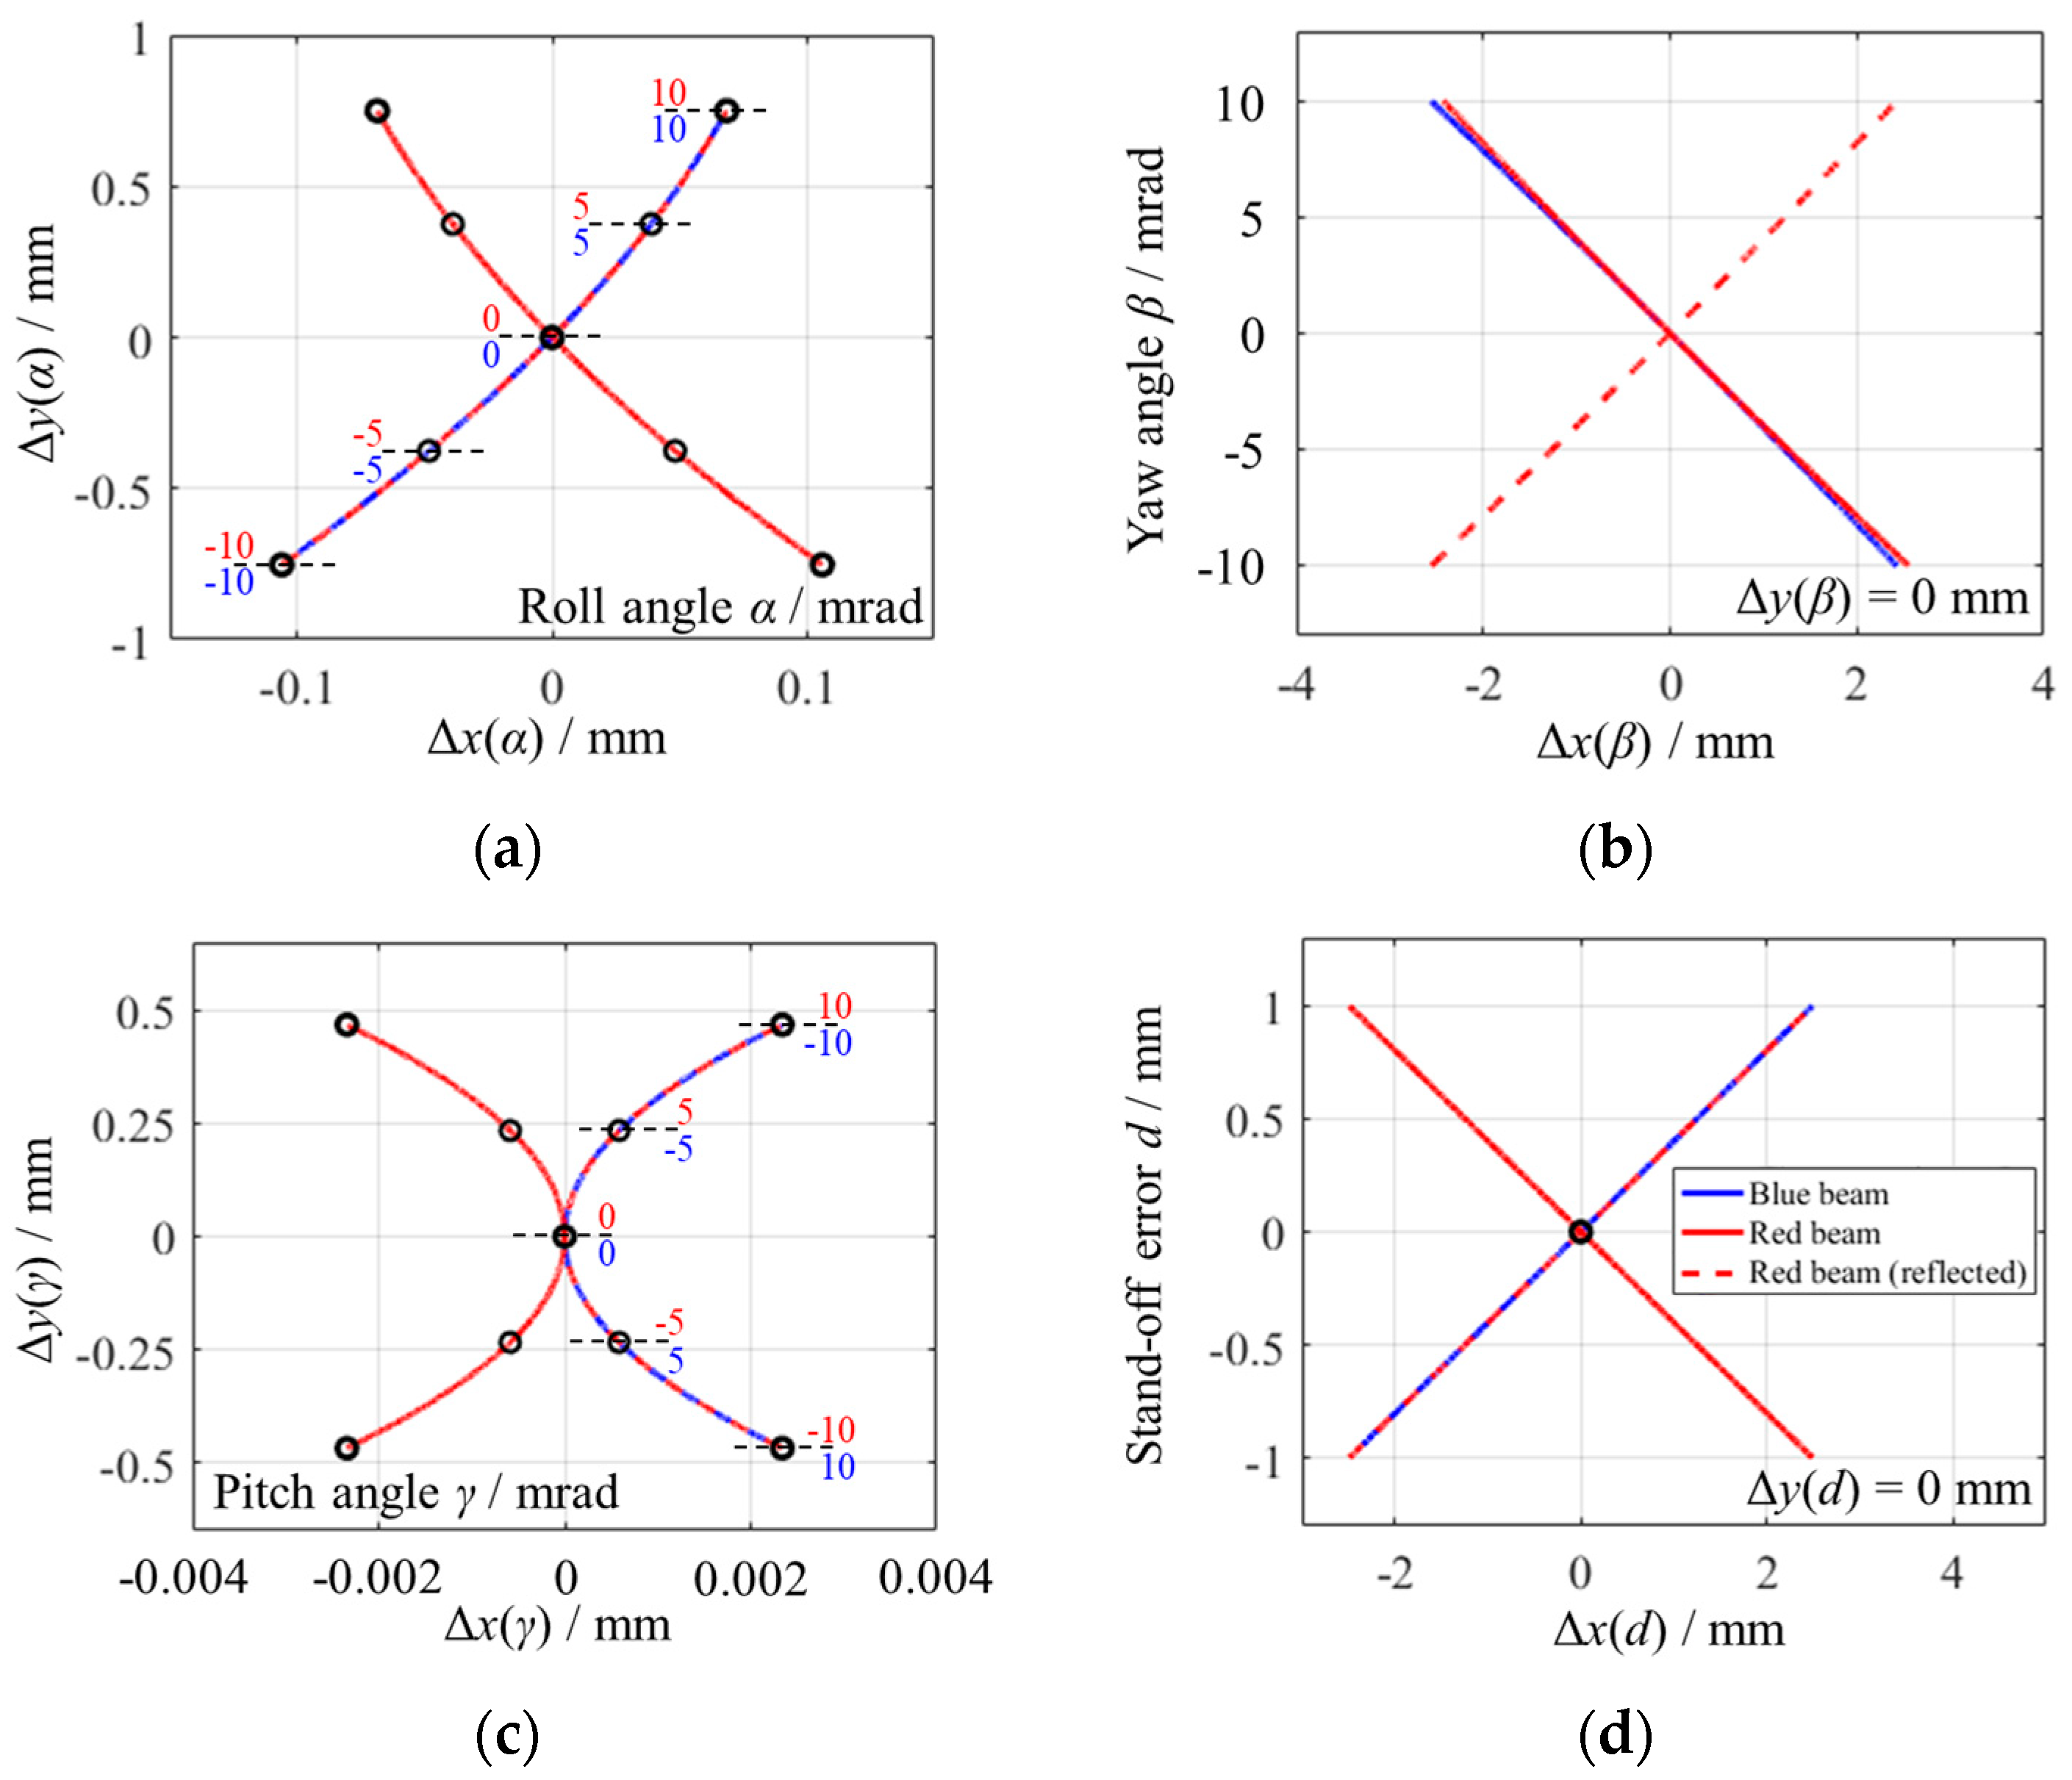
Figure 7 shows that the deviations between the actual and the ideal centers of the spots were continuously enlarged as the errors increased. The blue lines represent the positions of the blue spot in Figure 6. Similarly, the red solid lines depict the deviations of the red diffracted beam in Figure 6, and the red dashed lines describe the spot positions after reflection by the beam-combined BS. Because the roll and pitch angles created the planar movements of the beam centers, their curves in the x-O-y plane with contour lines of the angles are portrayed in Figure 7a,c. Blue numbers and red numbers represent the angles of the blue lines and dashed red lines, respectively. However, only one-dimensional movements of the beams in the x-direction were caused by the yaw angle and the stand-off error; Figure 7b,d depicts the relationship in curves with an explanation Δy = 0 mm. It is worth mentioning that the simulation results agree with the qualitative analysis in Chapter 3. Besides, the beam-combined BS placed at an angle of 45° could reduce the separation caused by the stand-off error and roll angle, but also deteriorate the influence of yaw and pitch angles. The work-off distances of the reflected red beams and the blue beams can be extracted from the distances at the same angles or errors between the corresponding lines.
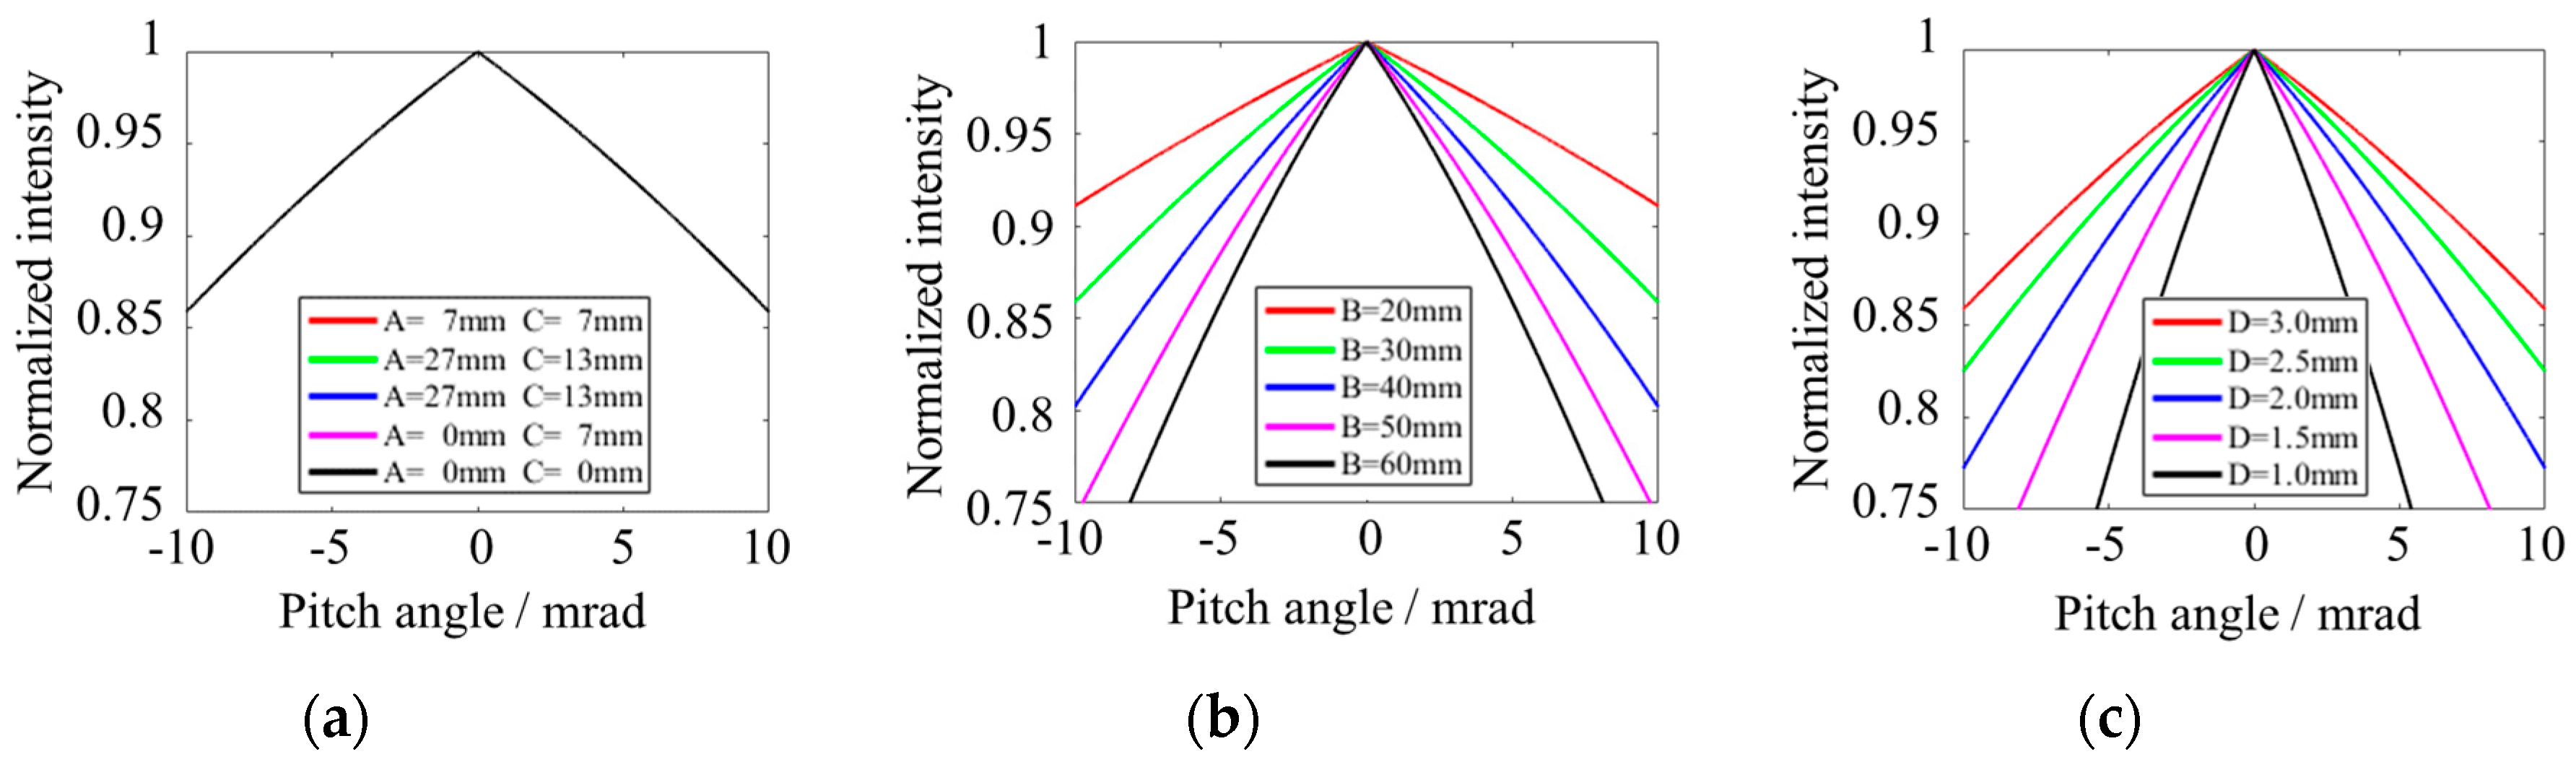
In another simulation, the relationships of four specific structural parameters from A to D and their influence to interfering beams were investigated. Taking the pitch movement as an example, the simulation above has proved that the deviation of the two spots will decrease the overlapped region of the two Gaussian beams, and the larger the work-off distance L is, the lower the interfering intensity will be. Supposing that the Gaussian beams follow the same equation and only the parts inside the beam waists are calculated, the ratio of the overlapped region and the maximum volume (within the beam waist) is used to appraise the influence.
In Figure 8a, all these curves overlapped together, which means the rotational arm, equaling to L = (A2 + C2)1/2/2, has no relation to the interfering beams. The common optical path heterodyne grating interferometer is reckoned as a special case of spatially separated configuration with the parameter A = 0. Thus, conclusions in this paper are also suitable for the common optical path configuration. According to Figure 8b, the parameter B, representing the length of diffracted beams, caused more changes of the interfering beams. It could also be attributed to a longer distance which generated a larger offset at a certain rotational angle. Figure 8c clearly illustrates that a bigger beam suffers larger spot deviations.
In summary, the simulation results demonstrate the influence of rotational angles and stand-off error on the deviation of measurement beams from the quantitative point of view. It also shows that the intensity of the interference signal is independent of the space between beams (parameters A and C) and is affected by the length of the diffracted beams and the spot diameter (parameters B and D).
4.2. Experiments
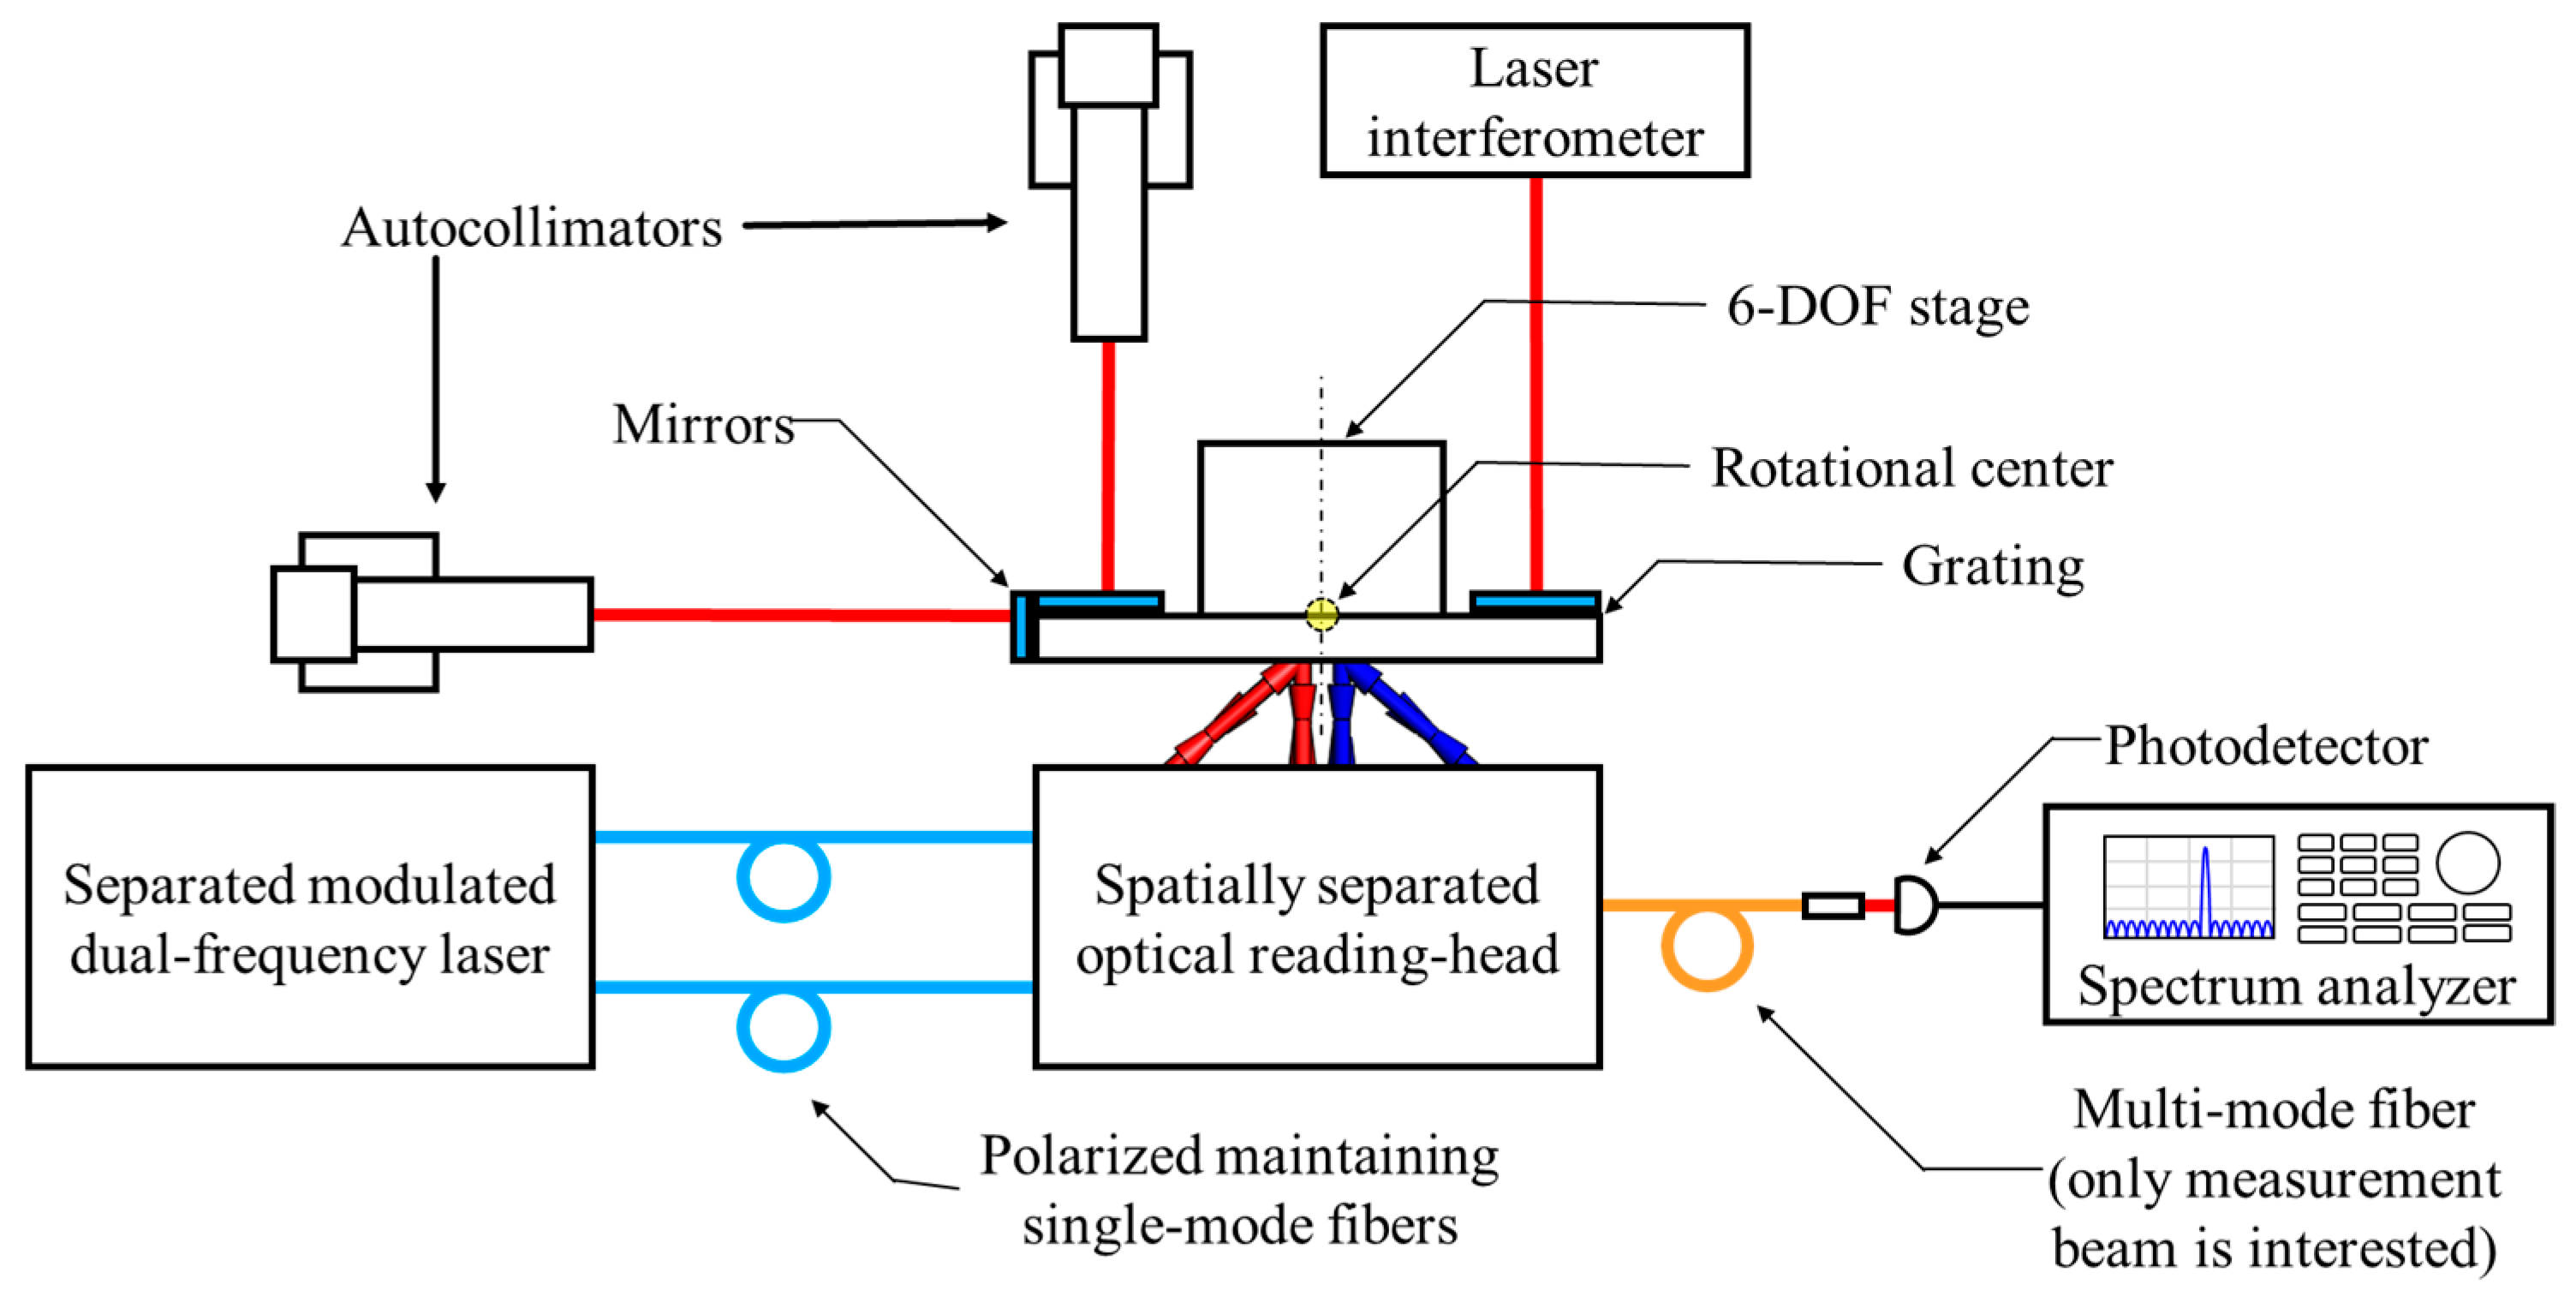
The experimental setup for testing the performance of alignment tolerance is shown in Figure 9.
A fiber-delivered separated modulated laser was implemented by a single-frequency laser source with 780 nm wavelength (Sacher Lasertechnik Group TEC 500) and two acousto-optic modulators (AA Opto Electronic MT80). After transferring to the optical reading head, these beams diffracted at a custom-tailored 1 μm grating. The grating, assembling to a 6-DOF stage, could be adjusted to generate different types of errors. Autocollimators (Moeller-Wedel ELCOMAT 3000) were equipped to monitor the rotation angles, while the translational stand-off displacements were displayed by a homemade laser interferometer. Besides, it is worth emphasizing that the rotational center was located near the center of these beams. Finally, the measurement beam was delivered to the photodetector (FEMTO Messtechnik GmbH HCA-S-200M-SI) and spectrally analyzed with a spectrum analyzer (ADVANTEST R3131A). Since the experiment only focused on the measurement beam, the reference beam was not detected. The aperture of the photodiode was larger than the beam so that only the work-off of the beams were considered. As mentioned above, the parallelism of beams was adjusted by the kinematic mounts to exclude the assembling error.
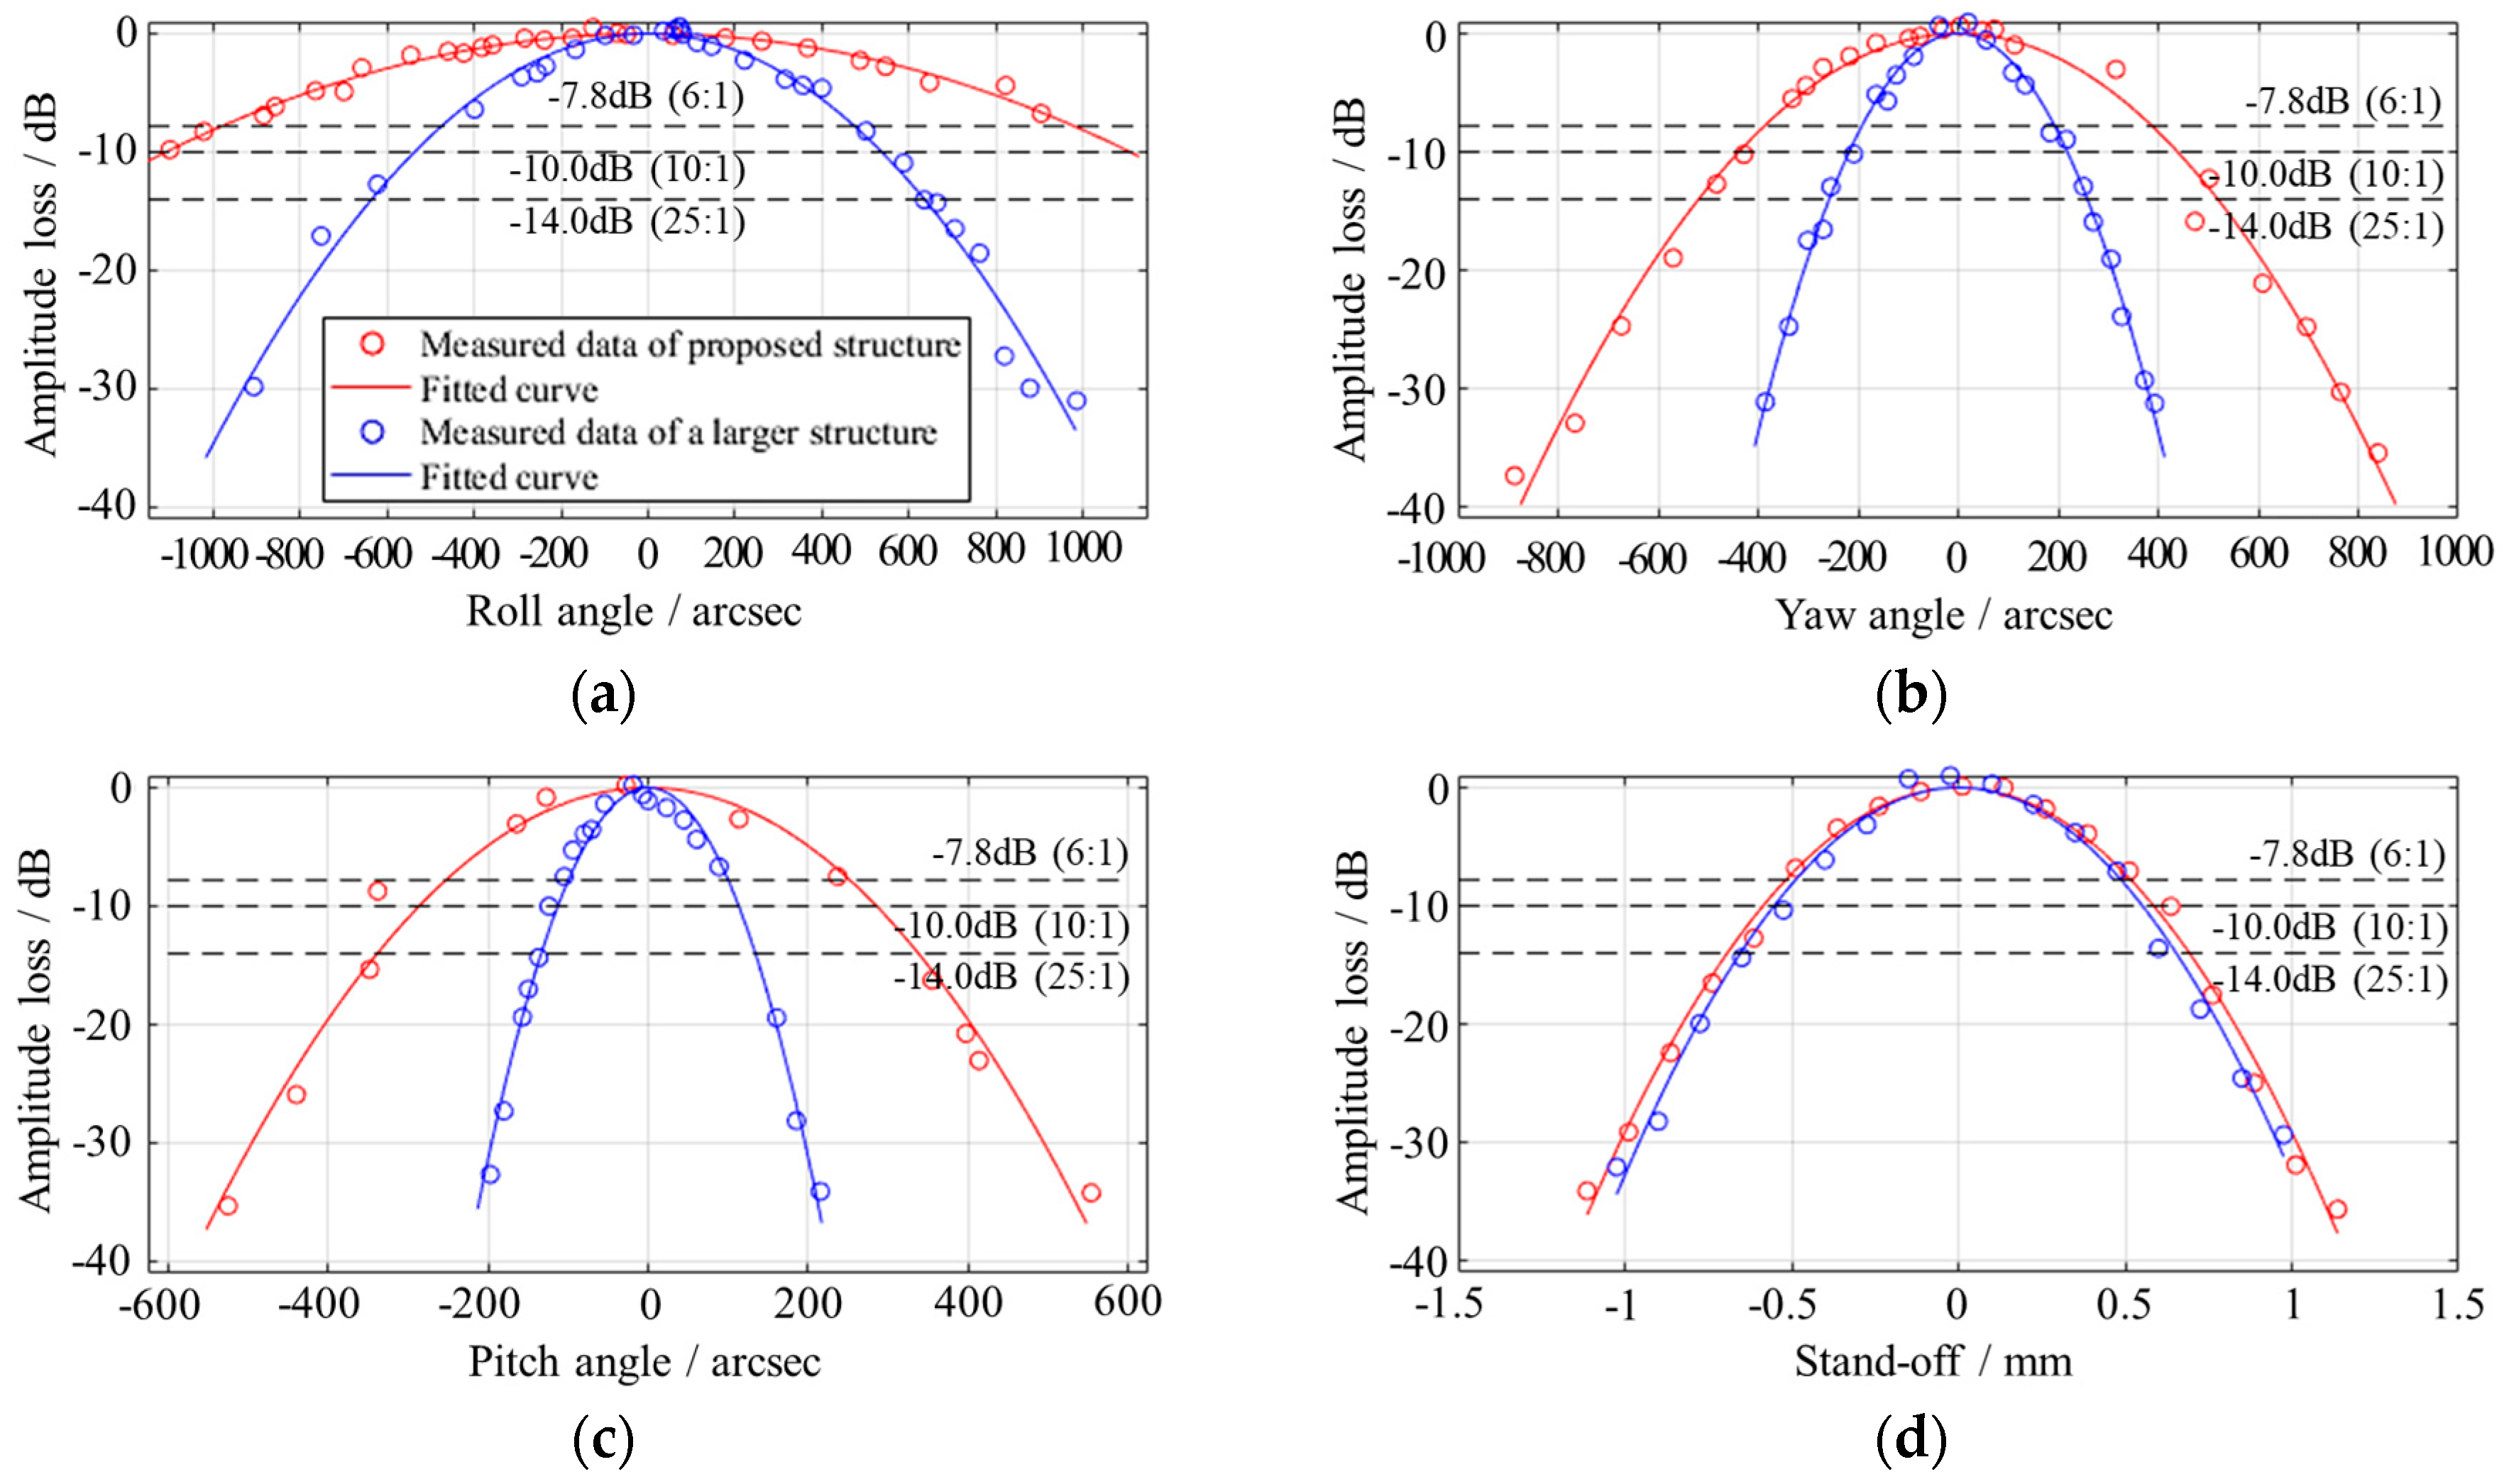
A comparison of the proposed reading-head structure and a larger structure built with independent optical components were deployed in the experiments and are depicted in Figure 10. The plots from the former are colored red and those from the latter are blue. Since it is not clear enough to compare two sets of plots, curves were fitted to describe their trends. The type of the fitted curves was selected as the sum of two Gaussian functions, which also fits the curves in the simulation shown in Figure 8 well.
Considering the fluctuation of spectrum peaks and the amplitude differences of the assembled and independently built structures, Figure 10 selects the apex of the fitted curve as the origin and uses the amplitude loss as the standard for measuring the misalignment tolerance. Both in the simulations and experiments, the pitch angle leads to the most severe work-off distances and amplitude loss; the yaw angle causes a less severe deterioration, and the roll angle has the slightest effect, which proves that the work-off distance is one of the major factors of the amplitude loss. Compared with the red curve and the blue one in Figure 10a–c, it is proved that the shorter the diffracted beams are, the stronger the tolerances to rotational angles are, which is also consistent with the simulation in Figure 8. It provides an available approach to improve the alignment tolerance, that is, reducing the size of the reading-head and the length of the diffracted beams. However, keeping large enough clear apertures while reducing the size and the beam lengths requires elaborate designs on the optical configurations. Besides, the stand-off error remains as Figure 10d depicts. As for the specific criteria of alignment tolerance, it is determined by the dynamic range of the photodetector, the ratio of the largest and smallest amplitudes can be acquired. Taking the Keysight receivers as instances, the dynamic ranges range from 6:1 to 25:1, depending on the AC/DC ratio [16]. Choosing a common ratio of 10:1 as a judgment, the designed structure stays accurate with the ±1100 arcsec roll movement, ±440 arcsec yaw movement, ±280 arcsec pitch movement, and ±0.6 mm stand-off error when −10 dB intensity loss is afforded.
5. Conclusions
This paper analyzed the alignment tolerance of double-diffracted spatially separated heterodyne grating interferometer with a mechanical fixture of our design. The double-diffraction structure by corner-cube retro-reflectors doubles the optical fold factor and also converts the angular mismatch into a position mismatch, which improves the alignment tolerance. We analyzed the alignment tolerance from three aspects: quantitative research, qualitative simulation and experiments. The results depicted that the designed structure stays accurate with the ±1100 arcsec roll movement, ±440 arcsec yaw movement, ±280 arcsec pitch movement and ±0.6 mm stand-off error when -10 dB intensity loss is afforded. Besides, the output results for different given crucial structural parameters shows that to achieve higher alignment tolerance, shorter diffracted beam length and wider laser beams are required. Since the separating distance does not affect the interfering intensity, the conclusions are also suitable for a common optical path configuration.
Author Contributions
D.C. established the simulation model, designed the experiments, and prepared the original draft. X.X. designed the structure and took part in the formal analysis. P.H. contributed to the conceptualization, project administration, and resources. J.W. took part in the experiments, data curation, and visualization. J.T. contributed to the supervision and funding acquisition.
Funding
The authors acknowledge gratefully the support of the National Natural Science Foundation of China (Project codes: 51605120, 51675138 and 61675058) and the National Science and Technology Major Project (Project code: 2017ZX02101006-005).
Acknowledgments
The authors cordially thank our co-workers Hongxing Yang, Haijin Fu, and Ruitao Yang for their helpful assistance and valuable suggestions.
Conflicts of Interest
The authors declare no conflict of interest.
References
- Carballo, J.A.; Chan, W.T.J.; Gargini, P.A.; Kahng, A.B.; Nath, S. ITRS 2.0: Toward a re-framing of the semiconductor technology roadmap. In Proceedings of the 2014 IEEE 32nd International Conference on Computer Design, Seoul, South Korea, 19–22 October 2014; pp. 139–146. [Google Scholar]
- Gao, W.; Kim, S.W.; Bosse, H.; Haitjema, H.; Chen, Y.L.; Lu, X.D.; Knapp, W.; Weckenmann, A.; Estler, W.T.; Kunzmann, H. Measurement technologies for precision positioning. CIRP Ann. 2015, 64, 773–796. [Google Scholar] [CrossRef]
- Deng, J.; Yan, X.; Wei, C.; Lu, Y.; Li, M.; Xiang, X.; Jia, W.; Zhou, C. Eightfold optical encoder with high-density grating. Appl. Opt. 2018, 57, 2366–2375. [Google Scholar] [CrossRef] [PubMed]
- Huang, H.-L.; Liu, C.-H.; Jywe, W.-Y.; Wang, M.-S.; Fang, T.-H. Development of a three-degree-of-freedom laser linear encoder for error measurement of a high precision stage. Rev. Sci. Instrum. 2007, 78, 066103. [Google Scholar] [CrossRef] [PubMed]
- Lee, C.B.; Kim, G.H.; Lee, S.K. Design and construction of a single unit multi-function optical encoder for a six-degree-of-freedom motion error measurement in an ultraprecision linear stage. Meas. Sci. Technol. 2011, 22, 105901. [Google Scholar] [CrossRef]
- Li, X.; Gao, W.; Muto, H.; Shimizu, Y.; Ito, S.; Dian, S. A six-degree-of-freedom surface encoder for precision positioning of a planar motion stage. Precis. Eng. 2013, 37, 771–781. [Google Scholar] [CrossRef]
- Li, X.; Shimizu, Y.; Ito, T.; Cai, Y.; Ito, S.; Gao, W. Measurement of six-degree-of-freedom planar motions by using a multiprobe surface encoder. Opt. Eng. 2014, 53, 122405. [Google Scholar] [CrossRef]
- Kao, C.-F.; Chang, C.C.; Lu, M.-H. Double-diffraction planar encoder by conjugate optics. Opt. Eng. 2005, 44, 023603. [Google Scholar]
- Feng, C.; Zeng, L.; Wang, S. Heterodyne planar grating encoder with high alignment tolerance, especially insensitivity to grating tilts. In Eighth International Symposium on Precision Engineering Measurement and Instrumentation, Proceedings of the SPIE, 8–11 August 2012, Chengdu, China; SPIE Press: Bellingham, WA, USA, 2013; p. 87593L. [Google Scholar]
- De Groot, P.J.; Badami, V.G.; Liesener, J. Concepts and geometries for the next generation of precision heterodyne optical encoders. In Proceedings of the Annual Meeting of the American Society for Precision Engineering (ASPE 2016), Portland, OR, USA, 23–28 October 2016; pp. 146–149. [Google Scholar]
- Tan, J.; Hu, P.; Xing, X. Two-Degree-of-Freedom Anti-Optical Frequency Heterodyne Grating Interferometry and Measuring System. Chinese Patent CN 103,604,375A, 26 February 2014. (In Chinese). [Google Scholar]
- Xing, X.; Chang, D.; Hu, P.; Tan, J. Spatial separated heterodyne grating interferometer for eliminating periodic nonlinear errors. Opt. Express 2017, 25, 31384. [Google Scholar] [CrossRef] [PubMed]
- Guan, J.; Köchert, P.; Weichert, C.; Köning, R.; Siaudinyte, L.; Flügge, J. A differential interferometric heterodyne encoder with 30 picometer periodic nonlinearity and sub-nanometer stability. Precis. Eng. 2017, 50, 114–118. [Google Scholar] [CrossRef]
- Cheng, F.; Fan, K. Linear diffraction grating interferometer with high alignment tolerance and high accuracy. Appl. Opt. 2011, 50, 4550. [Google Scholar] [CrossRef] [PubMed]
- Liu, J.; Azzam, R.M.A. Polarization properties of corner-cube retroreflectors: Theory and experiment. Appl. Opt. 1997, 36, 1553. [Google Scholar] [CrossRef] [PubMed]
- Keysight Technologies. High Performance Laser Interferometer Positioning for VMEbus Systems—Technical Overview. Available online: https://literature.cdn.keysight.com/litweb/pdf/5965-1569E.pdf (accessed on 22 October 2018).
Figure 1.
Optical configuration and mechanical fixture of the proposed double-diffracted spatially separated heterodyne grating interferometer. FC1 and FC2, optical fiber collimators; BS1 and BS2, non-polarized beam splitters; PBS, polarized beam splitter; M1, M2, and M3, mirrors; RR1 and RR2, retroreflectors; G, linear grating; FCr and FCm, optical fiber couplers; KM1 and KM2, kinematic mounts; MF, mechanical fixture. The colored markers f1 and f2 represent different modulated frequencies.

Figure 2.
Distinguishing the misalignment angles (roll, yaw, and pitch), stand-off and offset.

Figure 3.
Geometrical analysis of the stand-off error and its influence on the measurement beam caused by spots deviation.
Figure 3.
Geometrical analysis of the stand-off error and its influence on the measurement beam caused by spots deviation.

Figure 4.
Geometrical analysis of the yaw movement and its influence on the measurement beam caused by spots deviation. (To be clear, the angles in the figure and their influence are exaggerated. Generally, these angles are no larger than several mrads or hundreds of arcseconds in actuality).
Figure 4.
Geometrical analysis of the yaw movement and its influence on the measurement beam caused by spots deviation. (To be clear, the angles in the figure and their influence are exaggerated. Generally, these angles are no larger than several mrads or hundreds of arcseconds in actuality).

Figure 5.
Geometrical analysis of the roll and pitch movements and their influences on the measurement beam caused by spots deviation. (a) Roll movement; (b) Pitch movement.
Figure 5.
Geometrical analysis of the roll and pitch movements and their influences on the measurement beam caused by spots deviation. (a) Roll movement; (b) Pitch movement.

Figure 6.
Mathematical model and the crucial structural parameters of the spatially separated heterodyne grating interferometer and the interfering intensity of the Gaussian beams.
Figure 6.
Mathematical model and the crucial structural parameters of the spatially separated heterodyne grating interferometer and the interfering intensity of the Gaussian beams.

Figure 7.
The results of beam tracing with the variation of misalignment angles and the stand-off error shown by the curves of the beam centers. (a) Roll angle α. (b) Yaw angle β. (c) Pitch angle γ. (d) Stand-off error d. These curves share the legend shown in figure (d).
Figure 7.
The results of beam tracing with the variation of misalignment angles and the stand-off error shown by the curves of the beam centers. (a) Roll angle α. (b) Yaw angle β. (c) Pitch angle γ. (d) Stand-off error d. These curves share the legend shown in figure (d).

Figure 8.
The relationship between the normalized intensity and pitch angle with different structure parameters. (a) Rotation arms are changed. (b) Lengths of the diffracted beams are changed. (c) Beam diameters are changed.
Figure 8.
The relationship between the normalized intensity and pitch angle with different structure parameters. (a) Rotation arms are changed. (b) Lengths of the diffracted beams are changed. (c) Beam diameters are changed.

Figure 9.
Experimental setup for testing the performance of alignment tolerance.

Figure 10.
Experimental curves showing the relationships between the misalignment errors and amplitude loss of the interfering signal. (a) Roll angle. (b) Yaw angle. (c) Pitch angle. (d) Stand-off error. All four figures share the same legend as the first figure.
Figure 10.
Experimental curves showing the relationships between the misalignment errors and amplitude loss of the interfering signal. (a) Roll angle. (b) Yaw angle. (c) Pitch angle. (d) Stand-off error. All four figures share the same legend as the first figure.

© 2019 by the authors. Licensee MDPI, Basel, Switzerland. This article is an open access article distributed under the terms and conditions of the Creative Commons Attribution (CC BY) license (http://creativecommons.org/licenses/by/4.0/).
Share and Cite
MDPI and ACS Style
Chang, D.; Xing, X.; Hu, P.; Wang, J.; Tan, J. Double-Diffracted Spatially Separated Heterodyne Grating Interferometer and Analysis on its Alignment Tolerance. Appl. Sci. 2019, 9, 263. https://doi.org/10.3390/app9020263
AMA Style
Chang D, Xing X, Hu P, Wang J, Tan J. Double-Diffracted Spatially Separated Heterodyne Grating Interferometer and Analysis on its Alignment Tolerance. Applied Sciences. 2019; 9(2):263. https://doi.org/10.3390/app9020263
Chicago/Turabian StyleChang, Di, Xu Xing, Pengcheng Hu, Jianing Wang, and Jiubin Tan. 2019. "Double-Diffracted Spatially Separated Heterodyne Grating Interferometer and Analysis on its Alignment Tolerance" Applied Sciences 9, no. 2: 263. https://doi.org/10.3390/app9020263
Note that from the first issue of 2016, this journal uses article numbers instead of page numbers. See further details here.