Long Term Stable Δ-Σ NDIR Technique Based on Temperature Compensation

Department of Mechatronics Engineering, National Changhua University of Education, NO. 2, Shi-Da Road, Changhua 50074, Taiwan, R.O.C.
*
Authors to whom correspondence should be addressed.
Appl. Sci. 2019, 9(2), 309; https://doi.org/10.3390/app9020309
Submission received: 30 November 2018
/
Revised: 2 January 2019
/
Accepted: 10 January 2019
/
Published: 16 January 2019
(This article belongs to the Special Issue Selected Papers from IEEE ICKII 2018)
Abstract
:Featured Application
With the development of industrial precision measurement, highly accurate and stable sensing systems usually require temperature compensation to maintain stability. In this study, the effects of ambient temperature are analyzed and a temperature compensation model is established for the NDIR gas sensing system with Δ-Σ structure to achieve a long term stable gas measurement.
Abstract
For a fast and long term stable Non Dispersive Infrared (NDIR) technology of gas concentration measurement, the temperature compensation is required. A novel proposed Δ-Σ NDIR system was investigated and built with a closed-loop feedback system to stabilize the signal readings without temperature drift. The modulation of the infrared heater gives a corresponding signal of gas concentration based on our proposed Δ-Σ conversion algorithm that was affected by the drift of temperatures for the infrared sensor. For our study, a new temperature compensation model was built and verified that formulates the relationship between gas concentration and temperature of sensor. The results show that our proposed Δ-Σ can measure efficiently with half of the startup time than our previous design and maintain long term stability.
1. Introduction
The major techniques for monitoring gas concentration include the Non Dispersive Infrared (NDIR) sensor, and the solid electrolyte type of gas sensor. There are different considerations to choose the NDIR or solid electrolyte type of sensor, which is more affordable than that of NDIR. Nevertheless, the NDIR gas sensor has more technical advantages than the solid electrolyte type, likes long term stability, high accuracy, and low-power consumption [1]. According to Beer–Lambert’s law, a non-dispersive infrared spectrometer is capable of measuring the light intensity absorbed by the particular gas. The basic architecture of the NDIR includes an infrared light source, an optical tube containing the target gas, and an infrared sensor with a specific wavelength filter.
In general, NDIR instruments use a fixed periodic heating source and two infrared sensors with different filters for two channels. One is the reference channel used to detect the infrared radiation that not be absorbed by gas concentrations. The other channel gives a corresponding reading used to detect the infrared radiation in specific wavelength that will be absorbed by gas concentrations to achieve wavelength selectivity [2]. The Analog-to-Digital Converter integrated circuit (ADC IC) was used to convert the signal readings of these two channels from analog signals into digital signals. The advantage of the dual channel is that it can remove the factors that cause the signal to drift by comparing the differences in light intensity between different channels.
Besides multi-filters type sensing, there is a new approach applied in NDIR gas sensor, which comprises of a sensor and a Fabry–Perot tunable filter by modulating two parallel mirrors to achieve selected band. One selects a band tuned to the absorption band of the gas being measured and the other is fixed at a band of reference light [3].
The Δ-Σ architecture we proposed earlier is an NDIR channel with a closed-loop feedback system that amplifies the signal readings of the sensor and compares it with the threshold voltage, then through microprocessor to count and adjust the heating duty of the light source that can quickly stabilize the entire system signal readings. However, temperature changes will cause the signal readings drifting especially before the system stabilized [4,5]. Therefore, we recorded the relationship between the signal readings of sensor and its temperature changes to explore the dynamic performance of signal readings.
2. Theory and Implementation
2.1. Design of Proposed Δ-Σ Gas Sensing
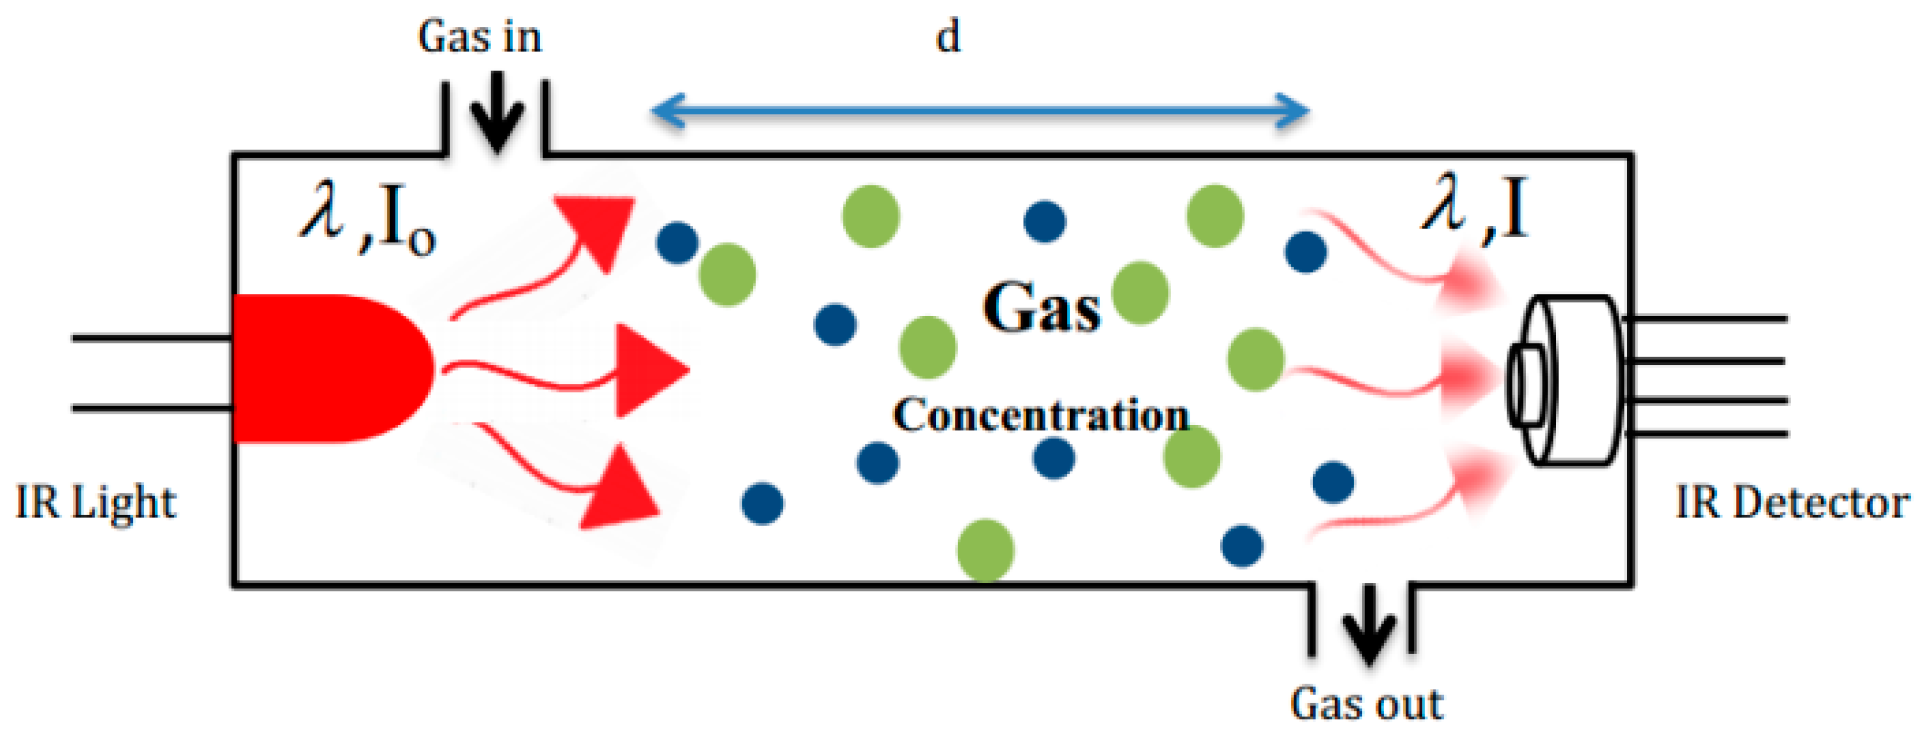
The working principle of a typical NDIR spectrometer is based on the Beer–Lambert’s theorem to describe the relationship between the infrared wavelength (λ), gas concentration (C), absorption medium length (d), and intensity of light source (I), shown in Figure 1. The NDIR spectrometer consists of three basic components: an infrared light source; an optical tube containing target gas concentrations; and an infrared sensor with a specific bandpass filter.
In the experiment, we used OIR-715 as an infrared light source with a wide wavelength band (visible to 4.4 μm). The component that we use to achieve the NDIR selection feature is the thermopile sensor HTS-E21-F3.91/F4.26 which detects the band of infrared radiation absorbed by CO2 (4.26 μm) and the band non-absorption (3.91 μm). Finally, in order to maintain a stable absorption medium length (d), we installed the infrared source and infrared detector at both ends of the 5 cm chamber [6,7].
To build the Δ-Σ modulation architecture, shown in Figure 2. Firstly, the infrared light source emits thermal radiation that is proportional to the fourth power of the temperature of light, Tb. The temperature was raised and controlled by the heating power Pe as the bottom line in Figure 2. Then, the thermal radiation would travel through the chamber and the radiation intensity was multiplied by the factor of Beer–Lambert’s law as ⊗ in the figure. Due to the reading signal being too small to be observed and susceptible to external disturbance. Therefore, we use an integrator to amplify it and high-frequency sampling to filter out the noise, and then quantize it from analog signal into digital signal through a comparator with an adjustable threshold voltage (Vth), shown in middle part of the figure. Finally, the signal is transmitted to the microprocessor which monitors the signal by preset scan time (ts) meanwhile counts working duty of light source to obtain m (heating duty of light source) and N (total duty of light source) through the Δ-Σ conversion algorithm to obtain the correct gas concentration.
In this study, it is practical to develop measurement of gas concentration with long term stability based on temperature compensation. The analytical function for the reading of first-order delta-sigma modulation and sensor’s temperature was built to compensate the drift of measurement of gas concentration. To keep good long term stability for measurement, it is also feasible for higher-order delta-sigma architecture with the same approach because it follows the same thermal behavior and phenomenon. The sampling time of NDIR gas concentration is about few seconds and it is quite long enough to adopt the first-order delta-sigma architecture with low noise.
2.2. Working Principle Based on Δ-Σ Modulation
Figure 3 shows the measurement results as two curves, one is the sensing voltage of thermal radiation measured by the sensor and the other is the output signal of delta-sigma modulation. When the operating state of the light source altering, the output of the modulated signal will change to the corresponding state. In this process, the microprocessor based on the delta-sigma algorithm plays an important role. It monitors the change of the electrical signal from the light source through the preset scan time (denoted as ts) and identifies the current working state of the light source. After N times of sampling which is comprise of heating duty (denoted as m) and cooling duty (denoted as N-m) of light source, we can obtain the total sampling time (denoted as N × ts) and total heating time (denoted as m × ts). In our study, the signal reading is quantized as Ratio (Ratio = ). Finally, we can obtain the relationship between correct gas concentration and Ratio by mathematical derivation [6].
2.3. NDIR Mathematical Model Based on Δ-Σ Modulation with Temperature Drift
In order to find out the relationship between Ratio () and gas concentration (C), we separately analyzed the physical phenomena of the infrared light source and the sensor during the Δ-Σ modulation.
2.3.1. Infrared Light Source
According to the Heat Transfer Theory, it is given by [8]:
For our proposed delta-sigma system, the scan time (ts) is about microsecond and the time constant of infrared light source is about 200 ms from the datasheet. It means that dTb, dt can be replaced by ∆ and ts, respectively, within enough accuracy and Equation (2) can be derived from Equation (1):
where H is the heat capacity coefficient, G is the thermal conductivity coefficient, is the room temperature, the subscript b refers to the infrared light source, ε is the emissivity, σ is the coefficient of Stefan-Boltzmann, and is the instantaneous power of the infrared light source.
In addition, we discussed the working state of infrared light source in order to describe the temperature phenomenon and the working duty of light source more specific. ∆ can be separately derived as ∆ and ∆ during preset scan time () in Equations (3) and (4).
The temperature changes of the infrared light source during heating period, ∆:
The temperature changes of the infrared light source during cooling period, ∆:
From Equations (3) and (4), the description of physical phenomenon of the infrared light source based on Δ-Σ modulation is derived and it yields the formulation that indicates the relationship between Ratio and the infrared light source can be expressed as Equation (5):
where is the initial temperature of the light source, is the temperature after the light source is heated and cooled for N times, m∆Tr is the increased temperature when the light source is heated, and (N-m)∆ is the decreased temperature when the light source is cooled.
In this work, after the light source starts to work for a period of time, the temperature of the light source () will gradually balance with the room temperature (). At the same time, the original temperature of light source (will also tend to the operating temperature of light source (). Therefore, we can obtain the approximate equation, which shows the relationship between the average operating temperature of the light source and Ratio in the steady state, as Equation (6):
2.3.2. Sensor
The Δ-Σ architecture is based on the net radiation signal received by the sensor, which is used to modulate the heating duty of the infrared light source. According to Stefan–Boltzmann’s law, the revived infrared radiation depends on the temperature of the light source as Equation (7) and it also is described by the Beer–Lambert’s L which is related to the gas concentration, shown in Equation (8).
The infrared radiation from the sensor to the environment is also considered to be derived for the net radiation of sensor, which is related to the temperature of sensor described in Equation (9). The temperature of sensor is easily affected by the heat from the environment, PCB (Printed circuit board) and the heat of the infrared light source. This is the major factor to be evaluated for the drift of gas concentration based on Δ-Σ architecture.
where IO is the intensity of the infrared light source before being absorbed by gas concentrations, A and B are geometric parameters.
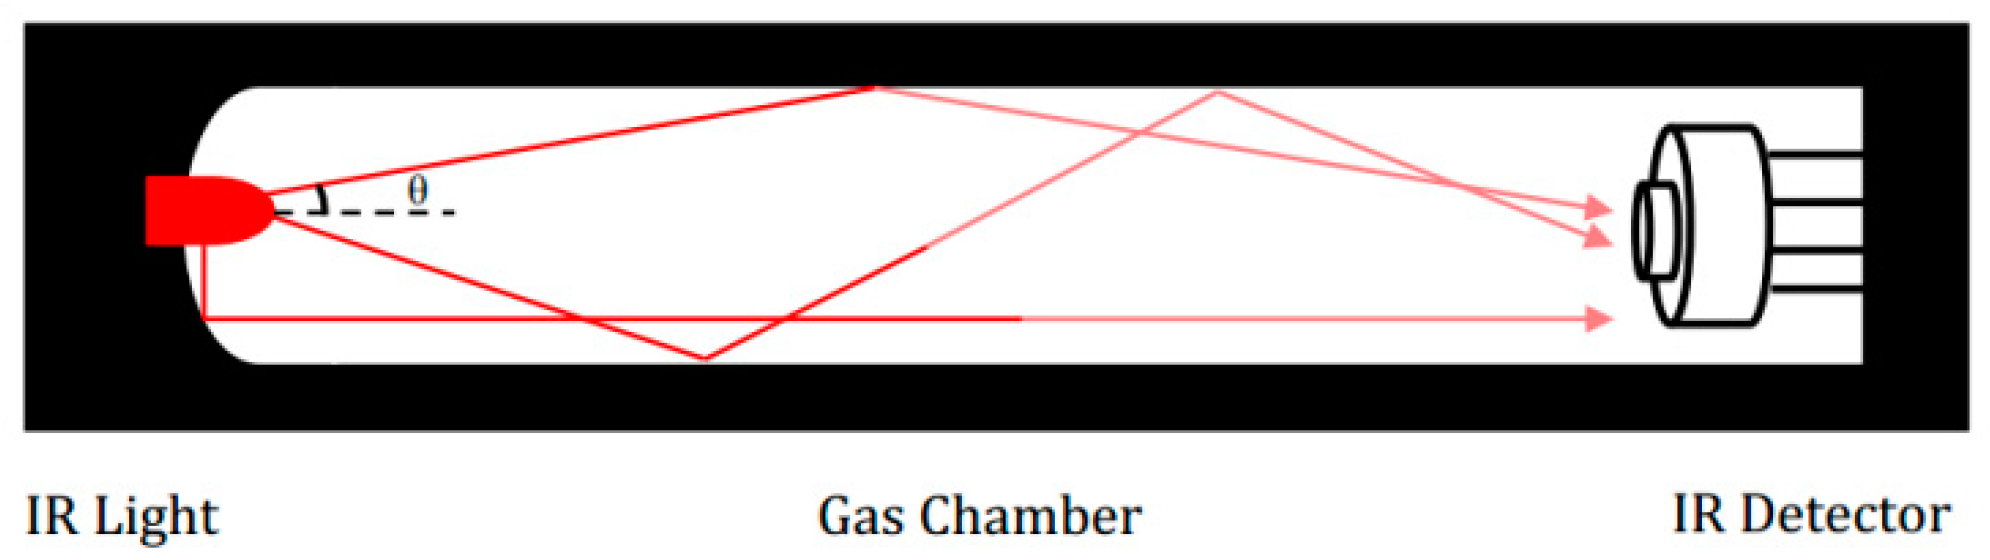
In order to describe the physical phenomenon more completely and realistically, we considered the emitting angle of light source, shown in Figure 4.
The net radiation of sensor can be described as:
By substituting Equation (6) into Equation (10), we will obtain an equation for the description of the threshold voltage (Vth), which is also the key parameter in our proposed Δ-Σ architecture; the equation can be written as:
where a and b are the electronic circuit gain and related system parameters, S is the sensitivity of the sensor.
Finally, the equation for description of the gas concentration (C) has been derived to rewrite Equation (11); the equation can be written as follows:
These expressions reveal several important factors regarding the effects of operating time of system (t) and temperature Ta, which is supposed to be investigated carefully in this research.
2.4. Dynamic Temperature Compensation
In our previous study, we discussed the steady state system and obtained a good linear transfer function between the Ratio and the CO2 concentration, as shown in Figure 5.
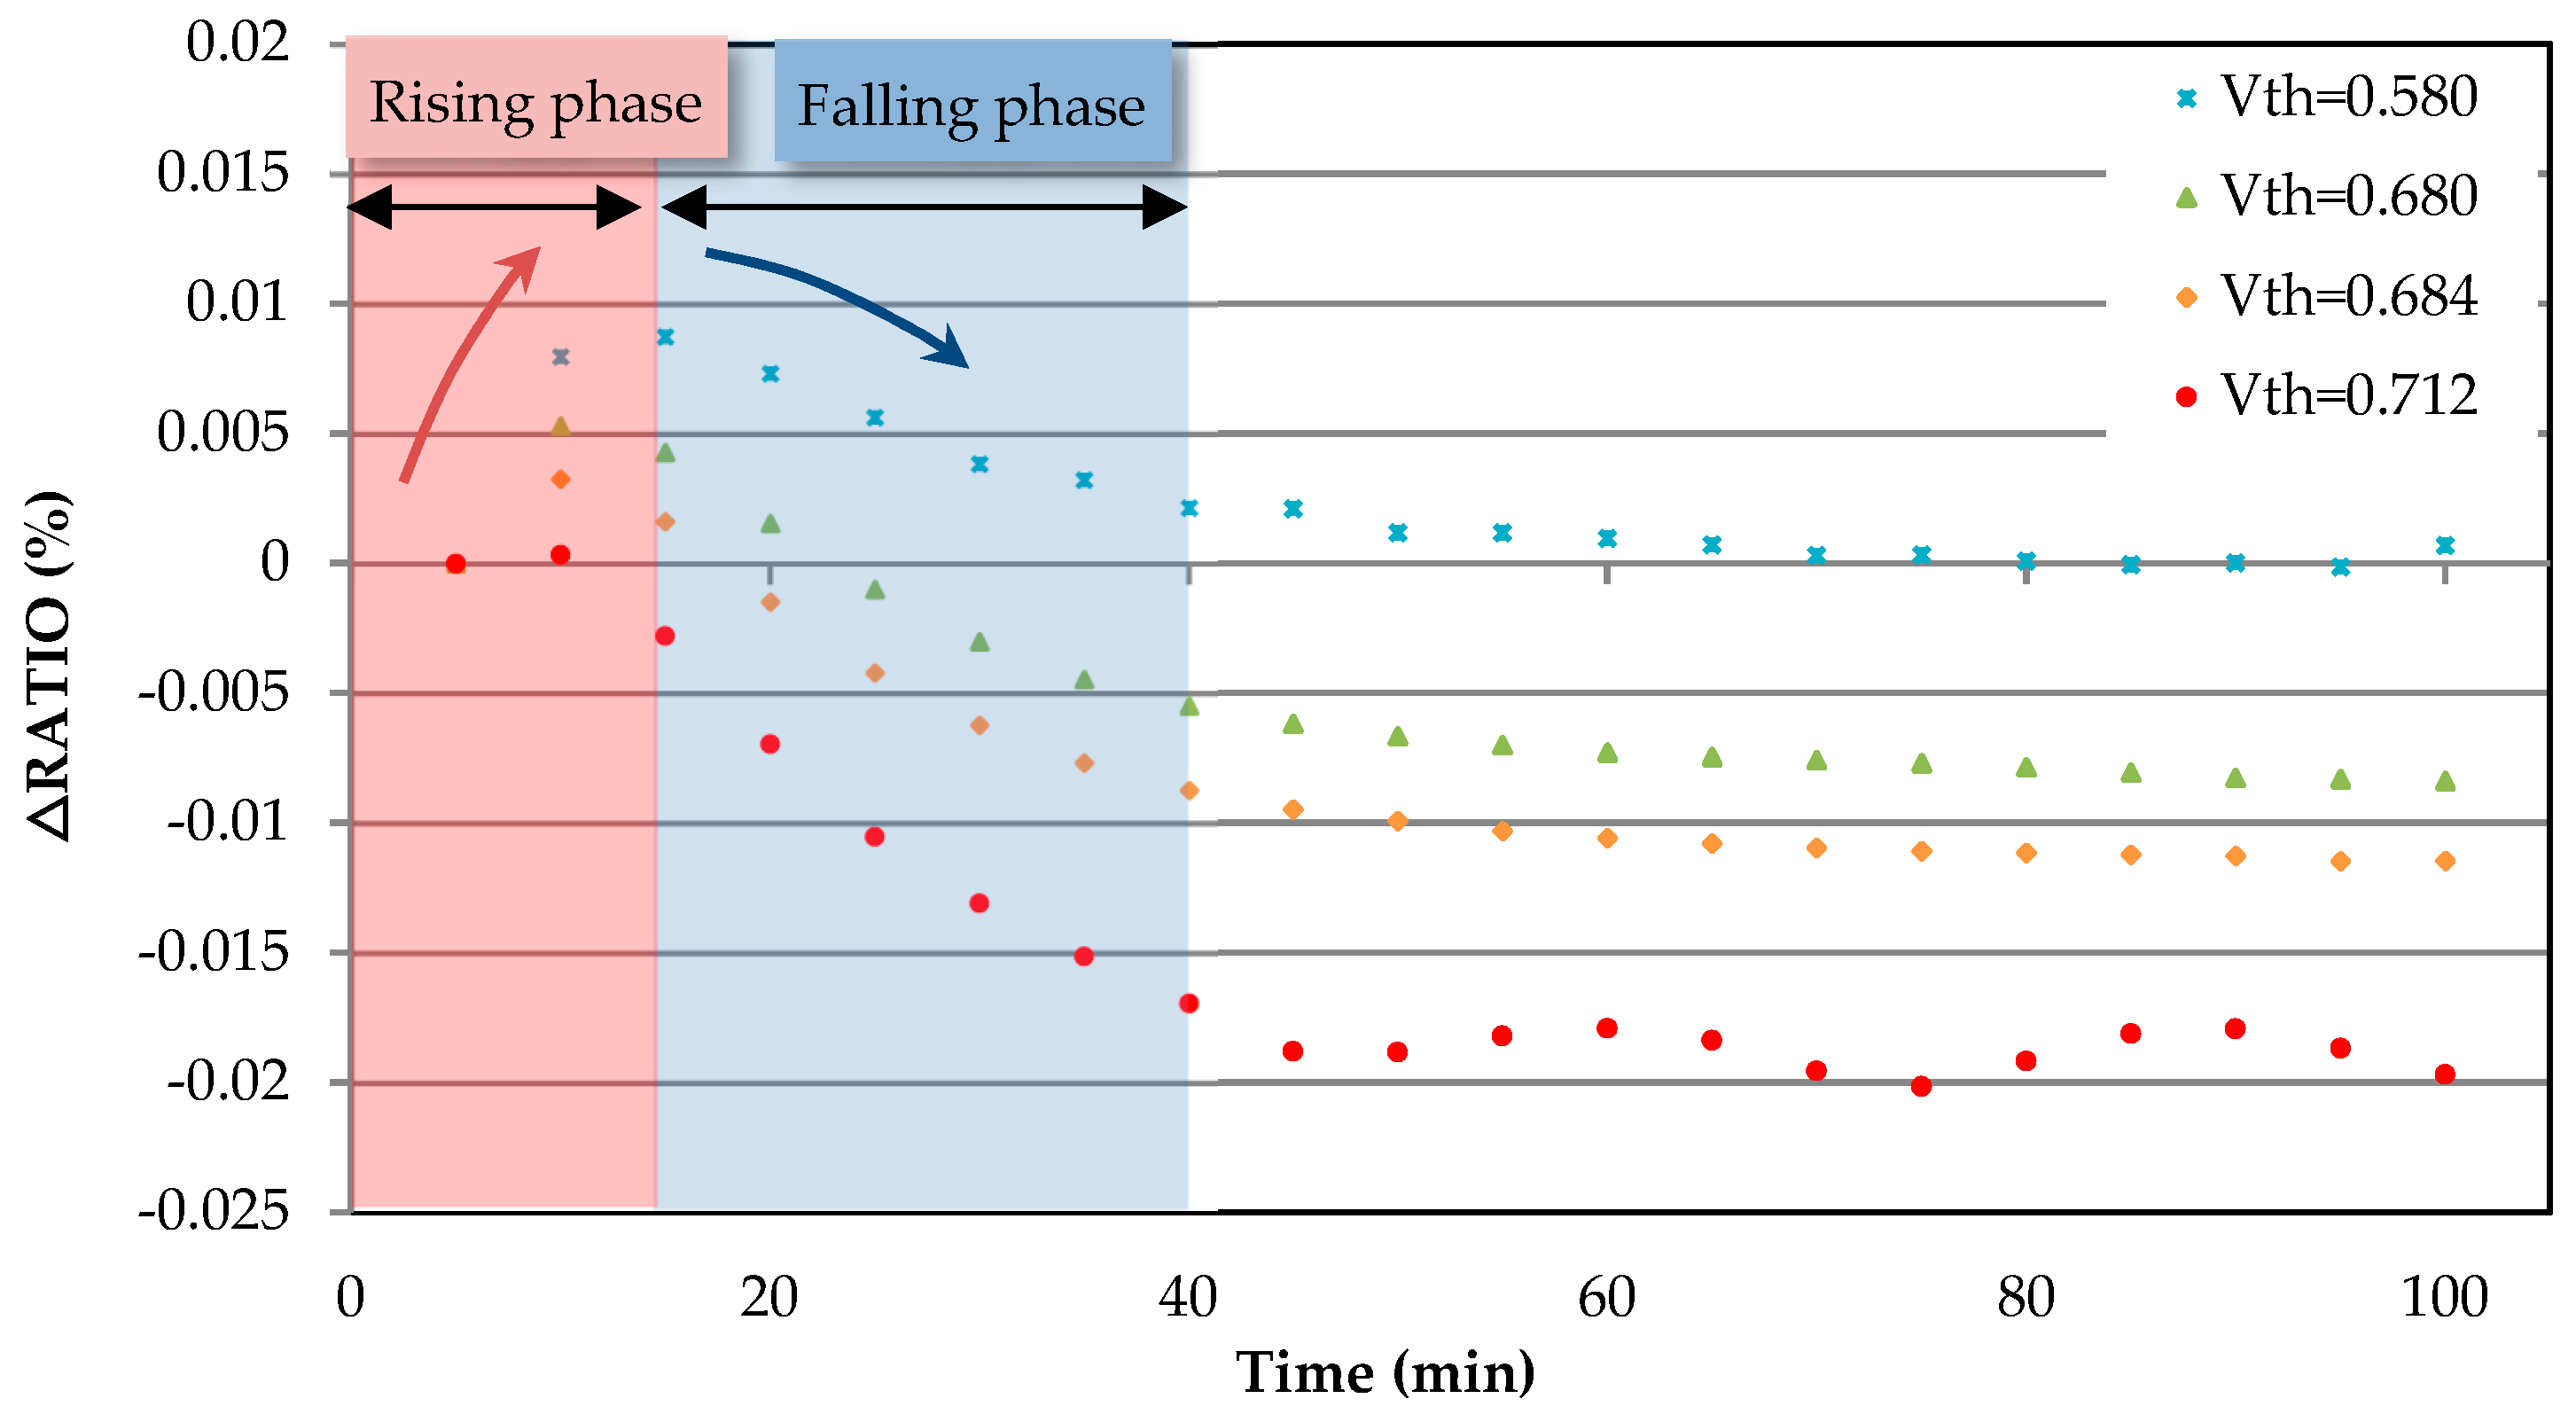
In this study, we analyze and observe the change of Ratio which showed a dynamic drift before the system into steady state (40 min), shown in Figure 6. There is a rising phase which shows the increasing of the Ratio for the curve in Figure 6 and a subsequent falling phase which shows the decreasing of Ratio. To compensate for dynamic drift, we discussed the physical phenomenon of the infrared light source and the sensor during rising and falling phase.
3. Measurements and Results
In our proposed Δ-Σ system, a threshold voltage (Vth) designed to determine the amount of average thermal radiation that the infrared light source needs to provide and to quantize the signal reading of sensor.
3.1. Infrared Light Source
(1) The rising phase affected from thermal radiation produced by infrared light source:
After the sensing device turned on, the operating temperature of the infrared light source will gradually increase. However, the light source produced less thermal radiation in the beginning (the light intensity was weak), which might cause the sensor have more chances to receive less amount of thermal radiation. That is, the circuit would feedback control the light source to increase the heating duty (Ratio = ↑) and higher frequently to maintain the average amount of thermal radiation.
(2) The falling phase affected from thermal radiation produced by infrared light source:
As the measurement time increases, the operating temperature of the infrared light source is getting higher than in beginning. To fix the heating duty of light source as constant, the light source will generate more thermal radiation, which means the sensor will receive higher amount of the thermal radiation. That will cause the circuit feedback control the light source to decrease the heating duty (Ratio ↓) till the light intensity is saturated.
3.2. Sensor
(1) The rising phase affected from signal reading drift of sensor:
After turning on the sensing device, the ambient temperature around sensor will increase due to the light source heating and affected by the changes of room temperature. The increment of the ambient temperature will result in the increment of the outward radiation of sensor. Assume that the input radiation is constant; the net radiation of sensor will decrease, which means the circuit will feedback control the light source to increase the heating duty (Ratio ↑) to maintain the sensor and receive the average amount of thermal radiation.
(2) The falling phase effected from signal reading drift of sensor:
As the measuring time increases, the ambient temperature of sensor will gradually balance with the room temperature, which means the changes of the outward radiation of sensor will slow down. The net radiation of sensor will gradually insensitive to its temperature changes. Therefore, the drifting thermal radiation of the infrared light source will be the main reason for the decrease of Ratio in this phase.
In order to analyze the changes of the operating temperature of the infrared light source caused by different heating duty, we keep the CO2 concentration at 500–600 ppm and set several Vth (0.580, 0.680, 0.684, 0.712 V) to observe how the light source effect on the dynamic drift of Ratio.
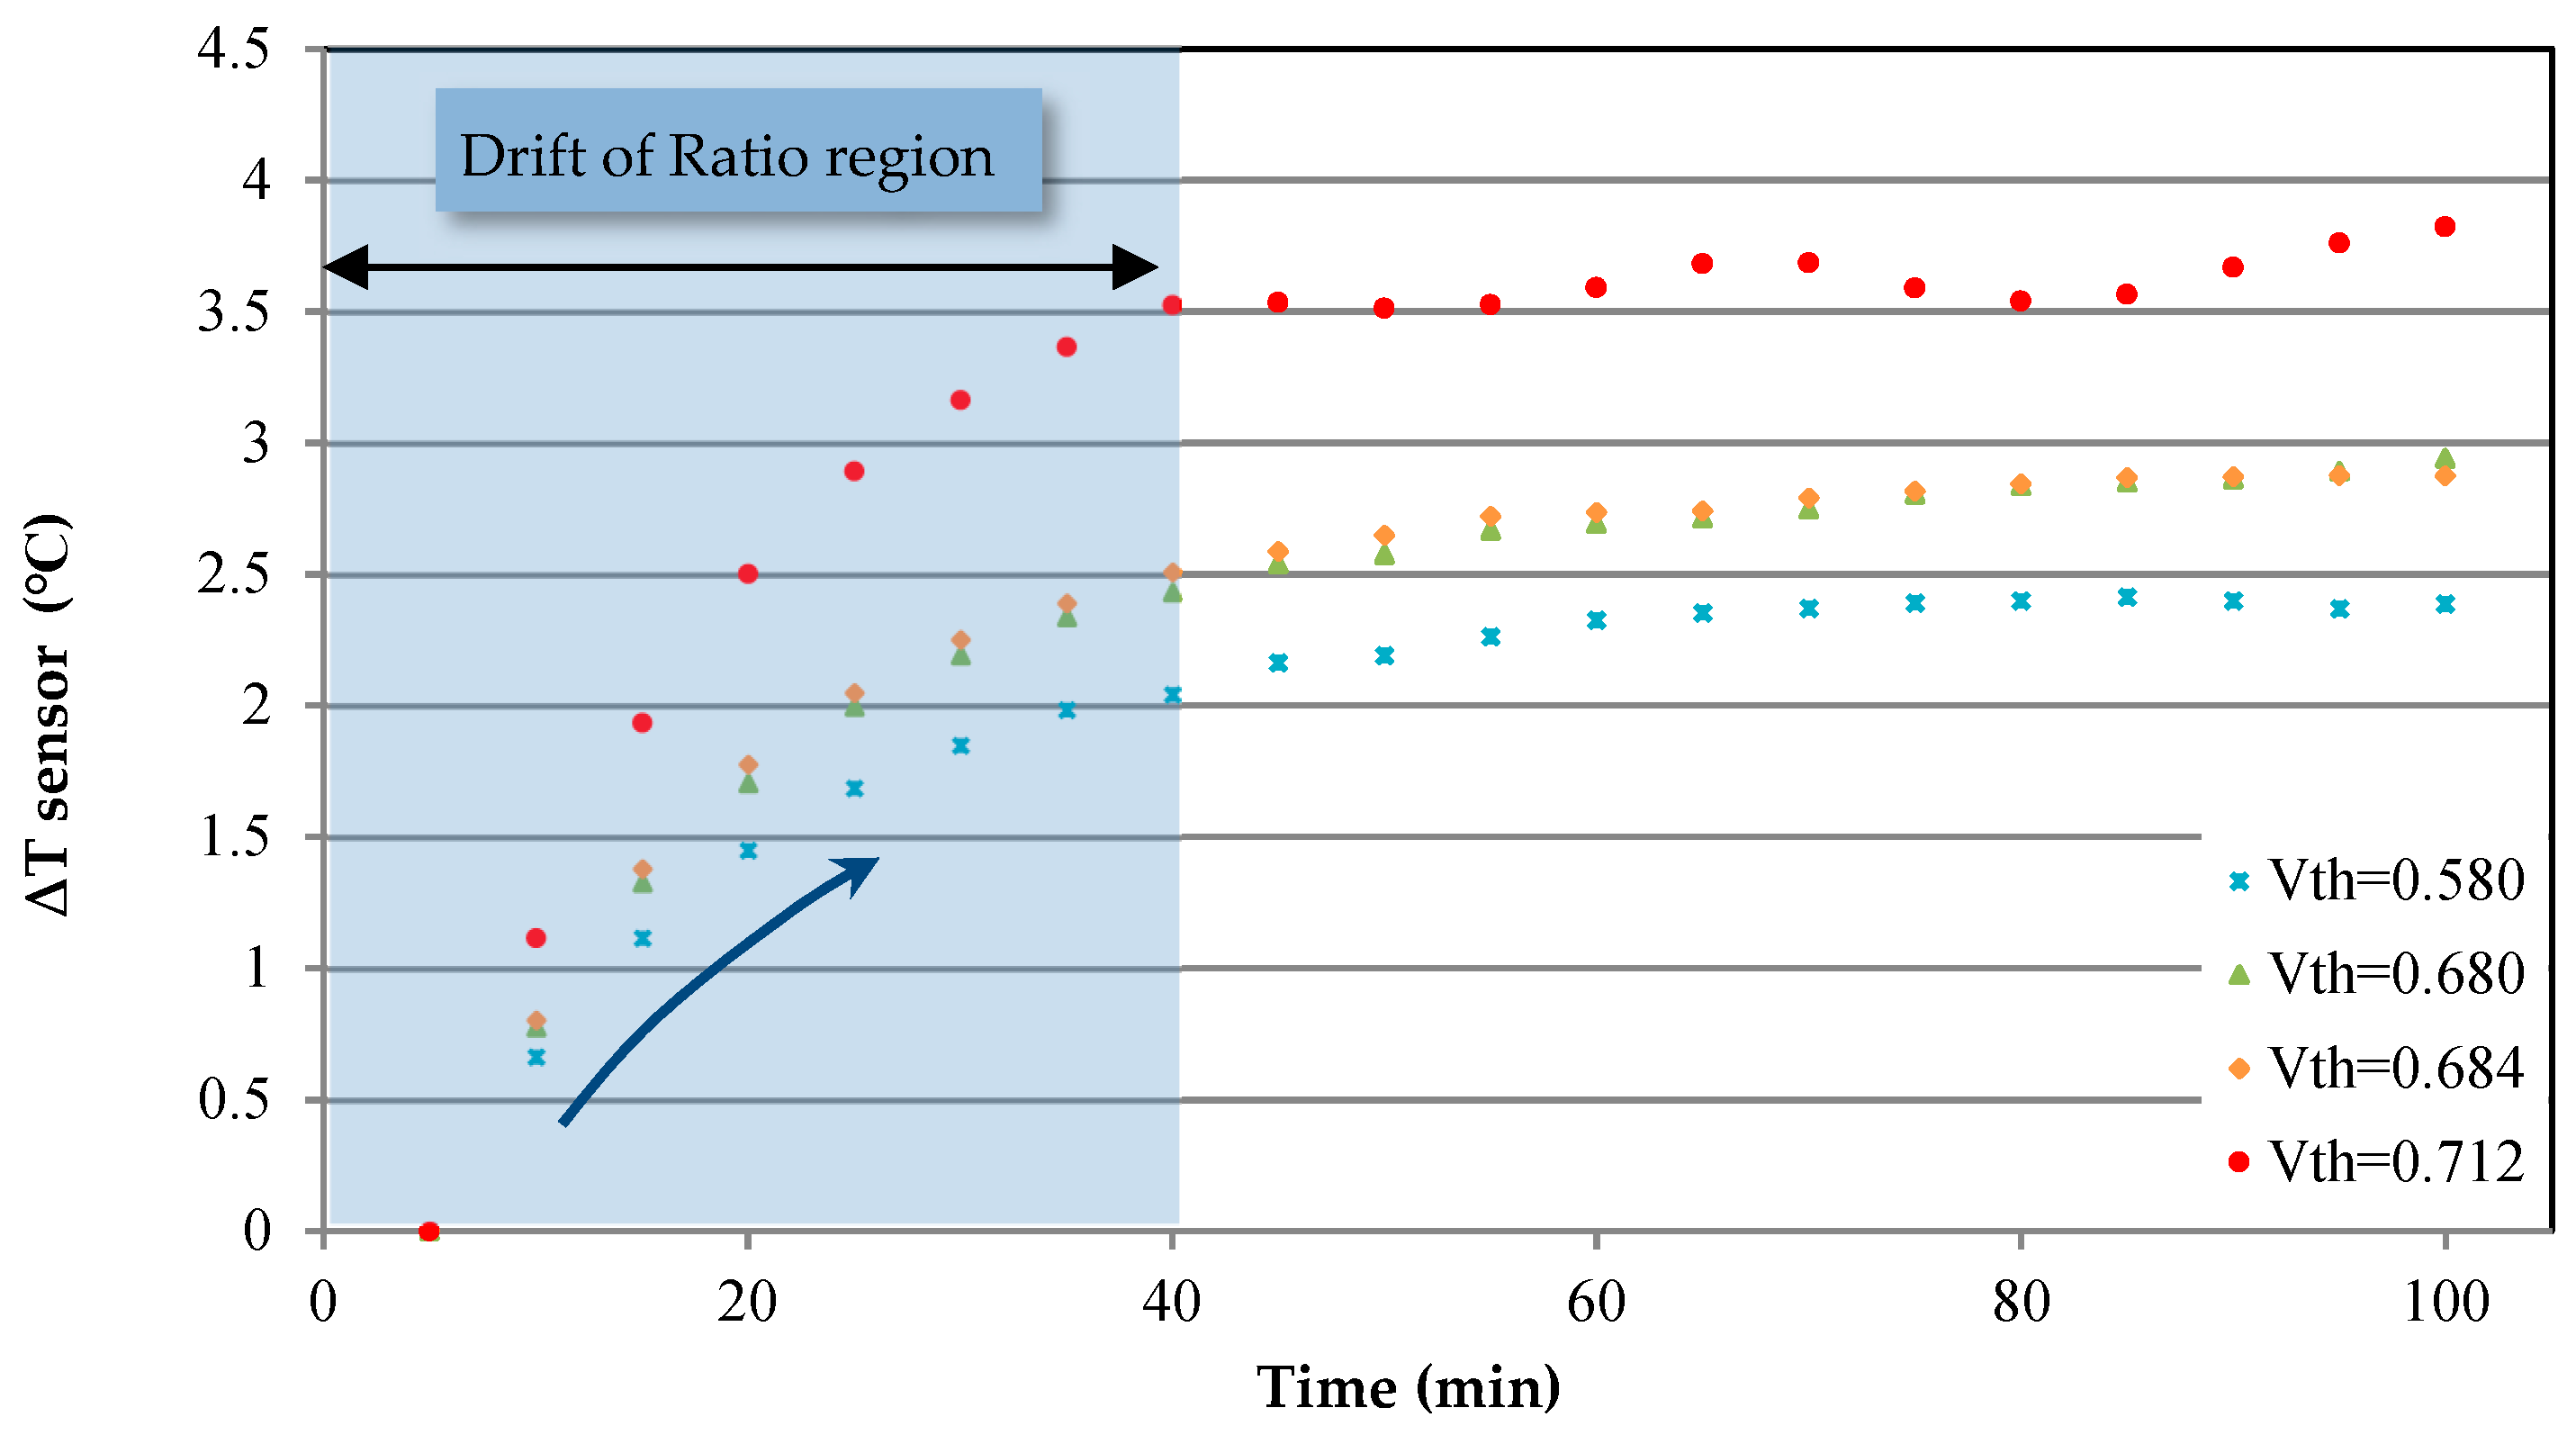
Besides, the dynamic drift of Ratio is also due to the temperature changes of sensor. Therefore, a thermistor is installed at the sensor to record the temperature change during the measurement. There is a certain correlation between signal reading and the temperature change before 40 min, as the drift of Ratio region shown in Figure 6 and Figure 7.
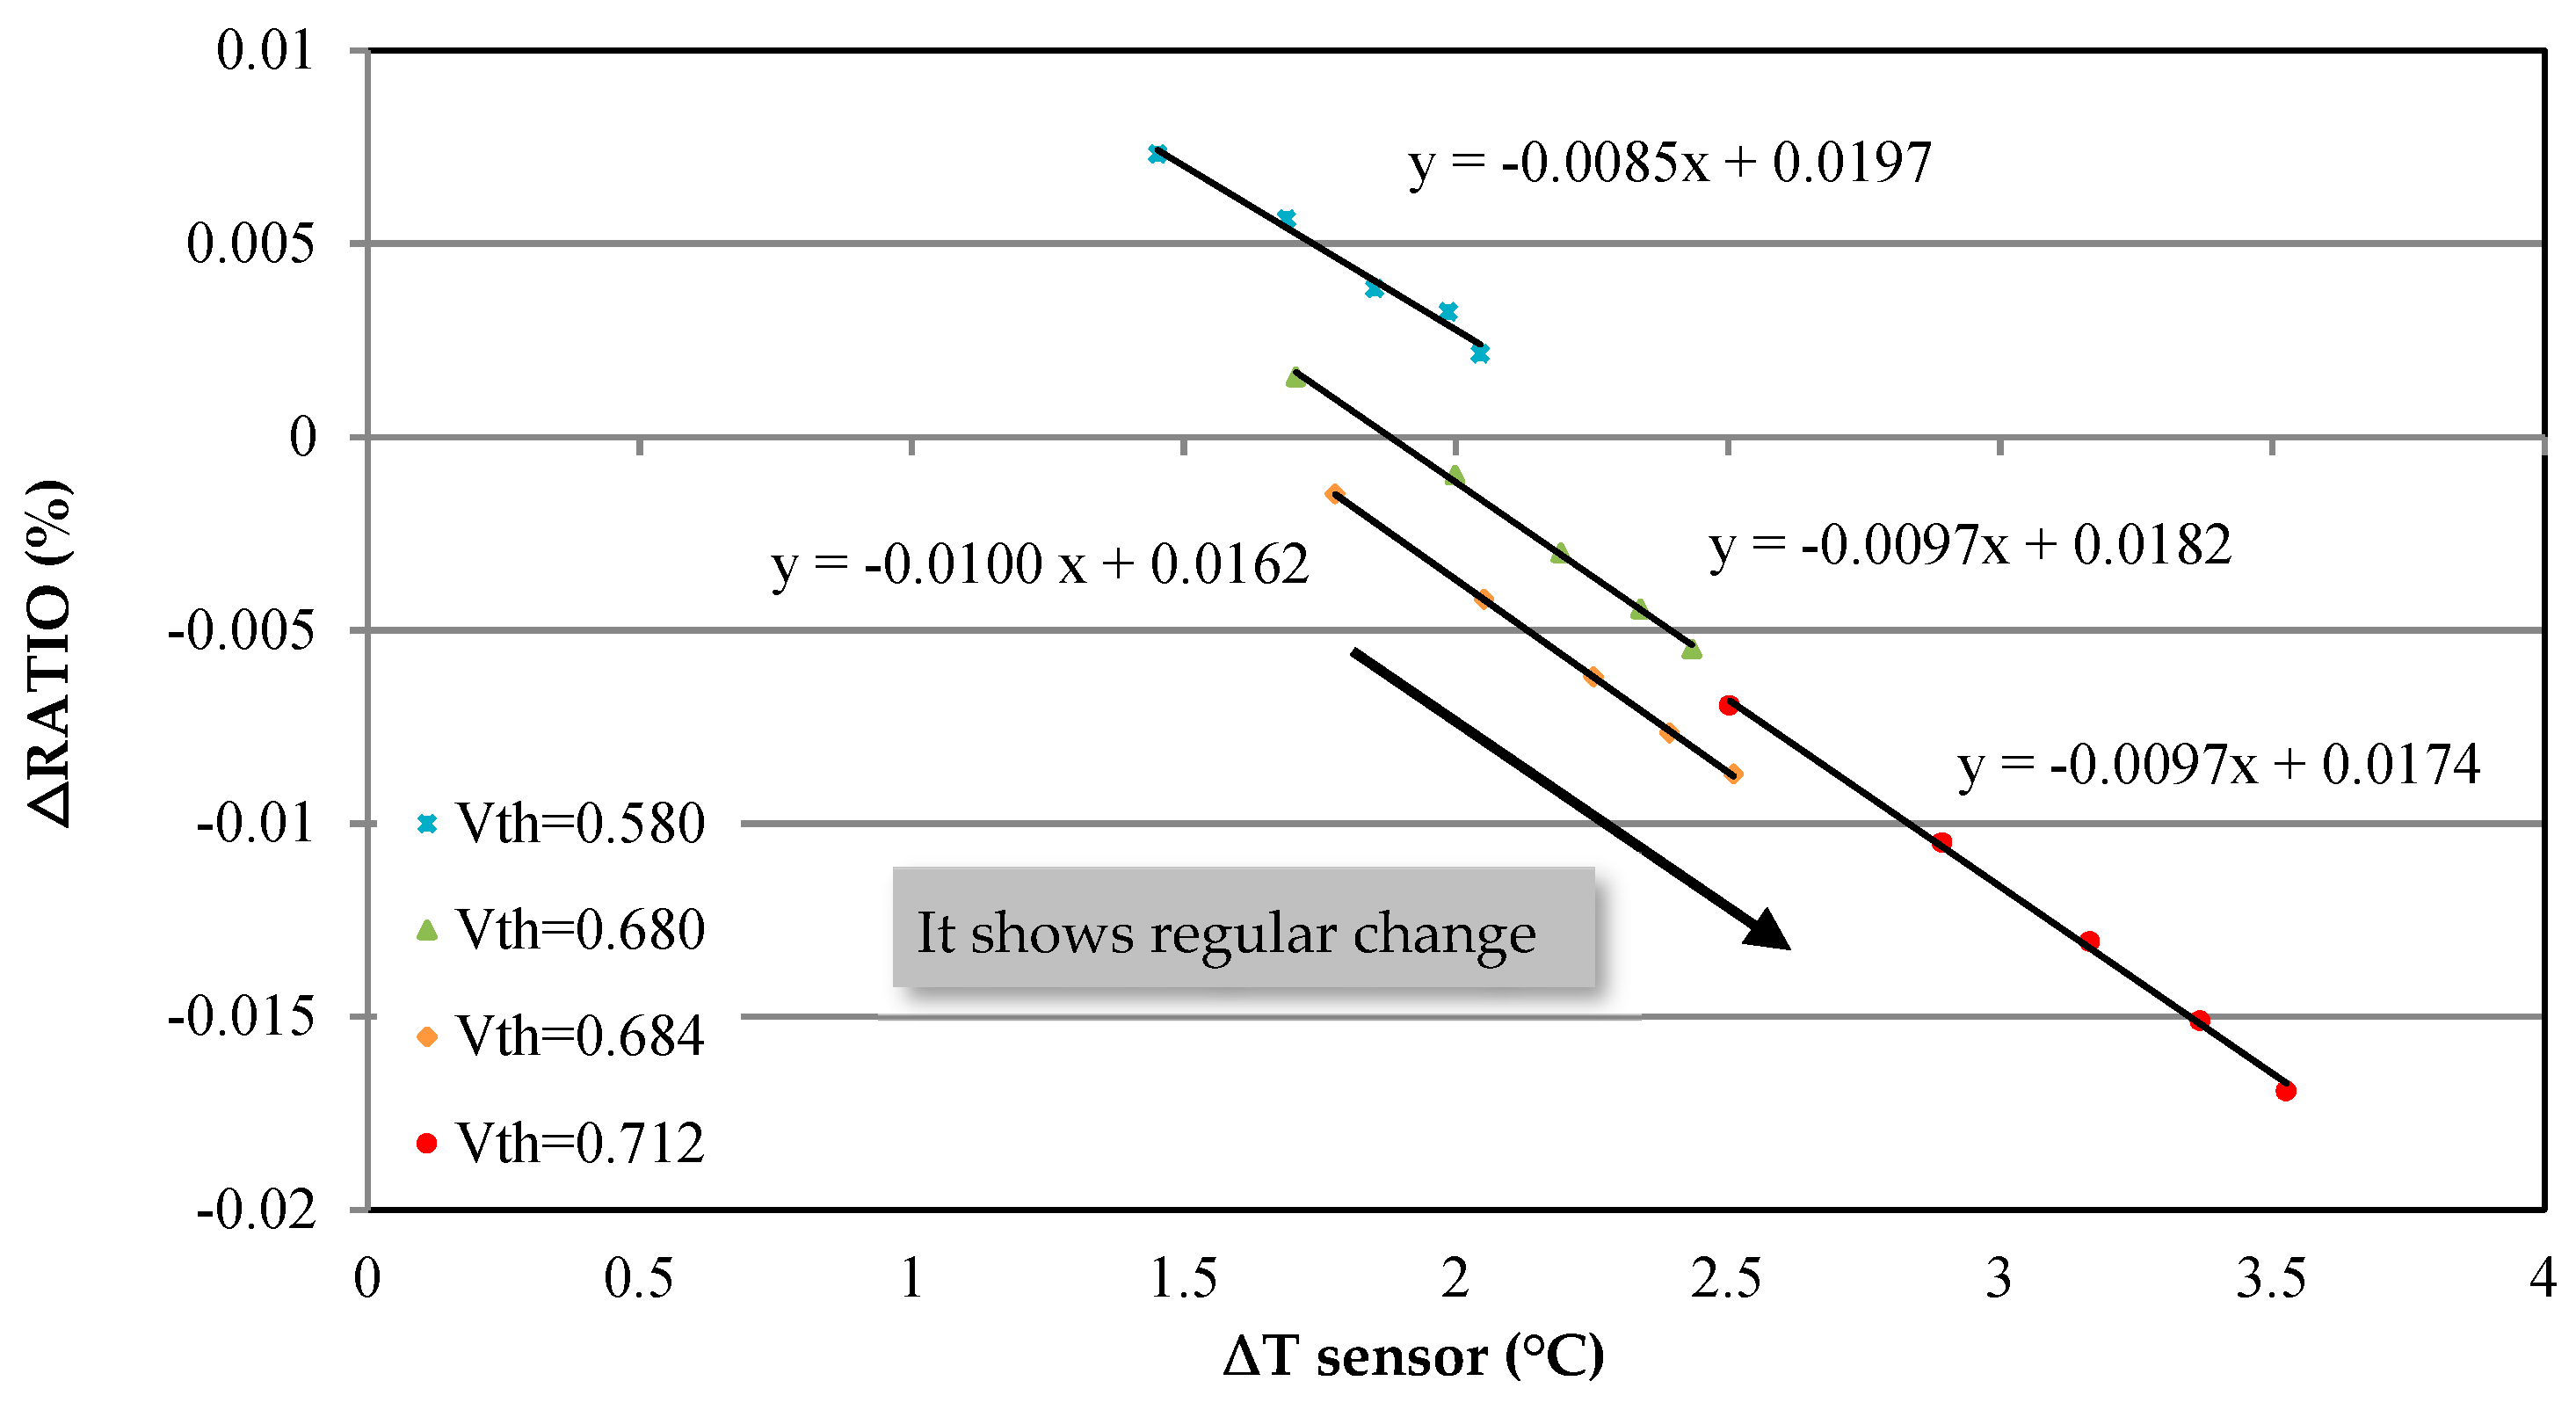
As shown in the Figure 8, the Ratio will change when the T sensor changes, which allows us to compensate for the dynamic drift of the Ratio through changes of T sensor.
In this study, we discuss the relationship between the T sensor and the Ratio in the falling phase; it not only shows a good regular correlation between the T sensor and the Ratio but also reveals a method of temperature compensation, as shown in Figure 8.
We analyzed the slope in Figure 8 and figured out the temperature compensation formula as following:
where Ratio (new) is temperature compensated data, Ratio (old) is temperature uncompensated data, slope (Vth, T sensor, Ratio) is variable coefficient which will change with different conditions.
Figure 9 and Figure 10 show two results; one is the time of dynamic drift after temperature compensation is significantly reduced from 40 min to 18 min as the drift of Ratio region after compensation and the other is that the Ratio does not change with different T sensor, which makes us to achieve the purpose of temperature compensation.
The evaluation of temperature compensation for our proposed delta-sigma NDIR technique after 20 min is compared and is shown in Table 1. It shows that the temperature dependence of the CO2 after temperature compensation is reduced from an average of 2.589% to 0.115%, which comes from the effectiveness of temperature compensation we built and it reveals our proposal architecture gives a practical application of NDIR gas concentration measurement.
4. Conclusions
This research reports a new NDIR gas-sensing device based on Δ-Σ architecture, it has closed-loop feedback system for modulating the heating duty of infrared light source. The average working temperature of infrared light source showed slow drift during the startup period. It is found that the dynamic drift of signal readings affected by the temperature change of sensor and it is related to the heat of infrared light source and room temperature. A thermistor is installed to monitor the temperature change of sensor and discussed with its signal readings. To develop a long term stable CO2 concentration measurement technique, a temperature compensation model was built, which describes the relationship between the temperatures and gas concentrations, and verified by our proposed Δ-Σ NDIR system to correct the effect of overheating temperature of sensor. The results give a new approach not only to measure gas concentration fast but also maintain a long-term stability significantly reduce the dynamic drift time from 40 min to 18 min. Moreover, we could obtain long term stable signal readings which won’t be affected by the changes of temperature.
Author Contributions
The authors contribute of this paper as follows: Conceptualization and Methodology, C.-H.S. Circuit design, Analysis and Measurement J.-H.Y.
Funding
The authors would like to thank the Ministry of Science and Technology of the Republic of China, Taiwan, for financially supporting this research under contract MOST 107-2221-E-018-012.
Acknowledgments
The authors would also like to thank the Chip Implementation Center of Taiwan for project support and chip implementation.
Conflicts of Interest
The authors declare no conflict of interest.
References
- Hyun, P.S.; Hyeop, Y.S.; Yeong, L.J.; Bae, P.H. The NDIR CO2 Sensor Implementation and Temperature Compensation. Proc. Atlantis Press ICMRA 2015. [Google Scholar] [CrossRef]
- Chen, S.; Yamaguchi, T.; Watanabe, K. A Simple, Low-Cost Non-Dispersive Infrared CO2 Monitor; Research Institute of Electronics, Shizuoka University: Shizuoka, Japan, 2002. [Google Scholar]
- Hammons, B.E.; Fritz, I.J.; Brennan, T.M.; Howard, A.J.; Olsen, J.A. Strain-relaxed inGaAs buffer layers grown by molecular-beam epitaxy for 1.3 μm Fabry-Perot optical modulators. J. Vac. Sci. Technol. Part B Am. Inst. Phys. 1993, 11, 932–934. [Google Scholar] [CrossRef]
- Yi, S.; Park, J.; Park, J. Temperature Compensation of Novel NDIR CO2 Gas Sensor. In Proceedings of the SENSORS, 2006 IEEE, Daegu, Korea, 22–25 October 2006; pp. 1373–1376. [Google Scholar]
- Yi, S. Temperature Compensation Methods of Nondispersive Infrared CO2 Gas Sensor with Dual Ellipsoidal Optical Waveguide. Sens. Mater. 2017, 29, 243–252. [Google Scholar] [CrossRef]
- Shen, C.; Li, S. Analysis of ultra-short pulse modulation for NDIR. In Proceedings of the 2017 International Conference on Circuits, Devices and Systems (ICCDS), Chengdu, China, 5–8 September 2017; pp. 184–188. [Google Scholar]
- Shen, S.Z.; Chen, C.F.; Shen, H.C. A New Pulse Delta-Sigma CO2 NDIR Gas Detector. Opt. Photonics J. 2016, 6, 219–225. [Google Scholar] [CrossRef]
- Puton, J.; Jasek, K.; Siodlowski, B.; Knap, A.; Wioeniewski, K. Optimisation of a pulsed IR source for NDIR gas analysers. Optoelectron. Rev. 2002, 10, 97–103. [Google Scholar]
Figure 1.
Beer–Lambert’s theorem.

Figure 2.
The Δ-Σ modulation architecture.
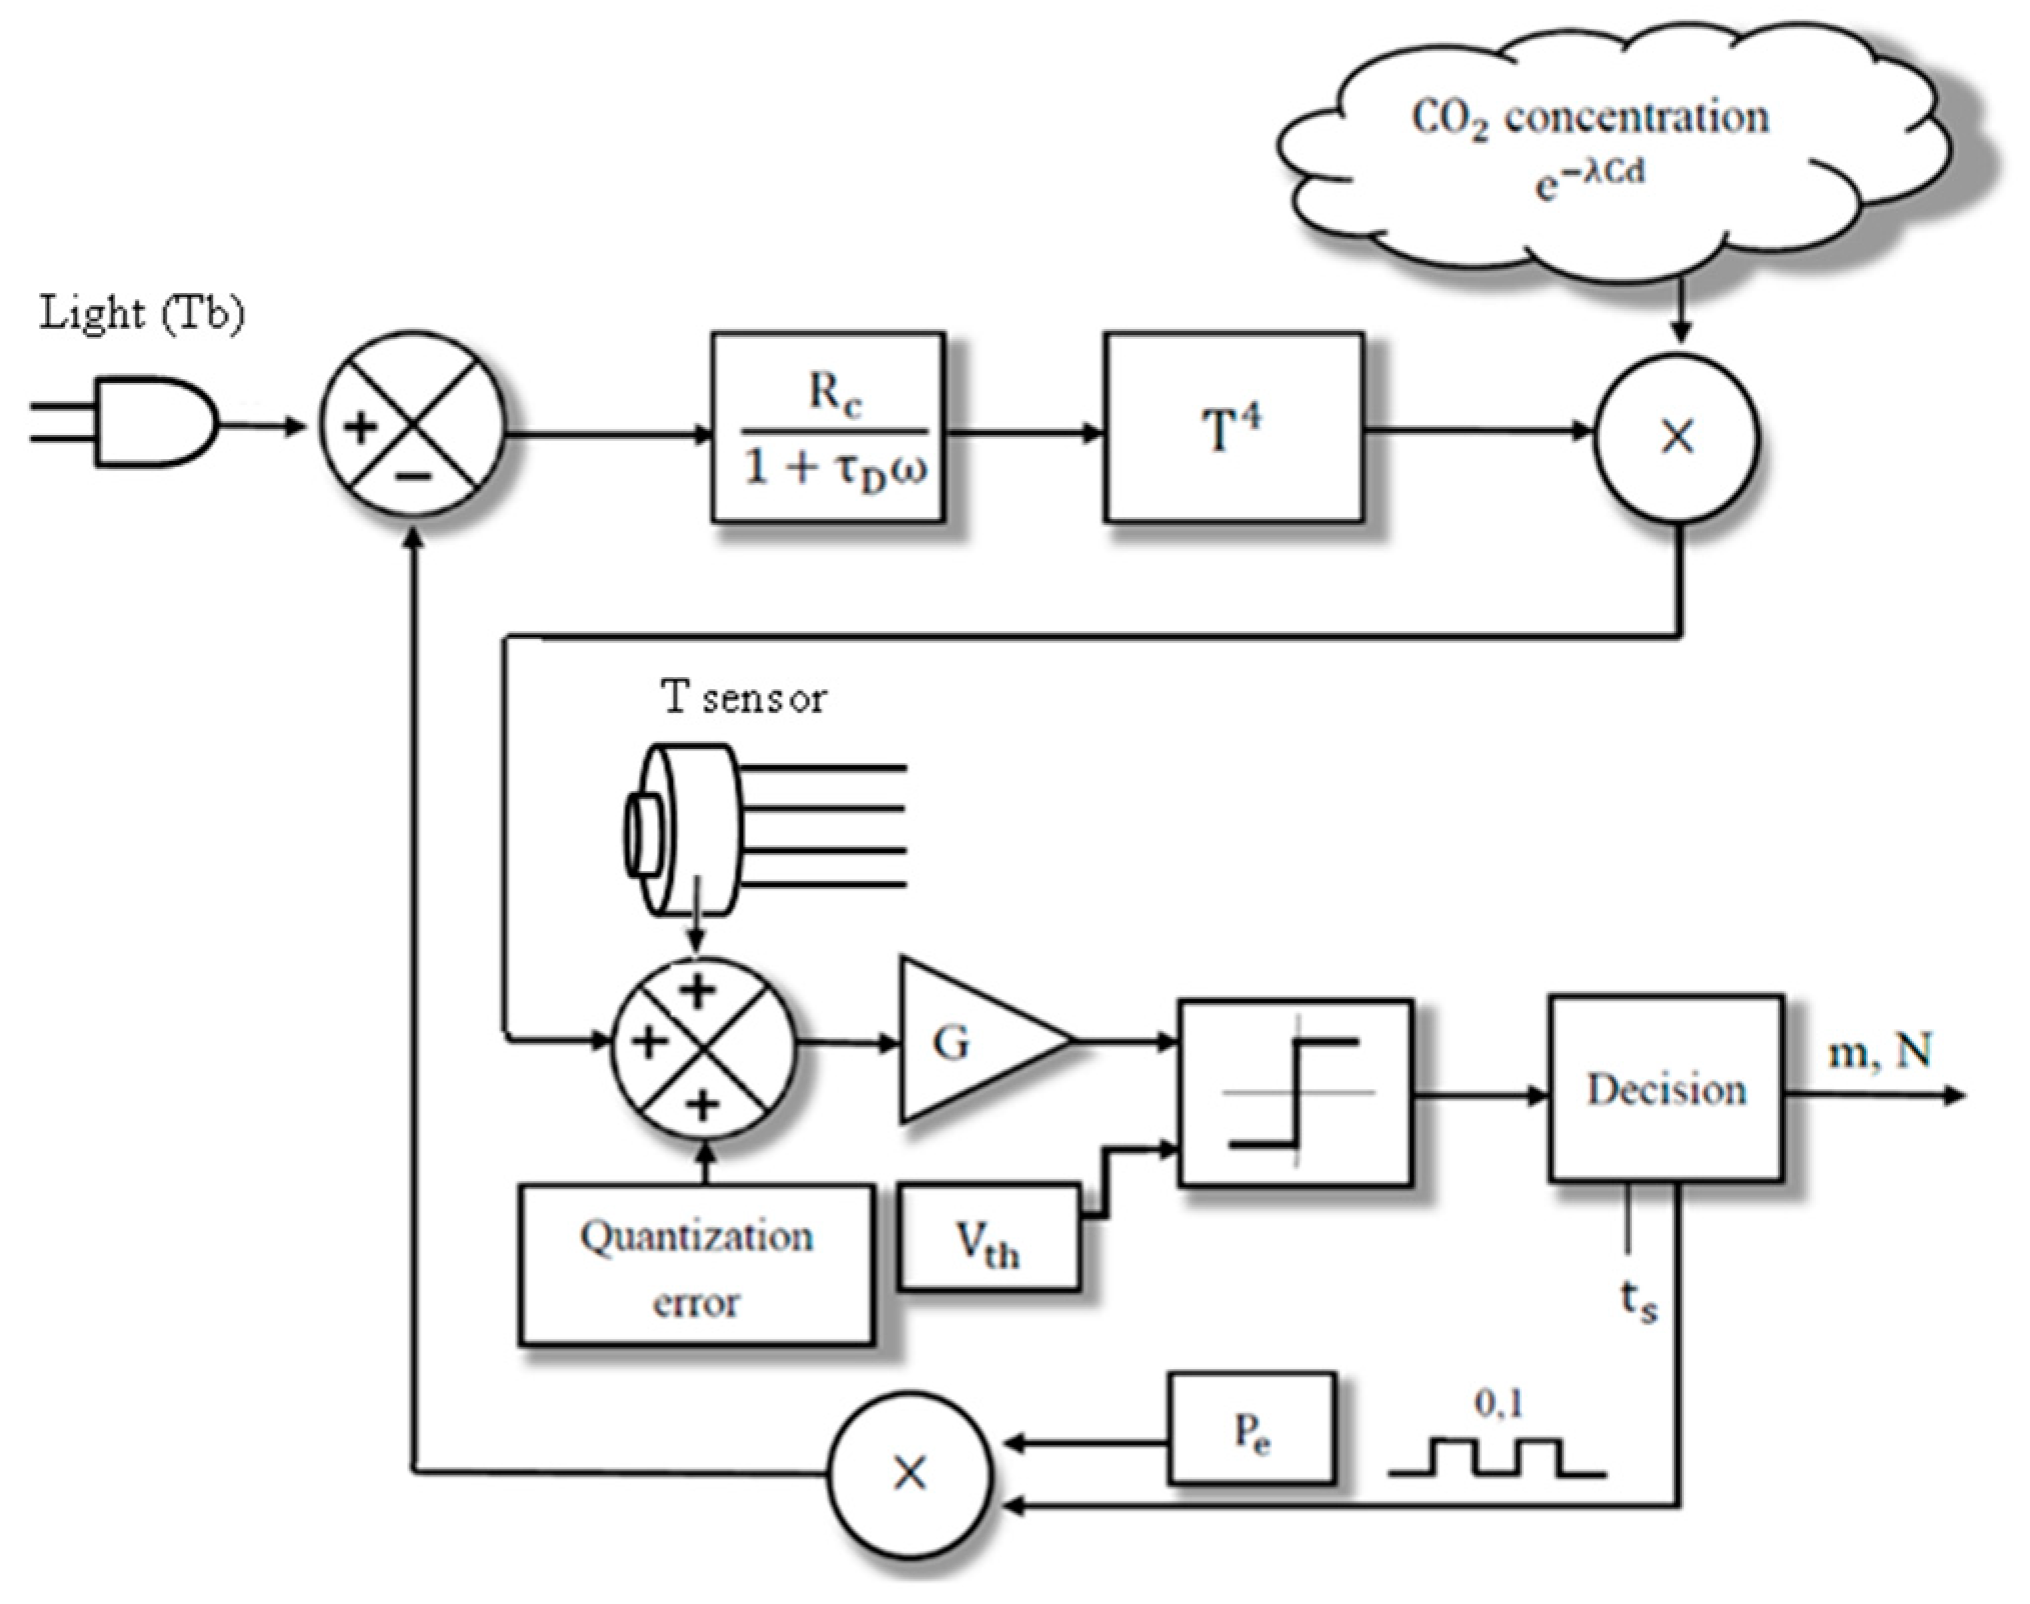
Figure 3.
Working principle of Δ-Σ modulation architecture.
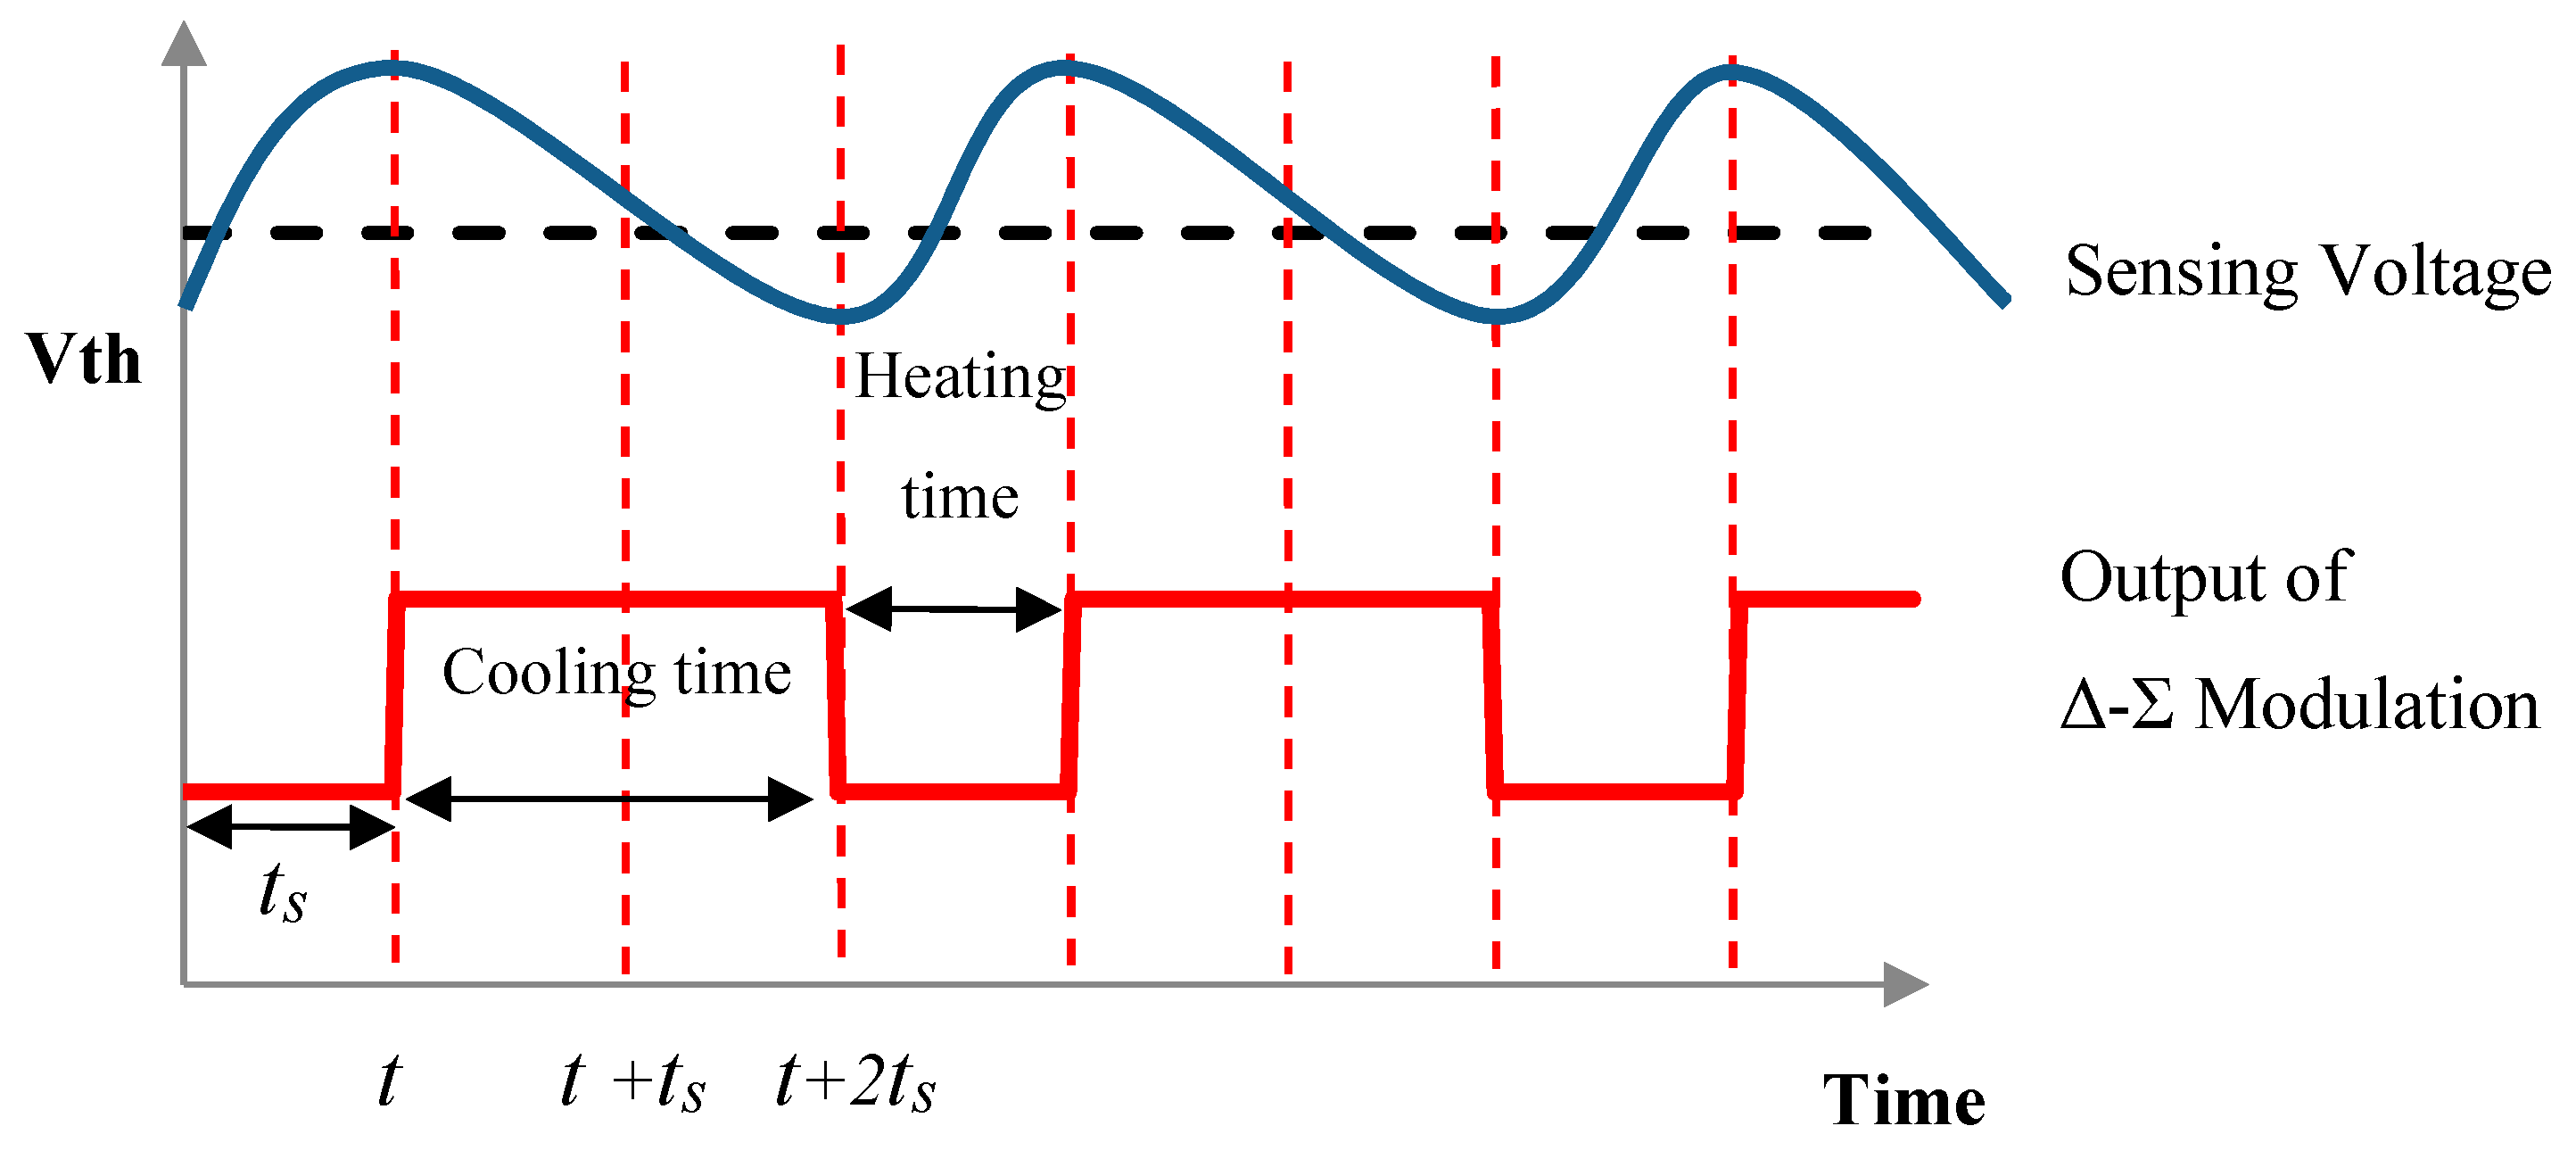
Figure 4.
Schematic diagram of Non Dispersive Infrared (NDIR) system.

Figure 5.
Calibration curve for CO2 concentration (ppm) vs. Ratio ().

Figure 6.
Ratio changes before compensation within 100 min.

Figure 7.
Temperature changes of sensor within 100 min.

Figure 8.
Relationship between Ratio and T sensor without temperature compensation.

Figure 9.
Ratio changes after compensation within 100 min.

Figure 10.
Relationship between Ratio and T sensor with temperature compensation.


Table 1.
Temperature dependence between the time at 20 min and 40 min
| Vth (V) | 20–40 min ∆T sensor (°C) | 20–40 min ∆CO2 (before) | 20–40 min ∆CO2 (after) | Pre-Temperature Dependence (%) | Post-Temperature Dependence (%) |
|---|---|---|---|---|---|
| 0.580 | 0.5928 | 1.5 | 0.1 | 2.638% | 0.197% |
| 0.680 | 0.7273 | 4.5 | 0.1 | 2.647% | 0.066% |
| 0.684 | 0.7322 | 3.0 | 0.1 | 2.525% | 0.115% |
| 0.712 | 1.0231 | 4.5 | 0.2 | 2.547% | 0.083% |
© 2019 by the authors. Licensee MDPI, Basel, Switzerland. This article is an open access article distributed under the terms and conditions of the Creative Commons Attribution (CC BY) license (http://creativecommons.org/licenses/by/4.0/).
Share and Cite
MDPI and ACS Style
Shen, C.-H.; Yeah, J.-H. Long Term Stable Δ-Σ NDIR Technique Based on Temperature Compensation. Appl. Sci. 2019, 9, 309. https://doi.org/10.3390/app9020309
AMA Style
Shen C-H, Yeah J-H. Long Term Stable Δ-Σ NDIR Technique Based on Temperature Compensation. Applied Sciences. 2019; 9(2):309. https://doi.org/10.3390/app9020309
Chicago/Turabian StyleShen, Chih-Hsiung, and Jun-Hong Yeah. 2019. "Long Term Stable Δ-Σ NDIR Technique Based on Temperature Compensation" Applied Sciences 9, no. 2: 309. https://doi.org/10.3390/app9020309
Note that from the first issue of 2016, this journal uses article numbers instead of page numbers. See further details here.