Lithium Distribution in Structured Graphite Anodes Investigated by Laser-Induced Breakdown Spectroscopy


1
Institute for Applied Materials—Applied Materials Physics (IAM—AWP), Karlsruhe Institute of Technology, 76344 Eggenstein-Leopoldshafen, Germany
2
Karlsruhe Nano Micro Facility (KNMF), H.-von-Helmholtz-Pl. 1, 76344 Eggenstein-Leopoldshafen, Germany
*
Author to whom correspondence should be addressed.
Appl. Sci. 2019, 9(20), 4218; https://doi.org/10.3390/app9204218
Submission received: 31 August 2019
/
Revised: 27 September 2019
/
Accepted: 30 September 2019
/
Published: 10 October 2019
(This article belongs to the Special Issue Laser Processing and Advanced Manufacturing of Microscale Energy Storage Devices)
Abstract
:For the development of thick film graphite electrodes, a 3D battery concept is applied, which significantly improves lithium-ion diffusion kinetics, high-rate capability, and cell lifetime and reduces mechanical tensions. Our current research indicates that 3D architectures of anode materials can prevent cells from capacity fading at high C-rates and improve cell lifespan. For the further research and development of 3D battery concepts, it is important to scientifically understand the influence of laser-generated 3D anode architectures on lithium distribution during charging and discharging at elevated C-rates. Laser-induced breakdown spectroscopy (LIBS) is applied post-mortem for quantitatively studying the lithium concentration profiles within the entire structured and unstructured graphite electrodes. Space-resolved LIBS measurements revealed that less lithium-ion content could be detected in structured electrodes at delithiated state in comparison to unstructured electrodes. This result indicates that 3D architectures established on anode electrodes can accelerate the lithium-ion extraction process and reduce the formation of inactive materials during electrochemical cycling. Furthermore, LIBS measurements showed that at high C-rates, lithium-ion concentration is increased along the contour of laser-generated structures indicating enhanced lithium-ion diffusion kinetics for 3D anode materials. This result is correlated with significantly increased capacity retention. Moreover, the lithium-ion distribution profiles provide meaningful information about optimizing the electrode architecture with respect to film thickness, pitch distance, and battery usage scenario.
1. Introduction
During the last three decades, lithium-ion batteries (LIBs) have become the predominant energy storage for electric vehicles, portable devices, and secondary energy storage due to the high energy density. LIBs were developed in the 1980s and commercialized by Sony Corporation (Tokyo, Japan) based on a graphite anode and lithium cobalt oxide as the cathode in 1991. Since then, different cathode materials were proposed and developed in order to improve energy density and power density. However, to date, more than twenty years later, carbon-based materials are still used as the commercial anode material while the requirements for anode materials have been changed. In addition to demands of high capacities, the duration of the charging process plays an important role. Particularly in mobile applications, the ratio of battery charging time to its operation range has become a deciding factor for customers [1]. The supply of electrical charging power, as well as the technical realization of suitable charging interfaces for so-called high power charging (HPC), is essential and requires further scientific investigations, engineering, and investment costs in the near future. One promising new technical approach is based on the so-called 3D battery concept [2,3]. The surface morphology of electrodes or active materials in a 3D battery is realized by laser printing [4,5], chemical etching [6], chemical vapor deposition [7], physical vapor deposition [8], or micromachining [2] techniques. Pfleging et al. [9,10,11] demonstrated the industrially capable ultrafast laser material processing for the generation of 3D electrode architectures. Three-dimensional architectures increase the active surface area, shorten the diffusion pathway, and the charge carriers can be inserted deeper into the electrode material within a shorter time. As a result, the high-rate capability and cell lifespan could be significantly improved. In recent research, the impact of 3D electrode architectures and cell degradation processes on the lithium distribution were studied. For this purpose, laser-induced breakdown spectroscopy (LIBS) was applied post mortem for the visualization of elemental distribution. The quantitative analysis and mapping of the lithium concentration in cathode materials were successfully realized. Local lithium plating which resulted in spontaneous cell failure could be demonstrated by LIBS [12,13,14].
In this work, thick graphite electrodes with line structures were fabricated by ultrafast laser processing. The electrochemical properties of cells with unstructured and structured electrodes were analyzed by means of galvanostatic testing and cyclic voltammetry. Furthermore, cells were cycled using low and high C-rate, C/20, and 1C, respectively, at lithiated and delithiated states for LIBS measurements. Studying capacity fading as a function of the C-rate is an important measure in order to characterize LIB performances, which is a quite common procedure in battery research. Furthermore, high C-rates correspond to high-power LIB operation. LIBS is illustrated to be a suitable tool to achieve fundamental information about degradation mechanisms or diffusion kinetics as a function of the C-rate. In addition, model electrodes with micro-pillar structures were prepared for the visualization of the local lithium concentration along 3D micro-structured electrodes. The LIBS results provide a fundamental understanding of the lithium diffusion process during 3D battery operation.
2. Materials and Methods
2.1. Preparation of Electrode Material
Graphite electrodes with a thickness of about 100 µm, which are beyond the state of the art for standard electrodes (thickness ~50 µm), were fabricated for electrochemical measurements and subsequent LIBS. As binder material, 10 wt% Polyvinylidene fluoride (PVDF, MTI corporation, USA) was used and mixed with 85 wt% graphite particles as the active material (Targray, Technology International Inc., Kirkland, QC, Canada) in N-Methyl-2-pyrrolidone (NMP) solvent. To improve electric conductivity, 5 wt% carbon black (Timcal Super C65, MTI Corporation, Richmond, CA, USA) was added into the solution. The mixing process was realized by applying a high-speed centrifugal mixer (Hauschild Engineering, Hamm, Germany). The prepared slurry was coated on the current collector by tape casting. Afterwards, the electrode was dried at 60 °C for 2.5 h. Eventually, the calendered graphite electrodes had a mass loading of 10.1 ± 0.12 mg/cm2 and a film thickness of 100 ± 2 µm.
2.2. Ultrafast Laser Processing
The used ultrafast fiber laser source (Tangerine, Amplitude Systèmes, Paris, France) operated at a wavelength of 1030 nm with a laser pulse duration of 380 fs and a laser repetition rate of 200 kHz. Line structures with a period of 200 μm were generated by applying a laser fluence of 1.79 J/cm2 and a scanning speed of 500 mm/s. For the local investigation of lithium distribution, micro-pillars with a dimension of 600 µm × 600 µm were designed and fabricated on the electrodes. For selective ablation of graphite, a higher laser fluence of 2.8 J/cm2 and a lower scanning speed of 100 mm/s were applied. The laser processing was repeated until the graphite material was ablated layer by layer down to the metallic current collector. To evaluate the laser structuring process, the structured electrodes were investigated by scanning electron microscopy (SEM; XL30S-FEG, Philips GmbH, Hamburg, Germany).
2.3. Electrochemical Analysis
Half cells with CR2032-type coin cell design were assembled in an argon-filled glovebox using lithium (Li) as the counter electrode, graphite as the working electrode, and a polyethylene separator with a thickness of 25 µm (Celgard, USA). Commercial electrolyte LP30 (1 M LiPF6 in ethylene carbonate (EC) to dimethyl carbonate (DMC) (1:1, v/v), BASF, Germany) was used. Prior to cell assembly, the electrodes were dried in a vacuum oven at 130 °C for 24 h and soaked in the electrolyte for 30 min. Electrochemical measurements were performed at 23 °C by using a BT2000 battery cycler (Arbin Instruments, College Station, TX, USA). The formation step was performed at C/20 for three cycles applying the constant current (CC)–constant voltage (CV) cycling procedure in the range of 0.01–1 V. Cells with structured and unstructured electrodes were assembled, which are denoted as LS cells and reference cells, respectively, in this work. Both types of cells were cycled under the same testing procedure, which is described in Table 1 in detail. Constant voltage was applied for 10 min after the last cycling procedure, in order to reduce the cell polarization effect. Finally, as-prepared cells were instantly disassembled and were cleaned in fresh DMC for 30 min. This washing process was repeated twice. It was assumed that no lithium from residual electrolyte salt contaminated the electrode surface.
2.4. Laser-Induced Breakdown Spectroscopy (LIBS)
Laser-induced breakdown spectroscopy was applied for the detection and analysis of the lithium element on the graphite anodes. The laser source was focused on the graphite electrode surface and electrode materials were ablated and excited. During the ablation process, plasma was generated and emitted the element-specific spectrum. In this work, a LIBS system (type: FiberLIBS, SN013 Secopta GmbH, Teltow, Germany), a nanosecond Nd:YAG laser (laser wavelength 1064 nm, laser pulse duration 1.5 ns, repetition rate 100 Hz), a Czerny–Turner spectrometer, and two charge-coupled device (CCD) detectors were applied for element mapping and depth profiling. For generating laser-induced plasma, a laser focus diameter of about 100 µm was generated by applying a focusing lens with a focal length of 75 mm [12]. The detectors are enabled to cover spectra in ranges of 229–498 nm and 569–792 nm. For the quantitative detection of lithium, a calibration procedure had to be performed which is described in more detail in [13]. Due to the spot size of the laser beam, the horizontal resolution of element mapping is limited to 100 µm.
3. Results and Discussion
3.1. Generation of Line Structures and Micro Freestanding Pillars
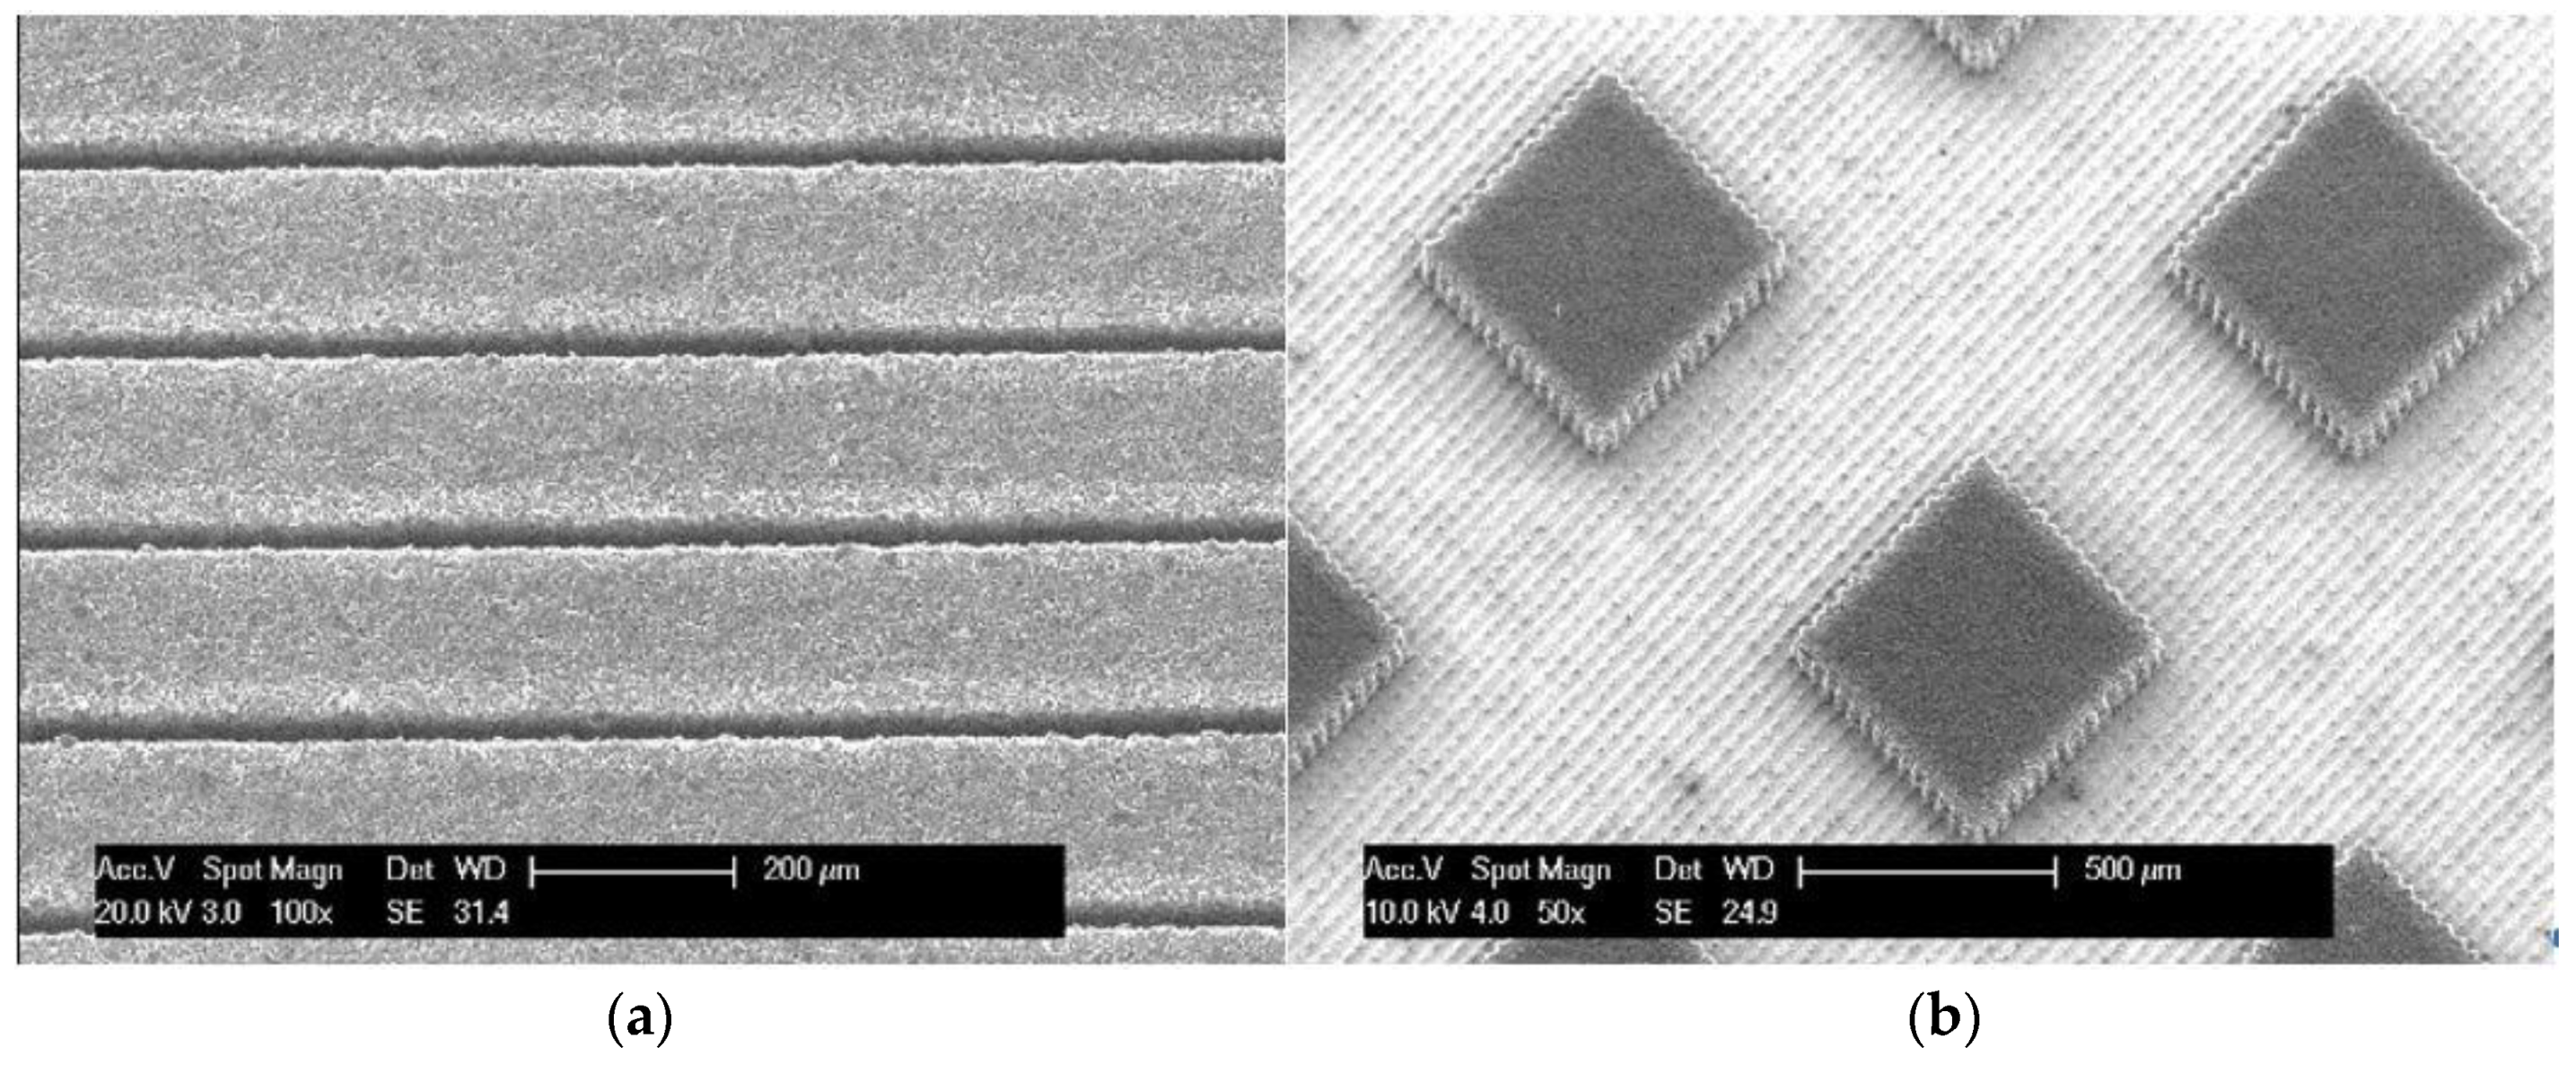
Line structures with a pitch distance of 200 µm were generated for electrochemical measurements and subsequent LIBS measurements. A precise ablation without significant heat impact into the material was realized by applying ultrafast laser ablation. The width of the channels can be reduced to ~15 µm (Figure 1a). For studying the impact of diffusion kinetics and degradation processes, freestanding electrode pillars with a dimension of 600 µm × 600 µm and with a pitch distance of 600 µm were realized (Figure 1b).
3.2. Electrochemical Characterization
The galvanostatic measurements were performed on cells with structured (LS-200 µm) and unstructured (reference) electrodes by applying increasing C-rates as basic information for LIBS measurements.
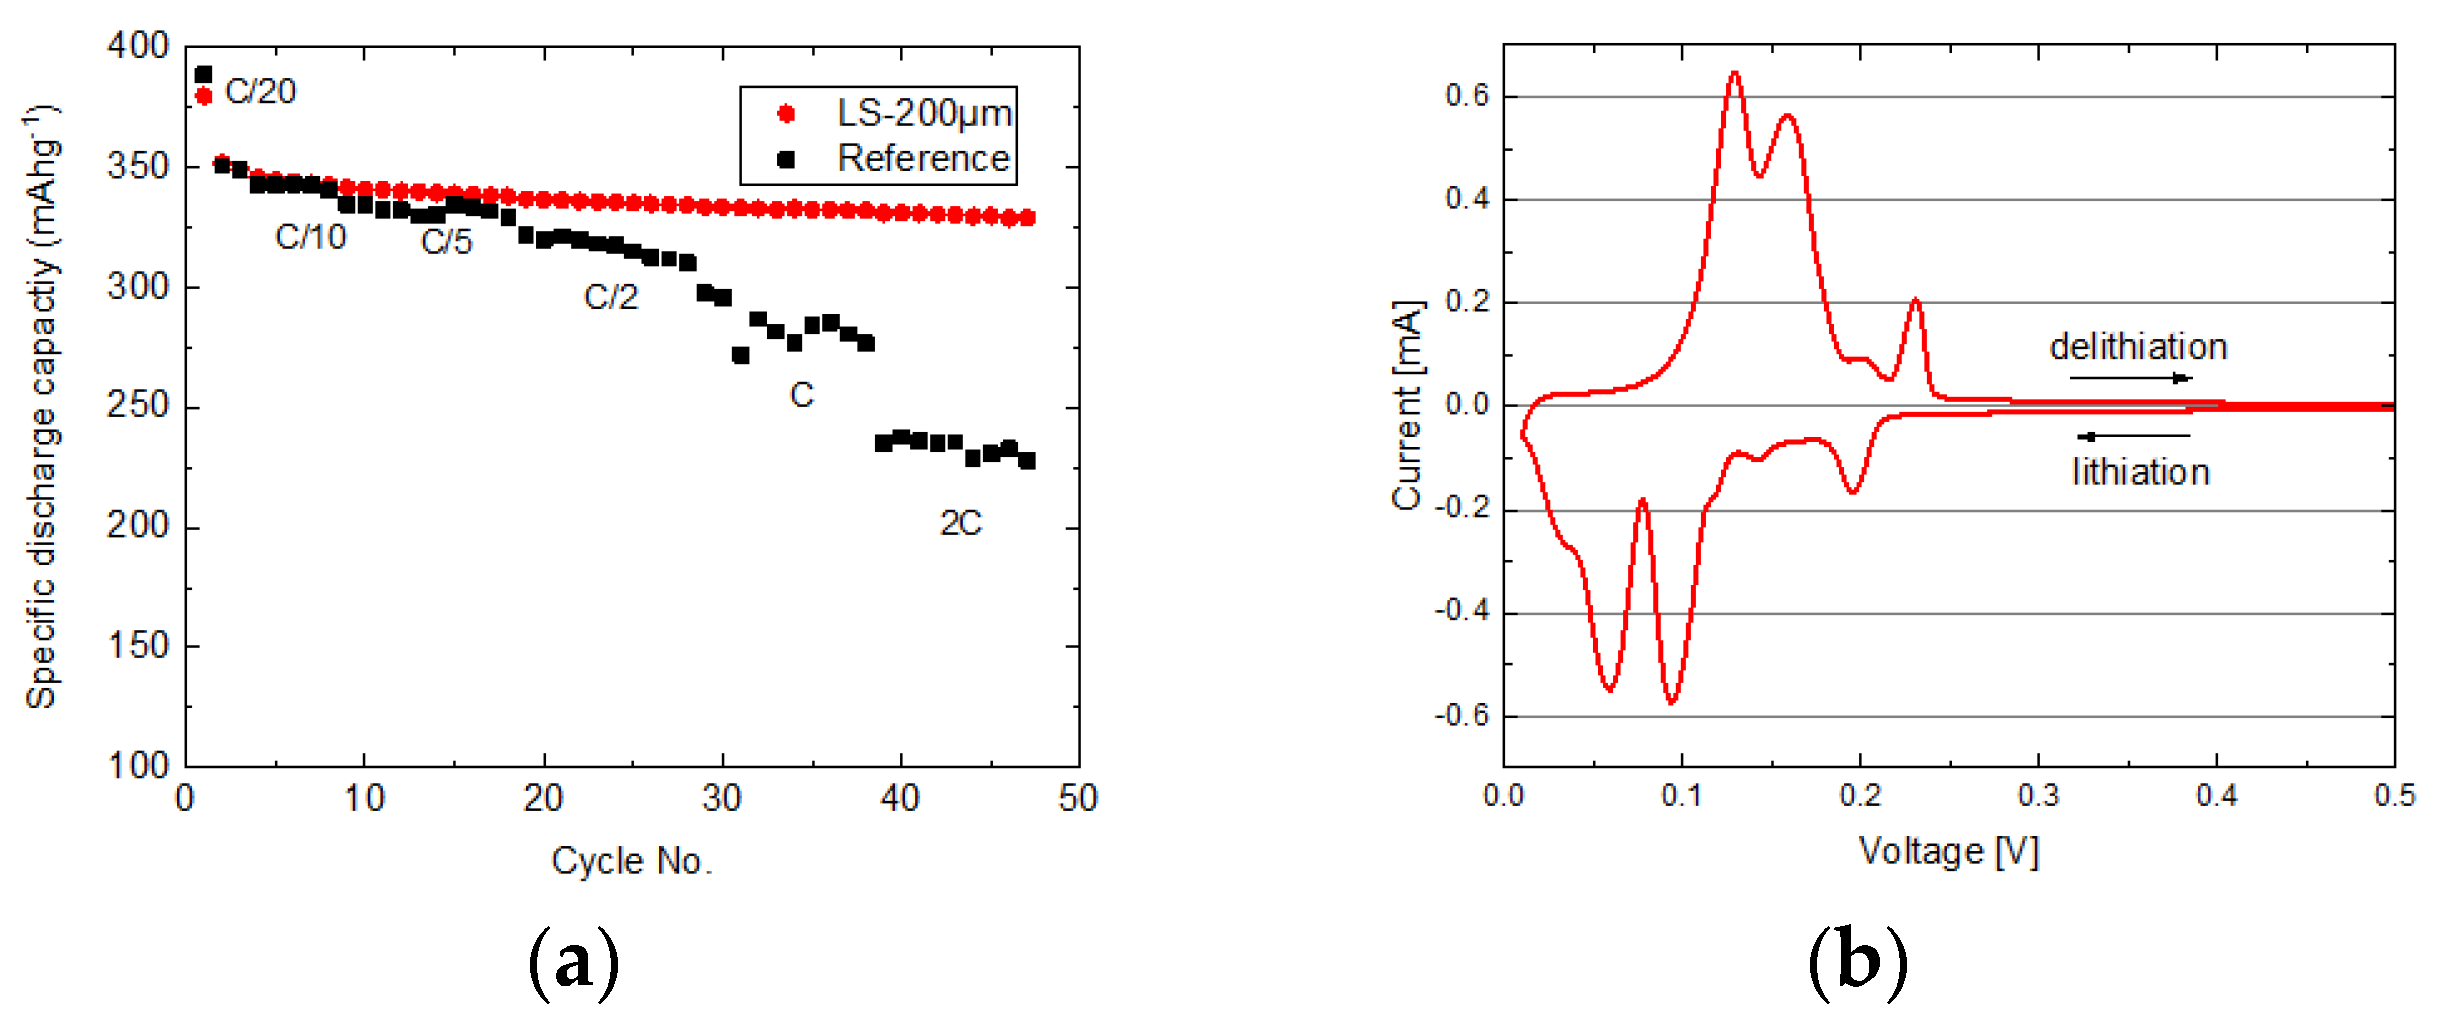
Figure 2a revealed that both types of cells provide a similar specific capacity close to the theoretic capacity of graphite during the formation step (first three cycles). It is obvious that the capacity of the reference cell dropped with increased cycle numbers at 1 C. The specific discharge capacity of the cell with unstructured electrodes (reference cell) is significantly reduced during cycles. In comparison to the reference cells, the cells with line structures (LS-200 µm) exhibited an excellent high-rate capability. For the thick electrodes, the diffusion pathway of lithium ions is limited. The lithium ions could be trapped within the graphite electrodes at a high C-rate and become inactive for the following cycles. It could be attributed to the capacity fading at a high C-rate. In [15,16] it is reported that the high-rate capability depends on the lithium-ion diffusion kinetic, which is influenced by the electrode thickness and electrode design. An increased active interface between the electrode and liquid electrolyte by means of 3D electrode architectures can reduce the cell polarization and the overall impedance. In addition, cyclic voltammetry measurement was carried out with a scan rate of 10 µVs−1 (Figure 2b). The result is in good agreement with [17].
3.3. Analysis of Lithium Distribution
3.3.1. Calibration of LIBS Spectrum
For the quantitative analysis of LIBS spectra, a calibration procedure is necessary. The detected Li peak intensity in LIBS correlates with the real lithium amount [18]. According to the data from cyclic voltammetry measurement in Figure 2b, the lithium intercalation process takes place below 0.3 V. Therefore, voltages of 0.01, 0.05, 0.06, 0.085, 0.1, 0.11, 0.15, 0.19, and 0.3 V were chosen for electrochemical titration. Graphite electrodes with the same constitution were assembled and lithiated to the above-mentioned state of charge (SoC). After disassembly of these cells, half of the electrode was analyzed by inductively coupled plasma–optical emission spectrometry (ICP-OES), which enables to determine the quantitative amounts of elements in the electrode. Figure 3 demonstrates the titration curve of the ratio of lithium to carbon measured by ICP-OES at a chosen SoC. At 0.01 V, the graphite electrodes were completely lithiated, and the maximal ratio of amount of substance Lithium compared to carbon (nLi/nC) was 0.14. For the delithiated sample, the ratio was 0.035. The detected lithium amount is attributed to the formation of solid-electrolyte interphase (SEI).
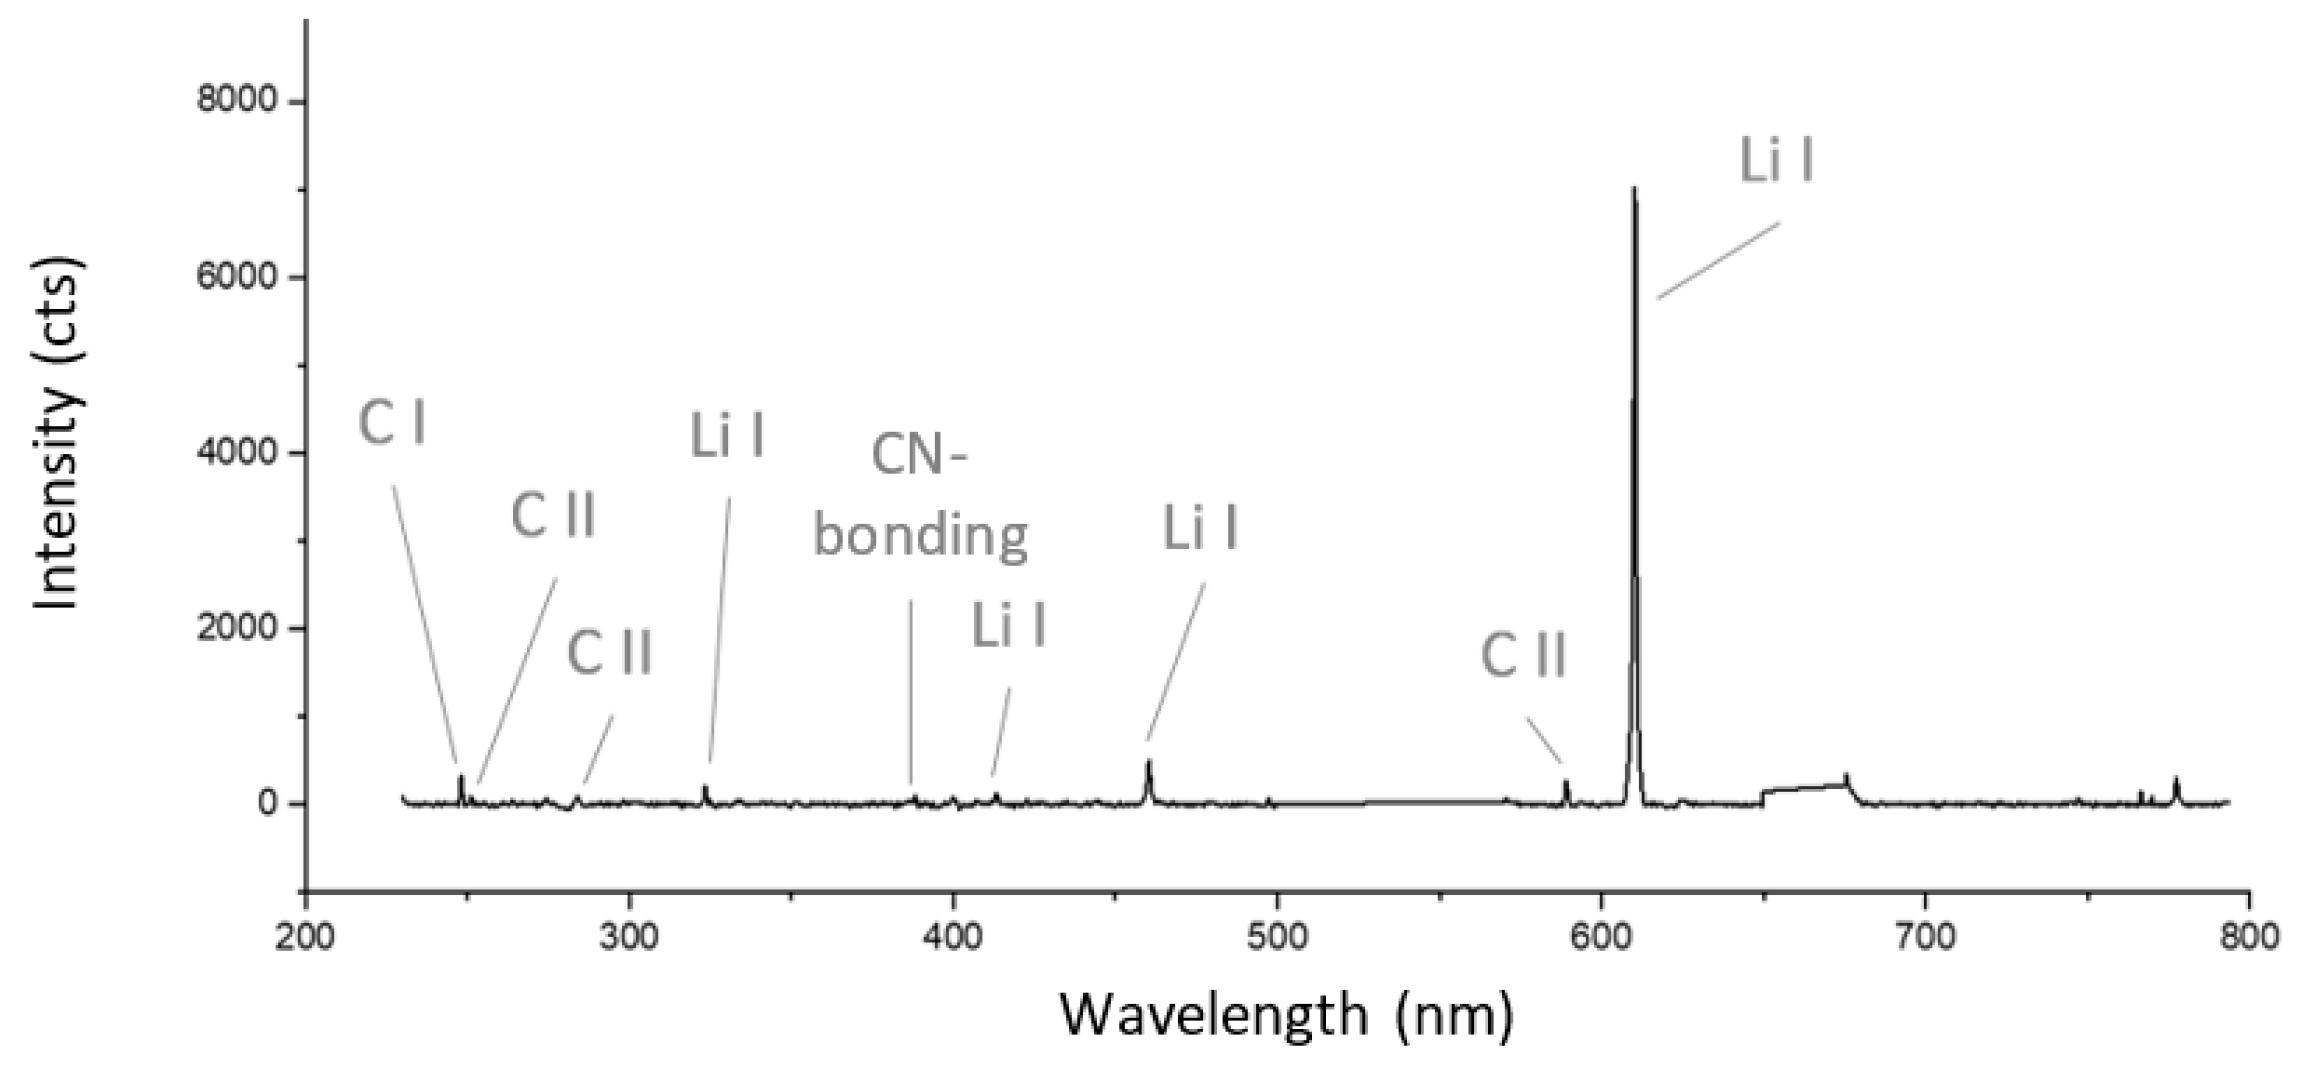
The other halfs of the electrodes were as prepared for LIBS measurements. Nine laser spots were irradiated in the center of the electrode with a distance of 0.5 mm six times. The measured spectra were analyzed by using a data filter for the generation of the calibration associated with the measured element concentration obtained by ICP-OES. Figure 4 exhibits a typical LIBS-spectrum detected after one laser pulse on a lithiated graphite electrode using filters such as Savitzky–Golay smoothing [12]. The representative peaks of carbon, lithium, and CN-bonding are labeled in the diagram. The representative wavelength of the element is extracted from the National Institute of Standards and Technology (NIST) database [19].
3.3.2. Lithium Distribution within Structured and Unstructured Electrodes
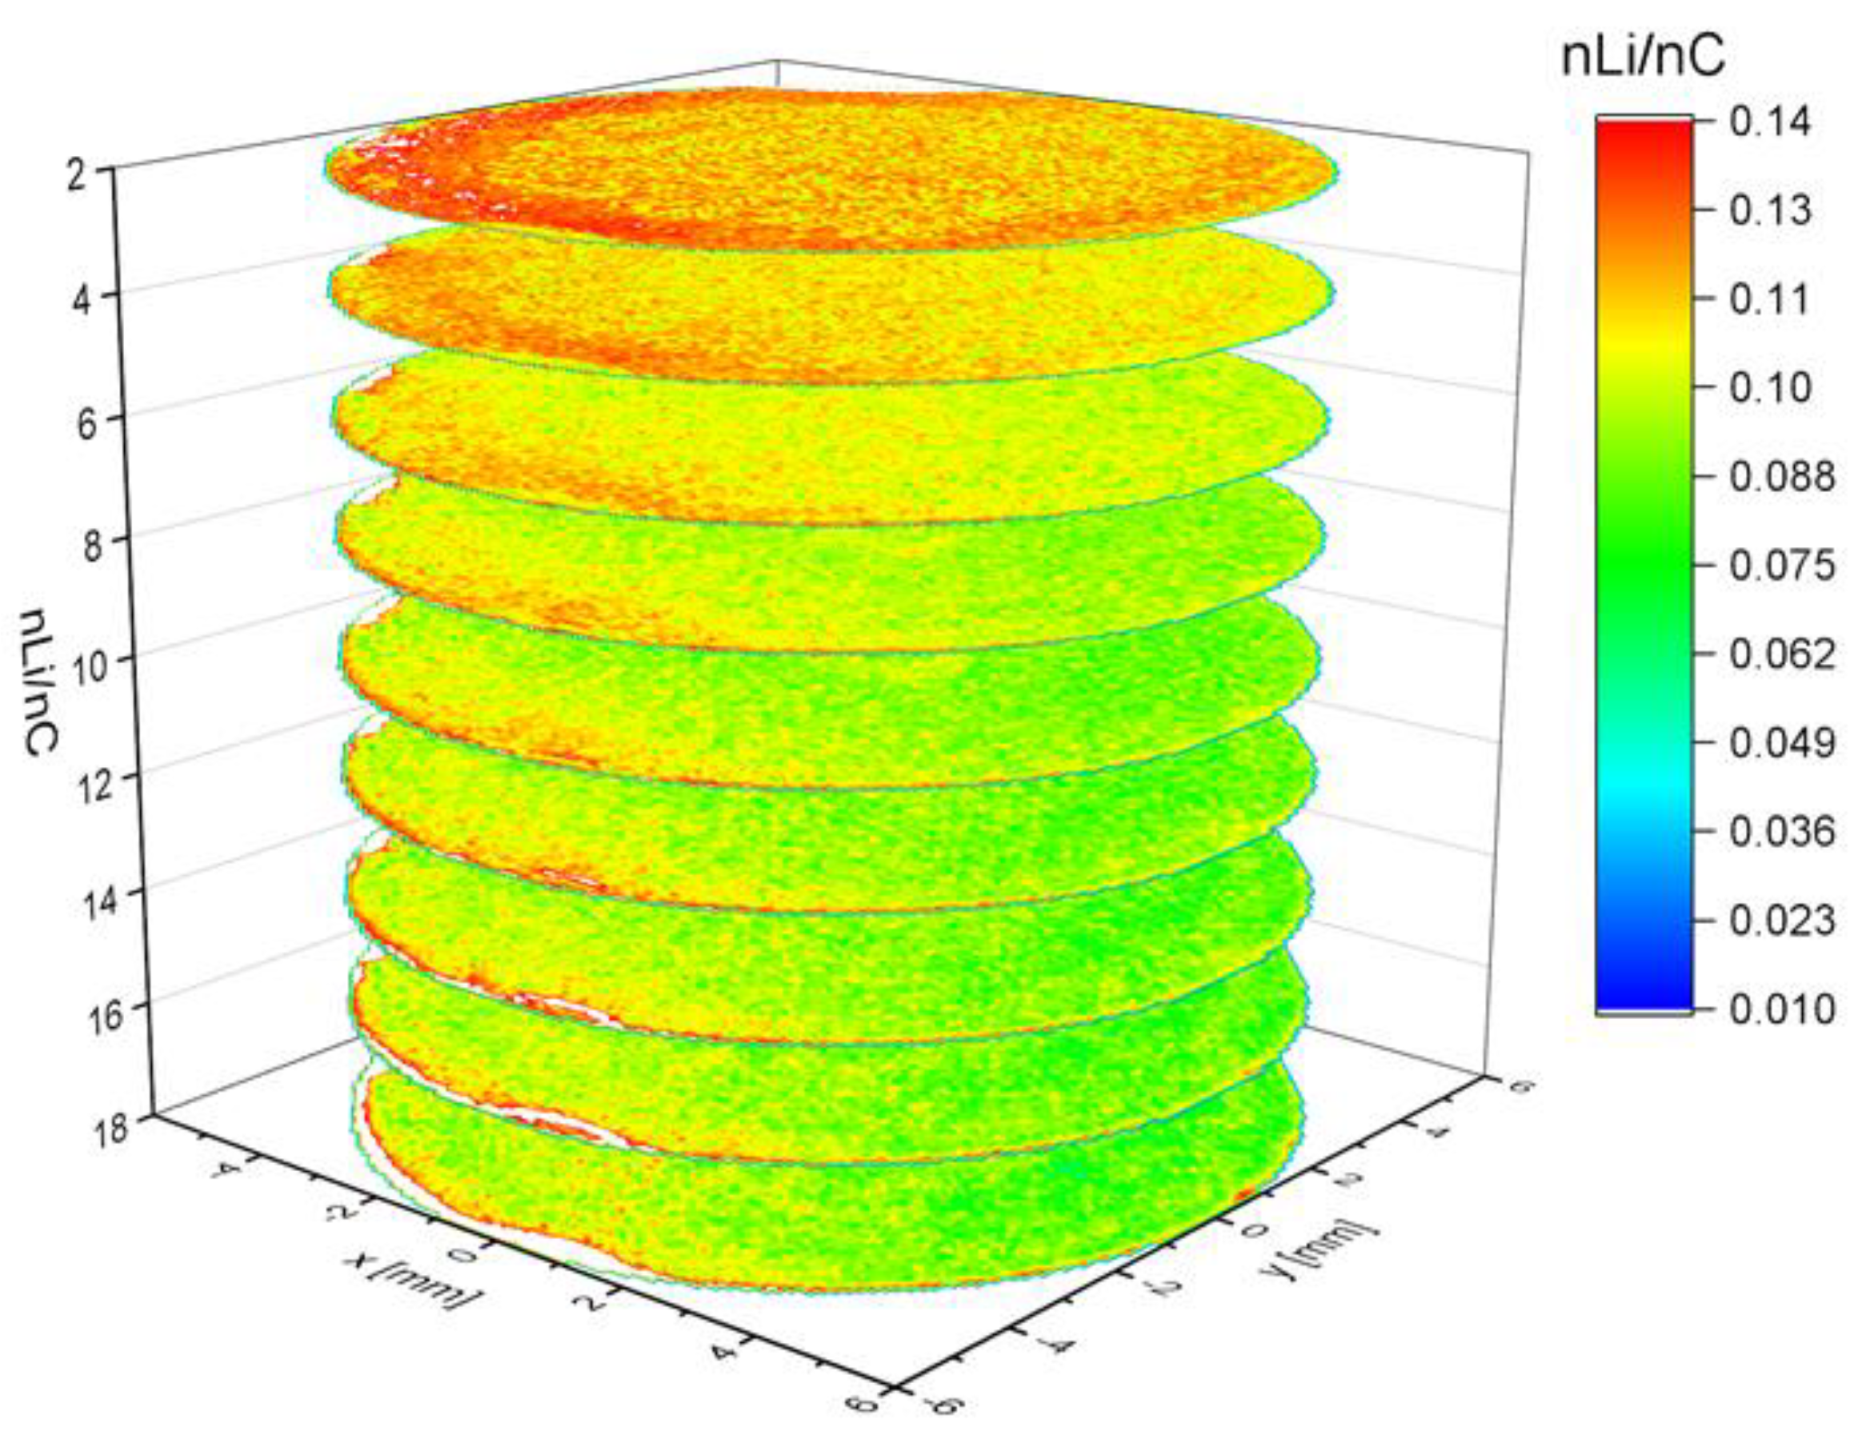
The galvanostatic measurements show that cells with the structured and unstructured electrode can deliver a similar capacity at the formation step applying a low C-rate (C/20). In this case, sufficient time is available for lithium insertion deep into the graphite layers, and the cells can reach their maximal specific capacity around 340 mAhg−1 independent of lithium-ion diffusion length and electrode architectures. Figure 5 presents the 3D lithium concentration from the top of the electrode down to the current collector layer by layer. During the LIBS measurements, the laser beam was scanned over the electrode surface with a pulse shift of 100 µm. The ablation rate is ~6.4 µm per layer on average which depends on the local porosity and lithium amount in the electrode. The 3D mapping indicates that the first and second layer contain more lithium in comparison to the other layers. In general, a homogeneous lithium concentration can be determined within the entire unstructured electrode.
The positive influence of 3D architectures on the electrochemical performance could be successfully demonstrated by rate capability tests. Model electrodes with micro-pillar structures were fabricated for the visualization of local lithium distribution at high C-rate. Regarding the result in Figure 2a, significant capacity fading is observed at 1 C. For this propose, the model cells were lithiated at 1 C applying the cycling procedure in Table 1. Three-dimensional mapping was performed on the entire electrodes. Figure 6 presents the lithium concentration on layers 2, 6, and 12, respectively. The first layer was neglected due to surface contamination. Homogenous lithium concentration could be visualized along the first layer (layer 2) which is close to the separator. The lithium concentration in the micro-pillars is reduced from the top of the electrode down to the current collector. Long diffusion pathways for lithium-ion restrict the lithiation process. In layer 12, no lithium element could be detected in the center of some micro-pillars. Using high C- rates, lithium-ions accumulate on the interface between the electrode and electrolyte, which results in high cell polarization. A complete lithiation process takes place during the “constant voltage” step as a matter of fact, which can be determined by galvanostatic measurements.
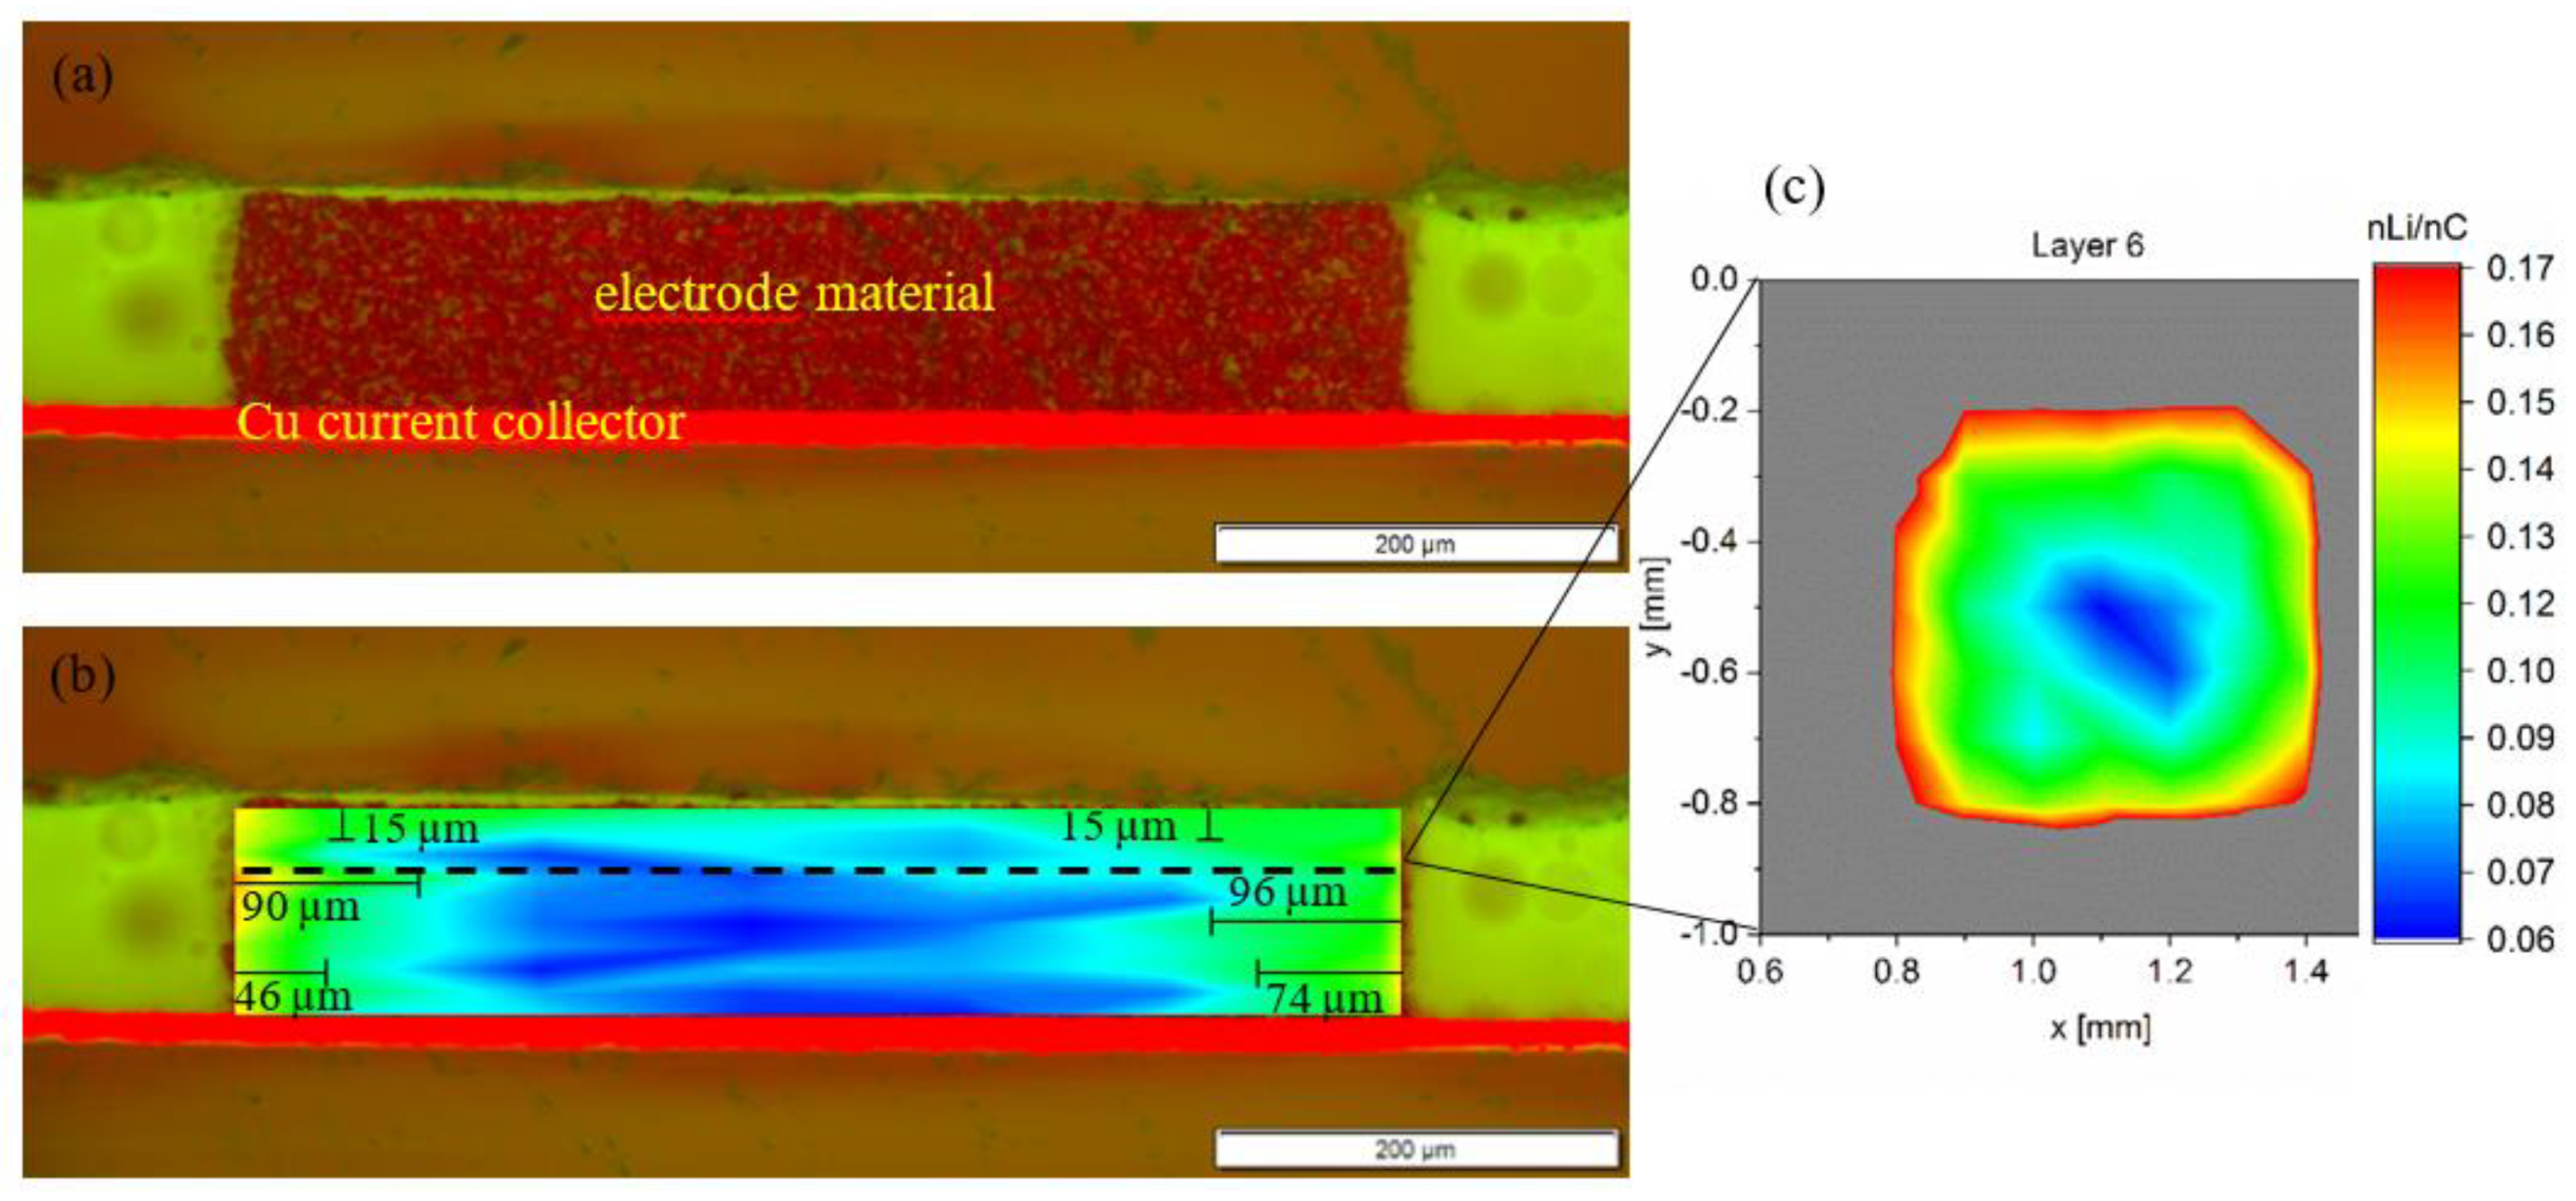
The visualization of the local lithium concentration in one micro-pillar is presented in Figure 7. It is obvious that the lithium concentration is increased along the contour of the structure. The ratio of nLi to nC at the fully lithiated state was 1.46 abstracted from Figure 3. The color illustration in Figure 7 indicates that the lithiated depth along the sidewall was in the range of 50–80 µm. Lithium-ions prefer to diffuse directly from the electrolyte into bulk material through the laser-generated sidewall. The obtained Li-concentration depth profile is crucial information for electrode design regarding C-rate, pitch distance, and demands of the application. In addition, the Li concentration dropped dramatically in the direction to the current collector. The volume expansion of the graphite material is about 10% [20]. However, mechanical pressure on the electrode surface played a non-negligible role in the intercalation process. Additionally, the compressive load on the separator due to the coin cell design reduced its initial porosity and restricted the lithium-ion transport [14,21].
Moreover, laser-generated line structures could not only promote the lithium-ion insertion but also accelerate Li extraction from the bulk material. Artificial pathways on the electrode reduced efficiently the tortuosity for lithium-ion transport. A lower amount of lithium within the entire structured electrode delithiated by 1 C could be detected in comparison to the unstructured electrode by LIBS measurements (not shown here). For the unstructured electrode, only a part of lithium-ions close to the separator side could be extracted from the anode. Trapped lithium-ions become electrochemically inactive and do not attend the next cycling steps. In this work, it is determined that the increasing amount of inactive lithium causes capacity fading at high C-rates. Laser-generated new pathways could improve the lithium-ion diffusion ability and reduce the lithium-ion tortuosity within thick film anodes.
4. Conclusions
In this work, thick graphite composite electrodes were fabricated. Subsequently, line structures with a pitch distance of 200 µm and micro-pillar structures on the electrodes were realized by ultrafast laser ablation. Results from galvanostatic measurements indicated that cells with anodes having 200 µm line structures can deliver improved high-rate capability. This improvement is associated with an increased electrochemical reactivity as well as an improved lithium-ion diffusion kinetic by means of laser-generated new diffusion pathways. Post-mortem analysis by LIBS revealed that the laser-generated additional free space in electrodes can accelerate the delithiation process and reduce the number of trapped lithium-ions during cycling at high C-rate. Furthermore, LIBS analysis was performed on micro-pillar anode structures that visualized for the first time the lithium elemental mapping and the diffusion depth along the contour of 3D electrode structures. LIBS is a suitable technique for the analysis of element distribution caused by 3D electrode-related diffusion kinetics and general degradation mechanisms in LIBs.
Author Contributions
Investigation, L.P.; Supervision, H.J.S. and W.P.; Writing—original draft, Y.Z.; Writing—review & editing, W.P.
Funding
This research was funded by German Research Foundation (DFG), project No. 392322200.
Acknowledgments
We are grateful to Chantal Rietdorf for the technical assistance and battery measurements. This project has received funding from the German Research Foundation (DFG, Project No. 392322200) and the National Natural Science Foundation of China (NSFC, project No. 51761135129). We acknowledge the support by the KIT-Publication Fund of the Karlsruhe Institute of Technology. In addition, the support for laser materials processing by the Karlsruhe Nano Micro Facility (KNMF, http://www.knmf.kit.edu/), a Helmholtz research infrastructure at KIT, is gratefully acknowledged.
Conflicts of Interest
The authors declare no conflict of interest.
References
- Zeyen, M. High Power Charging: Schnell, schneller, am schnellsten? eMobil J. Die Fachz. für Smart Mobil. 2018, 30–35. [Google Scholar]
- Long, J.W.; Dunn, B.; Rolison, D.R.; White, H.S. Three-Dimensional Battery Architectures. Chem. Rev. 2004, 104, 4463–4492. [Google Scholar] [CrossRef] [PubMed]
- Roberts, M.; Johns, P.; Owen, J.; Brandell, D.; Edstrom, K.; El Enany, G.; Guery, C.; Golodnitsky, D.; Lacey, M.; Lecoeur, C.; et al. 3D lithium ion batteries—From fundamentals to fabrication. J. Mater. Chem. 2011, 21, 9876. [Google Scholar] [CrossRef]
- Li, J.; Daniel, C.; Wood, D. Materials processing for lithium-ion batteries. J. Power Sources 2011, 196, 2452–2460. [Google Scholar] [CrossRef]
- Kim, H.; Auyeung, R.C.Y.; Piqué, A. Laser-printed thick-film electrodes for solid-state rechargeable Li-ion microbatteries. J. Power Sources 2007, 165, 413–419. [Google Scholar] [CrossRef]
- Zhao, Y.; Liu, X.; Li, H.; Zhai, T.; Zhou, H. Hierarchical micro/nano porous silicon Li-ion battery anodes. Chem. Commun. (Camb.) 2012, 48, 5079–5081. [Google Scholar] [CrossRef] [PubMed]
- Xie, J.; Oudenhoven, J.F.M.; Li, D.; Chen, C.; Eichel, R.-A.; Notten, P.H.L. High Power and High Capacity 3D-Structured TiO 2 Electrodes for Lithium-Ion Microbatteries. J. Electrochem. Soc. 2016, 163, A2385–A2389. [Google Scholar] [CrossRef]
- Fleischauer, M.D.; Li, J.; Brett, M.J. Columnar Thin Films for Three-Dimensional Microbatteries. Electrochim. Acta 2009, 156, A33. [Google Scholar] [CrossRef]
- Pfleging, W. A review of laser electrode processing for development and manufacturing of lithium-ion batteries. Nanophotonics 2018, 7, 549–573. [Google Scholar] [CrossRef]
- Pfleging, W.; Pröll, J. A new approach for rapid electrolyte wetting in tape cast electrodes for lithium-ion batteries. J. Mater. Chem. A 2014, 2, 14918–14926. [Google Scholar] [CrossRef]
- Proell, J. 3D Structures in Battery Materials. JLMN 2012, 7, 97–104. [Google Scholar] [CrossRef]
- Smyrek, P.; Bergfeldt, T.; Seifert, H.J.; Pfleging, W. Laser-induced breakdown spectroscopy for the quantitative measurement of lithium concentration profiles in structured and unstructured electrodes. J. Mater. Chem. A 2019, 7, 5656–5665. [Google Scholar] [CrossRef] [Green Version]
- Smyrek, P.; Pröll, J.; Seifert, H.J.; Pfleging, W. Laser-Induced Breakdown Spectroscopy of Laser-Structured Li(NiMnCo)O 2 Electrodes for Lithium-Ion Batteries. J. Electrochem. Soc. 2016, 163, A19–A26. [Google Scholar] [CrossRef]
- Cannarella, J.; Arnold, C.B. Ion transport restriction in mechanically strained separator membranes. J. Power Sources 2013, 226, 149–155. [Google Scholar] [CrossRef]
- Zheng, Y.; Seifert, H.J.; Shi, H.; Zhang, Y.; Kübel, C.; Pfleging, W. 3D silicon/graphite composite electrodes for high-energy lithium-ion batteries. Electrochim. Acta 2019, 317, 502–508. [Google Scholar] [CrossRef]
- Zheng, Y.; Seifert, H.J.; Smyrek, P.; Pfleging, W. Development of Laser Structured Silicon-based Anodes for Lithium-ion Batteries. In Proceedings of the 2018 IEEE International Conference on Manipulation, Manufacturing and Measurement on the Nanoscale (3M-NANO), Hangzhou, China, 13–17 August 2018; pp. 6–9, ISBN 978-1-5386-6214-4. [Google Scholar]
- Levi, M.D.; Aurbach, D. The mechanism of lithium intercalation in graphite film electrodes in aprotic media. Part 1. High resolution slow scan rate cyclic voltammetric studies and modeling. J. Electroanal. Chem. 1997, 421, 79–88. [Google Scholar] [CrossRef]
- Müller, M. Neue Wege zur Quantifizierung mit der Laserinduzierten Plasmaspektroskopie (LIBS). Dissertation, Bundesanstalt für Materialforschung und -prüfung (BAM), Berlin, Germany, 2010. [Google Scholar]
- Kramida, A.; Ralchenko, Y.; Reader, J.; NIST ASD Team. NIST Atomic Spectra Database, NIST Standard Reference Database 78; National Institute of Standards and Technology: Gaithersburg, MD, USA, 2019. [Google Scholar] [CrossRef]
- Obrovac, M.N.; Chevrier, V.L. Alloy negative electrodes for Li-ion batteries. Chem. Rev. 2014, 114, 11444–11502. [Google Scholar] [CrossRef] [PubMed]
- Gor, G.Y.; Cannarella, J.; Prévost, J.H.; Arnold, C.B. A Model for the Behavior of Battery Separators in Compression at Different Strain/Charge Rates. J. Electrochem. Soc. 2014, 161, F3065–F3071. [Google Scholar] [CrossRef] [Green Version]
Figure 1.
Scanning electron microscopy (SEM) images of laser-generated structures with a period of (a) 200 µm and (b) micro pillars with a dimension of 600 µm × 600 µm.
Figure 1.
Scanning electron microscopy (SEM) images of laser-generated structures with a period of (a) 200 µm and (b) micro pillars with a dimension of 600 µm × 600 µm.

Figure 2.
(a) Specific discharge capacity of cells with structured (LS-200µm) and unstructured (reference) electrodes as a function of cycle number; (b) cyclic voltammetry curve of the cell with an unstructured graphite electrode.
Figure 2.
(a) Specific discharge capacity of cells with structured (LS-200µm) and unstructured (reference) electrodes as a function of cycle number; (b) cyclic voltammetry curve of the cell with an unstructured graphite electrode.

Figure 3.
Quantitative ratio of lithium to carbon content measured by inductively coupled plasma–optical emission spectrometry (ICP-OES) as a function of voltage.
Figure 3.
Quantitative ratio of lithium to carbon content measured by inductively coupled plasma–optical emission spectrometry (ICP-OES) as a function of voltage.
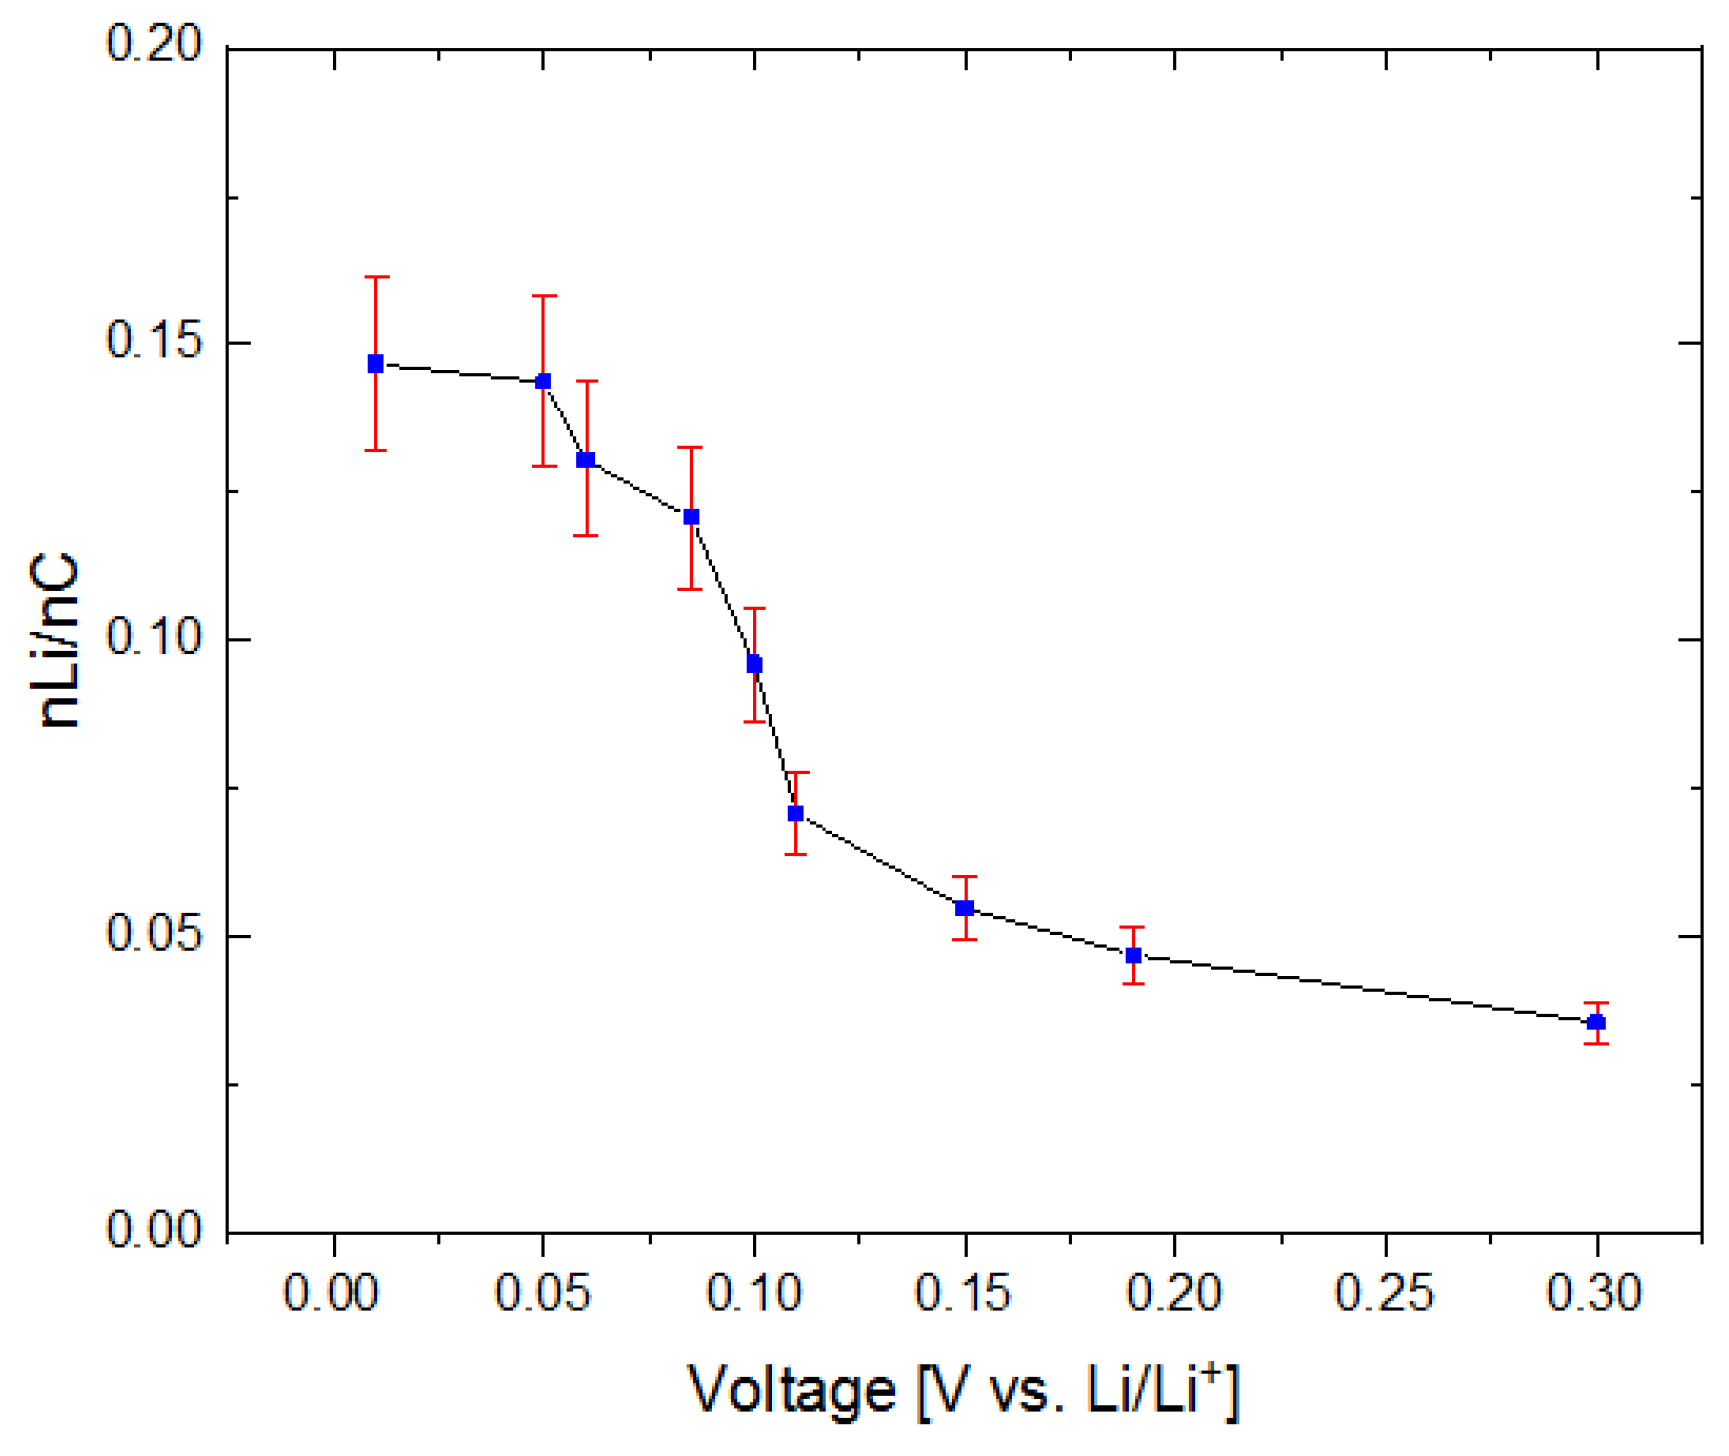
Figure 4.
Typical processed LIBS spectra from a lithiated graphite anode (0.01 V) used for the calibration procedure. Used elemental emission lines are labeled in the diagram.
Figure 4.
Typical processed LIBS spectra from a lithiated graphite anode (0.01 V) used for the calibration procedure. Used elemental emission lines are labeled in the diagram.

Figure 5.
3D illustration of lithium concentration within a full lithiated graphite electrode at 0.01 V.
Figure 5.
3D illustration of lithium concentration within a full lithiated graphite electrode at 0.01 V.

Figure 6.
Lithium concentration of a model electrode at layer 2, 6, and 12.
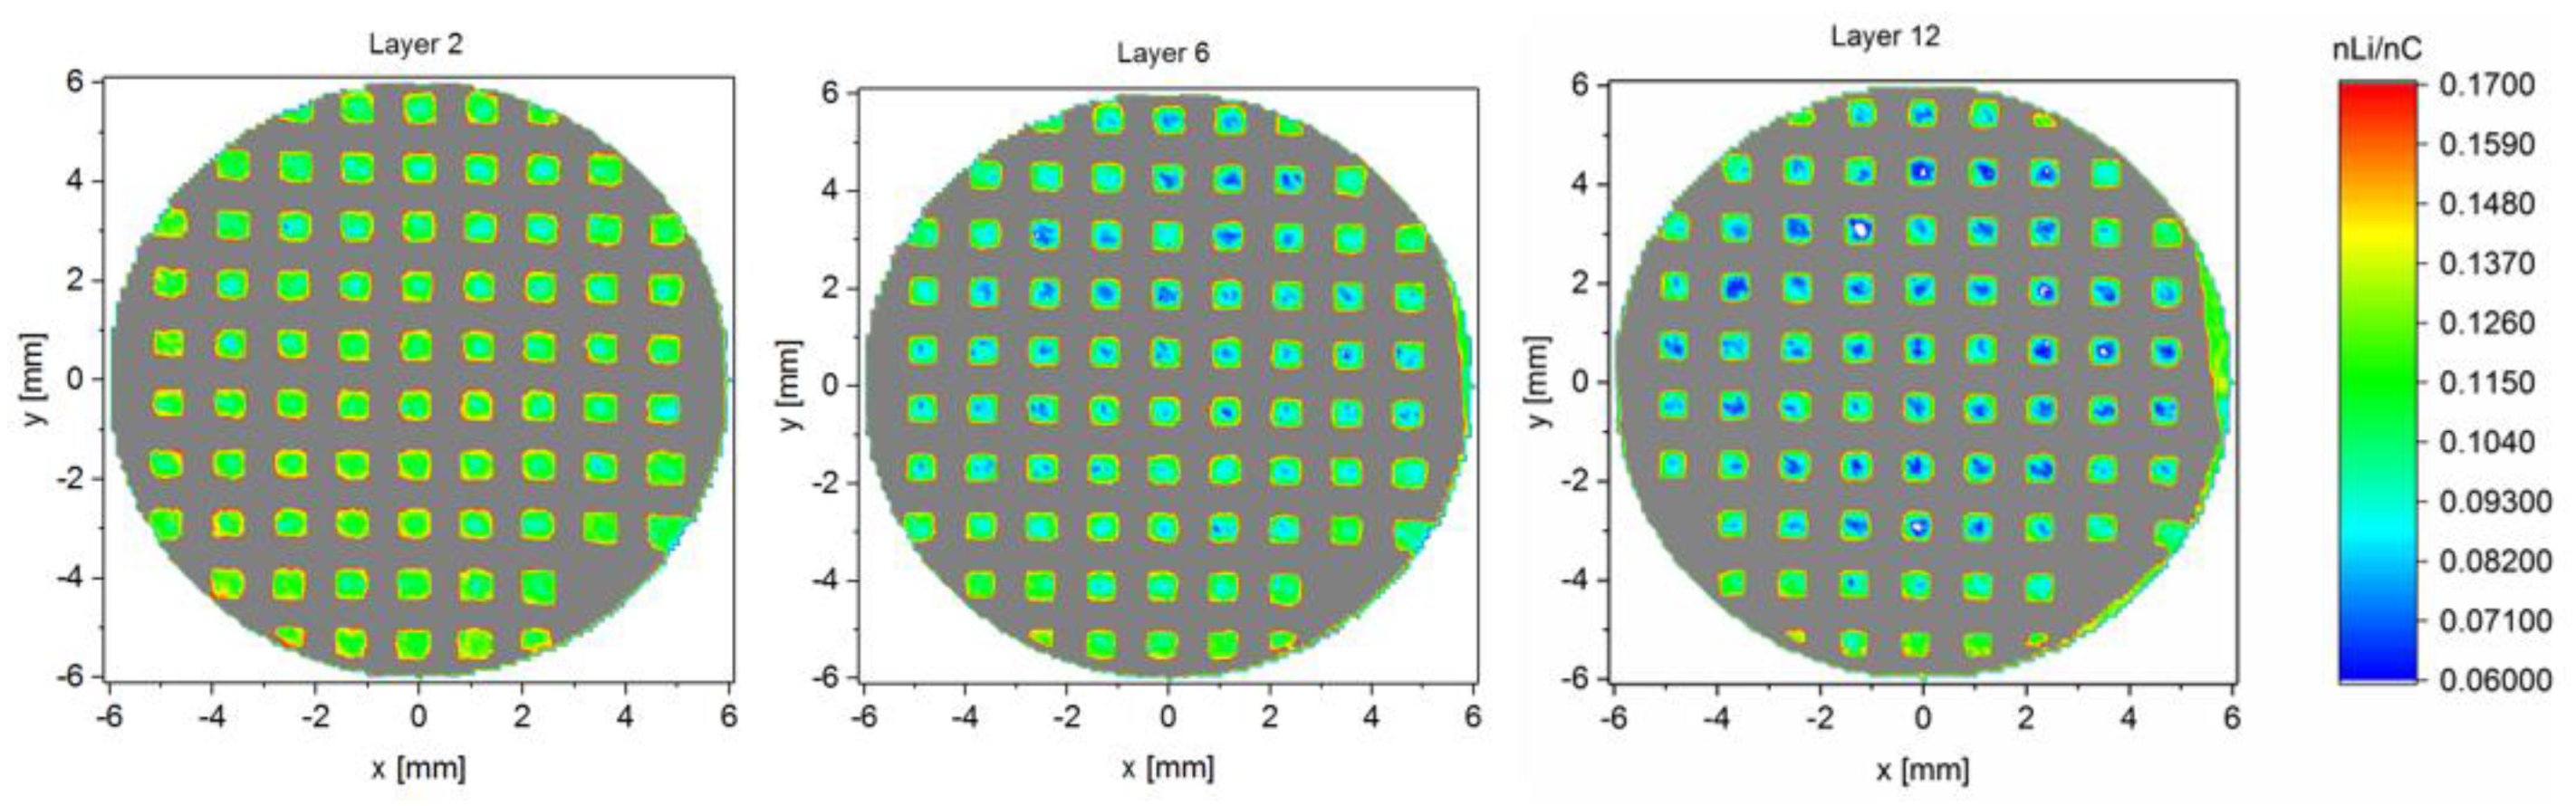
Figure 7.
(a) Original cross-section of a micro-pillar structure, (b) Li-concentration depth profile of a micro-pillar structure, and (c) cross-sectional lithium concentration at layer 6. The electrode was lithiated at 0.01 V by applying 1 C.
Figure 7.
(a) Original cross-section of a micro-pillar structure, (b) Li-concentration depth profile of a micro-pillar structure, and (c) cross-sectional lithium concentration at layer 6. The electrode was lithiated at 0.01 V by applying 1 C.


Table 1.
Electrochemical measuring procedures for laser-induced breakdown spectroscopy (LIBS) measurements.
Table 1.
Electrochemical measuring procedures for laser-induced breakdown spectroscopy (LIBS) measurements.
| Cell State for LIBS Measurements | Step 1 Formation | Step 2 | Step 3 | Step 4 | Step 5 before Cell Disassembly |
|---|---|---|---|---|---|
| Lithiated state at 0.01 V (C/20) | Charging/Discharging*: C/20 Cycles: 3 | - | - | - | Discharging: C/20, CV at 0.01 V for 10 min |
| Lithiated state at 0.01 V (1C) | Charging/Discharging*: 1C Cycles: 3 | Charging/Discharging*: C/5 Cycles: 1 | Charging/Discharging*: 1C Cycles: 1 | Discharging: 1C, CV at 0.01 V for 10 min | |
| Delithiated state at 1 V (1C) | Charging/Discharging*: 1C Cycles: 2 | CV for 10 min after last charging to 1 V |
* During discharging applying CCCV cycling procedure.
© 2019 by the authors. Licensee MDPI, Basel, Switzerland. This article is an open access article distributed under the terms and conditions of the Creative Commons Attribution (CC BY) license (http://creativecommons.org/licenses/by/4.0/).
Share and Cite
MDPI and ACS Style
Zheng, Y.; Pfäffl, L.; Seifert, H.J.; Pfleging, W. Lithium Distribution in Structured Graphite Anodes Investigated by Laser-Induced Breakdown Spectroscopy. Appl. Sci. 2019, 9, 4218. https://doi.org/10.3390/app9204218
AMA Style
Zheng Y, Pfäffl L, Seifert HJ, Pfleging W. Lithium Distribution in Structured Graphite Anodes Investigated by Laser-Induced Breakdown Spectroscopy. Applied Sciences. 2019; 9(20):4218. https://doi.org/10.3390/app9204218
Chicago/Turabian StyleZheng, Yijing, Lisa Pfäffl, Hans Jürgen Seifert, and Wilhelm Pfleging. 2019. "Lithium Distribution in Structured Graphite Anodes Investigated by Laser-Induced Breakdown Spectroscopy" Applied Sciences 9, no. 20: 4218. https://doi.org/10.3390/app9204218
Note that from the first issue of 2016, this journal uses article numbers instead of page numbers. See further details here.