Article

Hyperspectral Imaging and Hierarchical PLS-DA Applied to Asbestos Recognition in Construction and Demolition Waste

by
Giuseppe Bonifazi
*,
Giuseppe Capobianco
and
Silvia Serranti
Department of Chemical Engineering Materials & Environment, Sapienza, Rome University, Via Eudossiana 18, 00184 Rome, Italy
*
Author to whom correspondence should be addressed.
Appl. Sci. 2019, 9(21), 4587; https://doi.org/10.3390/app9214587
Submission received: 30 September 2019 / Revised: 21 October 2019 / Accepted: 25 October 2019 / Published: 28 October 2019
(This article belongs to the Special Issue Application of Hyperspectral Imaging for Nondestructive Measurement)

Abstract

:
Asbestos-Containing Materials (ACMs) are hazardous and prohibited to be sold or used as recycled materials. In the past, asbestos was widely used, together with cement, to produce “asbestos cement-based” products. During the recycling process of Construction and Demolition waste (C&DW), ACM must be collected and deposited separately from other wastes. One of the main aims of the recycling strategies applied to C&DW was thus to identify and separate ACM from C&DW (e.g., concrete and brick). However, to obtain a correct recovery of C&DW materials, control methodologies are necessary to evaluate the quality and the presence of harmful materials, such as ACM. HyperSpectral Imaging (HSI)-based sensing devices allow performing the full detection of materials constituting demolition waste. ACMs are, in fact, characterized by a spectral response that nakes them is different from the “simple” matrix of the material/s not embedding asbestos. The described HSI quality control approach is based on the utilization of a platform working in the short-wave infrared range (1000–2500 nm). The acquired hyperspectral images were analyzed by applying different chemometric methods: Principal Component Analysis for data exploration and hierarchical Partial Least-Square-Discriminant Analysis (PLS-DA) to build classification models. Following this approach, it was possible to set up a repeatable, reliable and efficient technique able to detect ACM presence inside a C&DW flow stream. Results showed that it is possible to discriminate and identify ACM inside C&DW. The recognition is potentially automatic, non-destructive and does not need any contact with the investigated products.

1. Introduction

Many people working in the demolition of buildings manufactured prior to the 1990s were exposed, during the different dismantling stages, to handling hazardous material like asbestos. The possibility to utilize fast and reliable “on site” detection methods able to assess the presence of asbestos thus assume great relevance.
Asbestos fibers are fibrous silicate minerals, widely used in construction during the 20th century due to their strong fire, chemical and abrasion resistance. Many hazardous exposures result from inadequacies to access information, to utilize appropriate measurement technologies and to use adequate personal protective equipment [1]. Until the1990s, Asbestos-Containing Materials (ACMs) (e.g., asbestos cement, Eternit, disc brake pads, etc.) were used in more than 3000 industrial applications and for manufacturing various types of products, due to their outstanding characteristics [2,3]. Harmful asbestos minerals that are regulated by law include chrysotile, tremolite, crocidolite, anthophyllite, actinolite and amosite [4]. Asbestos fibers contained in the degraded products tend to exfoliate, liberating themselves from the embedding matrix, thus generating airborne particles. The breathing of these fibers can cause benign asbestos-related disorders, like asbestosis and pleural plaques [5] and malignant pleural mesothelioma (MPM). MPM is a rare, aggressive tumor. It originates from the serosal cells lining the lungs and according to the World Health Organization (WHO), mesothelioma, asbestos-related lung cancer and asbestosis globally cause 107,000 deaths annually [6]. Human health can be damaged by inhaling fibers when they become airborne due to weathering or human activities producing dust [7]. Nowadays, due to the adverse health effects associated with asbestos exposure, various laboratory techniques are used to characterize the occurrence of asbestos fibers in rock samples [8,9,10,11], and different studies were carried out on asbestos identification using portable devices [12,13]. Life cycle of buildings that have been constructed by asbestos containing materials (ACM) is reaching the renovation time, and their demolition waste will provide an enormous volume of asbestos containing waste (ACW) [14]. Directives of European Waste Catalogue, code 170605, classify all ACW as hazardous and requires its treatment prior to disposal in controlled landfills [15]. However, to minimize the amount of C&DW to be brought into the controlled landfills, it is necessary to characterize all demolition waste and separate the hazardous material from the inert material. The possibility to adopt fast and reliable analysis methods to a preliminary detection and identification of asbestos fibers, during the demolition or renovation of a building, is of great interest in terms of safety, time and costs. Hyperspectral imaging (HSI) based systems are widely used in remote sensing (i.e., satellite, aerial platform and drones) to identify and map specific aspects of the territory, including the presence of hazardous materials, as the ACMs in rural, mountains, industrial and urban areas [16,17]. Limitations for ACMs mapping using HSI include lack of suitable spectral libraries for urban materials, presence of shadows, non-roof coverage elements and spectral similarities [18,19]. The use of in situ techniques based on HSI could represent a useful tool for the identification of materials and/or products containing asbestos fibers. In this work, HSI was applied to classify ACMs at laboratory scale, according to the promising results obtained in our previous studies [11,20,21,22]. Differently from our previous studies, in this paper efforts have been addressed not to identify the presence of specific asbestos minerals, but to detect the presence of ACM, that is “individuals” constituted by a matrix embedding asbestos fibers. To our knowledge, no other studies are published on the utilization of HSI for asbestos and ACMs classification inside C&DW waste at laboratory scale. Despite the many advantages provided by this technique, a wider diffusion of HSI is hampered by the high amount of data that can be collected in very short times: it is thus necessary a to utilize robust and reliable statistical approaches to manage the data [23,24]. The proposed strategy, based on the combined use of HSI and chemometric techniques, can represent a valid and efficient innovative analytical approach that can support the currently adopted techniques for asbestos recognition [25,26]. The techniques currently adopted to detect asbestos require the physical collection and preparation of samples and usually allow punctual measurements and/or small areas mapping. HSI, on the contrary, does not require any sample preparation, thus allowing the acquisition of large quantities of samples in shorter time.
The aim of this work was to apply HSI technique for detection and classification of ACM, embedded in a real C&DW. The spectral range utilized to reach these goals is the Short-Wave InfraRed (SWIR: from 1000 to 2500 nm), the same utilized for the analysis carried out by remote sensing [27,28]. ACM acquired images were processed using chemometric techniques, in order to operate an automatic classification and in particular to separate samples with spectral fingerprint similar to ACM (i.e., uncontaminated mortars from asbestos mortars). More in detail, the chosen acquisition set-up allows the rapid acquisition of a large quantity of samples at a resolution of about 150 µm. Asbestos fibers are smaller than the chosen pixel resolution, but the spectral signature of the pure matrix is different from the spectral signature of the matrix containing asbestos fibers. Starting from the collected spectra it was thus possible to create a classification model able to recognize, inside a C&DW flow stream, the presence of uncontaminated (i.e., absence of asbestos fibers in the matrix) and contaminated samples (i.e., presence of asbestos fibers in the matrix). Multivariate approach, HIS based, was largely adopted in many research fields [29,30,31,32] to manage the huge amount of data and to utilize the information to identify, to characterize and to sort ACM. The aim of the chemometric approach was to obtain a data dimensionality reduction for a better data spectral evaluation and to develop classification algorithm for an efficient handling of multiple classes when hyperspectral imaging [33,34,35,36,37,38,39,40,41] sorting strategies have to be set up. Furthermore, the proposed approach also represents a step forward with respect to safety, being applied with a minor exposure risk for workers.

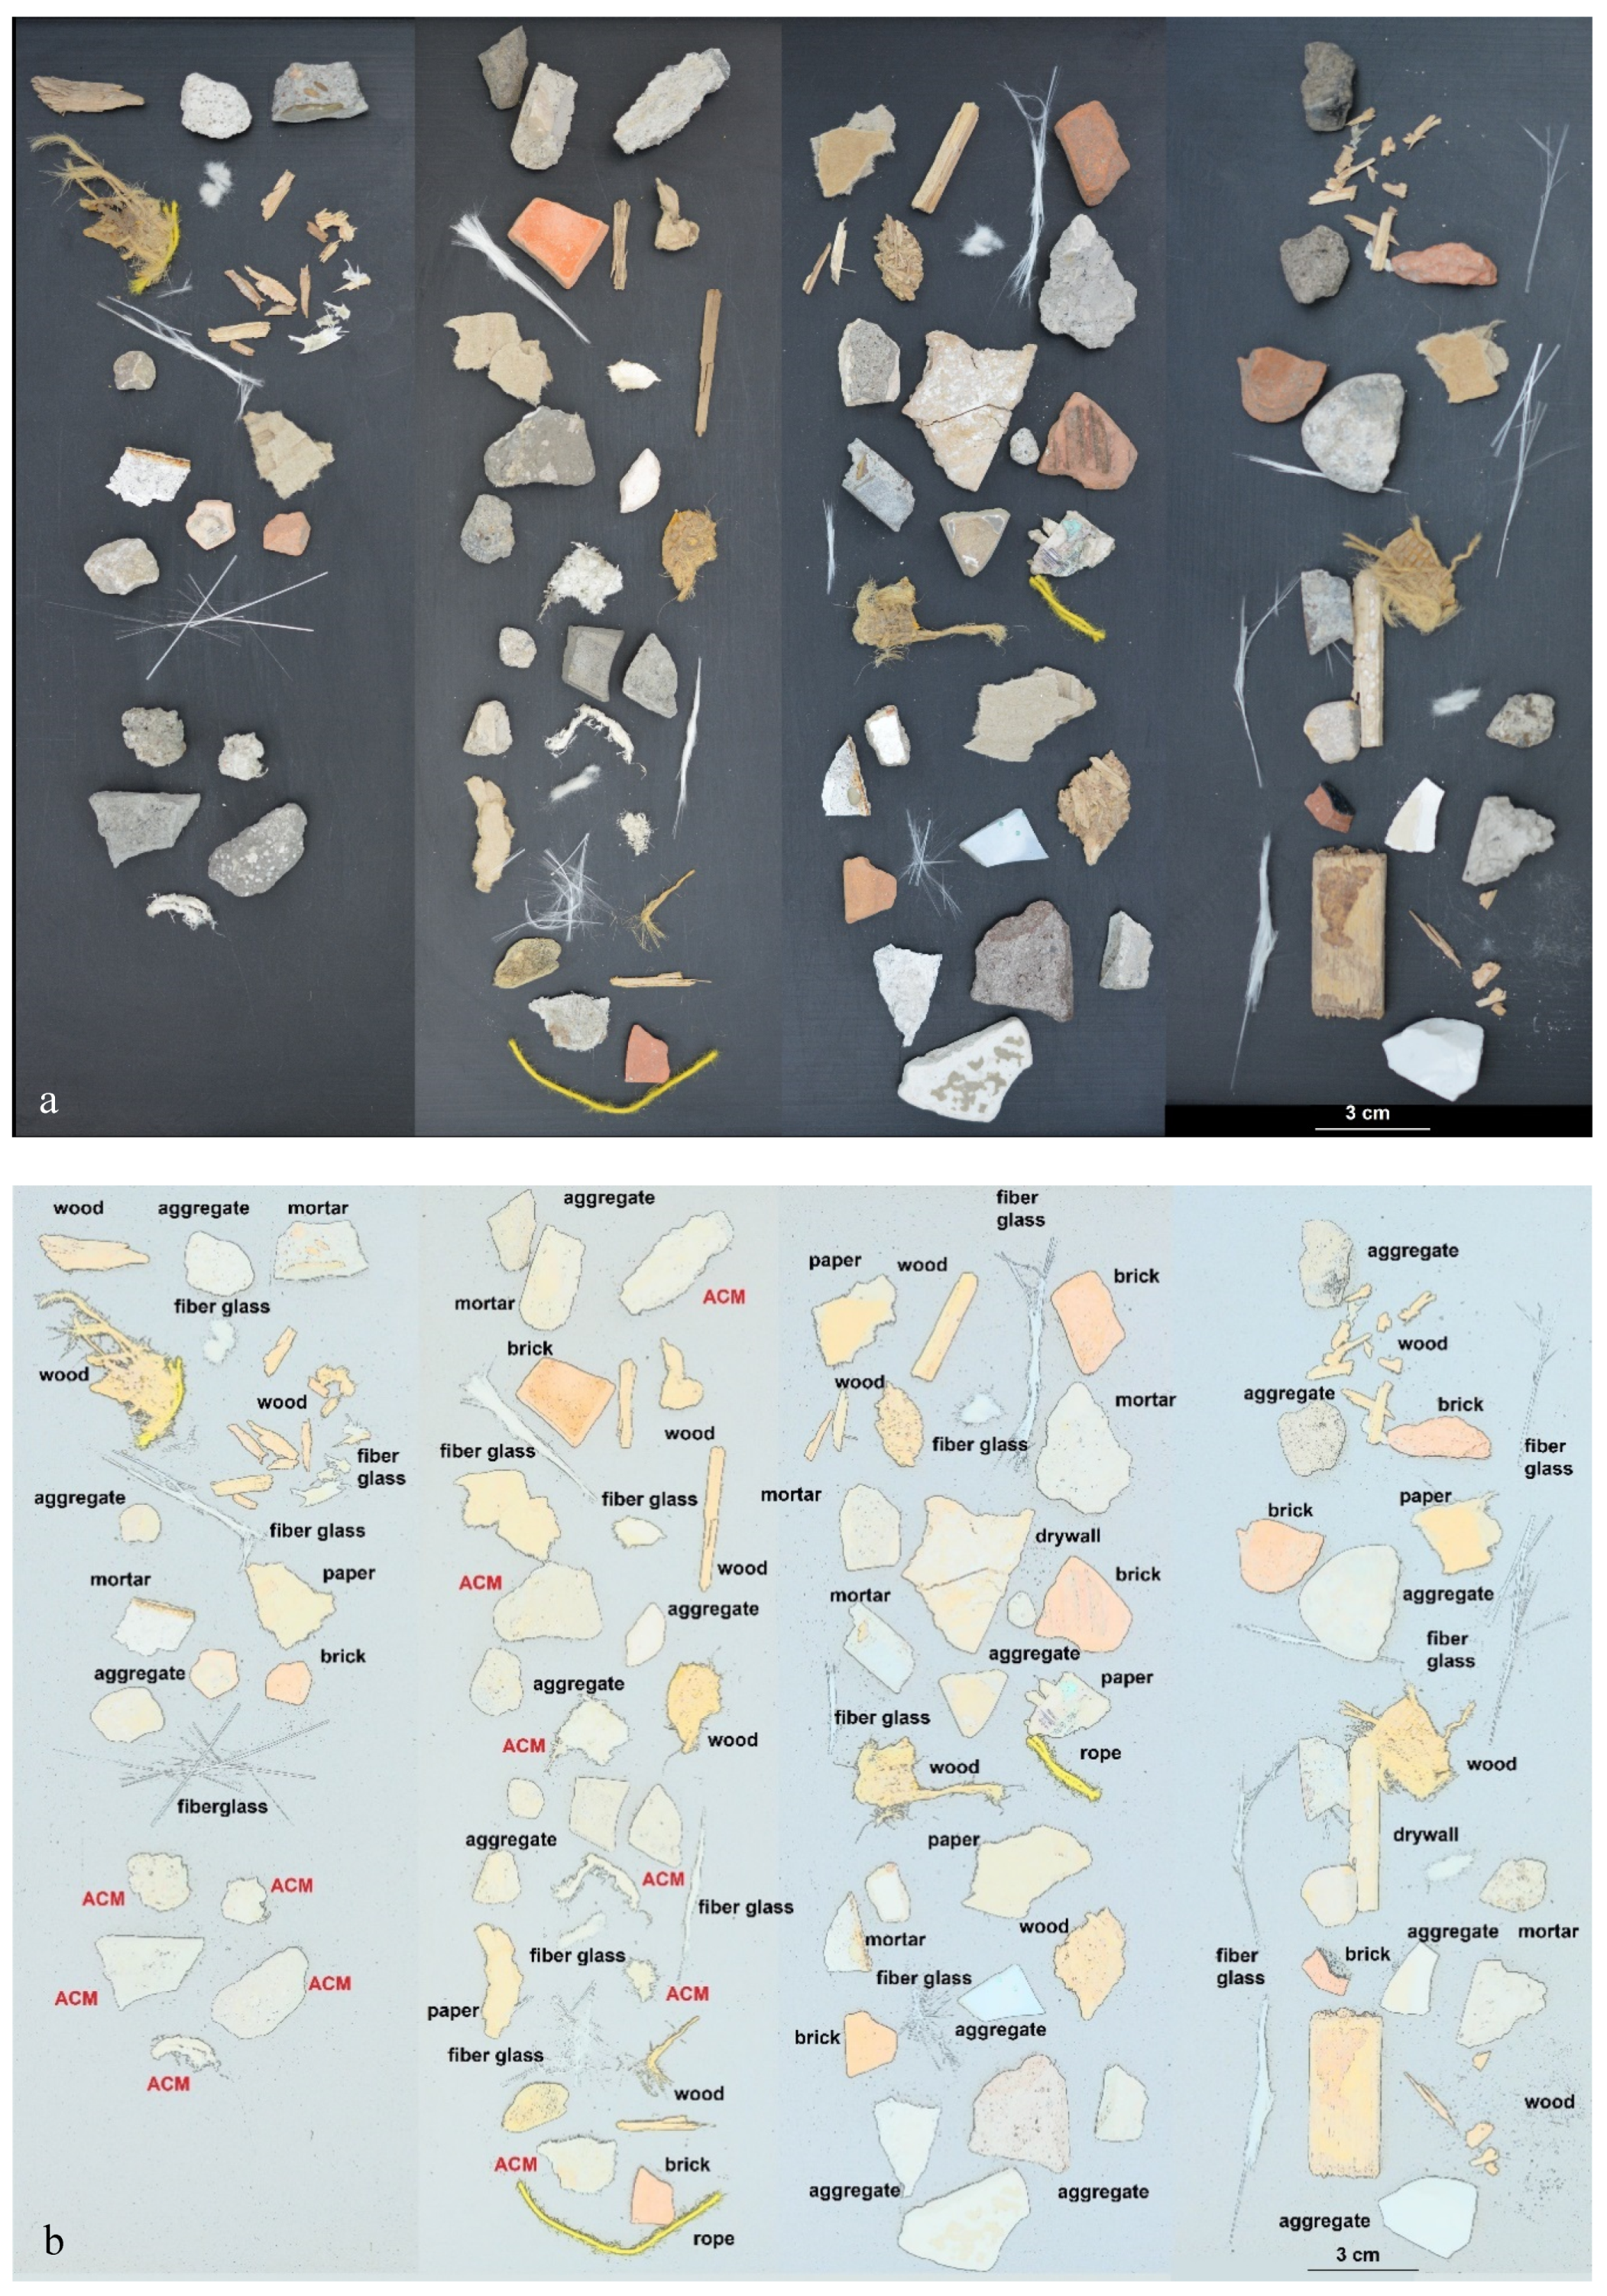
2. Materials and Methods

ACM samples containing asbestos, provided by VERAM s.r.l. (Rome, Italy) and characterized in previous works [11], were mixed with fragments of commonly utilized construction materials (i.e., fiber glass, wood, mortars, aggregate, rope, brick, paper) in order to create a “reference” laboratory-scale C&DW (Figure 1). ACM samples, containing amosite (Mg,Fe)7Si8O22(OH)2, chrysotile Mg3Si2O5(OH)4 and crocidolite Na2Fe2 + 3Fe3 + 2Si8O22(OH)2 fibers of different diameters and lengths were selected.
The different asbestos minerals have been identified and characterized following a micro-XRay Fluorescence (µXRF) and microscopy-based approach [21,22]. The C&DW samples were composed by mortars, aggregates with different dimension and contaminants as brick, wood, fibers glass and wood fibers.
Starting from the samples, four acquisitions were made. In the 1st acquisition, the ACM samples are separately placed from the C&DW, in the 2nd acquisition the ACM samples were randomly placed, together with C&DW. Finally, in the 3rd and 4th acquisitions samples without ACMs were prepared (Figure 1a). The proposed test (i.e., 1st, 2nd, 3rd and 4th acquisition) were performed in order to find the best classification strategy to identify and classify each material: aggregates, mortars, ACM, fiberglass and organic material. Simplified samples identification charts are reported in Figure 1b.

Instruments and Statistical Analysis

HSI was carried out in the SWIR range (1000–2500 nm), adopting the SISUChema XL (Specim®, Oulu Finland) analytical unit equipped with 31-mm lens, allowing an acquisition resolution of 150 μm/pixel (i.e., 50 mm of field of view). The acquisition set up was established as results of the previous studies [11,20,21,22], where the utilization of 15 mm lens optics, enabling a maximum pixel resolution of 600 µm, allowed to perform ACM identification of classification. Such a result was achieved at laboratory scale. The operative conditions being: a spatial resolution (i.e., field of view) equal to 20 cm and a scanning speed of 72.5 mm/s. Samples are scanned on a moving imaging tray, under lighting conditions, using SPECIM’s diffused line illumination unit. The scanner was integrated with a computer workstation allowing to acquire and save spectral images in real-time using the ChemaDAQ data acquisition software. An internal standard reference target, issued for calibration measurement before each sample scan, is utilized thus performing an automatic image data calibration in respect of the collected reflectance spectra. Its higher spatial and spectral resolution allows the SisuCHEMA™ to record distinctive spectral absorption features in the SWIR wavelength region, which can be utilized to study mineralogical components on materials surfaces [41]. The collected hyperspectral data generate a hypercube, where the x and y dimensions allow to identify the pixel coordinates (i.e., spatial dimension) and the z coordinate the spectral dimension.
Spectral data (i.e., hypercube) analysis was carried out adopting chemometric, utilizing the PLS_Toolbox (version 8.6, Eigenvector Research, Inc.) running inside MATLAB (version 9.3, The Mathworks, Inc., Natick, MA, USA). A single mosaic image was created from the four acquisitions (Figure 2). Mosaic image was the result of a composite “tiled” image obtained performing a hypercube concatenation. Following this strategy, a bigger hypercube embedding all particles hyperspectral attributes was defined and utilized to perform all the further processing.
Principal Component Analysis (PCA) [42] for exploratory data analysis, Partial Least Square-Discriminant Analysis (PLS-DA) [43,44,45] to build classification models and Hierarchical Modelling (HM) were applied. PCA is a useful method capable of providing an overview of complex multivariate data.
PCA is a useful method capable of providing an overview of complex multivariate data. PCA can be used for revealing relations between variables and relations between samples (e.g., clustering), detecting outliers, finding and quantifying patterns, generating new hypotheses as well as many other things. It was used to decompose the “processed” spectral data into several Principal Components (PCs) (linear combinations of the original spectral data), embedding the spectral variations of each collected spectral data set. According to this approach, a reduced set of factors is produced. Such a set can be used for discrimination, since it provides an accurate description of the entire dataset. The first few PCs are generally used to analyses the common features among samples and their grouping: in fact, samples characterized by similar spectral signatures tend to aggregate in the score plot of the first two or three components. Spectra could be thus characterized either by the reflectance at each wavelength in the wavelength space, or by their score on each PC in the PC space. Samples characterized by similar spectra, which belong to the same class of products, are grouped in the same region of the score plot related to the first two or three PCs, whereas samples characterized by different spectral features will be clustered in other parts of this space.
PLS-DA is a linear classification method combining the properties of PLS regression with the discrimination power of a classification technique. PLS-DA is based on the PLS regression algorithm (PLS1 when dealing with one dependent Y variable and PLS2 in the presence of several dependent Y variables), which searches for latent variables with a maximum covariance with the Y-variables. The main advantage of PLS-DA is that the relevant sources of data variability are modelled by the so-called Latent Variables (LVs), which are a linear combination of the original variables, and, consequently, it allows graphical visualization and understanding of the different data patterns and relations by LV scores and loadings. Loadings are the coefficients of variables, in the linear combinations, which determine the LVs and therefore they can be interpreted as the influence of each variable on each LV, while scores represent the coordinates of samples in the LV projection hyperspace.
In detail, for the calibration dataset, samples containing asbestos fibers (i.e., crocidolite chrysotile and amosite) from the certified samples were chosen. Organic, aggregates, mortars bricks and glass fibers samples were also chosen so that to generate four classes characterized by a comparable amount of pixels. Through an exploratory analysis in PCA the best preprocessing procedures, according with those more utilized to handle NIR spectra [46,47,48], allowing the separation between the classes have been chosen. Finally four PLS-DA models have been created to perform discriminations:
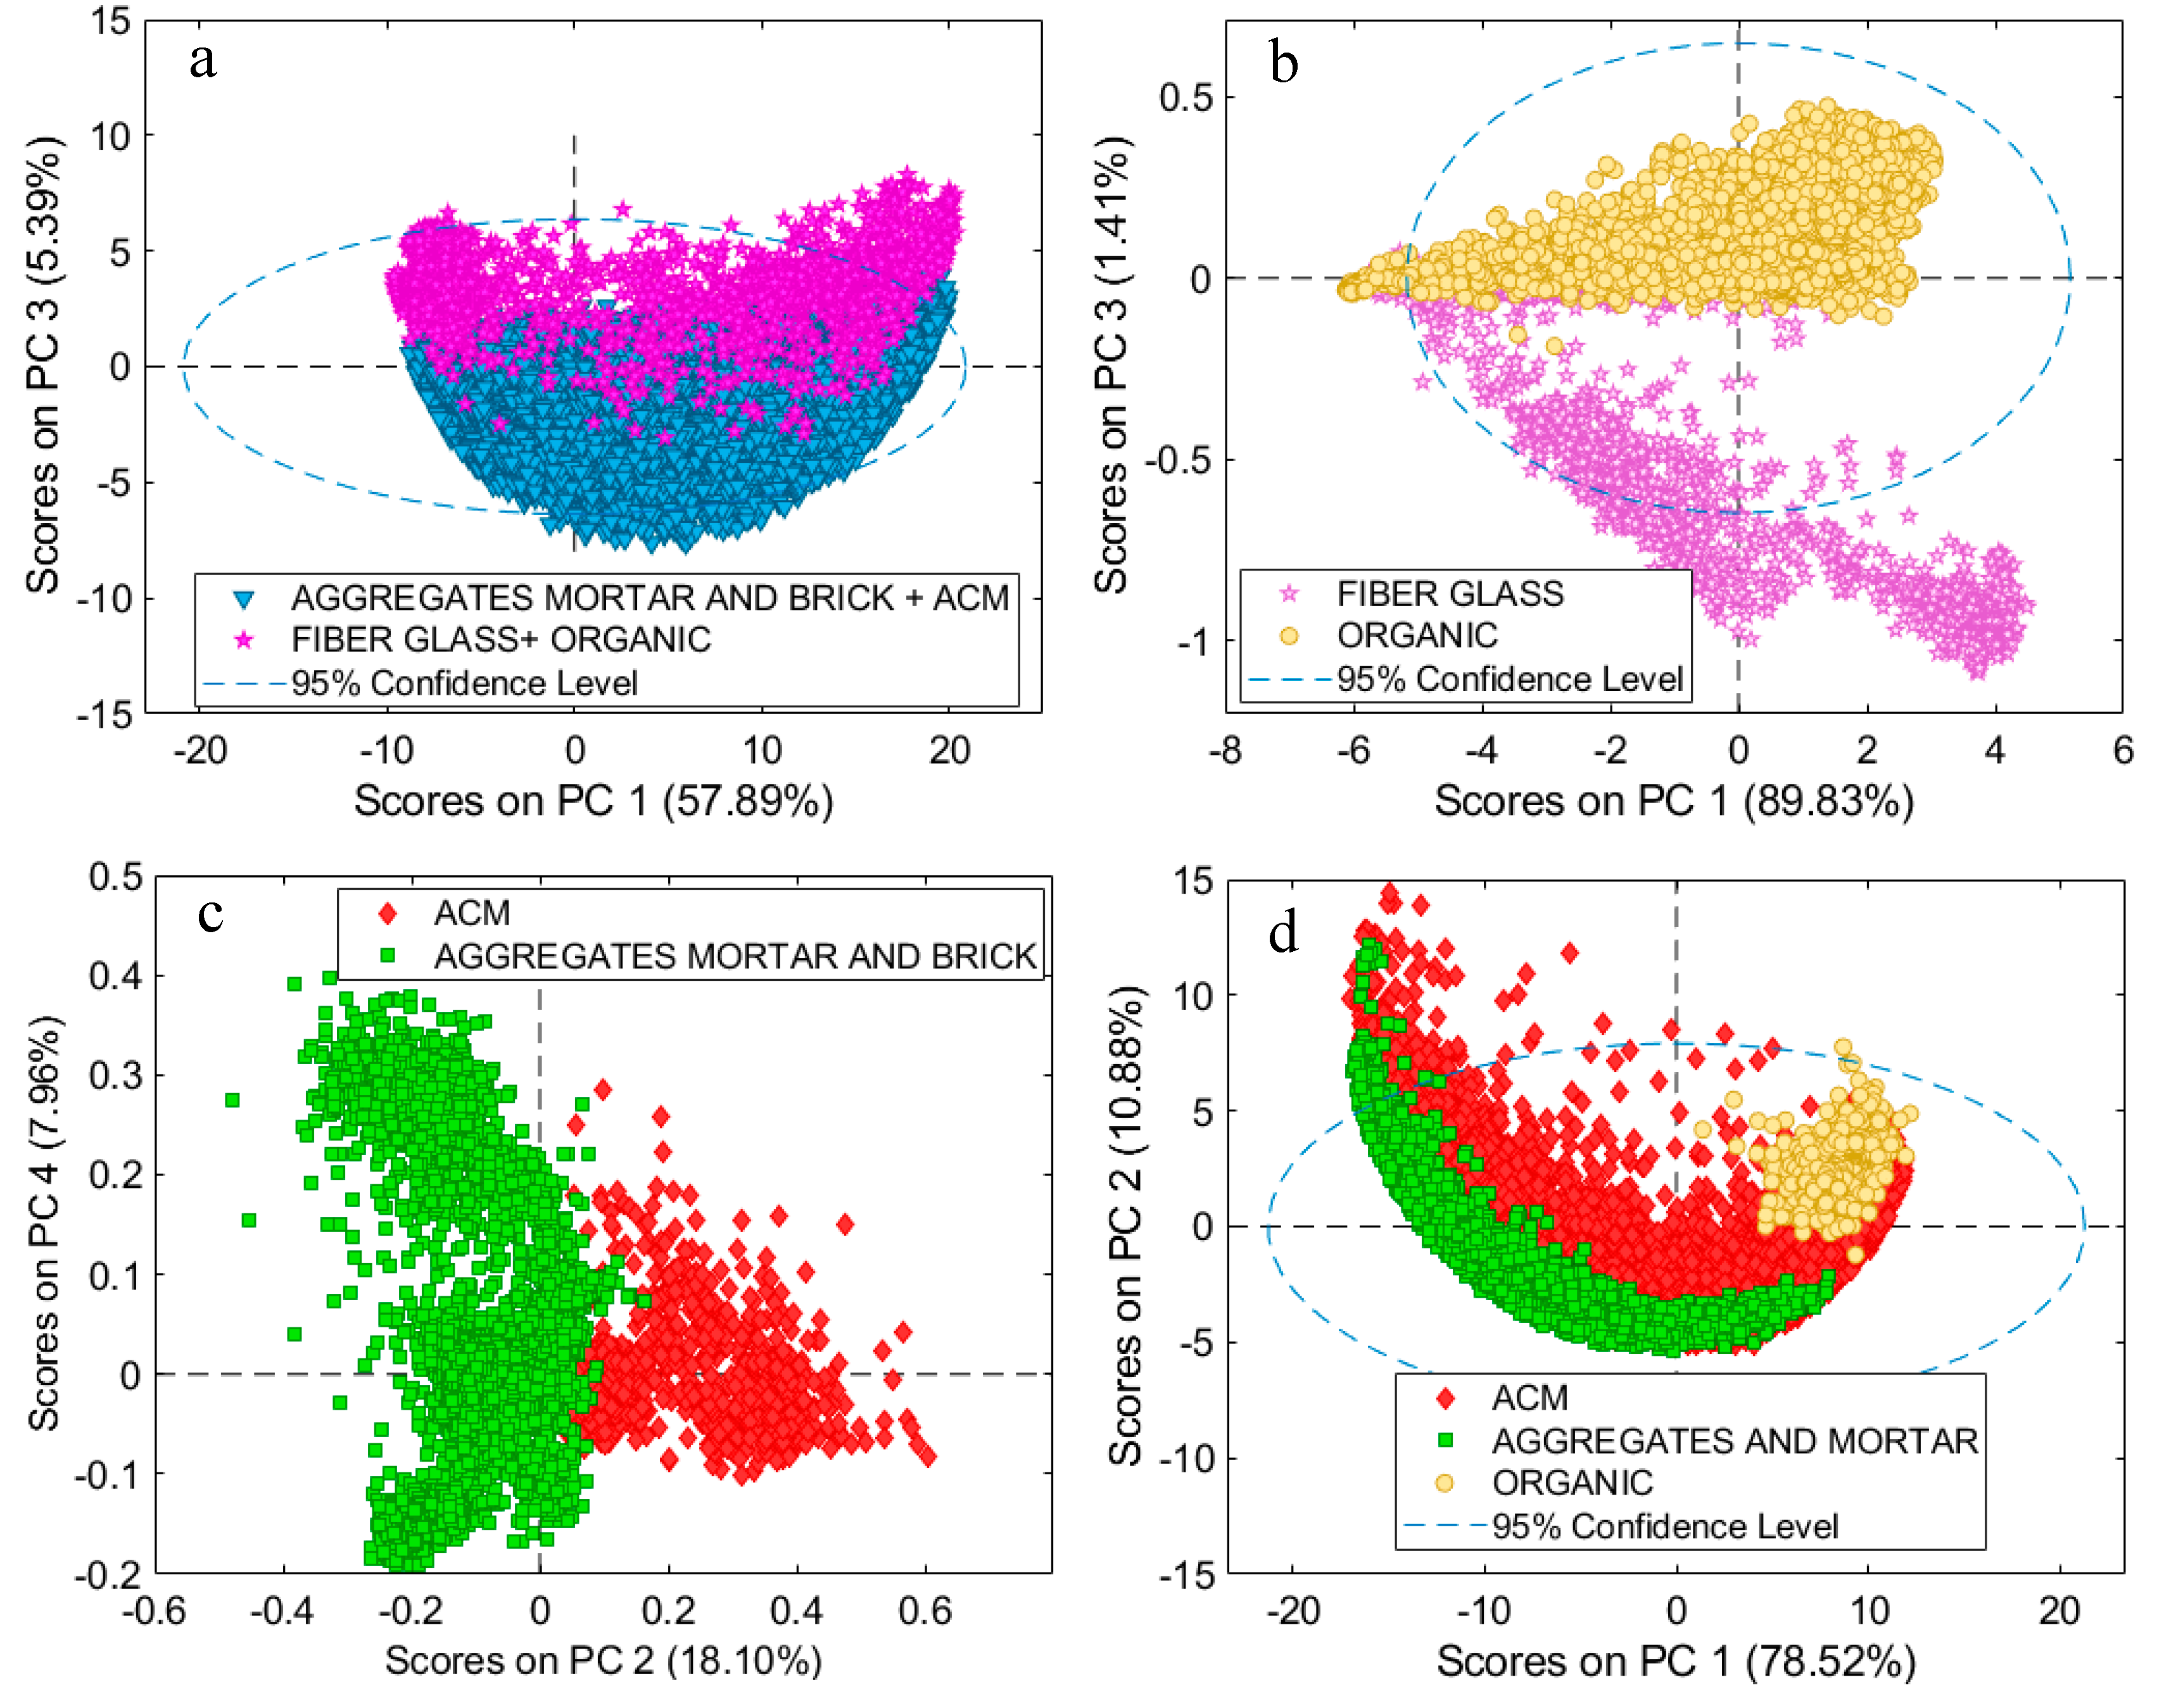
  • PLDA1: AGGREGATES MORTAR and BRICK + ACM from FIBER GLASS + ORGANIC
  • PLSDA2: FIBER GLASS from ORGANIC
  • PLSDA3: ACM with a dimension of about 300 µm from GGREGATES MORTAR and BRICK
  • PLDA4: ACM WITH A DIMENSION below 300 µm from AGGRAGATES MORTAR and BRICK
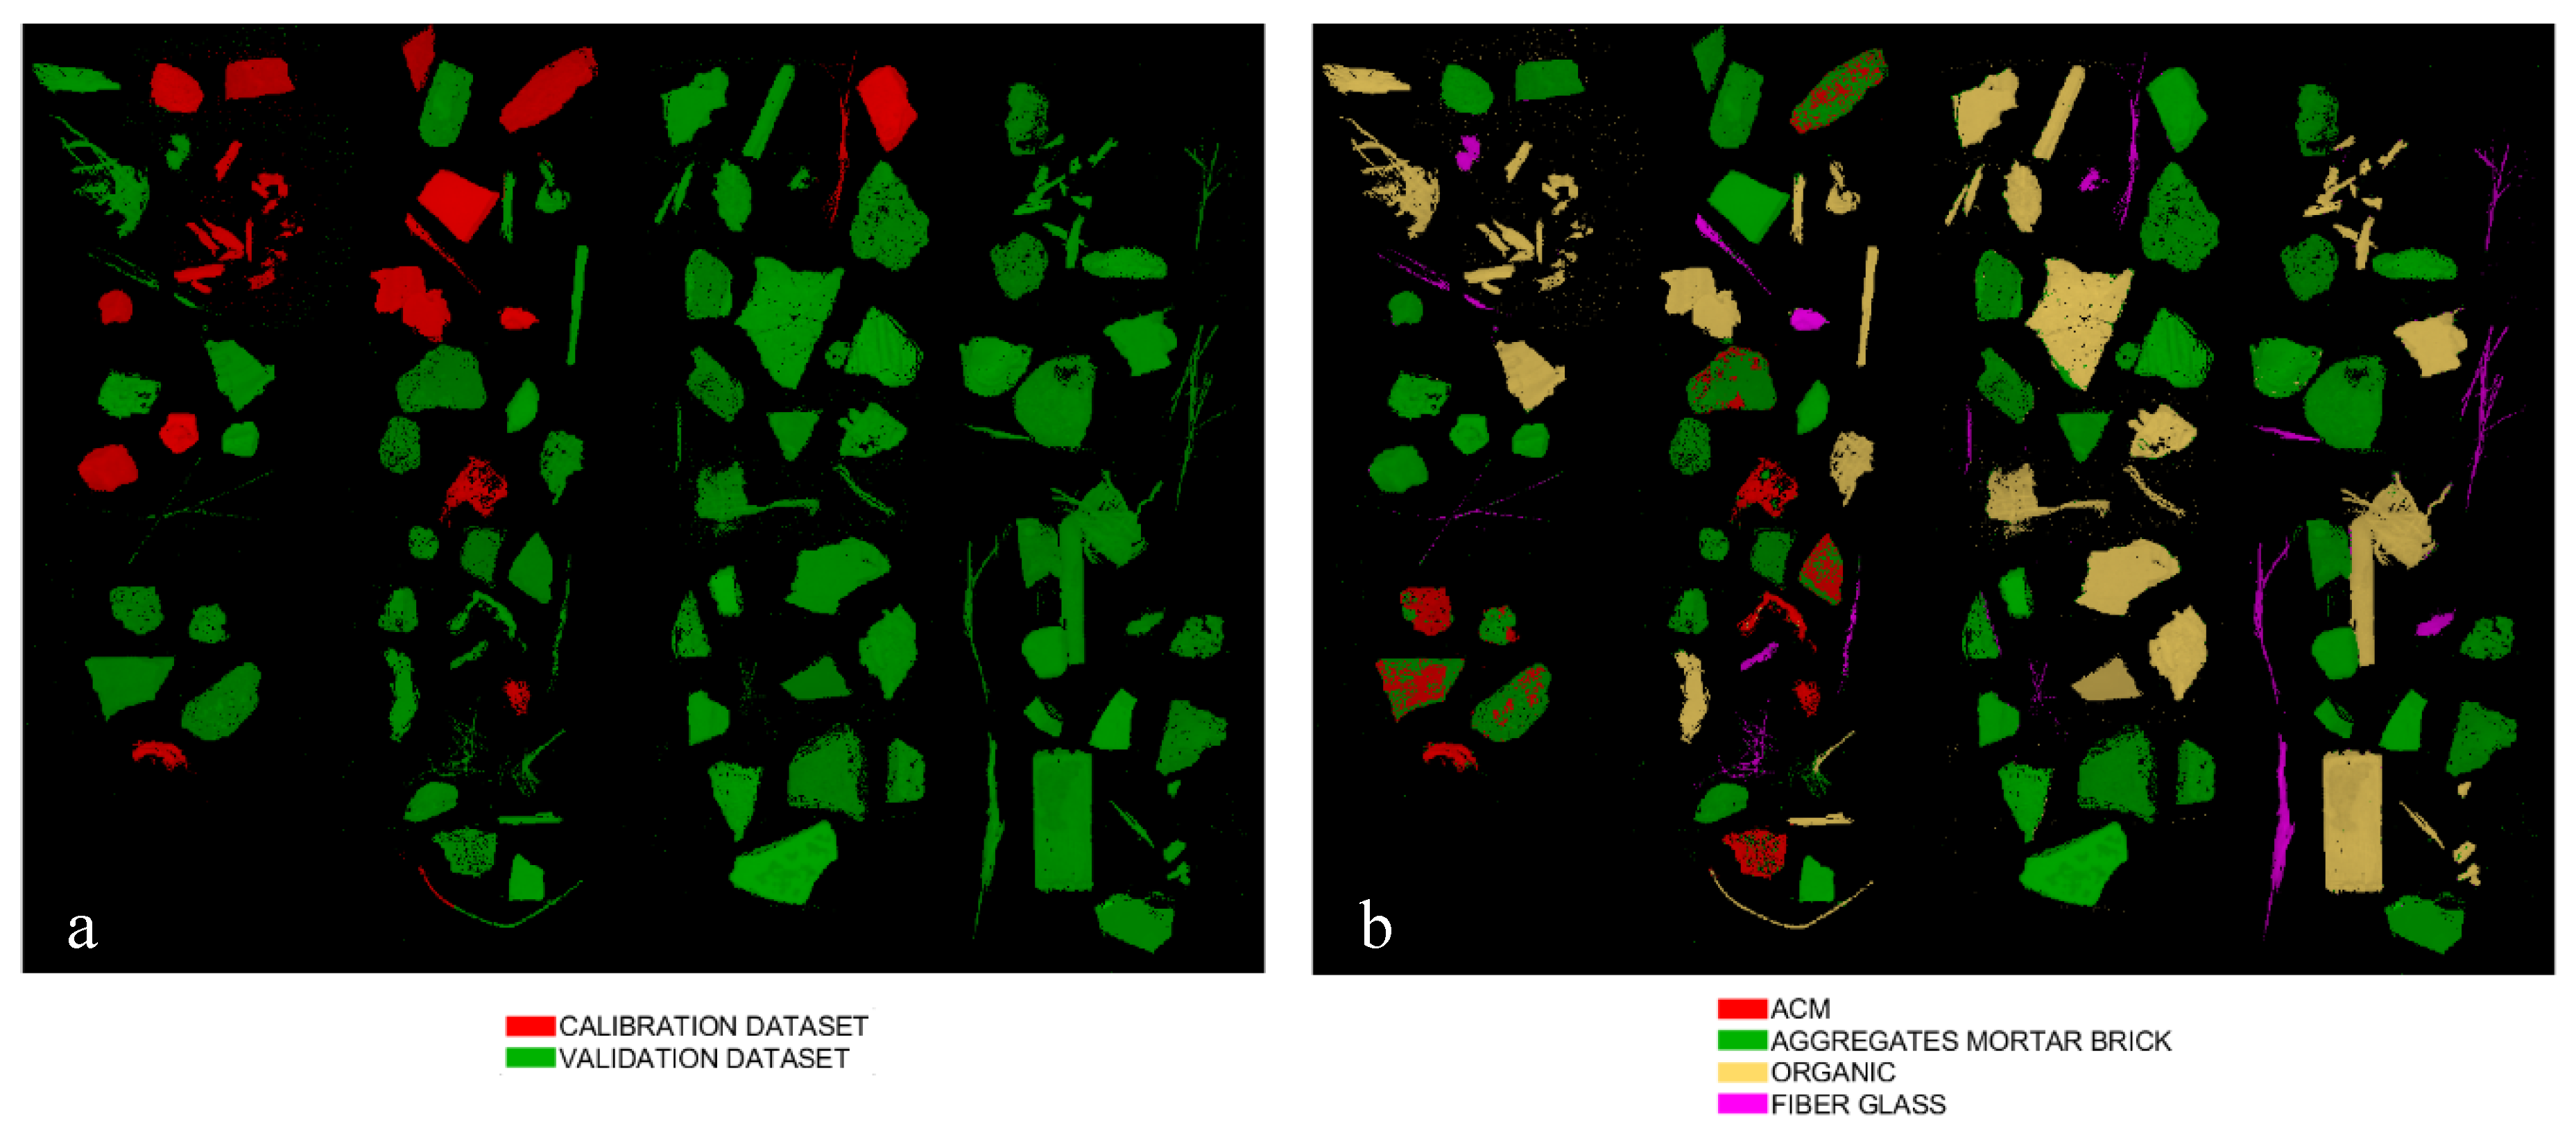
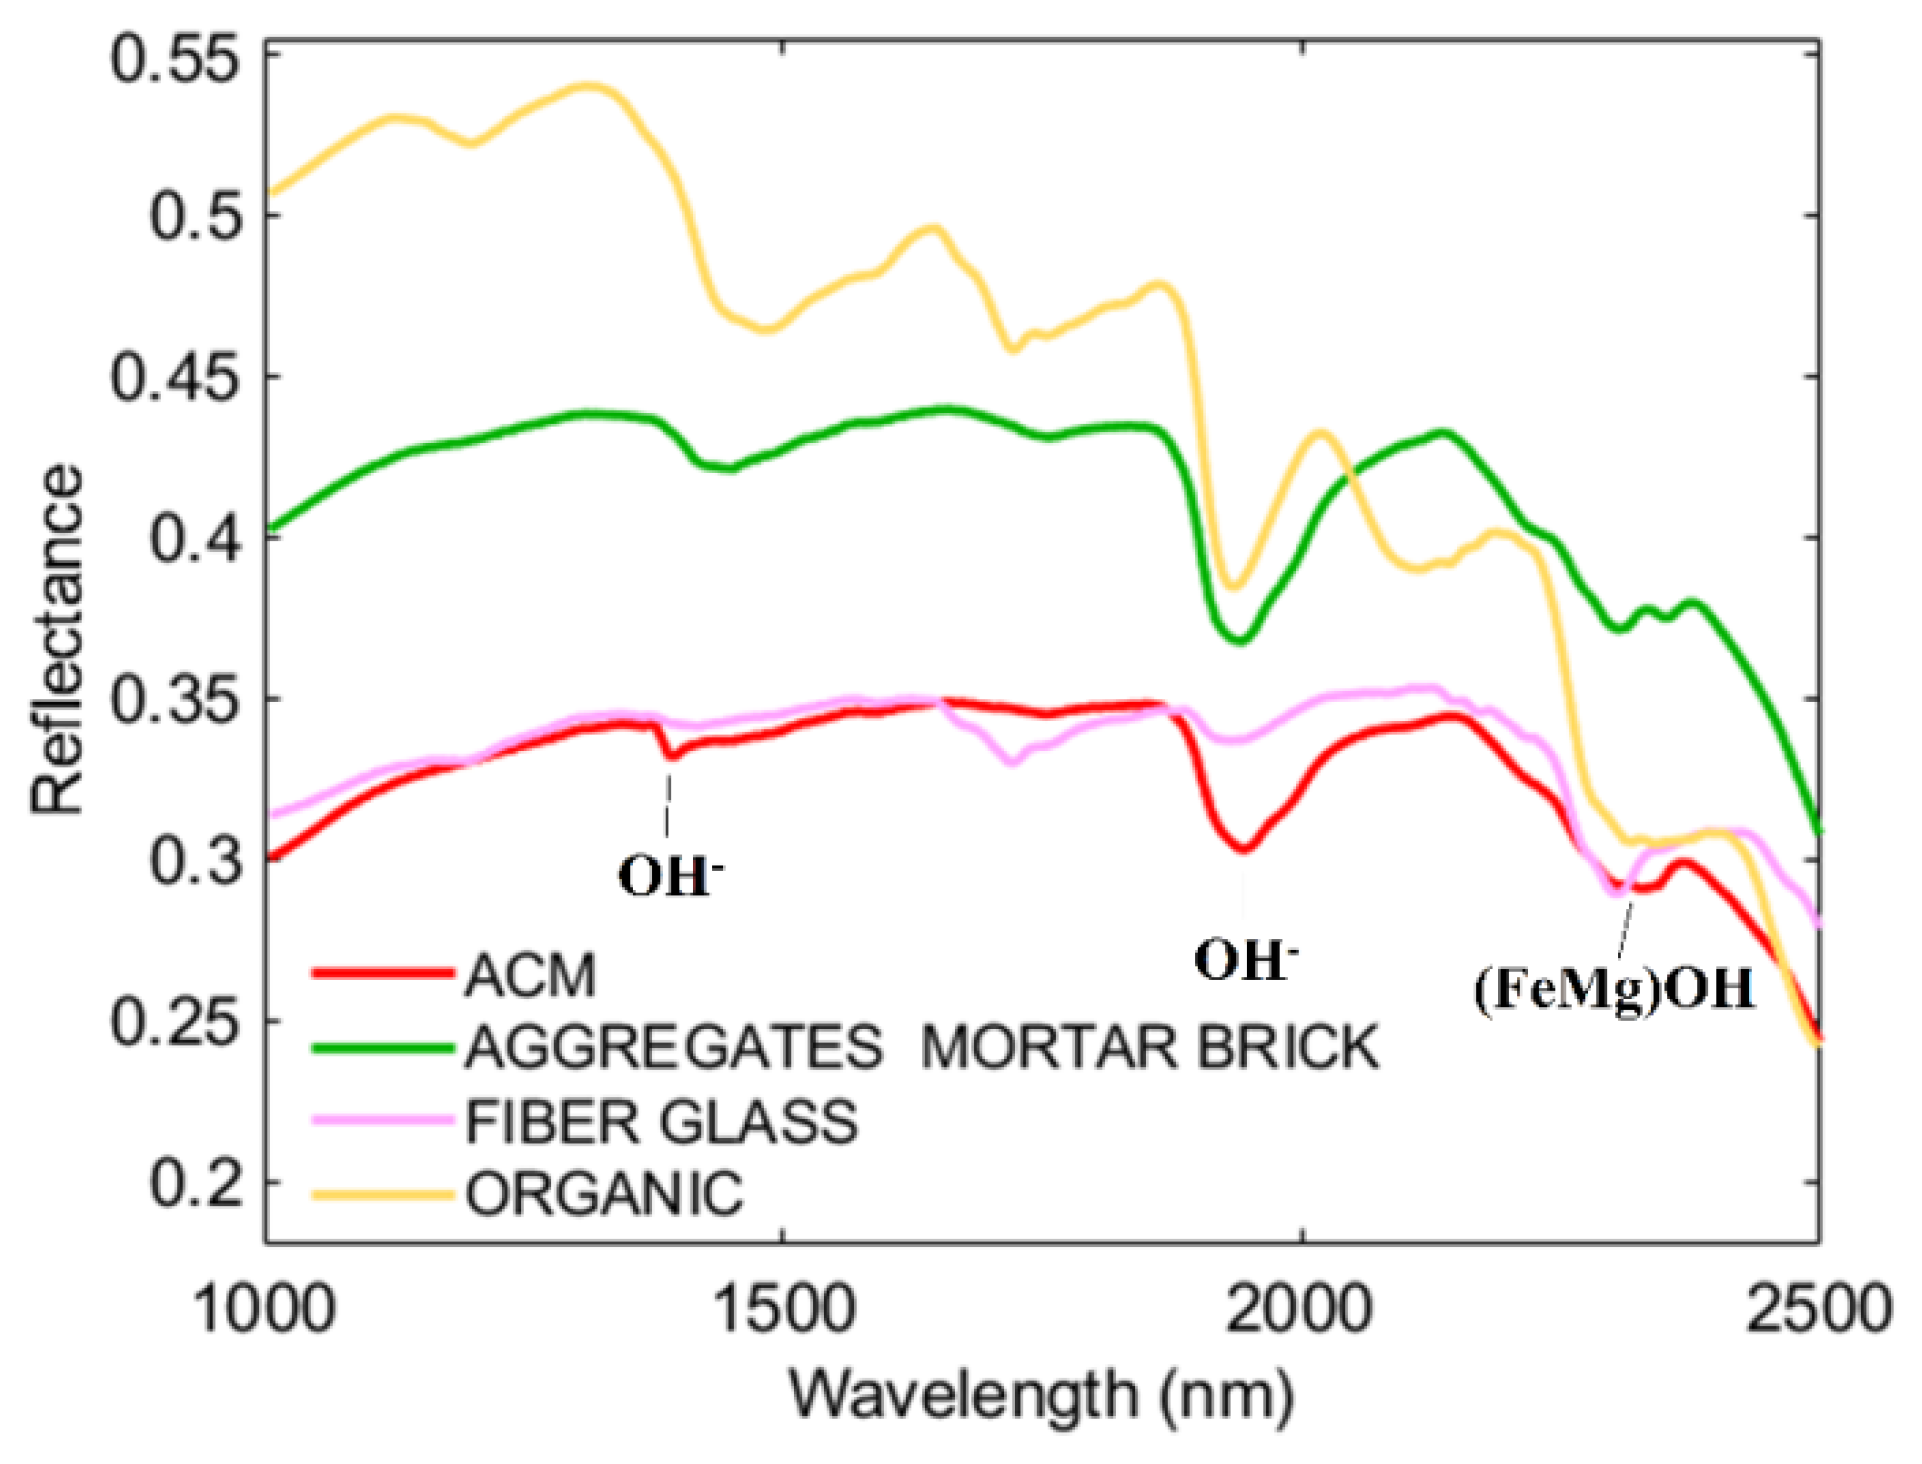
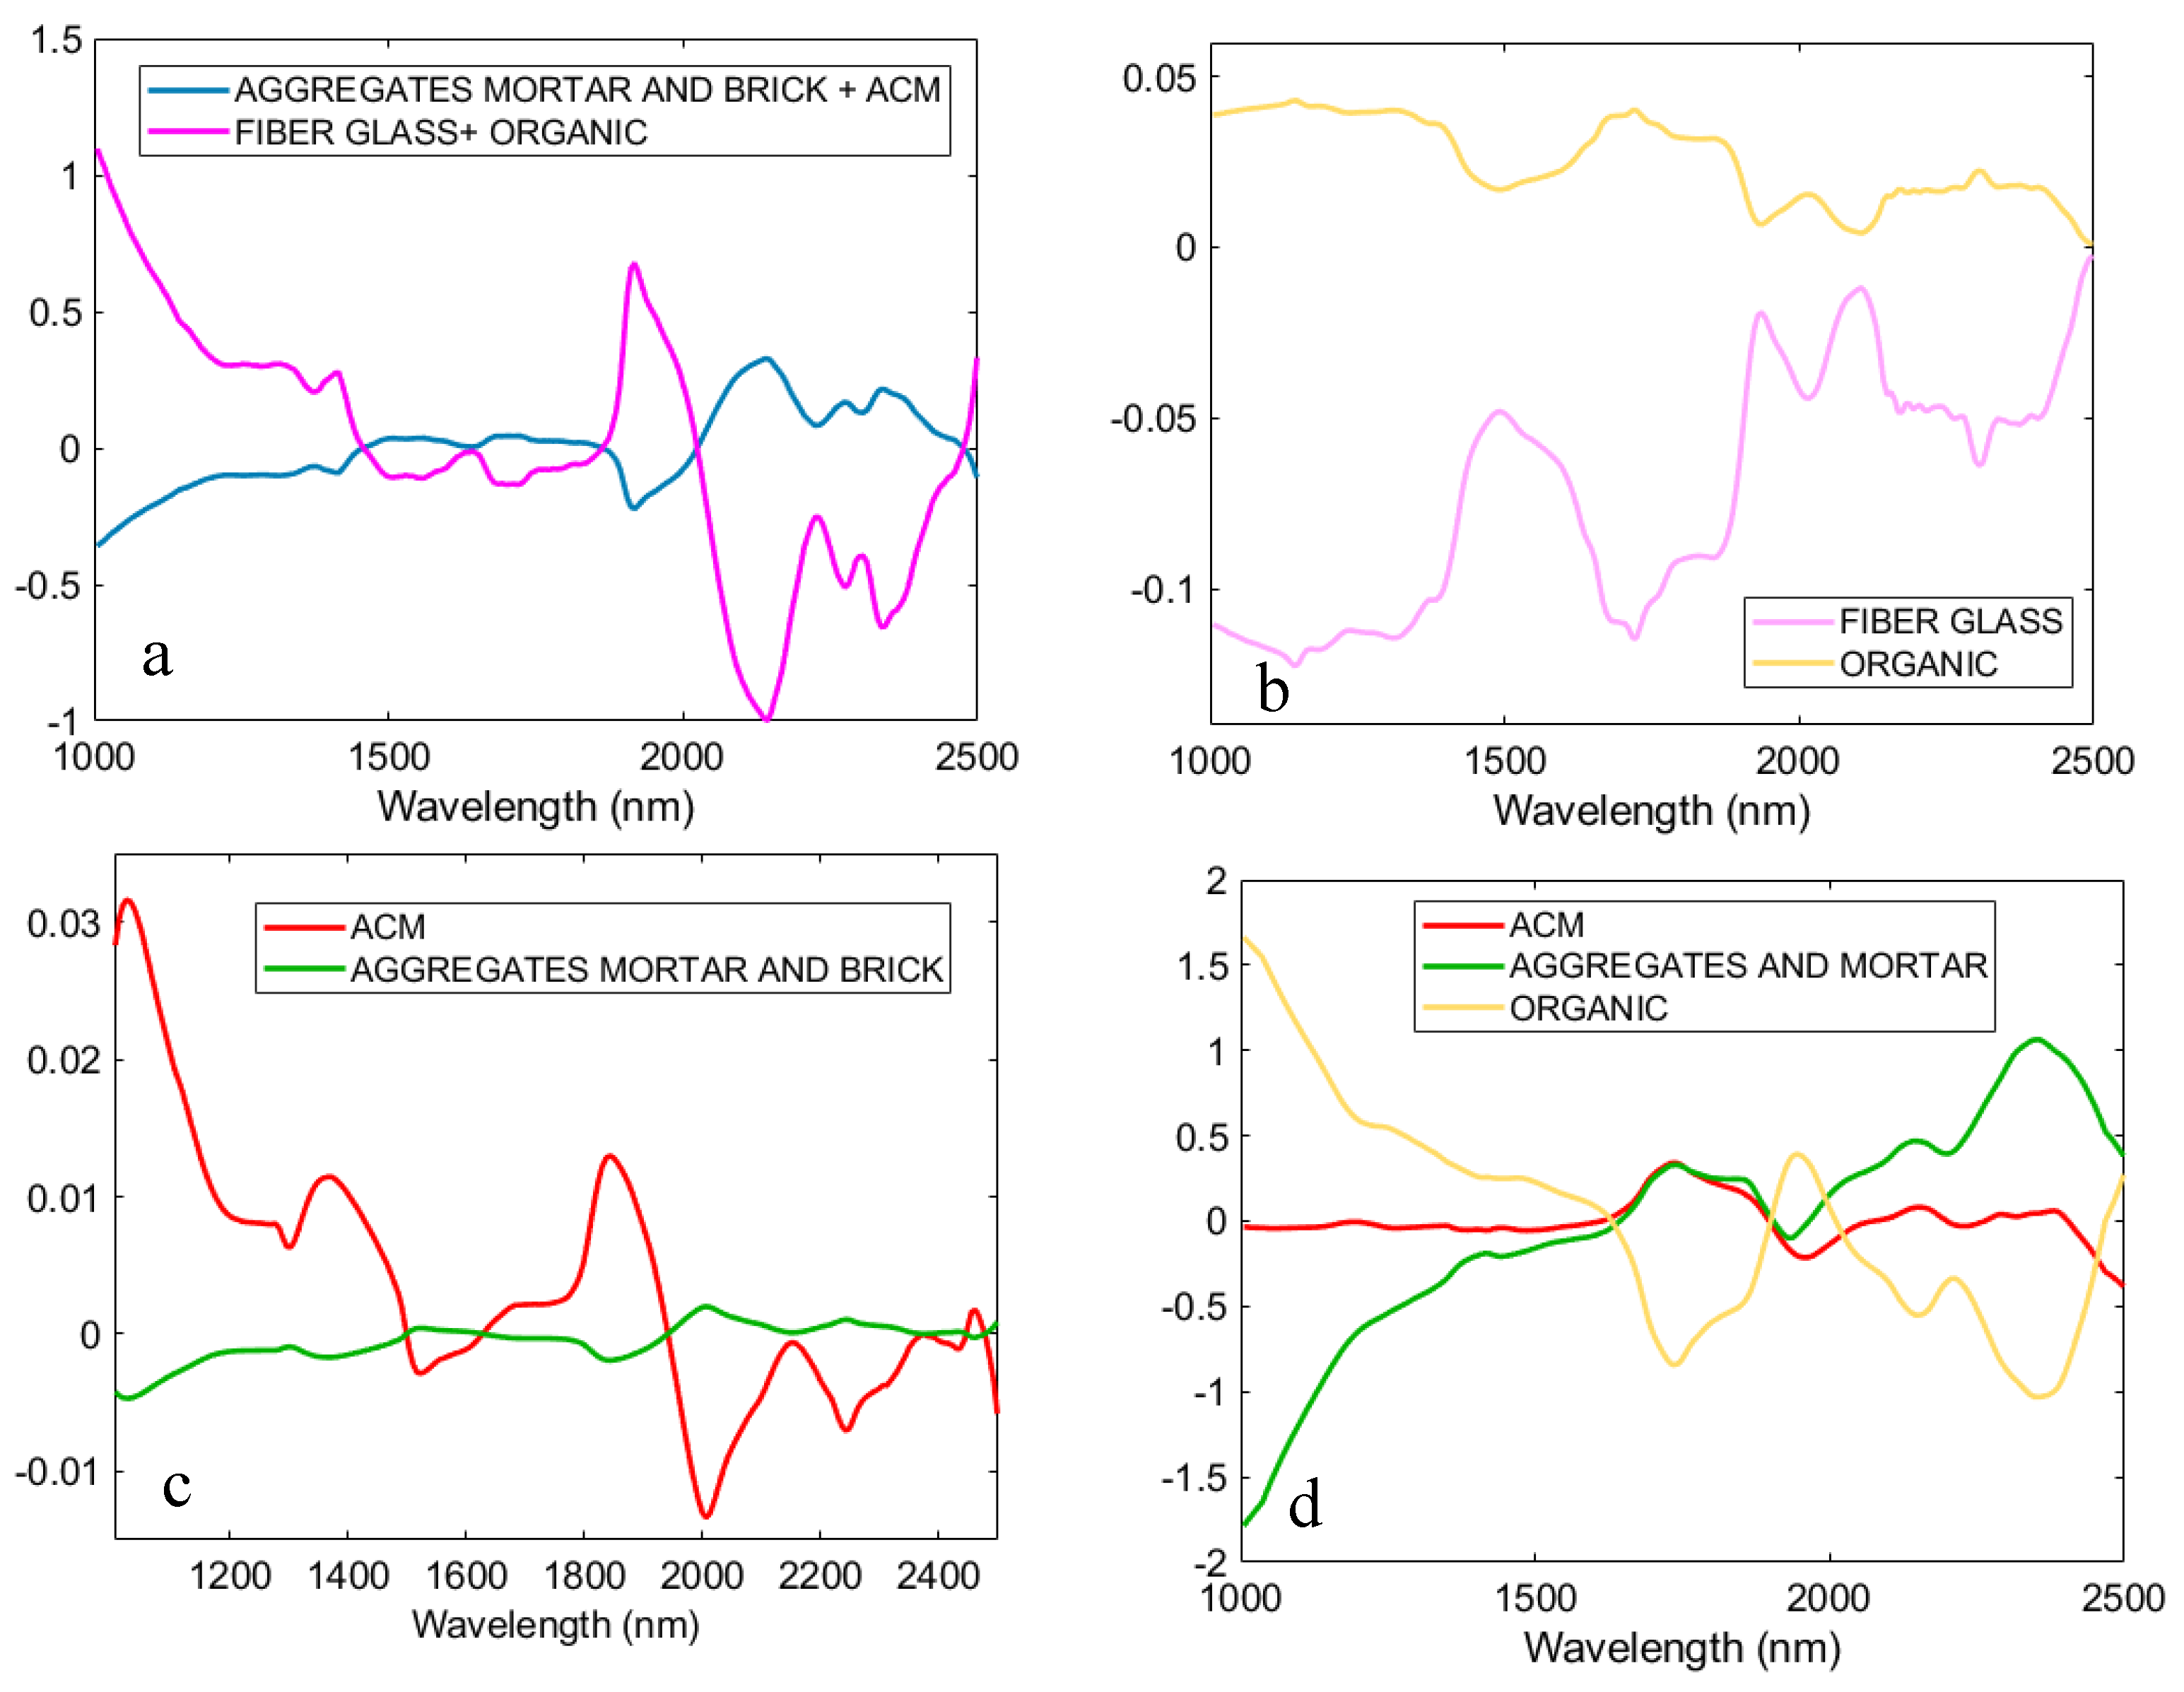
The 4 models have been hierarchized in order to analyze the entire mosaic in a single model. Classification models were then evaluated using the following parameters: Sensitivity and Specificity in calibration (Cal) and cross-validated (CV):
Sensitivity: TP/(TP + FN)
Specificity: TN/(TN + FP)
being TP the true positive and FN the false negatives. The best models are obtained when similar values are obtained for Sensitivity and Specificity in Cal and CV, thus demonstrating the robustness of the developed model (32).
Cross validation is a very useful tool serving two critical functions in chemometric: (i) it enables an assessment of the optimal complexity of a model and (ii) it allows an estimation of the performance of a model when it is applied to unknown data. For a given data set, cross validation involves a series of experiments, hereby called sub-validation experiments, involving the removal of a subset of objects from a dataset (the test set), the construction of a model using the remaining objects in the dataset (the model building set), and the subsequent application of the resulting model to the removed objects. This way, each sub-validation experiment involves testing a model with objects that were not used to build the model. The PLS-DA models created to discriminate the different classes, were subsequently hierarchized. Adopting a hierarchical model, objects are preliminarily divided into subsets and are then subdivided into further subsets, until each subset contains a single object [11]. During each step, the object that is the most different, in respect of the others, is selected and isolated, and a comparison is carried out based, for each object, on a new PLS-DA classification model [12]. The results of a hierarchical model are usually shown through a dendrogram allowing to maximize the similarities, existing among the different examined objects, to be analyzed, recognized and classified. PLS-DA models have been cross validated using the Venetian blind cross validation adopting a number of data splits equal to 10 with five spectra for split. Finally, the result of the Sensitivity and Specificity in calibration and cross validation for each node of the hierarchical model have been compared. The results are showed through a dendrogram allowing to perform highly informative visual analysis on the similarities existing among the objects. The dendrogram, developed for the classification of ACM and C&DW, is reported in Figure 3.

3. Results

3.1. Calibration Dataset
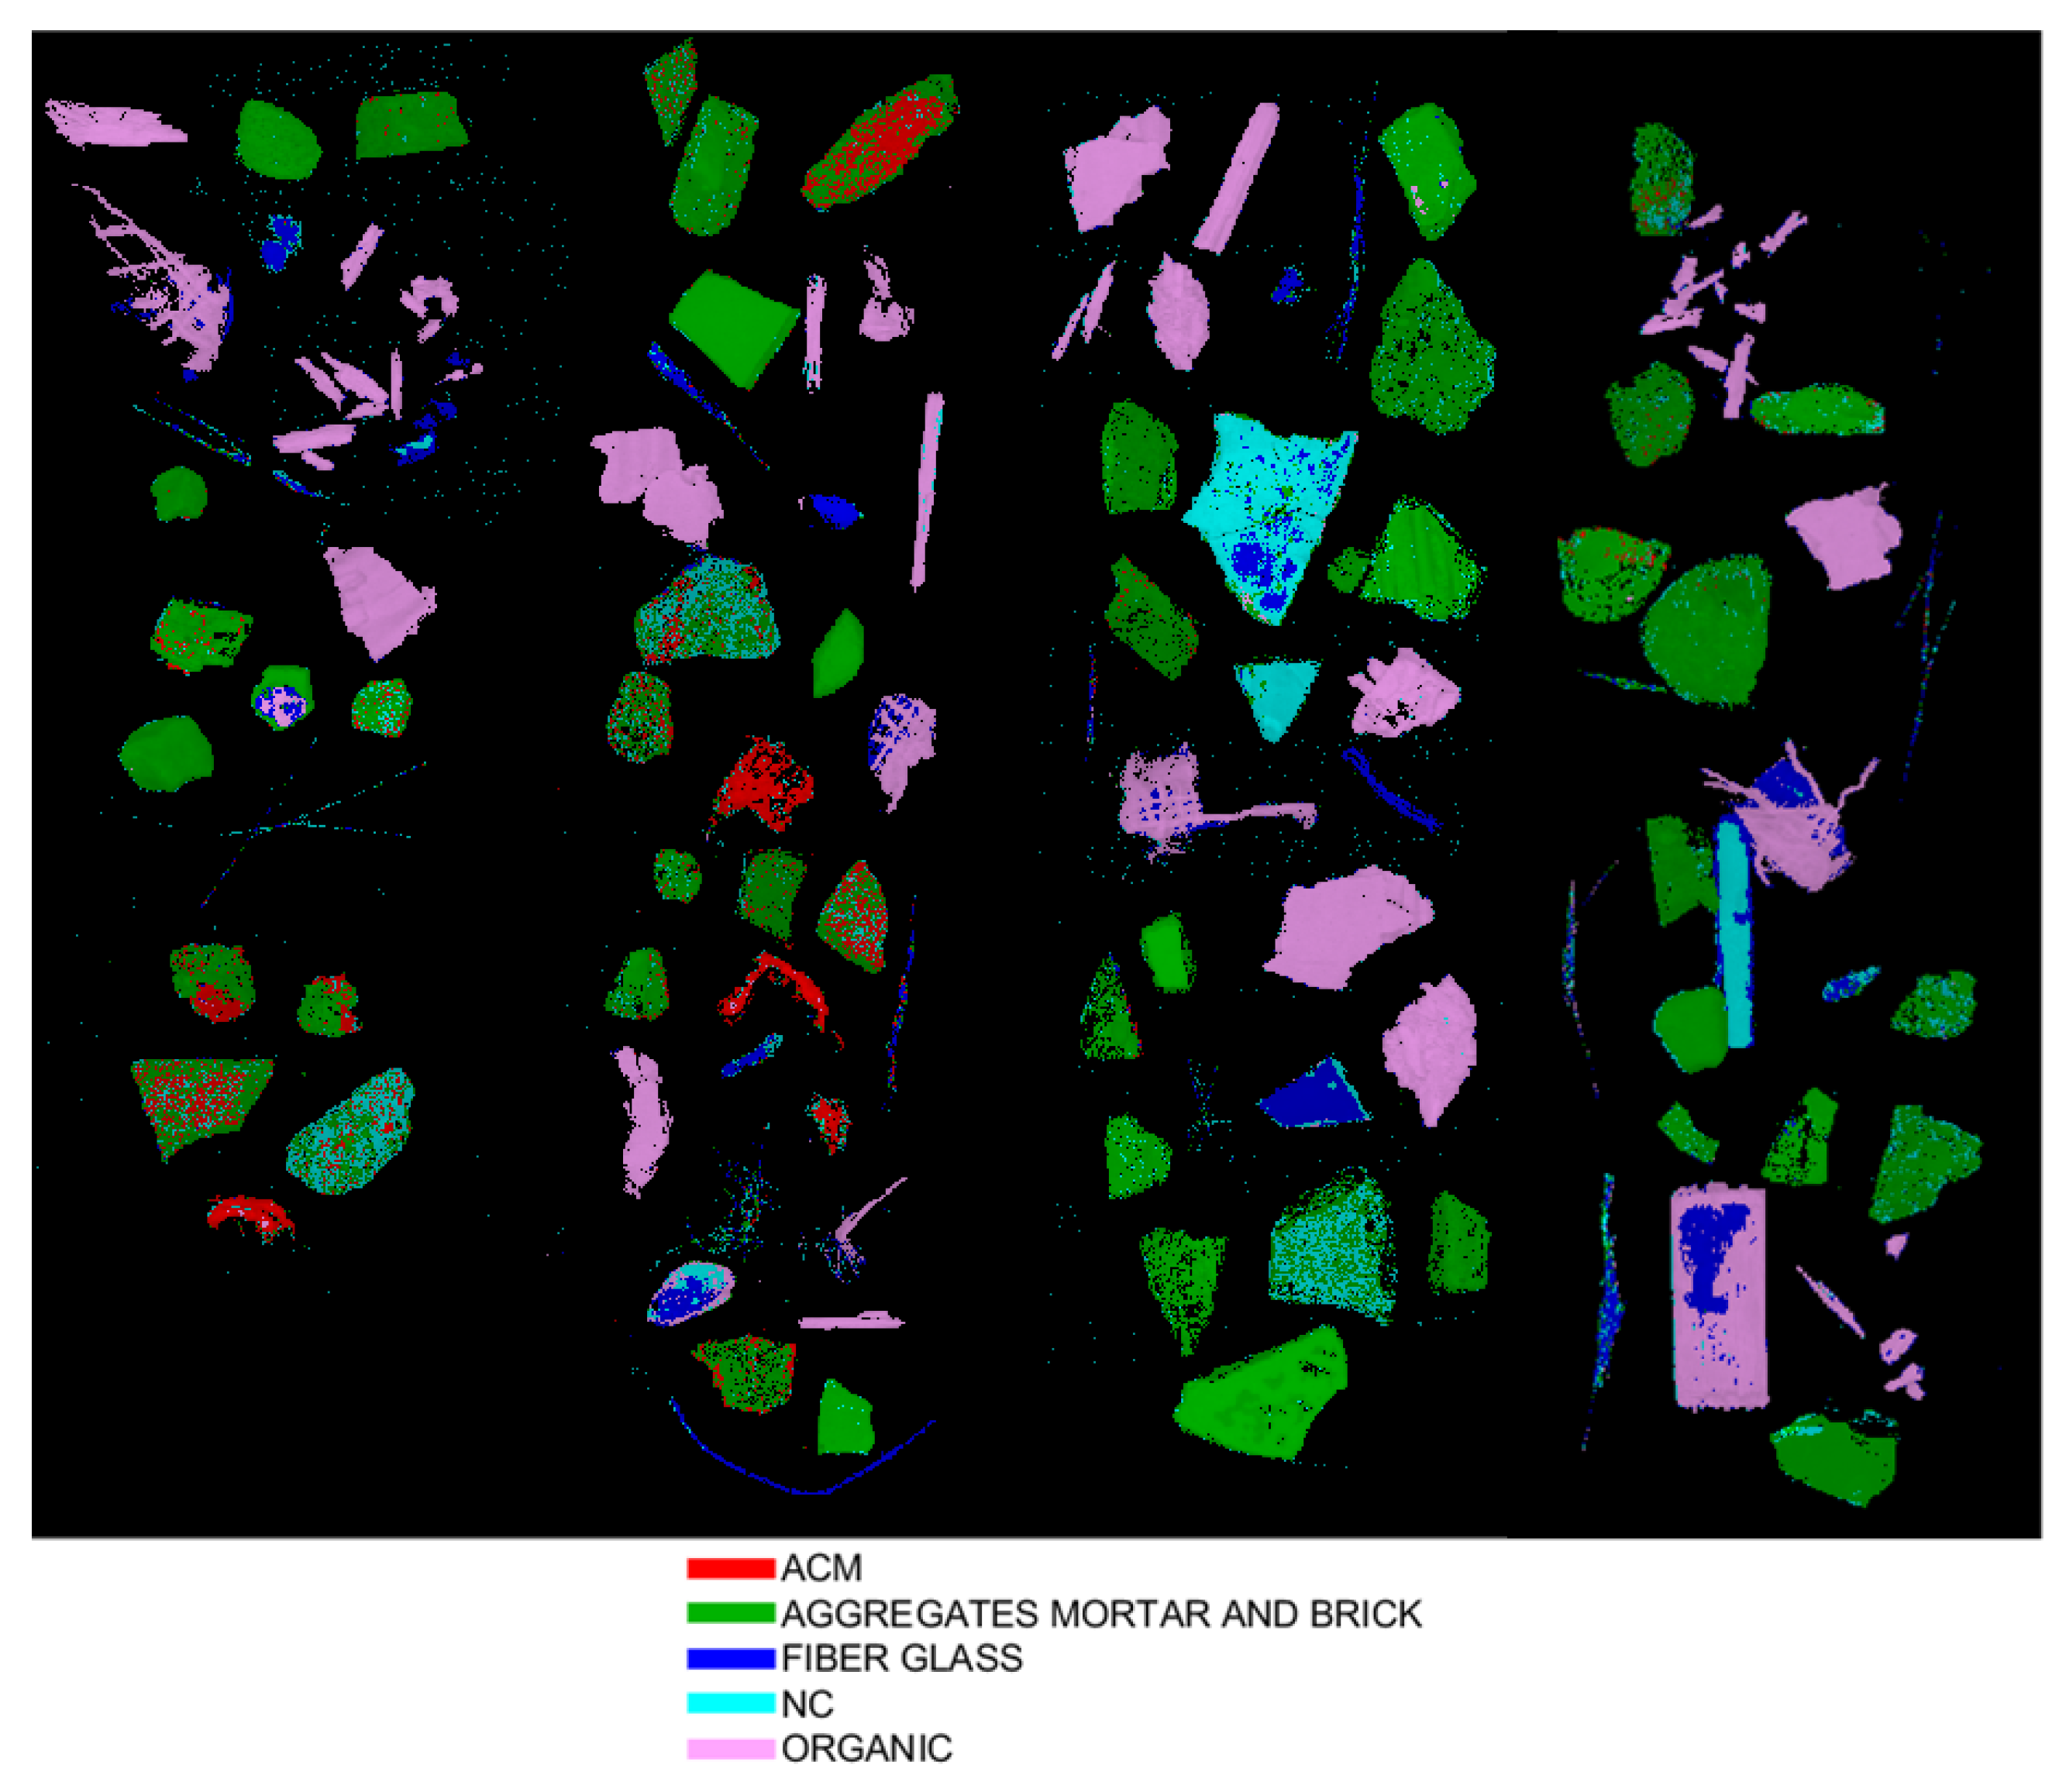
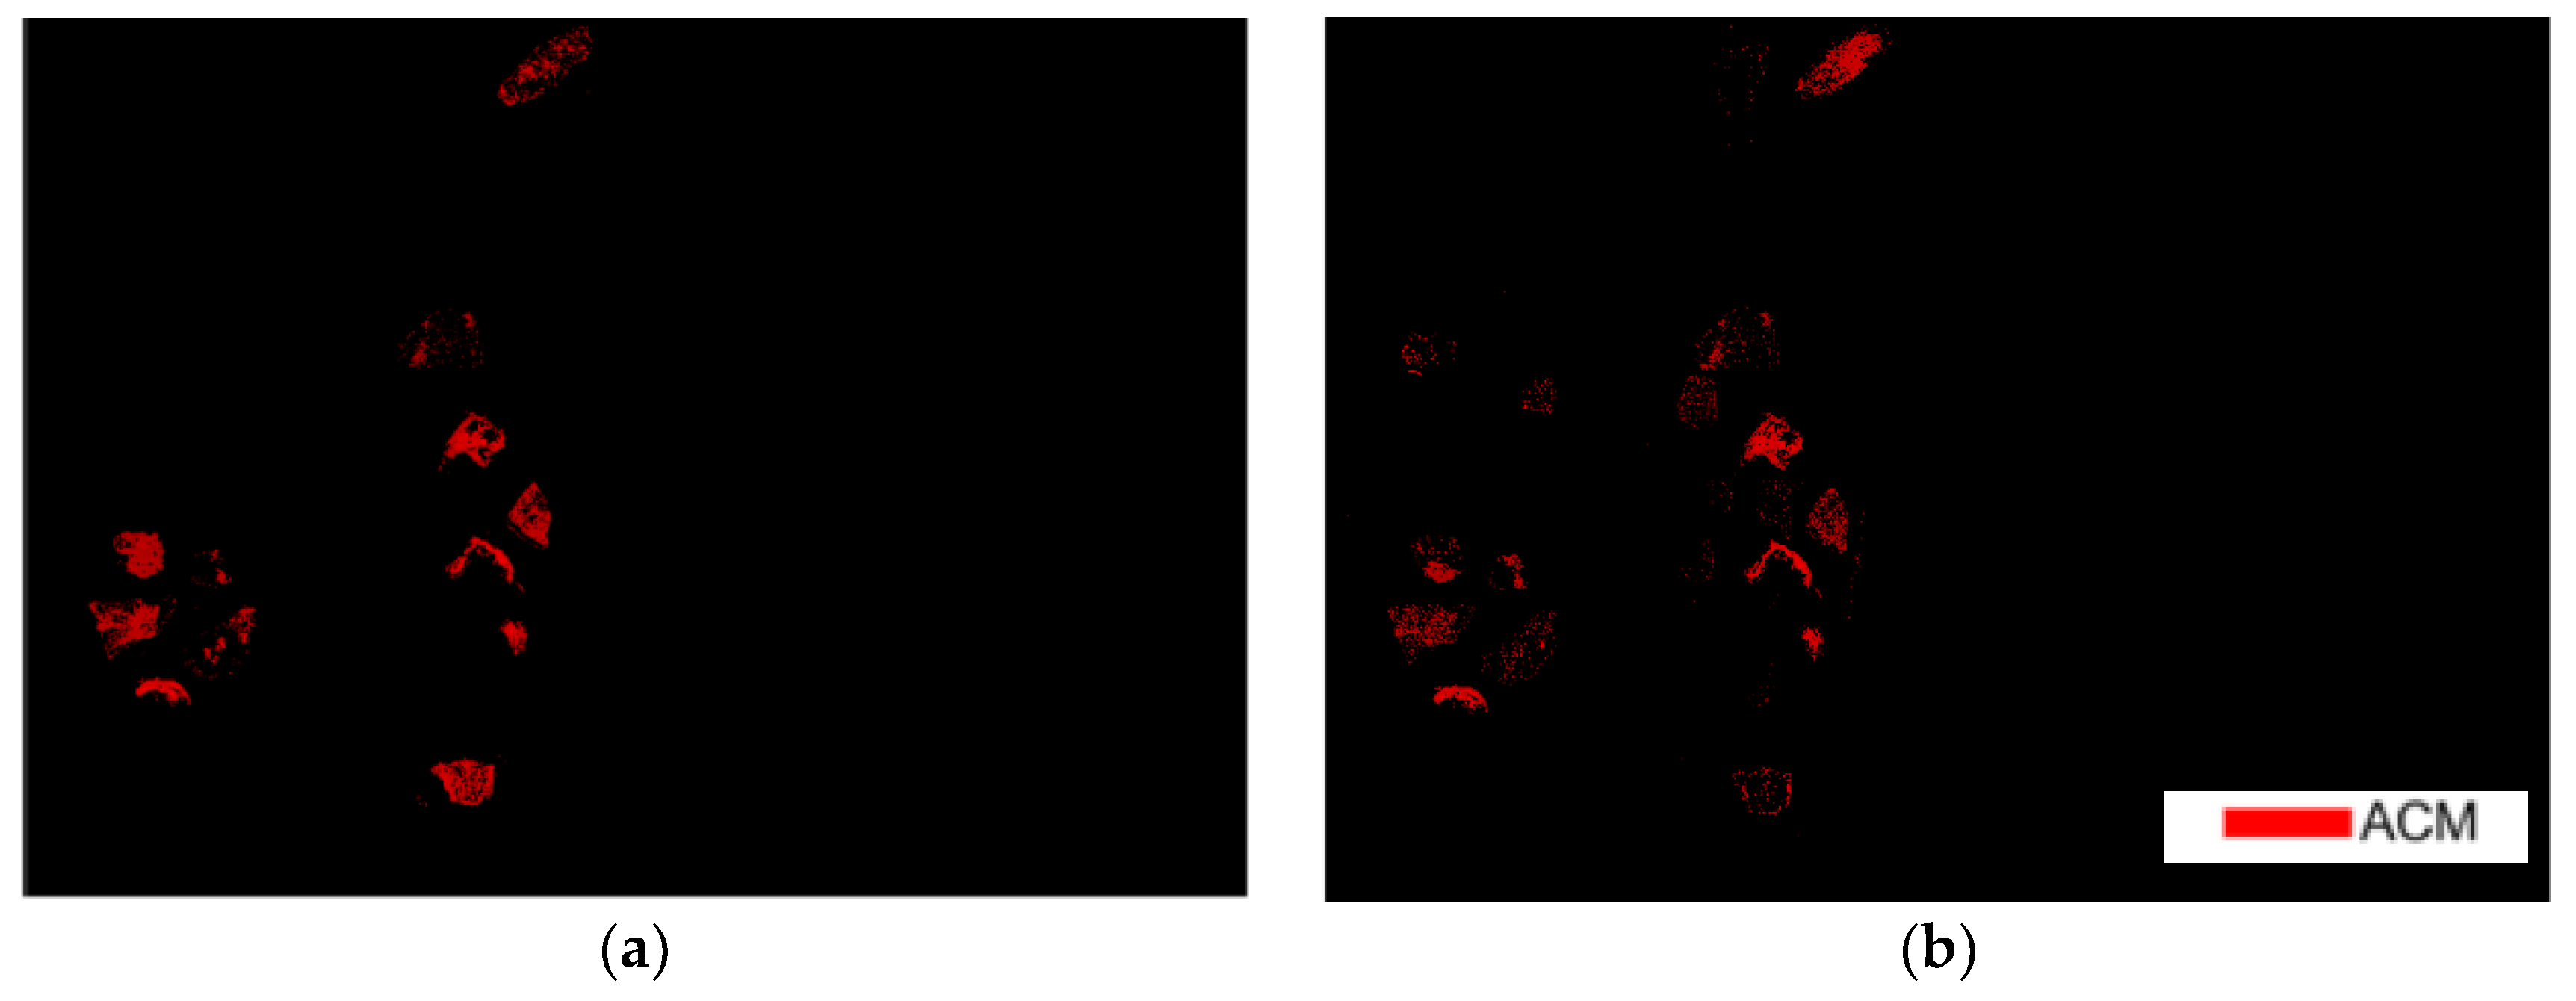
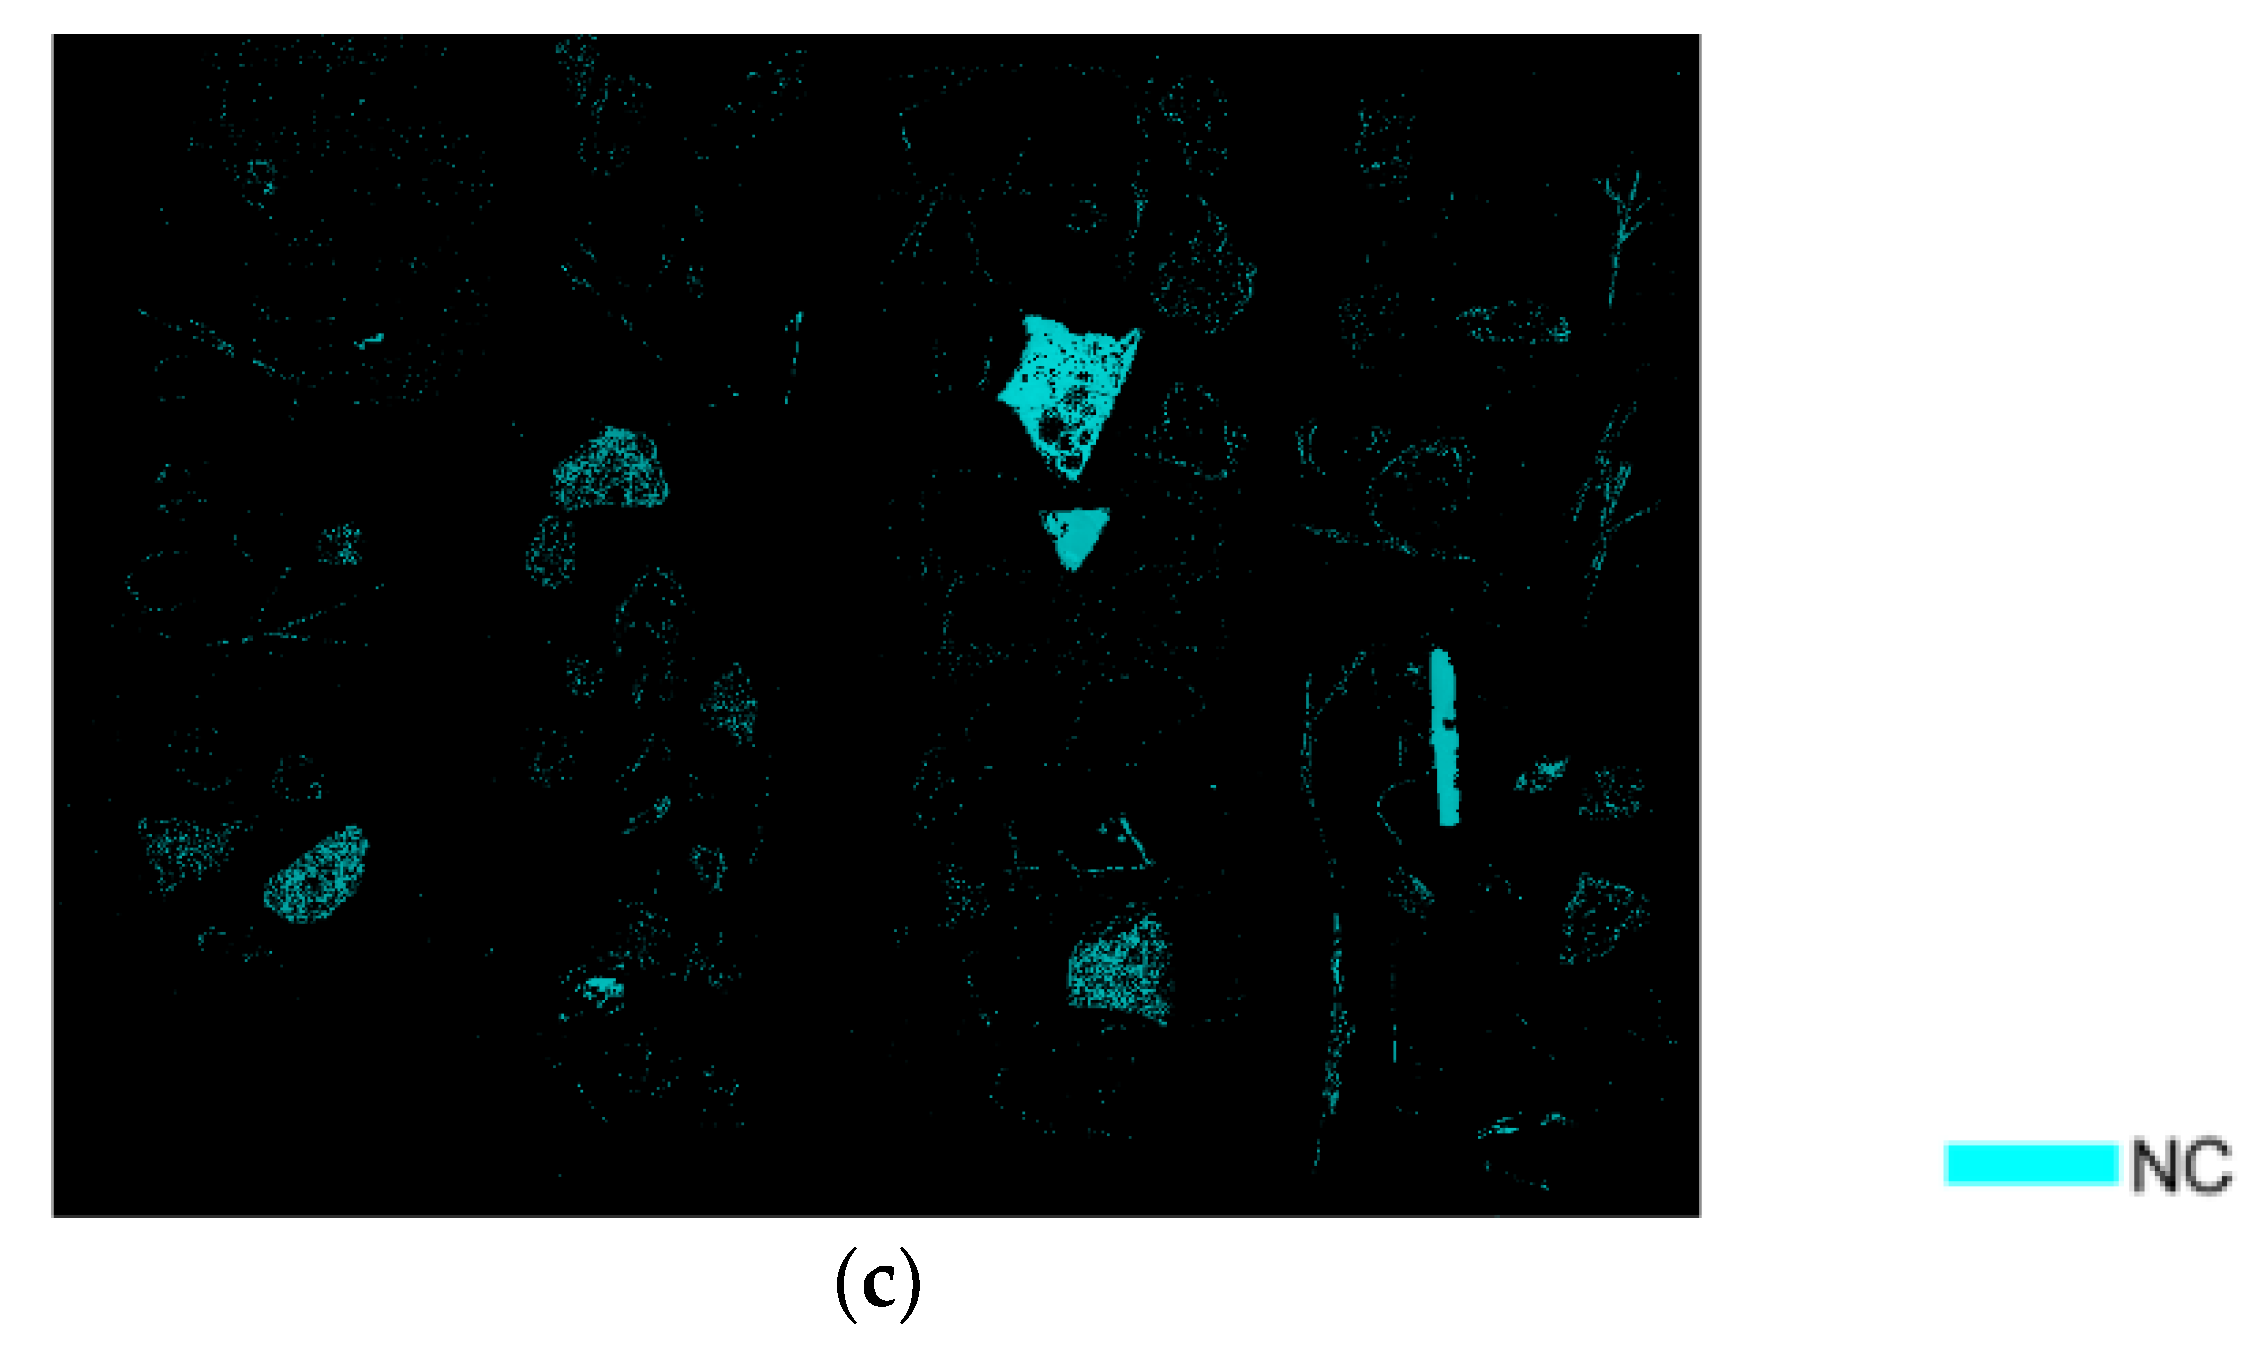
Four different acquisitions have been done. A mosaic procedure, as already mentioned, was applied to obtain a single hypercube. After background removal the sample set was divided in two subsets (Figure 2), in order “to define” a calibration and validation dataset.
The two subsets were utilized to perform calibration and validation, respectively. To optimize the identification of the asbestos in ACM, the dataset has been divided into four classes (i.e., asbestos, aggregates/mortar and brick, organic, fiberglass), as shown in Figure 2b. Classes have been selected according to spectra differences as resulting from PCA results as evidenced by PCA results [11]. The mean spectra of the selected classes (Figure 4) show the vibrational spectroscopic effects in the wavelength ranges of 1380–1400 nm (1st OH overtone) and 2320–2340 nm (Fe-OH and Mg-OH combination band), indicating the presence in the sample/s of asbestos fibers [11,12,13,14,15,16,17,18,19,20].
The selected acquisition resolution does not allow a spectral recognition of individual fibers. ACM spectral signatures are different in respect of C&DW uncontaminated materials. To improve separation between ACM and other C&DW materials, different preprocessing strategies were adopted to reduce light scattering and to emphasize spectral signatures.
Rules 1 and 2 have adopted in order to perform a separation among the classes (AGGREGATES MORTAR AND BRIC + ACM) and the classes (FIBER GLASS + ORGANIC). Rules 3 and 4 allowed to perform a further two steps classification allowing to preliminary detect ACM and AGGREGATES MORTAR AND BRICK and a further “refining” allowing the identification, inside the previously recognized ACM class, of AGGREGATES MORTAR AND BRICK and ORGANIC, erroneously attributes (i.e., “false positives2) to ACM class in rule 3. Error probably due to the lower size distribution of some AGGREGATES MORTAR AND BRICK and ORGANIC particles, in respect of those correctly identified. The adopted and applied preprocessing strategy were summarized in Table 1.
Mean spectra of each class after pre-processing are shown in Figure 5. Finally, after preprocessing, dataset was analyzed by PCA (Figure 6).
The first PCA (Figure 6a) shows significant difference between fiberglass and organic from other materials. The score plot shows, trough PC3, a separation of fiber glass and organic from aggregates mortar and brick. These features were used to define the rules of the hierarchical classification. The second PCA (Figure 6b) model shows a separation between fiberglass and organic. In the detail, PCA score plot highlights as similar cloud dimension (dispersion of each class) between organic and fiber glass with a quite marked separation trough PC3. These features were used define the rule 2. The class aggregates mortar and brick and ACM (Figure 6c) shows a high variability due to the different type of materials (i.e., different type of mortar and aggregate, brick, pottery, chrysotile, crocidolite, etc.). to perform the separation of mortar and aggregate, brick, pottery, etc. from ACM, a two PLS-DA based modelling was developed, implemented e set up. The first PLS-DA model (rule 3) allows to identify aggregate, mortars and brick from ACM with significant fingerprint differences. The second PLS-DA model (rule 4) (Figure 6d) discriminate ACM from aggregate, mortars, brick and organic materials characterized by similar fingerprint. The class fiberglass, inside ACM material, is characterized by fibers of different sizes, usually under 300 µm and showing a fingerprint similar to uncontaminated materials. The use of two different preprocessing strategies permits a better identification of spectral differences. These features were utilized to set up the rules 3 and 4.

3.2. Classification

The PLS-DA modelling based on rule 1, divides input data samples in 2 classes: FIBERGLASS/ORGANIC and ASBESTOS/AGGREGATES/MORTAR/BRICK. It shows a captured variance of 94.73% with seven latent variables. The Sensitivity and the Specificity of the model in calibration and cross validation are shown in Table 2.
The PLS-DA model following the rule 2, allows to perform an optimal discrimination between FIBER GLASS and/ ORGANIC material. It shows a captured variance of 99.53% with four latent variables. The Sensitivity and the Specificity of the rule 2 based model in calibration and cross validation are shown in Table 3.
The PLS-DA model for the rule 3, discriminates AGGREGATES/MORTAR/BRICK from ACM. It shows a variance capture of 92.41% with seven latent variables. The Sensitivity and the Specificity of model rule 3 in calibration and cross validation are shown in Table 4. The results reported in Table 4 clearly outlined as one of the major challenge of the proposed approach is to further increase the recognition between ACM and aggregates, mortar and bricks. Such a result is probably linked to the adopted resolution (i.e., acquired image field). On the other hand the goal of this study was to test the methodology at macro-scale. A resolution increase, that is an higher number of acquired spectra for investigated surface unit, should produce, for the rule 3, an increase of sensitivity. To perform the identification of asbestos materials and to reduce the number of false positive in ACM, rule 4 was defined. It was thus possible to discriminate ACM from AGGREGATES MORTAR AND BRICK + ORGANIC. The PLS-DA model for rule 4 shows a variance of 98.64% with six latent variables. The sensitivity and specificity of the model rule 4 in calibration, cross validation was shown in Table 5.
The results of hierarchical PLS-DA, applied to the validation dataset, are reported in Figure 7. The presence of asbestos in the composition was correctly recognized, while only a few pixels were identified as false positive. In Figure 8 are reported the pixels corresponding to the ACM present in the analyzed sample set (Figure 8a), the ACM pixels predicted by the developed PLS-DA hierarchical model (Figure 8b) and the pixels not assigned to any of the different defined classes (Figure 8c).
The comparison of Figure 8a,b shows how the ACM samples are all identifiable. The presence of false positives in general is low and in any case there is a clear difference in terms of the ACM predicted pixels and the pixels incorrectly assigned to the particles representative of not contaminated samples. The analysis of Figure 8c clearly shows as the unclassified pixels are due to the “border effect” present in all the analyzed samples and to the class NC (i.e., not classified individuals), that a class of material not containing asbestos (i.e., drywall) but, at the same time, not belonging, for their detected spectral attributes, to any of the previously defined classes, that is: AGGREGATES MORTAR AND BRICK, FIBER GLASS and ORGANIC. Although the obtained result does not negatively affect ACM identification, they also highlights how low spectral resolution generates more noise in prediction than that produced according to different set up adopted in our previous studies [20,36,39]. Increasing the number of the acquired samples, the noise effect will be reduced, thanks to the increase of spectral data set representative of each class.
A good classification was reached for each of the five classes of investigated C&DW mixed with ACM. The unclassified class identifies few samples of drywall and some mortars in which asbestos is present. The identification of the main fibers in the ACM samples was correctly achieved, only few mortar pixels have been classified as ACM, this misclassification not significantly affects ACM recognition. The mortars containing asbestos show, in fact, a spectrum whose characteristic embeds both mortar and smaller asbestos fiber spectral attributes.
The sample with ACM is correctly identified but, at this resolution, it is not possible to separate the asbestos fibers less than 300 µm from the mortar.

4. Discussion

The proposed approach clearly shows the potentiality of HSI sensing architectures for the identification of hazardous materials (i.e., ACM). The developed classification model shows a high quality in prediction (in terms of Sensitivity and Specificity), however being the C&DW characterized by a high variability in terms of constituents materials and/or embedding asbestos matrices. It is thus necessary a further data implementation in order to minimize false positives and false negatives. The use of tree models such as the hierarchical model makes possible to further implement classification following a dynamic approach linked to materials characteristics. The reduction of hardware cost for HSI equipment combined with a major power of computational analysis could dramatically contribute to increase the use of this technique for the identification of contaminated areas also reducing workers risks.

5. Conclusions

A study was carried out to investigate the possibility to classify by SWIR-HSI different C&DW, including ACM, whose recognition continue to be quite challenging to minimize special waste landfilling. The results were evaluated in terms of efficiency and reliability, with the specific aim to design and set up multivariate processing/recognition strategies maximizing ACM waste identification. The proposed approach confirms the potentialities of the HSI based technique for identification of ACM. It is possible to recognize the presence of asbestos, without any physical sampling of the material; finally, the proposed procedures can be directly applied “on site”, that is where the materials and/or products are placed. Although in this case of study there is a limit of detectability of fibers (i.e., pixel resolution), the acquisition at higher magnifications would contribute to reducing false positives (i.e., acquisition of a greater number of spectra able to characterize the ACM class). Adopting this strategy, it is possible to further improve the predictive capacity of the ACM class by reducing the possibility of error. A future development of this approach collecting and analyzing more spectral data of ACM and C&DW will allow the increase of performance for the identification of asbestos in construction and demolition waste.

Author Contributions

G.C. and S.S.; methodology, S.S.; software, G.C.; validation, G.C., G.B. and S.S.; formal analysis, G.C. and S.S.; investigation, G.C. and S.S.; resources, S.S. and G.B.; data curation, G.C. and S.S.; writing—original draft preparation, G.C.; writing—review and editing, G.B. and S.S.; visualization, G.B.; supervision, S.S.; project administration, G.C. and S.S.; funding acquisition, G.B. and S.S.

Funding

This research received no external funding.

Acknowledgments

Authors wish to thank Stefano Massera (VERAM srl, Rome, Italy) to have provided the reference asbestos samples and the ACMs samples.

Conflicts of Interest

The authors declare no conflict of interest.

References

  1. Ringen, K. Safety and Health in the Construction Industry. Annu. Rev. Public Health 1995. [Google Scholar] [CrossRef] [PubMed]
  2. Gualtieri, A.F. Mineral fibre-based building materials and their health hazards. In Toxicity of Building Materials; Pacheco-Torgal, F., Jalali, S., Fucic, A., Eds.; Woodhead Publishing: Cambridge, UK, 2012; pp. 166–195. [Google Scholar] [CrossRef]
  3. Bloise, A.; Miriello, D. Multi-Analytical Approach for Identifying Asbestos Minerals In Situ. Geosciences 2018. [Google Scholar] [CrossRef]
  4. World Health Organizations (WHO). Asbestos and Other Natural Mineral Fibres, Environmental Health Criteria; World Health Organization: Geneva, Switzerland, 1986; Volume 53, p. 194. [Google Scholar]
  5. Van Zandwijk, N.; Clarke, C.; Henderson, D.; Musk, A.W.; Fong, K.; Nowak, A.; Loneragan, R.; McCaughan, B.; Boyer, M.; Feigen, M.; et al. Guidelines for the diagnosis and treatment of malignant pleural mesothelioma. J. Thorac. Dis. 2013. [Google Scholar] [CrossRef]
  6. Brusselmans, L.; Arnouts, L.; Millevert, C.; Vandersnickt, J.; van Meerbeeck, J.P.; Lamote, K. Breath analysis as a diagnostic and screening tool for malignant pleural mesothelioma: A systematic review. Transl. Lung Cancer Res. 2018. [Google Scholar] [CrossRef] [PubMed]
  7. Bloise, A.; Catalano, M.; Critelli, T.; Apollaro, C.; Miriello, D. Naturally occurring asbestos: Potential for human exposure, San Severino Lucano (Basilicata, Southern Italy). Environ. Earth Sci. 2017. [Google Scholar] [CrossRef]
  8. Groppo, C.; Rinaudo, C.; Cairo, S.; Gastaldi, D.; Compagnoni, R. Micro-Raman spectroscopy for a quick and reliable identification of serpentine minerals from ultramafics. Eur. J. Mineral. 2006. [Google Scholar] [CrossRef]
  9. Vigliaturo, R.; Capella, S.; Rinaudo, C.; Belluso, E. “Rinse and trickle”: A protocol for TEM preparation and investigation of inorganic fibers from biological material. Inhal. Toxicol. 2016. [Google Scholar] [CrossRef]
  10. Gualtieri, A.F.; Gandolfi, N.B.; Pollastri, S.; Rinaldi, R.; Sala, O.; Martinelli, G.; Bacci, T.; Paoli, F.; Viani, A.; Vigliaturo, R. Assessment of the potential hazard represented by natural raw materials containing mineral fibres—The case of the feldspar from Orani, Sardinia (Italy). J. Hazard. Mater. 2018. [Google Scholar] [CrossRef]
  11. Bonifazi, G.; Capobianco, G.; Serranti, S. Asbestos containing materials detection and classification by the use of hyperspectral imaging. J. Hazard. Mater. 2018. [Google Scholar] [CrossRef]
  12. Jehlička, J.; Vítek, P.; Edwards, H.G.M.; Heagraves, M.; Čapoun, T. Application of portable Raman instruments for fast and non-destructive detection of minerals on outcrops. Spectrochim. Acta Part A Mol. Biomol. Spectrosc. 2009. [Google Scholar] [CrossRef]
  13. Petriglieri, J.R.; Laporte-Magoni, C.; Salvioli-Mariani, E.; Gunkel-Grillon, P.; Tribaudino, M.; Mantovani, L.; Bersani, D.; Lottici, P.; Tomatis, M. Monitoring environmental risk in fibrous minerals in New Caledonia: A comparison between different analytical methods. In Proceedings of the EGU General Assembly Conference Abstracts, Vienna, Austria, 23–28 April 2017; Volume 19, p. 14544. [Google Scholar]
  14. Valouma, A.; Verganelaki, A.; Tetoros, I.; Maravelaki-Kalaitzaki, P.; Gidarakos, E. Magnesium oxide production from chrysotile asbestos detoxification with oxalic acid treatment. J. Hazard. Mater. 2017. [Google Scholar] [CrossRef] [PubMed]
  15. Colangelo, F.; Cioffi, R.; Lavorgna, M.; Verdolotti, L.; De Stefano, L. Treatment and recycling of asbestos-cement containing waste. J. Hazard. Mater. 2011. [Google Scholar] [CrossRef] [PubMed]
  16. Krówczyńska, M.; Wilk, P.; Pabjanek, E.; Kycko, M. Hyperspectral discrimination of asbestos-cement roofing. Geomat. Environ. Eng. 2017, 11, 47–65. [Google Scholar] [CrossRef]
  17. Frassy, F.; Candiani, G.; Rusmini, M.; Maianti, P.; Marchesi, A.; Nodari, F.R.; Via, G.D.; Albonico, C.; Gianinetto, M. Mapping asbestos-cement roofing with hyperspectral remote sensing over a large mountain region of the Italian western alps. Sensors 2014, 14, 15900–15913. [Google Scholar] [CrossRef] [PubMed]
  18. Taherzadeh, E.; Shafri, H.Z.M. Using hyperspectral remote sensing data in urban mapping over Kuala Lumpur. Jt. Urban Remote Sens. Event 2011, 2011, 405–408. [Google Scholar] [CrossRef]
  19. Krówczyńska, M.; Wilk, E.; Pabjanek, P.; Zagajewski, B.; Meuleman, K. Mapping asbestos-cement roofing with the use of APEX hyperspectral airborne imagery: Karpacz area, Poland−a case study. Misc. Geogr. 2016, 20, 41–46. [Google Scholar] [CrossRef]
  20. Bonifazi, G.; Capobianco, G.; Serranti, S. Hyperspectral imaging applied to the identification and classification of asbestos fibers. Sensors 2015. [Google Scholar] [CrossRef]
  21. Bonifazi, G.; Capobianco, G.; Serranti, S. A fast and reliable approach for asbestos recognition in complex matrices adopting an hyperspectral imaging based approach. In Proceedings of the 5th International Conference on Industrial & Hazardous Waste Management, Chania, Greece, 27–30 September 2016; pp. 27–30. [Google Scholar]
  22. Bonifazi, G.; Capobianco, G.; Serranti, S. Asbestos recognition in construction and demolition waste by hyperspectral imaging. In Proceedings of the 6th International Conference on Industrial & Hazardous Waste Management, Chania, Greece, 4–7 September 2018. [Google Scholar]
  23. Ferrari, C.; Foca, G.; Ulrici, A. Handling large datasets of hyperspectral images: Reducing data size without loss of useful information. Anal. Chim. Acta 2013, 802, 29–39. [Google Scholar] [CrossRef]
  24. Burger, J.; Gowen, A. Data handling in hyperspectral image analysis. Chemom. Intell. Lab. Syst. 2011, 1081, 13–22. [Google Scholar] [CrossRef]
  25. Yamate, G.; Agarwal, S.C.; Gibbons, R.D. Methodology for the Measurement of Airborne Asbestos by Electron Microscopy; IIT Research Institute: Chicago, IL, USA, 1984. [Google Scholar]
  26. American Society for Testing and Materials. D-22 Proposal, P 236, Proposed Test Method for Asbestos Containing Materials by Polarized Light Microscopy; ASTM Gray: Washington, DC, USA, 1993; pp. 873–878. [Google Scholar]
  27. Hunt, G.G. Spectral signatures of particulate minerals in the visible and nearinfrared. Geophysics 1977, 42, 501–513. [Google Scholar] [CrossRef]
  28. Mars, J.C.; Rowan, L.C. Spectral assessment of new ASTER SWIR surface reflectance data products for spectroscopic mapping of rocks and minerals. Remote Sens. Environ. 2010, 114, 2011–2025. [Google Scholar] [CrossRef]
  29. Bonifazi, G.; Capobianco, G.; Serranti, S. A hierarchical classification approach for recognition of low-density (LDPE) and high-density polyethylene (HDPE) in mixed plastic waste based on short-wave infrared (SWIR) hyperspectral imaging. Spectrochim. Acta Part A Mol. Biomol. Spectrosc. 2018, 198, 115–122. [Google Scholar] [CrossRef] [PubMed]
  30. Pabón, R.E.C.; de Souza Filho, C.R.; de Oliveira, W.J. Reflectance and imaging spectroscopy applied to detection of petroleum hydrocarbon pollution in bare soils. Sci. Total Environ. 2019, 649, 1224–1236. [Google Scholar] [CrossRef] [PubMed]
  31. Pelosi, C.; Capobianco, G.; Agresti, G.; Bonifazi, G.; Morresi, F.; Rossi, S.; Santamaria, U.; Serranti, S. A methodological approach to study the stability of selected watercolours for painting reintegration, through reflectance spectrophotometry, Fourier transform infrared spectroscopy and hyperspectral imaging. Spectrochim. Acta Part A Mol. Biomol. Spectrosc. 2018, 198, 92–106. [Google Scholar] [CrossRef]
  32. Kimuli, D.; Wang, W.; Jiang, H.; Zhao, X.; Chu, X. Application of SWIR hyperspectral imaging and chemometrics for identification of aflatoxin B1 contaminated maize kernels. Infrared Phys. Technol. 2018, 89, 351–362. [Google Scholar] [CrossRef]
  33. Kucheryavskiy, S. A new approach for discrimination of objects on hyperspectral images. Chemom. Intell. Lab. Syst. 2013, 120, 126–135. [Google Scholar] [CrossRef]
  34. Calvini, R.; Foca, G.; Ulrici, A. Data dimensionality reduction and data fusion for fast characterization of green coffee samples using hyperspectral sensors. Anal. Bioanal. Chem. 2016, 40826, 7351–7366. [Google Scholar] [CrossRef]
  35. Calvini, R.; Orlandi, G.; Foca, G.; Ulrici, A. Development of a classification algorithm for efficient handling of multiple classes in sorting systems based on hyperspectral imaging. J. Spectr. Imaging 2018, 7, a13. [Google Scholar] [CrossRef]
  36. Bonifazi, G.; Capobianco, G.; Palmieri, R.; Serranti, S. Hyperspectral imaging applied to the waste recycling sector. Spectrosc. Eur. 2019, 31, 8–11. [Google Scholar]
  37. Filzmoser, P.; Gschwandtner, M.; Todorov, V. Review of sparse methods in regression and classification with application to chemometrics. J. Chemometr. 2012, 26, 42. [Google Scholar] [CrossRef]
  38. Agresti, G.; Bonifazi, G.; Capobianco, G.; Lanteri, L.; Pelosi, C.; Serranti, S.; Veneri, A. Tattoo Wall: Study of the stability of an innovative decorative technique through hyperspectral imaging and possible application in the mural painting’s restoration. In Proceedings of the Optics for Arts, Architecture, and Archaeology VII, International Society for Optics and Photonics, Munich, Germany, 24–27 June 2019; Volume 11058, p. 110581G. [Google Scholar]
  39. Serranti, S.; Bonifazi, G.; Capobianco, G.; Malinconico, S.; Paglietti, F. Hyperspectral imaging applied to asbestos containing materials detection: Specimen preparation and handling. In Proceedings of the Advanced Environmental, Chemical, and Biological Sensing Technologies XV, International Society for Optics and Photonics, Baltimore, MA, USA, 10 May 2019; Volume 11007, p. 110070S. [Google Scholar]
  40. Calvini, R.; Amigo, J.M.; Ulrici, A. Transferring results from NIR-hyperspectral to NIR-multispectral imaging systems: A filter-based simulation applied to the classification of Arabica and Robusta green coffee. Anal. Chim. Acta 2017, 967, 33–41. [Google Scholar] [CrossRef] [PubMed]
  41. Zaini, N.; van der Meer, F.; van der Werff, H. Determination of carbonate rock chemistry using laboratory-based hyperspectral imagery. Remote Sens. 2014, 65, 4149–4172. [Google Scholar] [CrossRef]
  42. Bro, R.; Smilde, A.K. Principal component analysis. Anal. Methods 2014, 69, 2812–2831. [Google Scholar] [CrossRef]
  43. Ballabio, D.; Consonni, V. Classification tools in chemistry. Part 1: Linear models. PLS-DA. Anal. Methods 2013, 516, 3790–3798. [Google Scholar] [CrossRef]
  44. Monakhova, Y.B.; Hohmann, M.; Christoph, N.; Wachter, H.; Rutledge, D.N. Rutledge Improved classification of fused data: Synergetic effect of partial least squares discriminant analysis (PLS-DA) and common components and specific weights analysis (CCSWA) combination as applied to tomato profiles (NMR, IR and IRMS). Chemom. Intell. Lab. Syst. 2016, 156, 1–6. [Google Scholar] [CrossRef]
  45. Burger, J.E.; Gowen, A.A. Classification and prediction methods. In Hyperspectral Imaging Technology in Food and Agriculture; Food Engineering Series; Park, B., Lu, R., Eds.; Springer: New York, NY, USA, 2015; Chapter 5; pp. 103–124. [Google Scholar]
  46. Vidal, M.; Amigo, J.M. Pre-processing of hyperspectral images. Essential steps before image analysis. Chemom. Intell. Lab. Syst. 2012, 117, 138–148. [Google Scholar] [CrossRef]
  47. Amigo, J.M.; Santos, C. Preprocessing of hyperspectral and multispectral images. In Data Handling in Science and Technology; Morrissey, K., Ed.; Elsevier: Amsterdam, The Netherlands, 2020; Volume 32, pp. 37–53. [Google Scholar]
  48. Rinnan, Å.; Van Den Berg, F.; Engelsen, S.B. Review of the most common pre-processing techniques for near-infrared spectra. TrAC Trends Anal. Chem. 2009, 2810, 1201–1222. [Google Scholar] [CrossRef]
Figure 1. RGB color images of the acquired Asbestos Containing Materials (ACM) and Construction and Demolition Waste (C&DW) samples (a) and corresponding identification maps (b).
Applsci 09 04587 g001
Figure 2. Hypercube image as resulting after mosaicking and samples individuals splitting in two data sets one to be utilized for calibration and the other for their validation (a). Four classes have been defined inside the data set (b). The class asbestos is referred to ACM individuals.
Applsci 09 04587 g002
Figure 3. Dendrogram showing the hierarchical model built to classify the ACM and C&DW.
Applsci 09 04587 g003
Figure 4. Average spectra of the different classes selected as results of PCA application to samples constituting the calibration data set.
Applsci 09 04587 g004
Figure 5. Average preprocessed spectra considered to set up the rules in the developed hierarchical model obtained applying Standard Normal Variate (SNV) and Mean Center (MC) (rule 1) (a); MC (rule 2) (b); SNV and 1st Derivative (order: 2, window: 33 pt, tails: polyinterp) and MC (rule 3) (c) and SNV and Smoothing (order: 0, window: 11 pt) and MC (rule 4) (d).
Applsci 09 04587 g005
Figure 6. PCA score plot utilized to perform data calibration according to the different hierarchical modelling rules defined and applied for classification (a): rule 1—Standard Normal Variate (SNV) and Mean Center (MC), (b): rule 2—MC, (c): rule 3—SNV Smoothing and (d): rule—MC. The components allowing the greater separation among classes are shown in the score plots.
Applsci 09 04587 g006
Figure 7. Prediction maps obtained applying the developed hierarchical PLS-DA classifier C&DW “polluted” with asbestsos.
Applsci 09 04587 g007
Figure 8. Maps related to: (a) ACM pixels present in the analyzed sample set, (b) ACM pixels predicted by the developed PLS-DA hierarchical model and (c) pixels not assigned to any of the defined classes.
Applsci 09 04587 g008aApplsci 09 04587 g008b
Table 1. Description of the pre-processing strategies applied to the spectra of the different C&DW for each rule.
RulePreprocessingClassification Output
1Standard Normal Variate (SNV)
Mean Center (MC)
  • AGGREGATES MORTAR AND BRIC + ACM
  • FIBER GLASS + ORGANIC
2Mean Center (MC)
  • FIBER GLASS
  • ORGANIC
3Standard Normal Variate (SNV)
1st Derivative * Mean Center (MC)
  • ACM
  • AGGREGATES MORTAR AND BRICK
4Standard Normal Variate (SNV)
and Smoothing **
Mean Center (MC)
  • ACM
  • AGGREGATES MORTAR AND BRICK
  • ORGANIC
* (order: 2, window: 33 pt and tails: polyinterp). ** (order: 0 and window: 11 pt).
Table 2. Sensitivity and Specificity in calibration (Cal) and cross validation (CV) of the Partial Least Squares Discriminant Analysis (PLS-DA) rule 1 based classifier.
rule 1AGGREGATES
MORTAR AND BRICK + ACM
FIBER GLASS + ORGANIC
Sensitivity (Cal):95.195.6
Specificity (Cal):95.695.1
Sensitivity (CV):95.195.5
Specificity (CV):95.595.1
Table 3. Sensitivity and Specificity in calibration (Cal) and cross validation (CV) of the Partial Least Squares Discriminant Analysis (PLS-DA) rule 2 based classifiers.
rule 2FIBER GLASSORGANIC
Sensitivity (Cal):10097.3
Specificity (Cal):97.3100
Sensitivity (CV):10097.3
Specificity (CV):97.3100
Table 4. Sensitivity and Specificity in calibration (Cal) and cross validation (CV) of the Partial Least Squares Discriminant Analysis (PLS-DA) rule 3 based classifiers.
rule 3ACMAGGREGATES AND MORTAR + BRICK
Sensitivity (Cal):77.394.4
Specificity (Cal):94.473.3
Sensitivity (CV):72.894.4
Specificity (CV):94.472.8
Table 5. Sensitivity and Specificity in calibration (Cal) and cross validation (CV) of the Partial Least Squares Discriminant Analysis (PLS-DA) rule 4 based classifiers.
rule 4ACMAGGREGATES AND MORTAR + BRICKORGANIC
Sensitivity (Cal):94.08999.9
Specificity (Cal):95.490.297.7
Sensitivity (CV):94.08999.9
Specificity (CV):95.490.297.7

