Super-Multi-Junction Solar Cells—Device Configuration with the Potential for More Than 50% Annual Energy Conversion Efficiency (Non-Concentration)


 ,
, 
 and
and 
Abstract
Featured Application
Abstract
1. Introduction
2. Model
2.1. What Is the Super-Multi-Junction Solar Cell
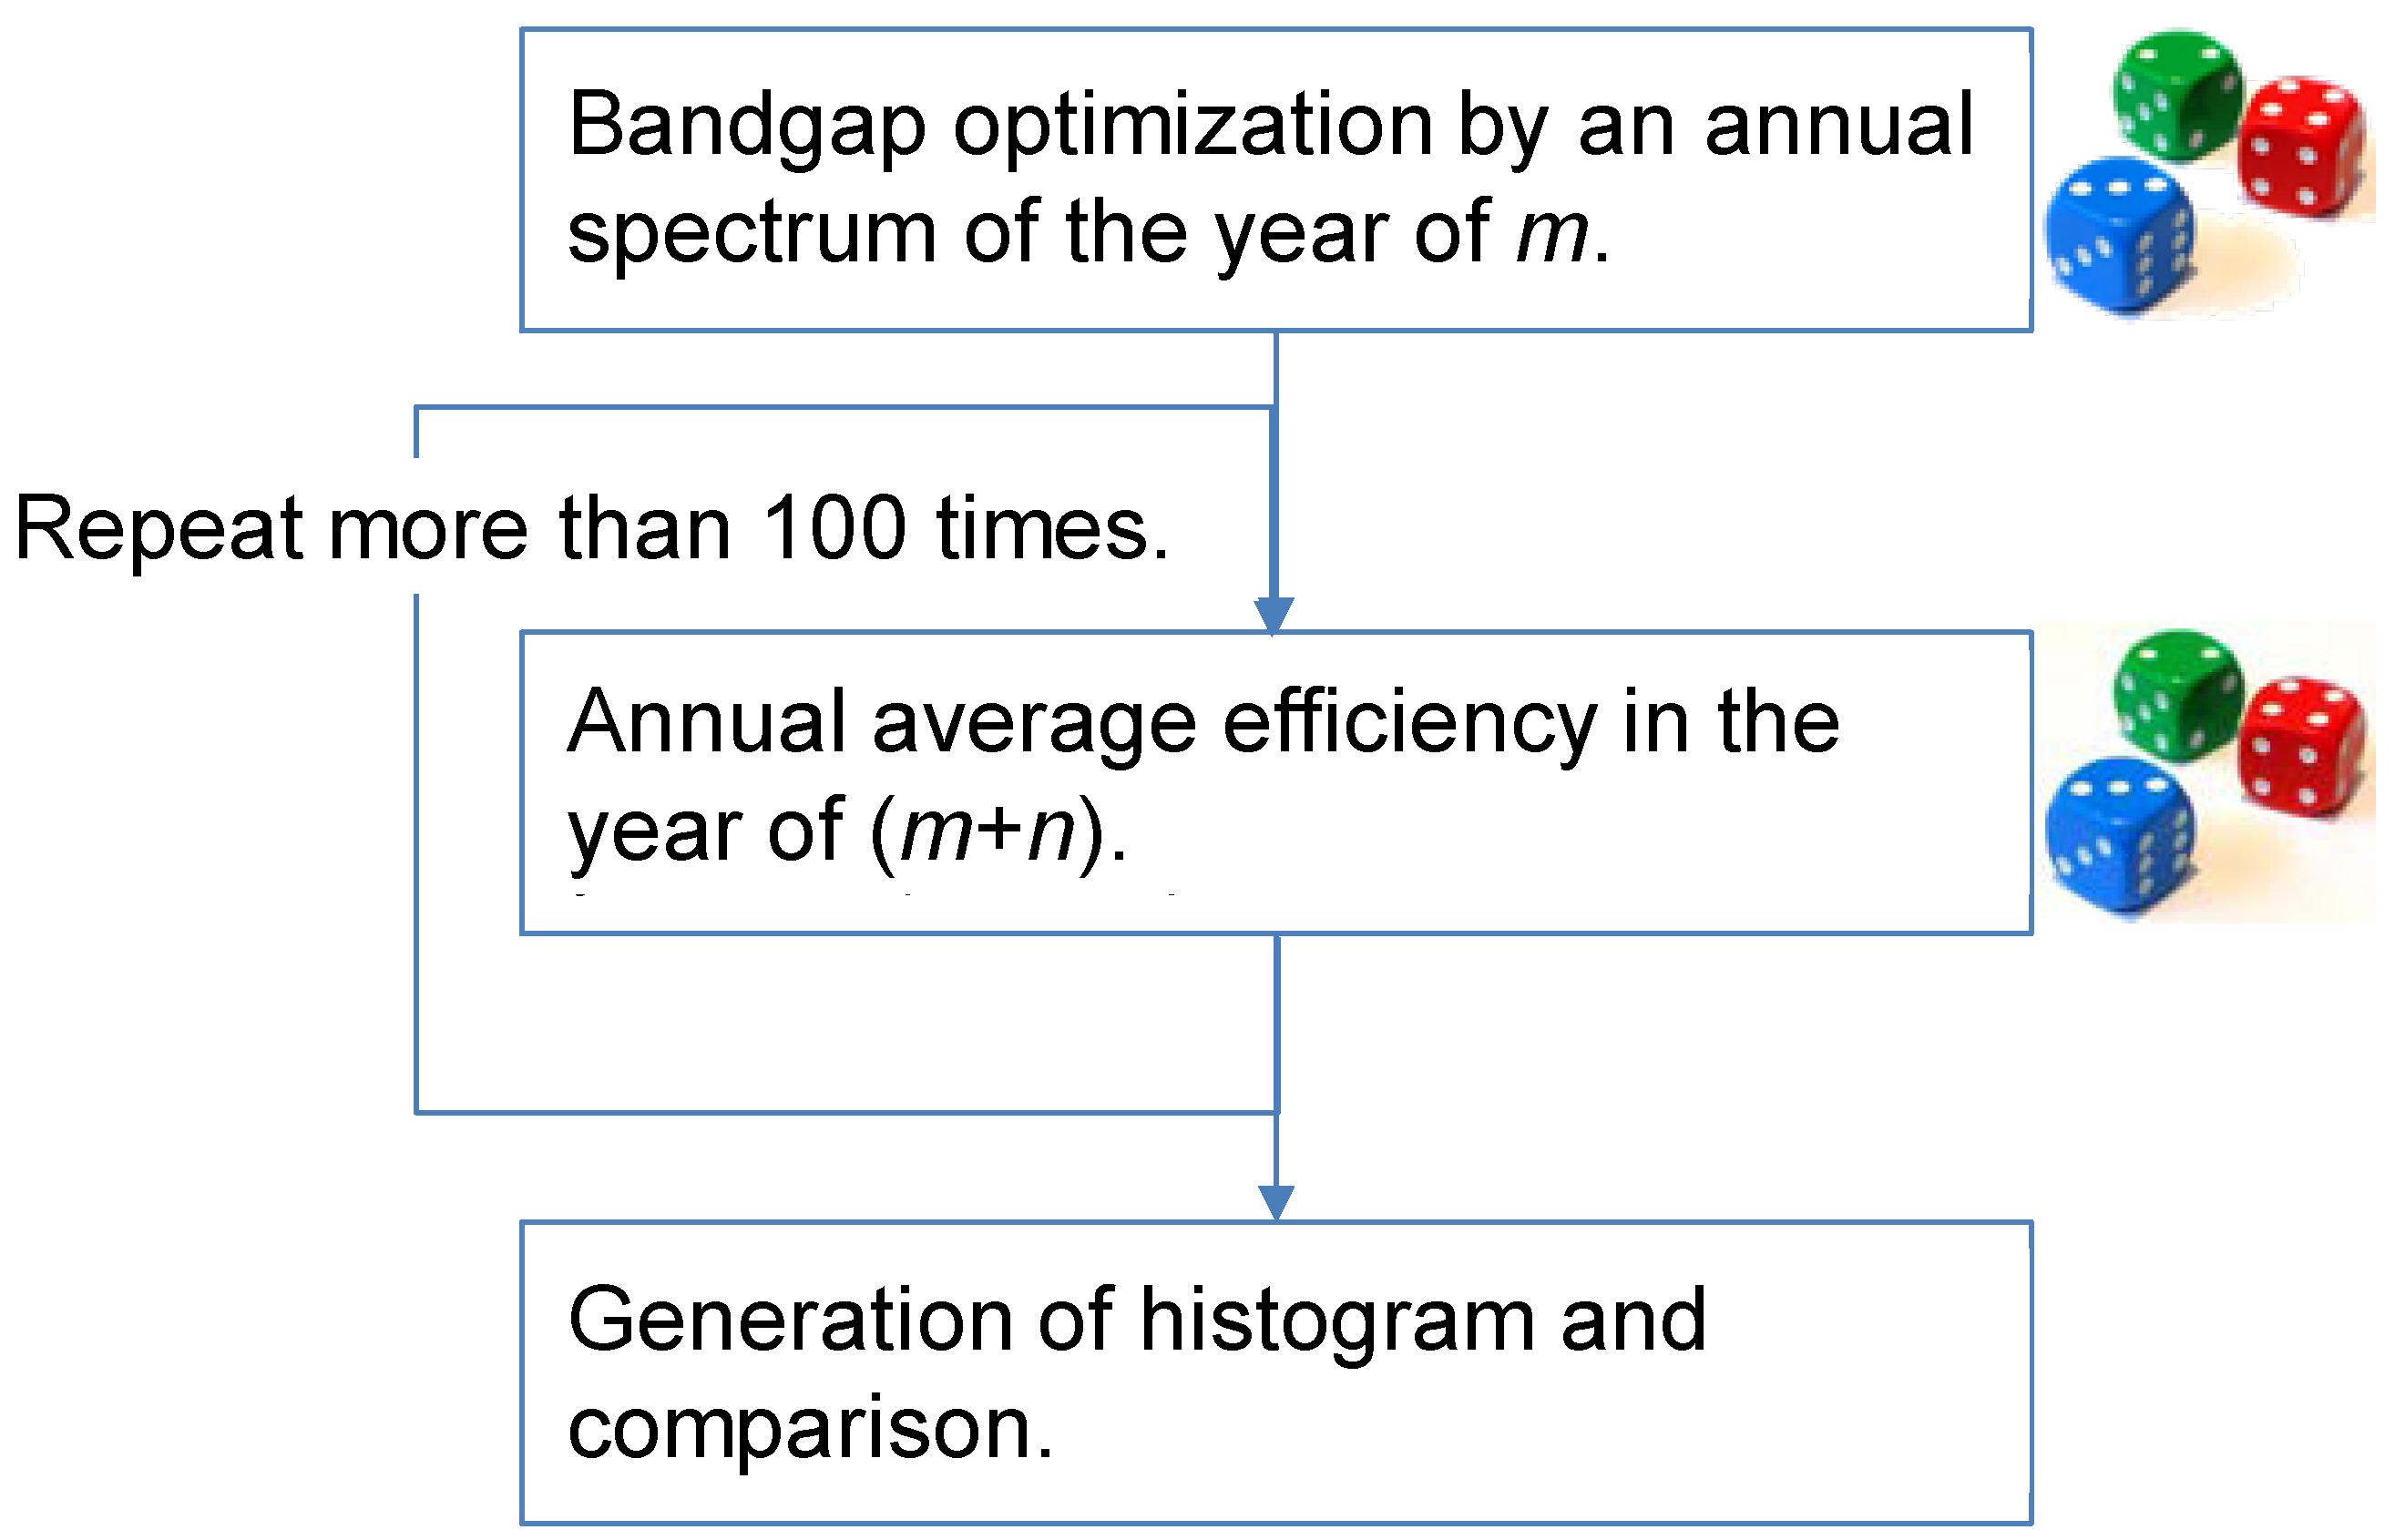
2.2. Monte Carlo Simulation for Analyzing the Annual Performance of Multi-Junction Cells
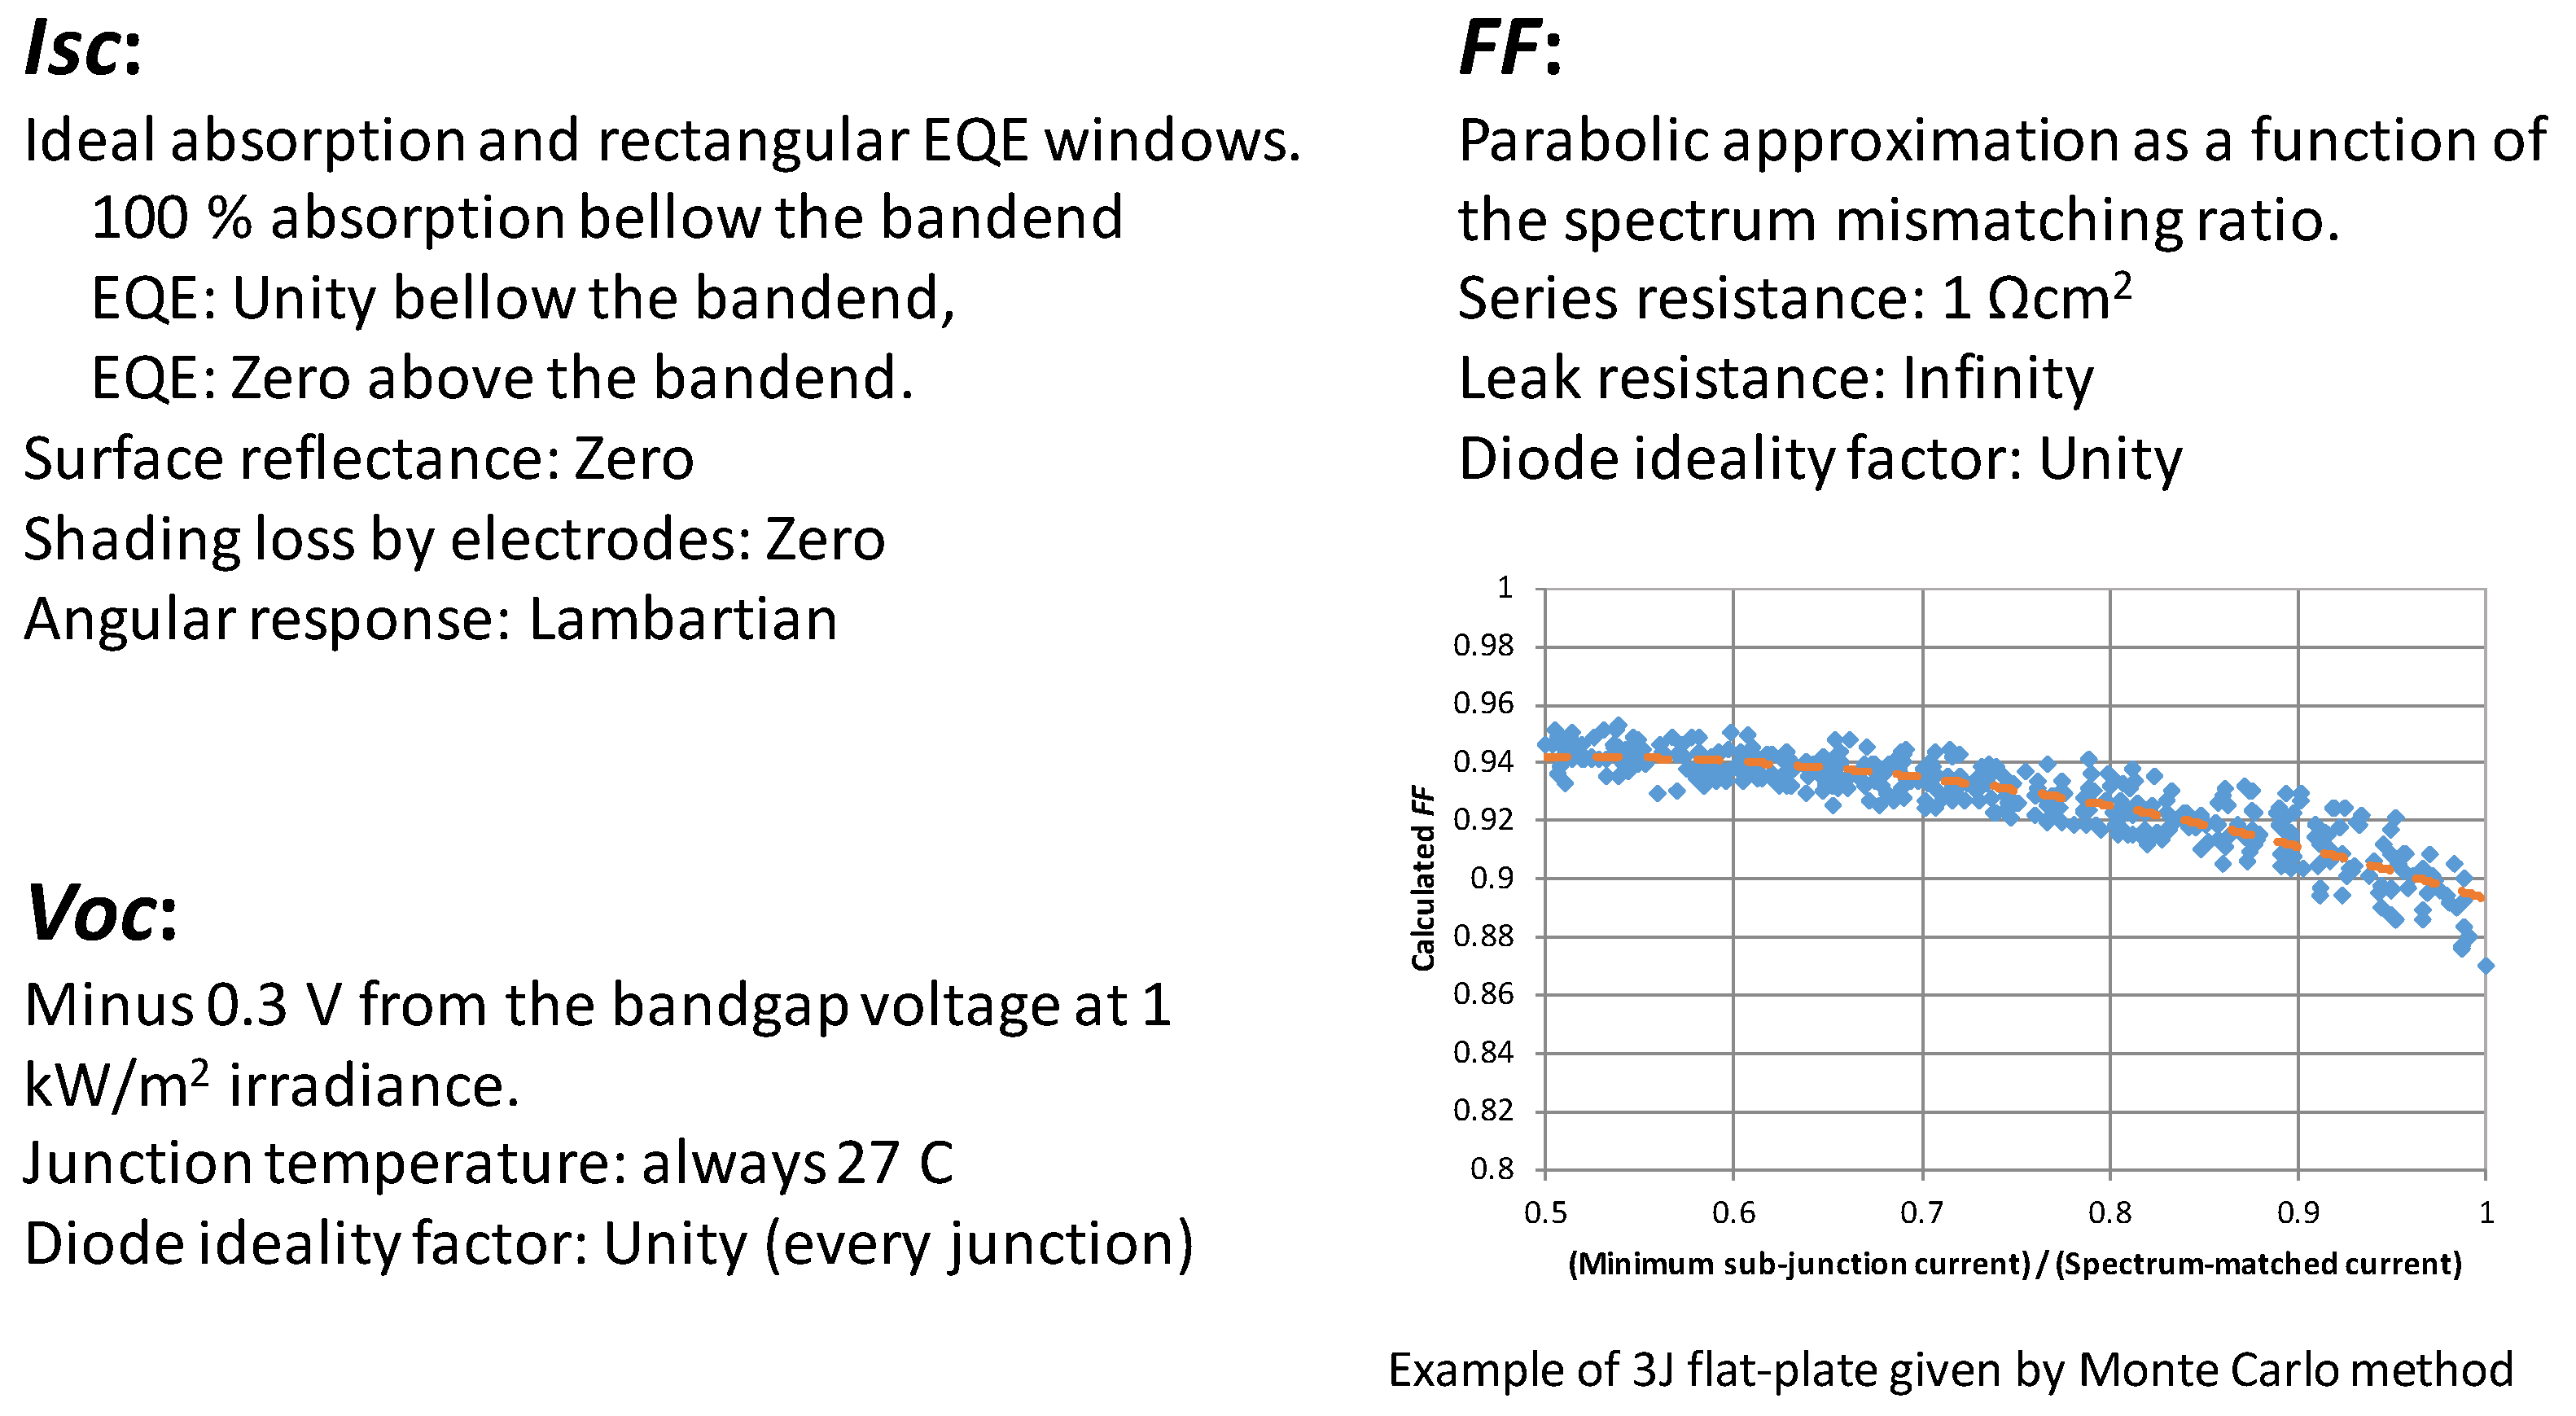
2.3. Modeling Multi-Junction Solar Cells Affected by a Variety of Spectra
3. Results
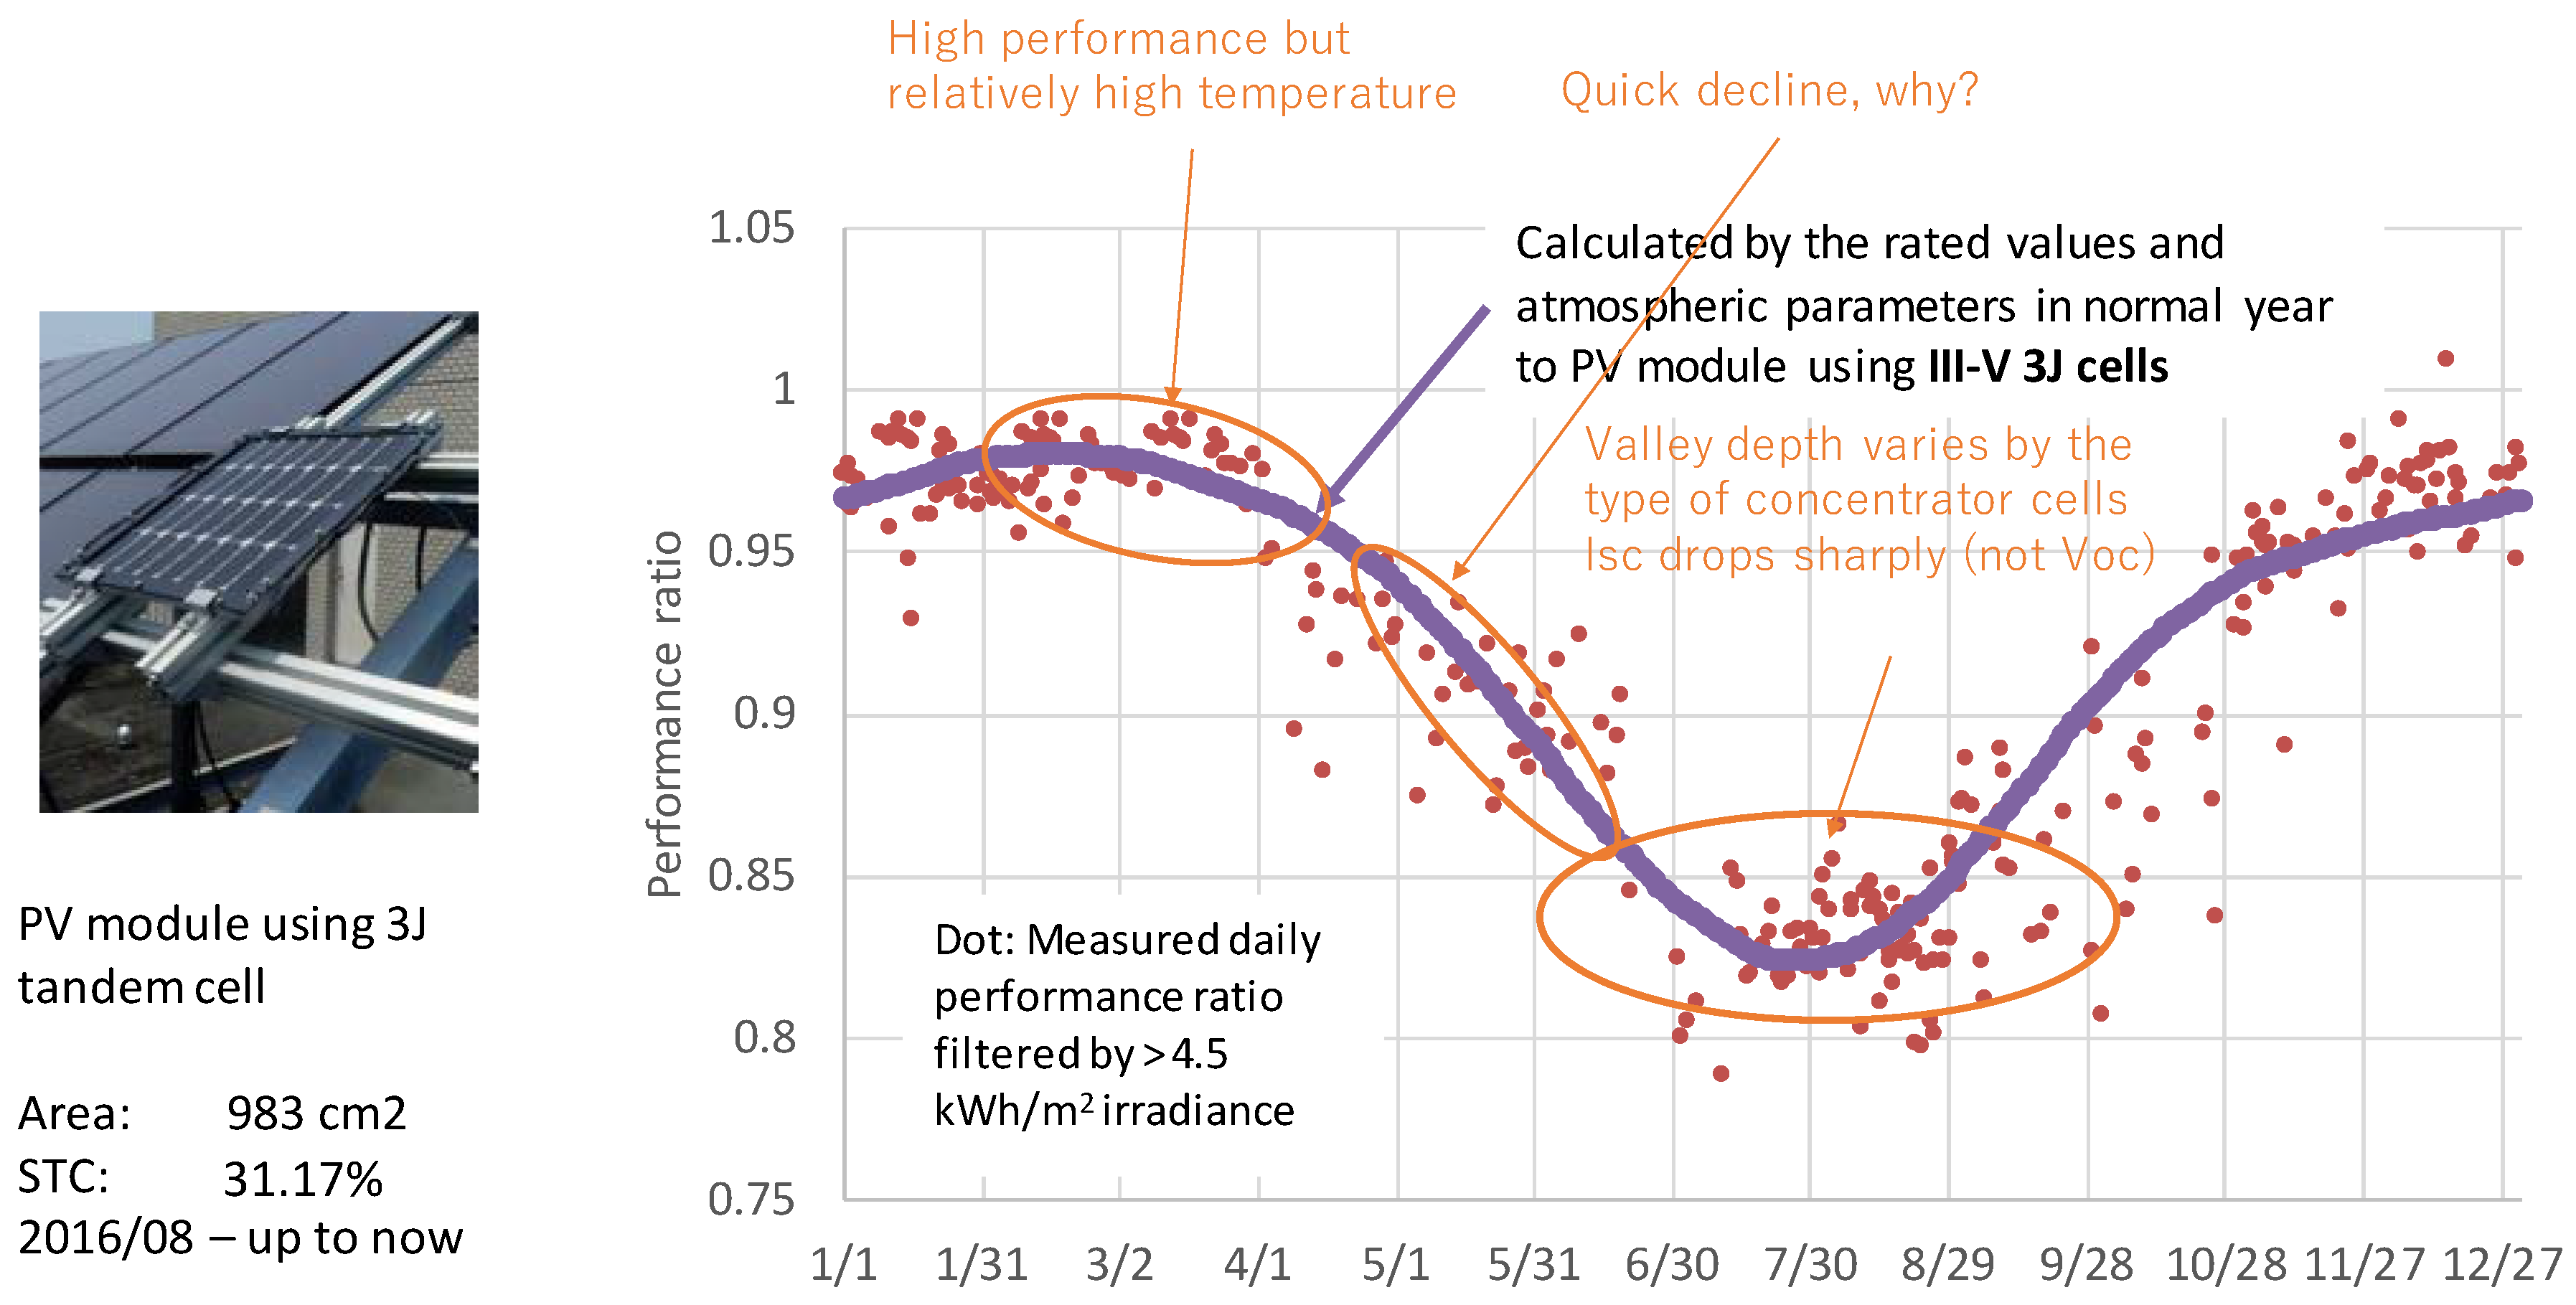
3.1. Validation of the Outdoor Operating Model for Non-Concentrating Multi-Junction Solar Cells
3.2. Normal Multi-Junction vs. Super-Multi-Junction; Practical Conditions
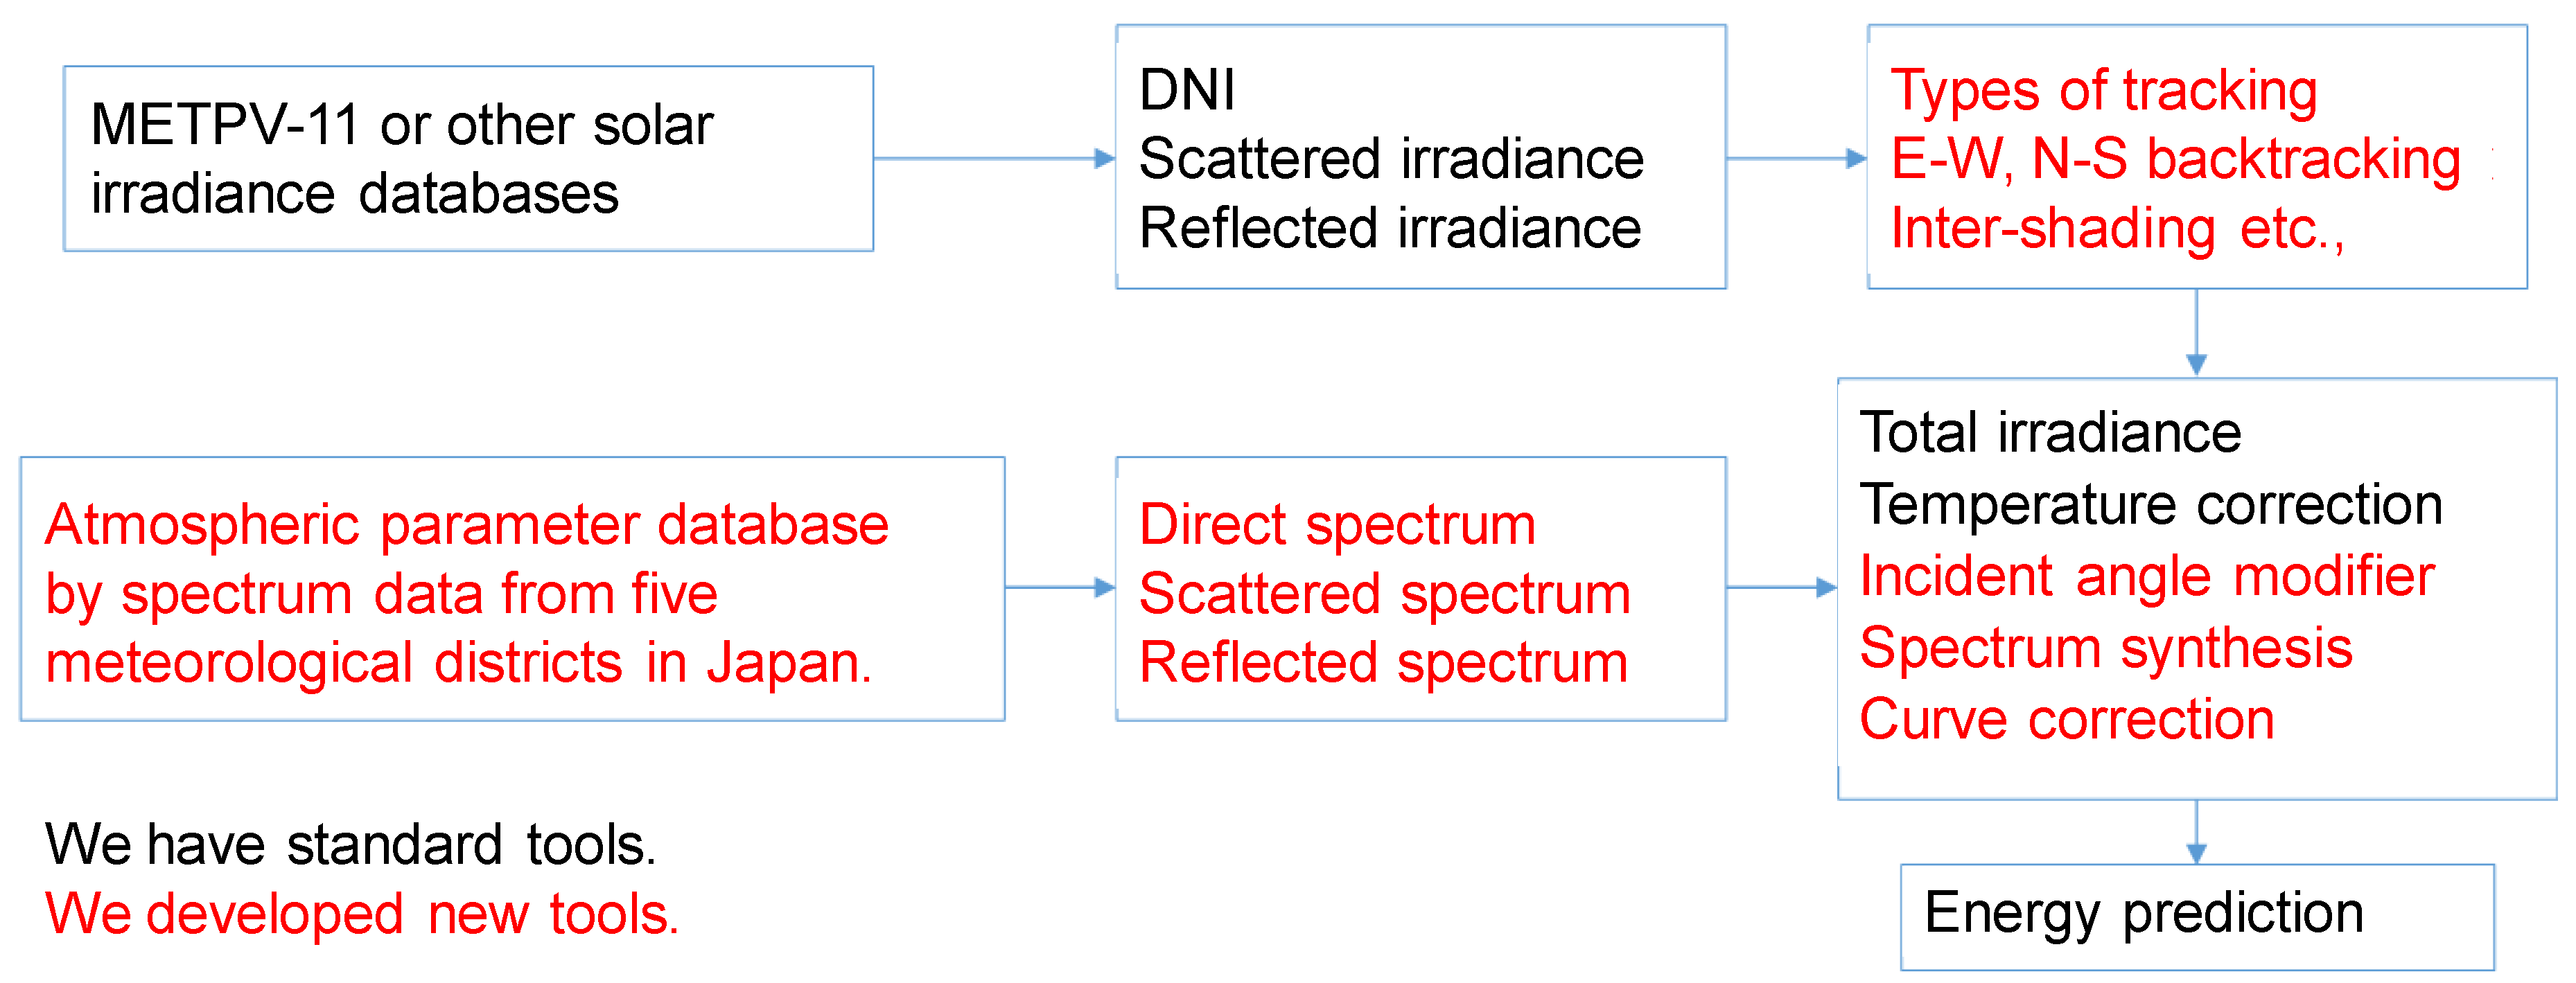
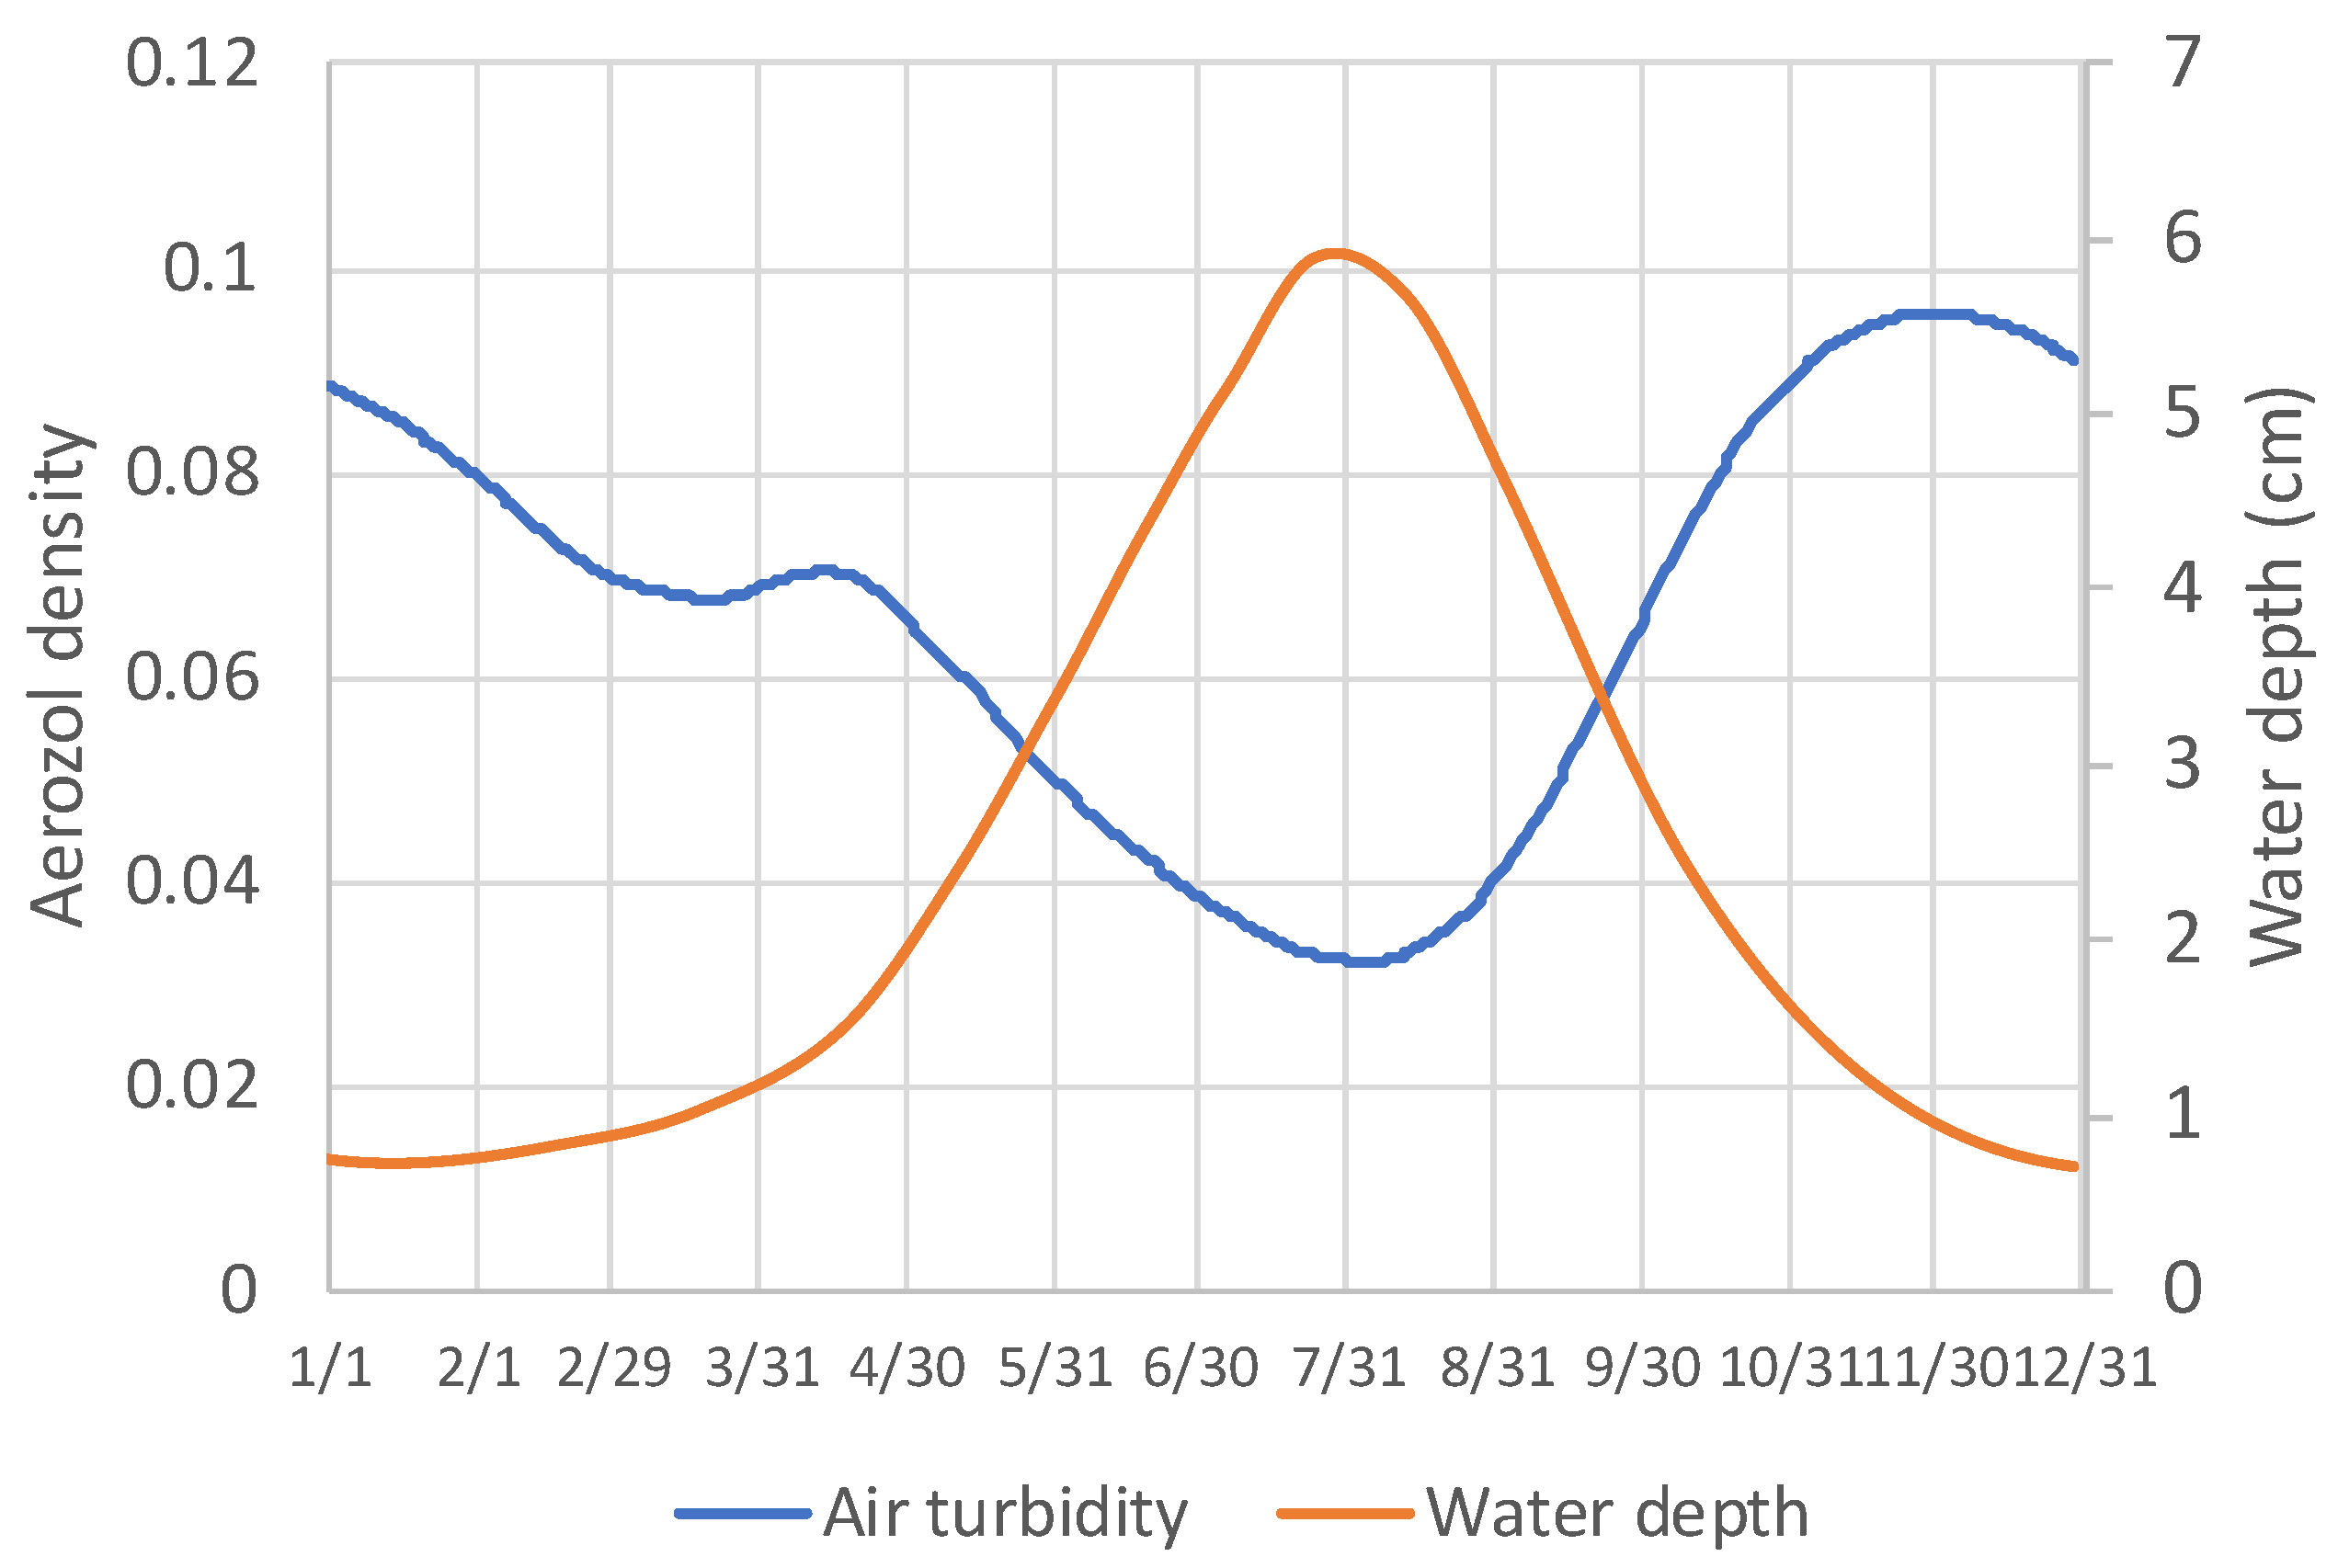
3.2.1. Modeling the Practical Spectrum Variation
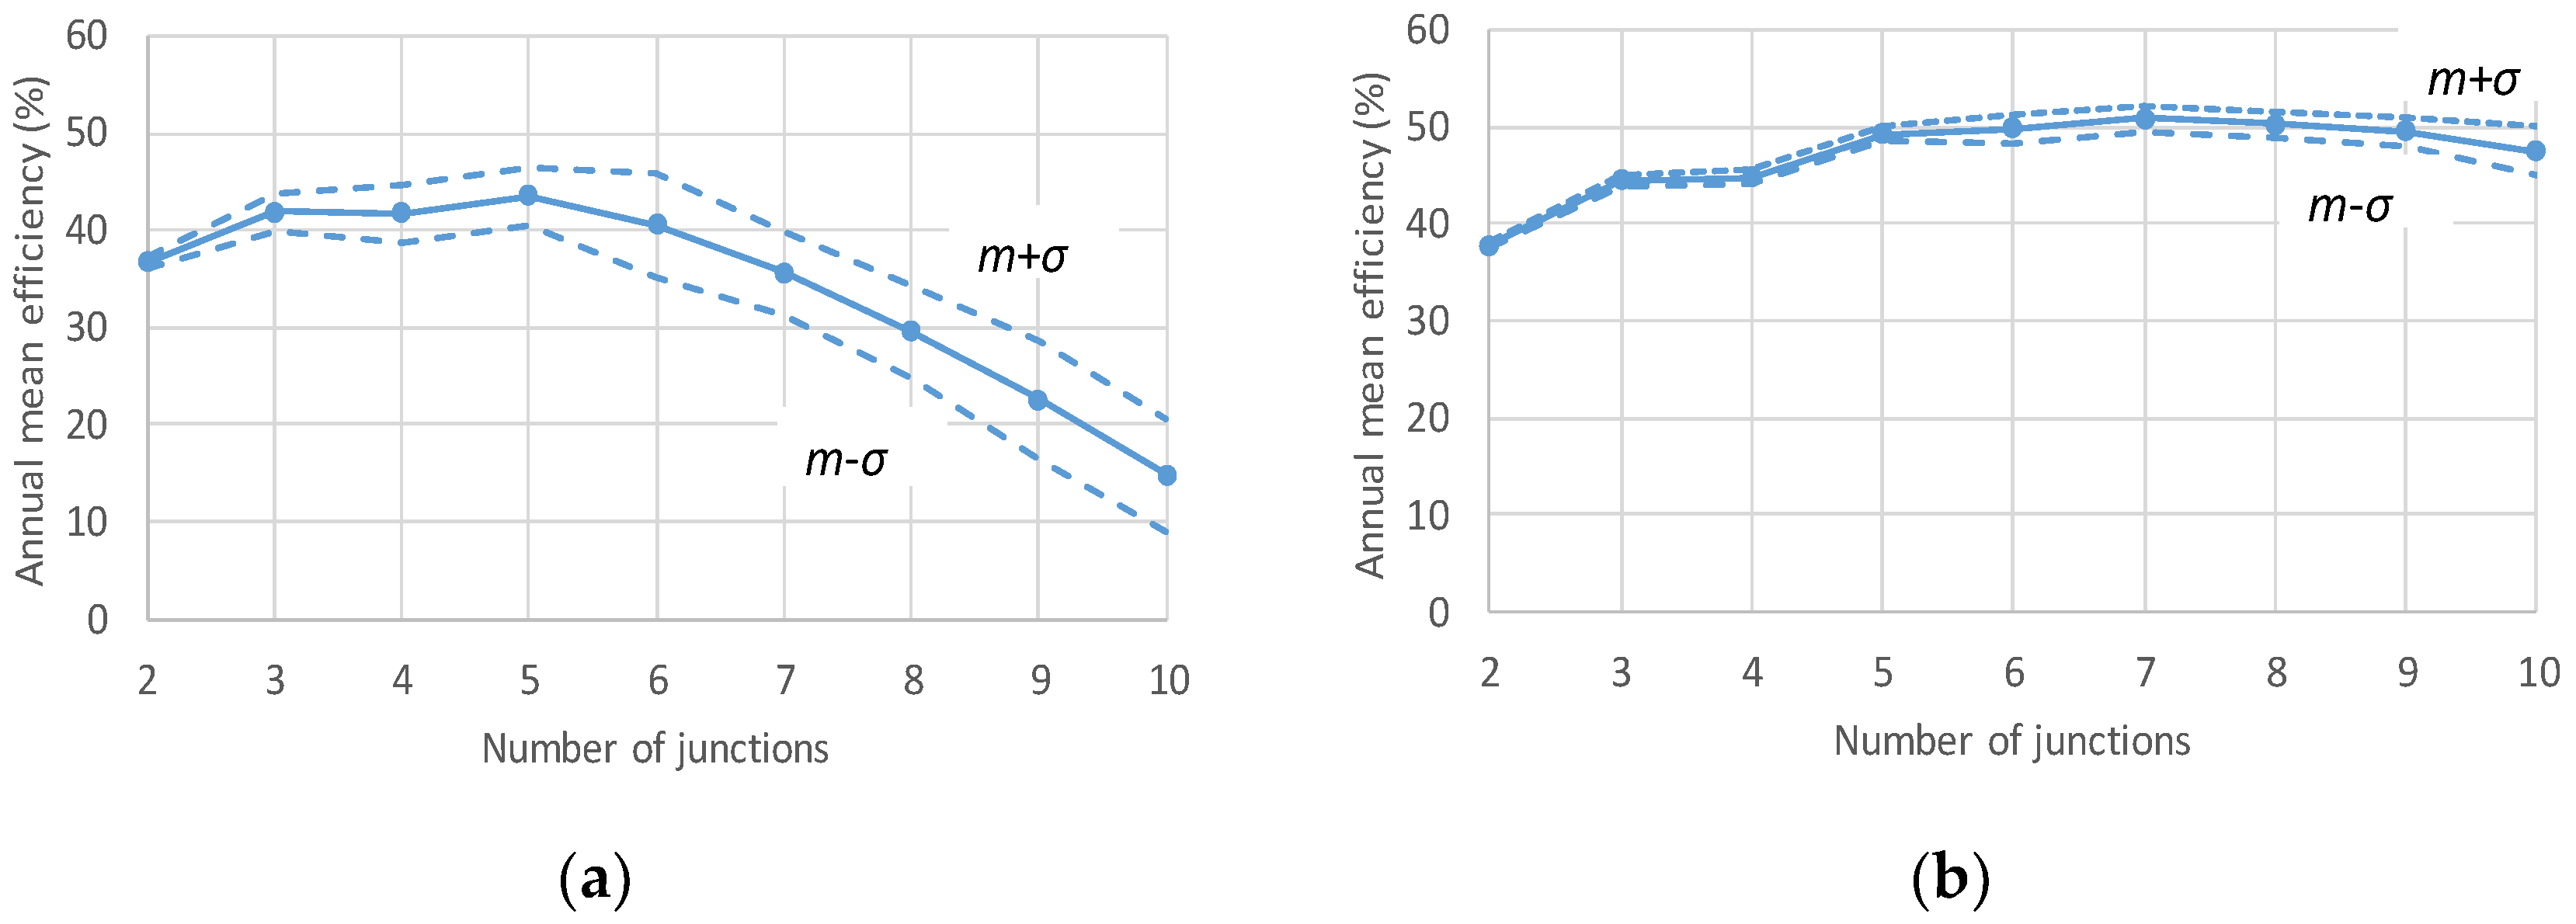
3.2.2. Computation Results of the Monte Carlo Simulation in the Practical Conditions
4. Discussion
5. Conclusions
- Multi-junction cells: highest efficiency but lower energy yield.
- Super-multi-junction cell: compensation of spectrum-mismatching loss by sharing photons generated by radiation recombination due to surplus current of spectrum mismatching.
- Annual performance: the model considering spectrum mismatching was validated and applied to super-multi-junction design.
- Super-multi-junction solar cell performance: robust to spectrum change. Its annual average efficiency levels off at 50% with realistic spectrum fluctuation.
- Future multi-junction solar cells: may not be needed to tune the bandgap for matching the standard solar spectrum, or for relying upon artificial technologies such as ELO, wafer-bonding, mechanical-stacking, and reverse-growth, but merely to be used for upright and lattice-matching growth technologies.
Author Contributions
Funding
Acknowledgments
Conflicts of Interest
References
- Araki, K.; Ji, L.; Kelly, G.; Yamaguchi, M. To Do List for Research and Development and International Standardization to Achieve the Goal of Running a Majority of Electric Vehicles on Solar Energy. Coatings 2018, 8, 251. [Google Scholar] [CrossRef]
- Yamaguchi, M. Super-High-Efficiency III-V Multi-Junction and Multi-Junction Cells, 2nd ed.; Archer, M.D., Green, M.A., Eds.; Clean Electricity from Photovoltaics; Imperial Collage Press: London, UK, 2015; pp. 307–338. [Google Scholar]
- Bett, A.W. Multi-Junction Cells for Very High Concentration; Marti, A., Luque, A., Eds.; Next Generation Photovoltaics; IOP: London, UK, 2004; pp. 64–90. [Google Scholar]
- Bett, A.W.; Dimroth, F.; Siefer, G. Multijunction Concentrator Solar Cells; Luue, A., Andreev, V., Eds.; Concentrator Photovoltaics; Springer: Berlin, Gemany, 2007; pp. 67–87. [Google Scholar]
- Green, M.A.; Dunlop, E.D.; Levi, D.H.; Hohl-Ebinger, J.; Yoshita, M.; Ho-Baillie, A.W. Solar cell efficiency tables (version 54). Prog. Photovolt. Res. Appl. 2019, 27, 565–575. [Google Scholar] [CrossRef]
- Green, M.A.; Emery, K.; Hishikawa, Y.; Warta, W.; Dunlop, E.D.; Levi, D.H.; Ho-Baillie, A.W.Y. Solar cell efficiency tables (version 51). Prog. Photovolt. 2017, 25, 668–676. [Google Scholar] [CrossRef]
- Yamaguchi, M.; Lee, K.H.; Araki, K.; Kojima, N.; Ohshita, Y. Analysis for efficiency potential of crystalline Si solar cells. J. Mater. Res. 2018, 33, 2621–2626. [Google Scholar] [CrossRef]
- Yamaguchi, M.; Yamada, H.; Katsumata, Y.; Lee, K.H.; Araki, K.; Kojima, N. Efficiency potential and recent activities of high-efficiency solar cells. J. Mater. Res. 2017, 32, 3445–3457. [Google Scholar] [CrossRef]
- Yamaguchi, M.; Lee, K.H.; Araki, K.; Kojima, N.; Yamada, H.; Katsumata, Y. Analysis for efficiency potential of high-efficiency and next-generation solar cells. Prog. Photovolt. Res. Appl. 2018, 26, 543–552. [Google Scholar] [CrossRef]
- Yamaguchi, M.; Zhu, L.; Akiyama, H.; Kanemitsu, Y.; Tampo, H.; Shibata, H.; Lee, K.H.; Araki, K.; Kojima, N. Analysis of future generation solar cells and materials. Jpn. J. Appl. Phys. 2018, 54, 04FS03. [Google Scholar] [CrossRef]
- Yamaguchi, M.; Lee, K.H.; Araki, K.; Kojima, N. A review of recent progress in heterogeneous silicon multi-junction solar cells. J. Phys. D Appl. Phys. 2018, 51, 133002. [Google Scholar] [CrossRef]
- Jackson, E.D. Areas for Improving of the Semiconductor Solar Energy Converter. In Proceedings of the Transzation Conference on the Use of Solar Energy, Tucson, AZ, USA, 31 October–1 November 1955; University of Arizona Press: Tucson, AZ, USA, 1958; Volume 5, pp. 122–126. [Google Scholar]
- Wolf, M. Limitations and possibilities for improvement of photovoltaic solar energy converters. Proc. Inst. Radio Eng. 1960, 48, 1246–1263. [Google Scholar]
- Hutchby, J.A.; Markunas, R.J.; Timmons, M.L.; Chiang, P.K.; Bedair, S.M. A Review of Multijunction Concentrator Solar Cells. In Proceedings of the 18th IEEE Photovoltaic Specialists Conference, Las Vegas, NV, USA, 21–25 October 1985; IEEE: New York, NY, USA, 1985; pp. 20–27. [Google Scholar]
- Ludowise, M.J.; LaRue, R.A.; Borden, P.G.; Gregory, P.E.; Dietz, W.T. High-efficiency organometallic vapor phase epitaxy AlGaAs/GaAs monolithic cascade solar cell using metal interconnects. Appl. Phys. Lett. 1982, 41, 550–552. [Google Scholar] [CrossRef]
- Flores, C. A three-terminal double junction GaAs/GaAlAs cascade solar cells. IEEE Electron. Device Lett. 1983, EDL–4, 96–99. [Google Scholar] [CrossRef]
- Chung, B.C.; Virshup, G.F.; Hikido, S.; Kaminar, N.R. 27.6% efficiency (1 Sun, air mass 1.5) monolithic Al0.37 Ga0.63 As/GaAs two-junction cascade solar cell with prismatic cover glass. Appl. Phys. Lett. 1989, 55, 1741–1743. [Google Scholar] [CrossRef]
- Fan, J.C.C.; Tsaur, B.Y.; Palm, B.J. Optical Design of High-Efficiency Multi-Junction Cells. In Proceedings of the 16th IEEE Photovoltaic Specialists Conference, San Diego, CA, USA, 27–30 September 1982; IEEE: New York, NY, USA, 1982; pp. 692–701. [Google Scholar]
- Yamaguchi, M.; Amano, C.; Sugiura, H.; Yamamoto, A. High efficiency AlGaAs/GaAs multi-junction solar cells. In Proceedings of the 19th IEEE Photovoltaic Specialists Conference, New Orleans, LA, USA, 4–8 May 1987; IEEE: New York, NY, USA, 1987; pp. 1484–1485. [Google Scholar]
- Ando, K.; Amano, C.; Sugiura, H.; Yamaguchi, M.; Saletesm, A. Non-radiative e-h recombination characteristics of mid-gap electron trap in AlxGa1–x As (x = 0.4) grown by molecular beam epitaxy. Jpn. J. Appl. Phys. 1987, 26, L266–L269. [Google Scholar] [CrossRef]
- Sugiura, H.; Amano, C.; Yamamoto, A.; Yamaguchi, M. Double hetero¬structure GaAs tunnel junction for AlGaAs/GaAs multi-junction solar cells. Jpn. J. Appl. Phys. 1988, 27, 269–272. [Google Scholar] [CrossRef]
- Olson, J.M.; Kurtz, S.R.; Kibbler, A.E. A 27.3% efficient Ga0.5In0.5P/ GaAs multi-junction solar cell. Appl. Phys. Lett. 1990, 56, 623–625. [Google Scholar] [CrossRef]
- Bertness, K.A.; Kurtz, S.R.; Friedman, D.J.; Kibbler, A.E.; Kramer, C.; Olson, J.M. 29.5%-efficiency GaInP/GaAs multi-junction solar cells. Appl. Phys. Lett. 1994, 65, 989–991. [Google Scholar] [CrossRef]
- Sasaki, K.; Agui, T.; Nakaido, K.; Takahashi, N.; Onitsuka, R.; Takamoto, T. Development of InGaP/GaAs/InGaAs inverted triple junction concentrator solar cells. Aip Conf. Proc. 2013, 1556, 22–25. [Google Scholar]
- Chiu, P.T.; Law, D.L.; Woo, R.L.; Singer, S.; Bhusari, D.; Hong, W.D.; Zakaria, A.; Boisvert, J.C.; Mesropian, S.; King, R.R.; et al. 35.8% space and 38.8% terrestrial 5J direct bonded cells. In Proceedings of the 40th IEEE Photovoltaic Specialist Conference, Denver, CO, USA, 8–13 June 2014; pp. 11–13. [Google Scholar]
- Yamaguchi, M.; Luque, L. High efficiency and high concentration in photovoltaics. IEEE Trans. Electron Devices 1999, 46, 2139–2144. [Google Scholar] [CrossRef]
- Swanson, R.M. Photovoltaic Concentrators. In Handbook of Photovoltaic Science and Engineering; Luque, A., Hegedus, S., Eds.; Wiley: Hoboken, NJ, USA, 2003; pp. 449–503. [Google Scholar]
- Philipps, S.P.; Bett, A.W.; Horowitz, K.; Kurtz, S. Current Status of Concentrator Photovoltaic (CPV) Technology; Version 1.3; National Renewable Energy Lab NREL: Lakewood, CO, USA, 2017; pp. 10–11. [Google Scholar]
- Araki, K.; Yamaguchi, M. Influences of spectrum change to 3-junction concentrator cells. Sol. Energy Mater. Sol. Cells 2003, 75, 707–714. [Google Scholar] [CrossRef]
- Faine, P.; Kurtz, S.R.; Riordan, C.; Olson, J.M. The influence of spectral solar irradiance variations on the performance of selected single-junction and multijunction solar cells. Sol. Cells 1991, 31, 259–278. [Google Scholar] [CrossRef]
- Kurtz, S.R.; Olson, J.M.; Faine, P. The difference between standard and average efficiencies of multijunction compared with single-junction concentrator cells. Solar Cells 1991, 30, 501–513. [Google Scholar] [CrossRef]
- Philipps, S.P.; Peharz, G.; Hoheisel, R.; Hornung, T.; Al-Abbadi, N.M.; Dimroth, F.; Bett, A.W. Energy harvesting efficiency of III–V triple-junction concentrator solar cells under realistic spectral conditions. Sol. Energy Mater. Sol. Cells 2010, 94, 869–877. [Google Scholar] [CrossRef]
- Kinsey, G.S.; Edmondson, K.M. Spectral response and energy output of concentrator multijunction solar cells. Prog. Photovolt. Res. Appl. 2009, 17, 279–288. [Google Scholar] [CrossRef]
- Araki, K.; Emery, K.; Siefer, G.; Bett, A.W.; Sakakibara, T.; Kemmoku, Y.; Ekins-Daukes, N.J.; Lee, H.S.; Yamaguchi, M. Comparison of efficiency measurements for a HCPV module with 3J cells in 3 sites. In Proceedings of the Conference Record of the Thirty-First IEEE Photovoltaic Specialists Conference, Lake Buena Vista, FL, USA, 3–7 January 2005; pp. 846–849. [Google Scholar]
- Lee, H.S.; Ekins-Daukes, N.J.; Araki, K.; Kemmoku, Y.; Yamaguchi, M. Field test and analysis: The behavior of 3-J concentrator cells under the control of cell temperature. In Proceedings of the Conference Record of the Thirty-First IEEE Photovoltaic Specialists Conference, Lake Buena Vista, FL, USA, 3–7 January 2005; pp. 754–757. [Google Scholar]
- Al Husna, H.; Ota, Y.; Minemoto, T.; Nishioka, K. Field test analysis of concentrator photovoltaic system focusing on average photon energy and temperature. Jpn. J. Appl. Phys. 2015, 54, 08KE05. [Google Scholar] [CrossRef]
- Verlinden, P.J.; Lasich, J.B. Energy rating of concentrator PV systems using multi-junction III–V solar cells. In Proceedings of the 33rd IEEE Photovoltaic Specialists Conference, San Diego, CA, USA, 11–16 May 2008; pp. 1–6. [Google Scholar]
- Victoria, M.; Askins, S.; Nuñez, R.; Domínguez, C.; Herrero, R.; Antón, I.; Sala, G.; Ruíz, J.M. Tuning the current ratio of a CPV system to maximize the energy harvesting in a particular location. Aip Conf. Proc. 2013, 1556, 156–161. [Google Scholar]
- Muller, M.; Marion, B.; Kurtz, S.; Rodriguez, J. An investigation into spectral parameters as they impact CPV module performance. Aip Conf. Proc. 2010, 1277, 307–311. [Google Scholar]
- Domínguez, C.; Antón, I.; Sala, G.; Askins, S. Current-matching estimation for multijunction cells within a CPV module by means of component cells. Prog. Photovolt. Res. Appl. 2013, 21, 1478–1488. [Google Scholar] [CrossRef]
- Núñez, R.; Jin, C.; Antón, I.; Sala, G. Spectral classification of worldwide locations using SMR indexes. Aip Conf. Proc. 2016, 1766, 090007. [Google Scholar]
- Araki, K.; Yamaguchi, M.; Kondo, M.; Uozumi, H. Which is the best number of junctions for solar cells under ever-changing terrestrial spectrum? In Proceedings of the 3rd World Conference on Photovoltaic Energy Conversion, Osaka, Japan, 11–18 May 2003; pp. 307–310. [Google Scholar]
- Letay, G.; Baur, C.; Bett, A. Theoretical investigations of III-V multi-junction concentrator cells under realistic spectral conditions. In Proceedings of the 19th European Photovoltaic Solar Energy Conference, Paris, France, 7–11 June 2004; p. 11. [Google Scholar]
- Ekins-Daukes, N.J.; Betts, T.R.; Kemmoku, Y.; Araki, K.; Lee, H.S.; Gottschalg, R.; Boreland, M.B.; Infield, D.G.; Yamaguchi, M. Syracuse-a multi-junction concentrator system computer model. In Proceedings of the Conference Record of the Thirty-First IEEE Photovoltaic Specialists Conference, Lake Buena Vista, FL, USA, 3–7 January 2005; pp. 651–654. [Google Scholar]
- Ekins-Daukes, N.J.; Kemmoku, Y.; Araki, K.; Betts, T.R.; Gottschalg, R.; Infield, D.G.; Yamaguchi, M. The design specification for syracuse; a multi-junction concentrator system computer model. In Proceedings of the 19th European Photovoltaic Solar Energy Conference, Paris, France, 7–11 June 2004. [Google Scholar]
- Cameron, C.; Crawford, C.; Foresi, J.; King, D.; McConnell, R.; Riley, D.; Sahm, A.; Stein, J. Performance Model Assessment for Multi-Junction Concentrating Photovoltaic Systems. Aip Conf. Proc. 2010, 1277, 290–293. [Google Scholar]
- Araki, K.; Uozumi, H.; Kondo, M.; Takamoto, T.; Agui, T.; Kaneiwa, M.; Egami, T.; Hiramatsu, M.; Miyazaki, Y.; Kemmoku, Y.; et al. Development of a new 550/spl times/concentrator module with 3J cells-performance and reliability. In Proceedings of the Conference Record of the Thirty-First IEEE Photovoltaic Specialists Conference, Lake Buena Vista, FL, USA, 3–7 January 2005; pp. 631–634. [Google Scholar]
- Araki, K.; Yamaguchi, M. Extended distributed model for analysis of non-ideal concentration operation. Sol. Energy Mater. Sol. Cells 2003, 75, 467–473. [Google Scholar] [CrossRef]
- Herrero, R.; Victoria, M.; Domínguez, C.; Askins, S.; Antón, I.; Sala, G. Concentration photovoltaic optical system irradiance distribution measurements and its effect on multi-junction solar cells. Prog. Photovolt. Res. Appl. 2012, 20, 423–430. [Google Scholar] [CrossRef]
- Garcia, I.; Algora, C.; Rey-Stolle, I.; Galiana, B. Study of non-uniform light profiles on high concentration III–V solar cells using quasi-3D distributed models. In Proceedings of the 33rd IEEE Photovoltaic Specialists Conference, San Diego, CA, USA, 11–16 May 2008; pp. 1–6. [Google Scholar]
- Kurtz, S.R.; O’Neill, M.J. Estimating and controlling chromatic aberration losses for two-junction, two-terminal devices in refractive concentrator systems. In Proceedings of the Conference Record of the Twenty Fifth IEEE Photovoltaic Specialists Conference, Washington, DC, USA, 13–17 May 1996; pp. 361–364. [Google Scholar]
- James, L.W. Effects of concentrator chromatic aberration on multi-junction cells. In Proceedings of the 1994 IEEE 1st World Conference on Photovoltaic Energy Conversion-WCPEC (A Joint Conference of PVSC, PVSEC and PSEC), Waikoloa, HI, USA, 5–9 December 1994; pp. 1799–1802. [Google Scholar]
- Rey-Stolle, I.; Algora, C.; García, I.; Baudrit, M.; Espinet, P.; Galiana, B.; Barrigón, E. Simulating III–V concentrator solar cells: A comparison of advantages and limitations of lumped analytical models; distributed analytical models and numerical simulation. In Proceedings of the 34th IEEE Photovoltaic Specialists Conference (PVSC), Philadelphia, PA, USA, 7–12 June 2009; pp. 001622–001627. [Google Scholar]
- Araki, K.; Kondo, M.; Uozumi, H.; Yamaguchi, M. Experimental proof and theoretical analysis on effectiveness of passive homogenizers to 3J concentrator solar cells. In Proceedings of the 3rd World Conference on Photovoltaic Energy Conversion, Osaka, Japan, 11–18 May 2003; pp. 853–856. [Google Scholar]
- Araki, K.; Leutz, R.; Kondo, M.; Akisawa, A.; Kashiwagi, T.; Yamaguchi, M. Development of a metal homogenizer for concentrator monolithic multi-junction-cells. In Proceedings of the Conference Record of the Twenty-Ninth IEEE Photovoltaic Specialists Conference, New Orleans, LA, USA, 19–24 May 2002; pp. 1572–1575. [Google Scholar]
- Brown, A.S.; Green, M.A. Radiative coupling as a means to reduce spectral mismatch in monolithic multi-junction solar cell stacks theoretical considerations. In Proceedings of the Conference Record of the Twenty-Ninth IEEE Photovoltaic Specialists Conference, New Orleans, LA, USA, 19–24 May 2002; pp. 868–871. [Google Scholar]
- Chan, N.L.; Young, T.B.; Brindley, H.E.; Ekins-Daukes, N.J.; Araki, K.; Kemmoku, Y.; Yamaguchi, M. Validation of energy prediction method for a concentrator photovoltaic module in Toyohashi Japan. Prog. Photovolt. Res. Appl. 2013, 21, 1598–1610. [Google Scholar] [CrossRef]
- Chan, N.L.; Thomas, T.; Führer, M.; Ekins-Daukes, N.J. Practical limits of multijunction solar cell performance enhancement from radiative coupling considering realistic spectral conditions. IEEE J. Photovolt. 2014, 4, 1306–1313. [Google Scholar] [CrossRef]
- Chan, N.L.; Brindley, H.E.; Ekins-Daukes, N.J. Impact of individual atmospheric parameters on CPV system power, energy yield and cost of energy. Prog. Photovolt. Res. Appl. 2014, 22, 1080–1095. [Google Scholar] [CrossRef]
- Chan, N.L.; Young, T.; Brindley, H.; Chaudhuri, B.; Ekins-Daukes, N.J. Variation in spectral irradiance and the consequences for multi-junction concentrator photovoltaic systems. In Proceedings of the 35th IEEE Photovoltaic Specialists Conference, Honolulu, HI, USA, 20–25 June 2010; pp. 003008–003012. [Google Scholar]
- Araki, K.; Ota, Y.; Lee, K.H.; Nishioka, K.; Yamaguchi, M. Optimization of the Partially Radiative-coupling Multi-junction Solar Cells Considering Fluctuation of Atmospheric Conditions. In Proceedings of the IEEE 7th World Conference on Photovoltaic Energy Conversion (WCPEC) (A Joint Conference of 45th IEEE PVSC, 28th PVSEC & 34th EU PVSEC), Waikoloa Village, HI, USA, 10–15 June 2018; pp. 1661–1666. [Google Scholar]
- Araki, K.; Lee, K.H.; Kojima, N.; Yamaguchi, M. Super-Multijunction Cell, A new Solar Cell Overcoming the Spectrum Loss of Multijunction Cells. Grand Renew. Energy Proc. Jpn. Counc. Renew. Energy 2018, 2018, 45. [Google Scholar]
- Araki, K.; Lee, K.H.; Yamaguchi, M. Opportunities for breaking an energy generation limit of photovoltaic using multijunction and super-multijunction cells. In Proceedings of the 18th International Workshop on Junction Technology (IWJT), Shanghai, China, 8–9 March 2018; pp. 1–4. [Google Scholar]
- Araki, K.; Lee, K.H.; Yamaguchi, M. Risks and Opportunities in Challenging New Bandgap Materials for Increasing Number of Junctions—Probability Study. In Proceedings of the PVSEC-27, Otsu, Japan, 12–17 November 2017. [Google Scholar]
- Kayes, B.M.; Nie, H.; Twist, R.; Spruytte, S.G.; Reinhardt, F.; Kizilyalli, I.C.; Higashi, G.S. 27.6% conversion efficiency, a new record for single-junction solar cells under 1 sun illumination. In Proceedings of the 37th IEEE Photovoltaic Specialists Conference, Seattle, WA, USA, 19–24 June 2011; pp. 000004–000008. [Google Scholar]
- Schilling, C.L.; Hoehn, O.; Micha, D.N.; Heckelmann, S.; Klinger, V.; Oliva, E.; Glunz, S.W.; Dimroth, F. Combining photon recycling and concentrated illumination in a GaAs heterojunction solar cell. IEEE J. Photovolt. 2017, 8, 348–354. [Google Scholar] [CrossRef]
- Kosten, E.D.; Kayes, B.M.; Atwater, H.A. Experimental demonstration of enhanced photon recycling in angle-restricted GaAs solar cells. Energy Environ. Sci. 2014, 7, 1907–1912. [Google Scholar] [CrossRef]
- Johnson, D.C.; Ballard, I.M.; Barnham, K.W.J.; Connolly, J.P. Mazzer. Observation of photon recycling in strain-balanced quantum well solar cells. Appl. Phys. Lett. 2007, 90, 213505. [Google Scholar] [CrossRef]
- Pazos-Outón, L.M.; Szumilo, M.; Lamboll, R.; Richter, J.M.; Crespo-Quesada, M.; Abdi-Jalebi, M.; Beeson, H.J.; Vrućinić, M.; Alsari, M.; Snaith, H.J.; et al. Photon recycling in lead iodide perovskite solar cells. Science 2016, 351, 1430–1433. [Google Scholar] [CrossRef]
- Sogabe, T.; Ogura, A.; Hung, C.Y.; Evstropov, V.; Mintairov, M.; Shvarts, M.; Okada, Y. Experimental characterization and self-consistent modeling of luminescence coupling effect in III-V multijunction solar cells. Appl. Phys. Lett. 2013, 103, 263907. [Google Scholar] [CrossRef]
- Steiner, M.A.; Geisz, J.F. Non-linear luminescent coupling in series-connected multijunction solar cells. Appl. Phys. Lett. 2012, 100, 251106. [Google Scholar] [CrossRef]
- Allen, C.R.; Lim, S.H.; Li, J.J.; Zhang, Y.H. Simple method for determining luminescence coupling in multi-junction solar cells. In Proceedings of the 37th IEEE Photovoltaic Specialists Conference, Seattle, WA, USA, 19–24 June 2011; pp. 000452–000453. [Google Scholar]
- Ota, Y.; Masuda, T.; Araki, K.; Yamaguchi, M. A mobile multipyranometer array for the assessment of solar irradiance incident on a photovoltaic-powered vehicle. Sol. Energy 2019, 184, 84–90. [Google Scholar] [CrossRef]
- Ota, Y.; Nishioka, K.; Araki, K.; Ikeda, K.; Lee, K.H.; Yamaguchi, M. Optimization of static concentrator photovoltaics with aspherical lens for automobile. In Proceedings of the IEEE 43rd Photovoltaic Specialists Conference (PVSC), Portland, OR, USA, 5–10 June 2016; pp. 0570–0573. [Google Scholar]
- Araki, K.; Ota, Y.; Ikeda, K.; Lee, K.H.; Nishioka, K.; Yamaguchi, M. Possibility of static low concentrator PV optimized for vehicle installation. Aip Conf. Proc. 2016, 1766, 020001. [Google Scholar]
- Araki, K.; Nagai, H.; Yamaguchi, M. Possibility of solar station to EV. Aip Conf. Proc. 2016, 1766, 080001. [Google Scholar]
- Schuss, C.; Gall, H.; Eberhart, K.; Illko, H.; Eichberger, B. Alignment and interconnection of photovoltaics on electric and hybrid electric vehicles. In Proceedings of the 2014 IEEE International Instrumentation and Measurement Technology Conference (I2MTC) Proceedings, Montevideo, Uruguay, 12–15 May 2014; pp. 153–158. [Google Scholar]
- Schuss, C.; Eichberger, B.; Rahkonen, T. Impact of sampling interval on the accuracy of estimating the amount of solar energy. In Proceedings of the IEEE International Instrumentation and Measurement Technology Conference Proceedings, Taipei, Taiwan, 23–26 May 2016; pp. 1–6. [Google Scholar]
- Sato, D.; Lee, K.H.; Araki, K.; Masuda, T.; Yamaguchi, M.; Yamada, N. Design of low-concentration static III-V/Si partial CPV module with 27.3% annual efficiency for car-roof application. Prog. Photovolt. Res. Appl. 2019, 27, 501–510. [Google Scholar] [CrossRef]
- Sato, D.; Lee, K.H.; Araki, K.; Masuda, T.; Yamaguchi, M.; Yamada, N. Design and Evaluation of Low-concentration Static III-V/Si Partial CPV Module for Car-rooftop Application. In Proceedings of the IEEE 7th World Conference on Photovoltaic Energy Conversion (WCPEC) (A Joint Conference of 45th IEEE PVSC, 28th PVSEC & 34th EU PVSEC), Waikoloa Village, HI, USA, 10–15 June 2018; pp. 0954–0957. [Google Scholar]
- Masuda, T.; Araki, K.; Okumura, K.; Urabe, S.; Kudo, Y.; Kimura, K.; Nakado, T.; Sato, A.; Yamaguchi, M. Next environment-friendly cars: Application of solar power as automobile energy source. In Proceedings of the 2016 IEEE 43rd Photovoltaic Specialists Conference (PVSC), Portland, OR, USA, 5–10 June 2016; pp. 0580–0584. [Google Scholar]
- Araki, K.; Algora, C.; Siefer, G.; Nishioka, K.; Leutz, R.; Carter, S.; Wang, S.; Askins, S.; Ji, L.; Kelly, G. Standardization of the CPV and car-roof PV technology in 2018–Where are we going to go? Aip Conf. Proc. 2018, 2012, 070001. [Google Scholar]
- Araki, K.; Algora, C.; Siefer, G.; NIshioka, K.; Muller, M.; Leutz, R.; Carter, S.; Wang, S.; Askins, S.; Ji, L.; et al. Toward Standardization of Solar trackers, concentrator PV, and car-ROOF pv. Grand Renew. Energy Proc. Jpn. Counc. Renew. Energy 2018, 2018, 37. [Google Scholar]
- Araki, K.; Lee, K.H.; Yamaguchi, M. The possibility of the static LCPV to mechanical-stack III-V//Si module. Aip Conf. Proc. 2018, 2012, 090002. [Google Scholar]
- Ota, Y.; Masuda, T.; Araki, K.; Yamaguchi, M. Curve-correction factor for characterization of the output of a three-dimensional curved photovoltaic module on a car roof. Coatings 2018, 8, 432. [Google Scholar] [CrossRef]
- Peharz, G.; Siefer, G.; Bett, A.W. A simple method for quantifying spectral impacts on multi-junction solar cells. Sol. Energy 2009, 83, 1588–1598. [Google Scholar] [CrossRef]
- Peharz, G.; Siefer, G.; Araki, K.; Bett, A.W. Spectrometric outdoor characterization of CPV modules using isotype monitor cells. In Proceedings of the 33rd IEEE Photovoltaic Specialists Conference, San Diego, CA, USA, 11–16 May 2008; pp. 1–5. [Google Scholar]
- Dobbin, A.L.; Lumb, M.P.; Tibbits, T.N. How Important Is The Resolution Of Atmospheric Data In Calculations Of Spectral Irradiance And Energy Yield For (III–V) Triple-Junction Cells? Aip Conf. Proc. 2010, 1277, 303–306. [Google Scholar]
- Gueymard, C.A. Daily spectral effects on concentrating PV solar cells as affected by realistic aerosol optical depth and other atmospheric conditions. In Optical Modeling and Measurements for Solar Energy Systems III 2009; SPIE: Bellingham WA, USA, 2009; p. 741007. [Google Scholar]
- Muller, M.; Marion, B.; Rodriguez, J.; Kurtz, S. Minimizing variation in outdoor CPV power ratings. Aip Conf. Proc. 2011, 1407, 336–340. [Google Scholar]
- Araki, K.; Kemmoku, Y.; Yamaguchi, M. A simple rating method for CPV modules and systems. In Proceedings of the 33rd IEEE Photovoltaic Specialists Conference, San Diego, CA, USA, 11–16 May 2008; pp. 1–6. [Google Scholar]
- Saiki, H.; Sakai, T.; Araki, K.; Ota, Y.; Lee, K.H.; Yamaguchi, M.; Nishioka, K. Verification of uncertainty in CPV’s outdoor performance. In Proceedings of the IEEE 7th World Conference on Photovoltaic Energy Conversion (WCPEC)(A Joint Conference of 45th IEEE PVSC, 28th PVSEC & 34th EU PVSEC), Waikoloa Village, HI, USA, 10–15 June 2018; pp. 0949–0953. [Google Scholar]
- Araki, K.; Ota, Y.; Lee, K.H.; Sakai, T.; Nishioka, K.; Yamaguchi, M. Analysis of fluctuation of atmospheric parameters and its impact on performance of CPV. Aip Conf. Proc. 2018, 2012, 080002. [Google Scholar]
- Araki, K.; Lee, K.H.; Yamaguchi, M. Impact of the atmospheric conditions to the bandgap engineering of multi-junction cells for optimization of the annual energy yield of CPV. Aip Conf. Proc. 2017, 1881, 070002. [Google Scholar]
- Araki, K.; Ota, Y.; Lee, K.H.; Nishioka, K.; Yamaguchi, M. Improvement of the Spectral Sensitivity of CPV by Enhancing Luminescence Coupling and Fine-tuning to the Bottom-bandgap Matched to Local Atmospheric Conditions. Aip Conf. Proc. 2019, 2149, 060001. [Google Scholar]
- Araki, K.; Lee, K.H.; Yamaguchi, M. Bandgaps of multi-junction solar cells potentially determined at the sun height of the culmination on the winter solstice. Sol. Energy 2017, 153, 445–453. [Google Scholar] [CrossRef]
- King, R.R.; Bhusari, D.; Boca, A.; Larrabee, D.; Liu, X.Q.; Hong, W.; Fetzer, C.M.; Law, D.C.; Karam, N.H. Band gap-voltage offset and energy production in next-generation multijunction solar cells. Prog. Photovolt. Res. Appl. 2011, 19, 797–812. [Google Scholar] [CrossRef]
- Bird, R.E.; Riordan, C. Simple Solar Spectrum Model for Direct and Diffused Irradiation on Horizontal and Tilted at the Earth’s surface for Cloudless Atmospheres. Sol. Energy 1984, 32, 461–471. [Google Scholar] [CrossRef]
- Araki, K.; Ota, Y.; Sakai, T.; Lee, K.H.; Nishioka, K.; Yamaguchi, M. Energy yield prediction of multi-junction cells considering atmospheric parameters fluctuation using Monte Carlo methods. In Proceedings of the PVSEC-27, Otsu, Japan, 12–17 November 2017. [Google Scholar]
- Araki, K.; Ota, Y.; Sakai, T.; Lee, K.H.; Yamaguchi, M. Inherent uncertainty of energy ratings of multi-junction cells by the fluctuation of atmospheric parameters. In Proceedings of the PVSEC-27, Otsu, Japan, 12–17 November 2017. [Google Scholar]
- Ota, Y.; Ueda, K.; Takamoto, T.; Nishioka, K. Output evaluation of a world’s highest efficiency flat sub module with InGaP/GaAs/InGaAs inverted triple-junction solar cell under outdoor operation. Jpn. J. Appl. Phys. 2018, 57, 08RD08. [Google Scholar] [CrossRef]
- Takamoto, T.; Washio, H.; Juso, H. Application of InGaP/GaAs/InGaAs triple junction solar cells to space use and concentrator photovoltaic. In Proceedings of the 2014 IEEE 40th Photovoltaic Specialist Conference (PVSC), Denver, CO, USA, 8–13 June 2014; pp. 0001–0005. [Google Scholar]
- Derkacs, D.; Bilir, T.; Sabnis, V.A. Luminescent coupling in GaAs/GaInNAsSb multijunction solar cells. IEEE J. Photovolt. 2012, 3, 520–527. [Google Scholar]
- Kamath, H.G.; Ekins-Daukes, N.J.; Araki, K.; Ramasesha, S.K. The potential for concentrator photovoltaics: A feasibility study in India. Prog. Photovolt. Res. Appl. 2019, 27, 316–327. [Google Scholar] [CrossRef]
- Kamath, H.G.; Ekins-Daukes, N.J.; Araki, K.; Ramasesha, S.K. Performance analysis and fault diagnosis method for concentrator photovoltaic modules. IEEE J. Photovolt. 2018, 9, 424–430. [Google Scholar] [CrossRef]
- Massey, F.J., Jr. The Kolmogorov-Smirnov test for goodness of fit. J. Am. Stat. Assoc. 1951, 46, 68–78. [Google Scholar] [CrossRef]
- Lee, K.H.; Araki, K.; Wang, L.; Kojima, N.; Ohshita, Y.; Yamaguchi, M. Assessing material qualities and efficiency limits of III–V on silicon solar cells using external radiative efficiency. Prog. Photovolt. Res. Appl. 2016, 24, 1310–1318. [Google Scholar] [CrossRef]
- Green, M.A. Radiative efficiency of state-of-the-art photovoltaic cells. Prog. Photovolt. Res. Appl. 2012, 20, 472–476. [Google Scholar] [CrossRef]
- Chan, N.L.; Ekins-Daukes, N.J.; Adams, J.G.J.; Lumb, M.P.; Gonzalez, M.; Jenkins, P.P.; Vurgaftman, I.; Meyer, J.R.; Walters, R.J. Optimal bandgap combinations—Does material quality matter? IEEE J. Photovolt. 2012, 2, 202–208. [Google Scholar] [CrossRef]
- Yamaguchi, M.; Amano, C.; Itoh, Y. Numerical analysis for high-efficiency GaAs solar cells fabricated on Si substrates. J. Appl. Phys. 1989, 66, 915–919. [Google Scholar] [CrossRef]
- Vogel, E.M. Glasses as nonlinear photonic materials. J. Am. Ceram. Soc. 1989, 72, 719–724. [Google Scholar] [CrossRef]
- Lea, C.T. Crossover minimization in directional-coupler-based photonic switching systems. IEEE Trans. Commun. 1988, 36, 355–363. [Google Scholar] [CrossRef]
- Park, I.; Lee, H.S.; Kim, H.J.; Moon, K.M.; Lee, S.G.; Beom-Hoan, O.; Park, S.G.; Lee, E.H. Photonic crystal power-splitter based on directional coupling. Opt. Express 2004, 12, 3599–3604. [Google Scholar] [CrossRef]
- Martinez, A.; Cuesta, F.; Marti, J. Ultrashort 2-D photonic crystal directional couplers. IEEE Photonics Technol. Lett. 2003, 15, 694–696. [Google Scholar] [CrossRef]


| CPV 1 | Normal Installation | |
|---|---|---|
| Solar spectrum | Only direct | A mixture of direct, diffused from the sky, and reflection |
| Angle | Always normal | Varies by time and seasons |
| Spectrum by angle | Constant (only normal) | Needs consider coupling to angle |
| Range and Type | Description | |
|---|---|---|
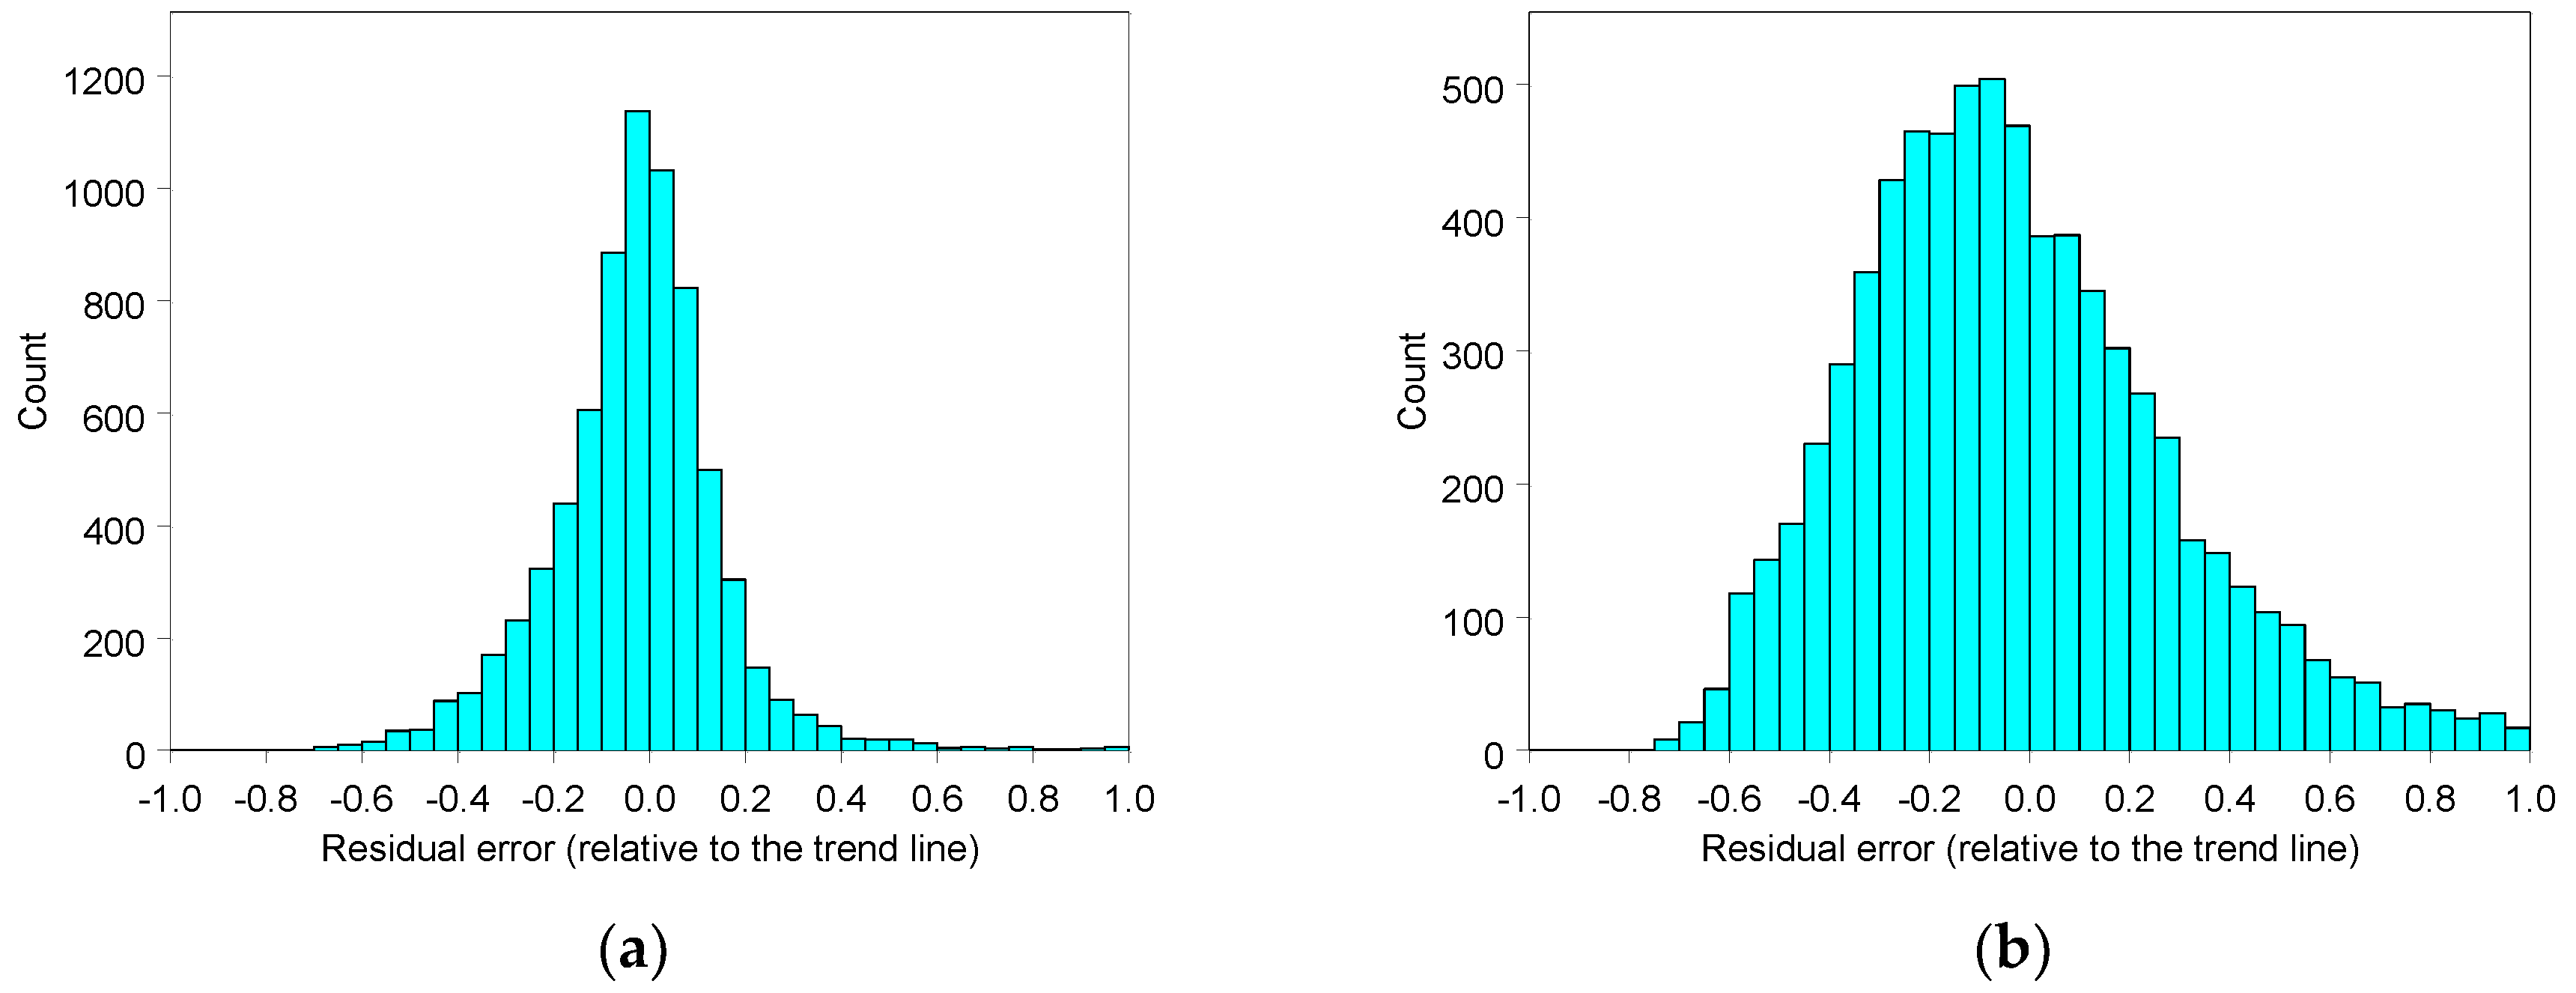
| Variation factor in aerosol density | Normal distribution centered on 0 | Calculated by the residual errors in the measured point form the smooth trend line. |
| Variation factor in water precipitation | Normal distribution centered on 0 | Calculated by the residual errors in the measured point form the smooth trend line. |
| Variation factor in solar irradiance 1 | Ranged uniform distribution in [–1,1] | −1: Lowest irradiance year, 0: Normal year, 1: Highest irradiance year. The irradiance data is calculated by the linear coupling of three parameters depends on the value of the probability factor. The base irradiance data was given in 24 h × 365 days by METPV-11 and METPV-Asia database. |
| Parent Parameters | Description | |
|---|---|---|
| Aerosol density | Variation factor in aerosol density | The variation factor gives a relative displacement from the trend line of the aerosol density. |
| Water precipitation | Variation factor in water precipitation | The variation factor gives a relative displacement from the trend line of water precipitation. |
| Direct irradiance | Variation factor in solar irradiance | Calculated by linear coupling of the data of the highest year, normal year, and the lowest year depends on the value of the probability factor. |
| Diffused irradiance from the sky | Variation factor in solar irradiance | Calculated by linear coupling of the data of the highest year, normal year, and the lowest year depends on the value of the probability factor. |
| The slope angle of the installation 1 | Both direct and diffused solar irradiance | Calculated by the optimization calculation given by the datasets of the solar irradiance affected by the variation factor in solar irradiance (parent parameter). |
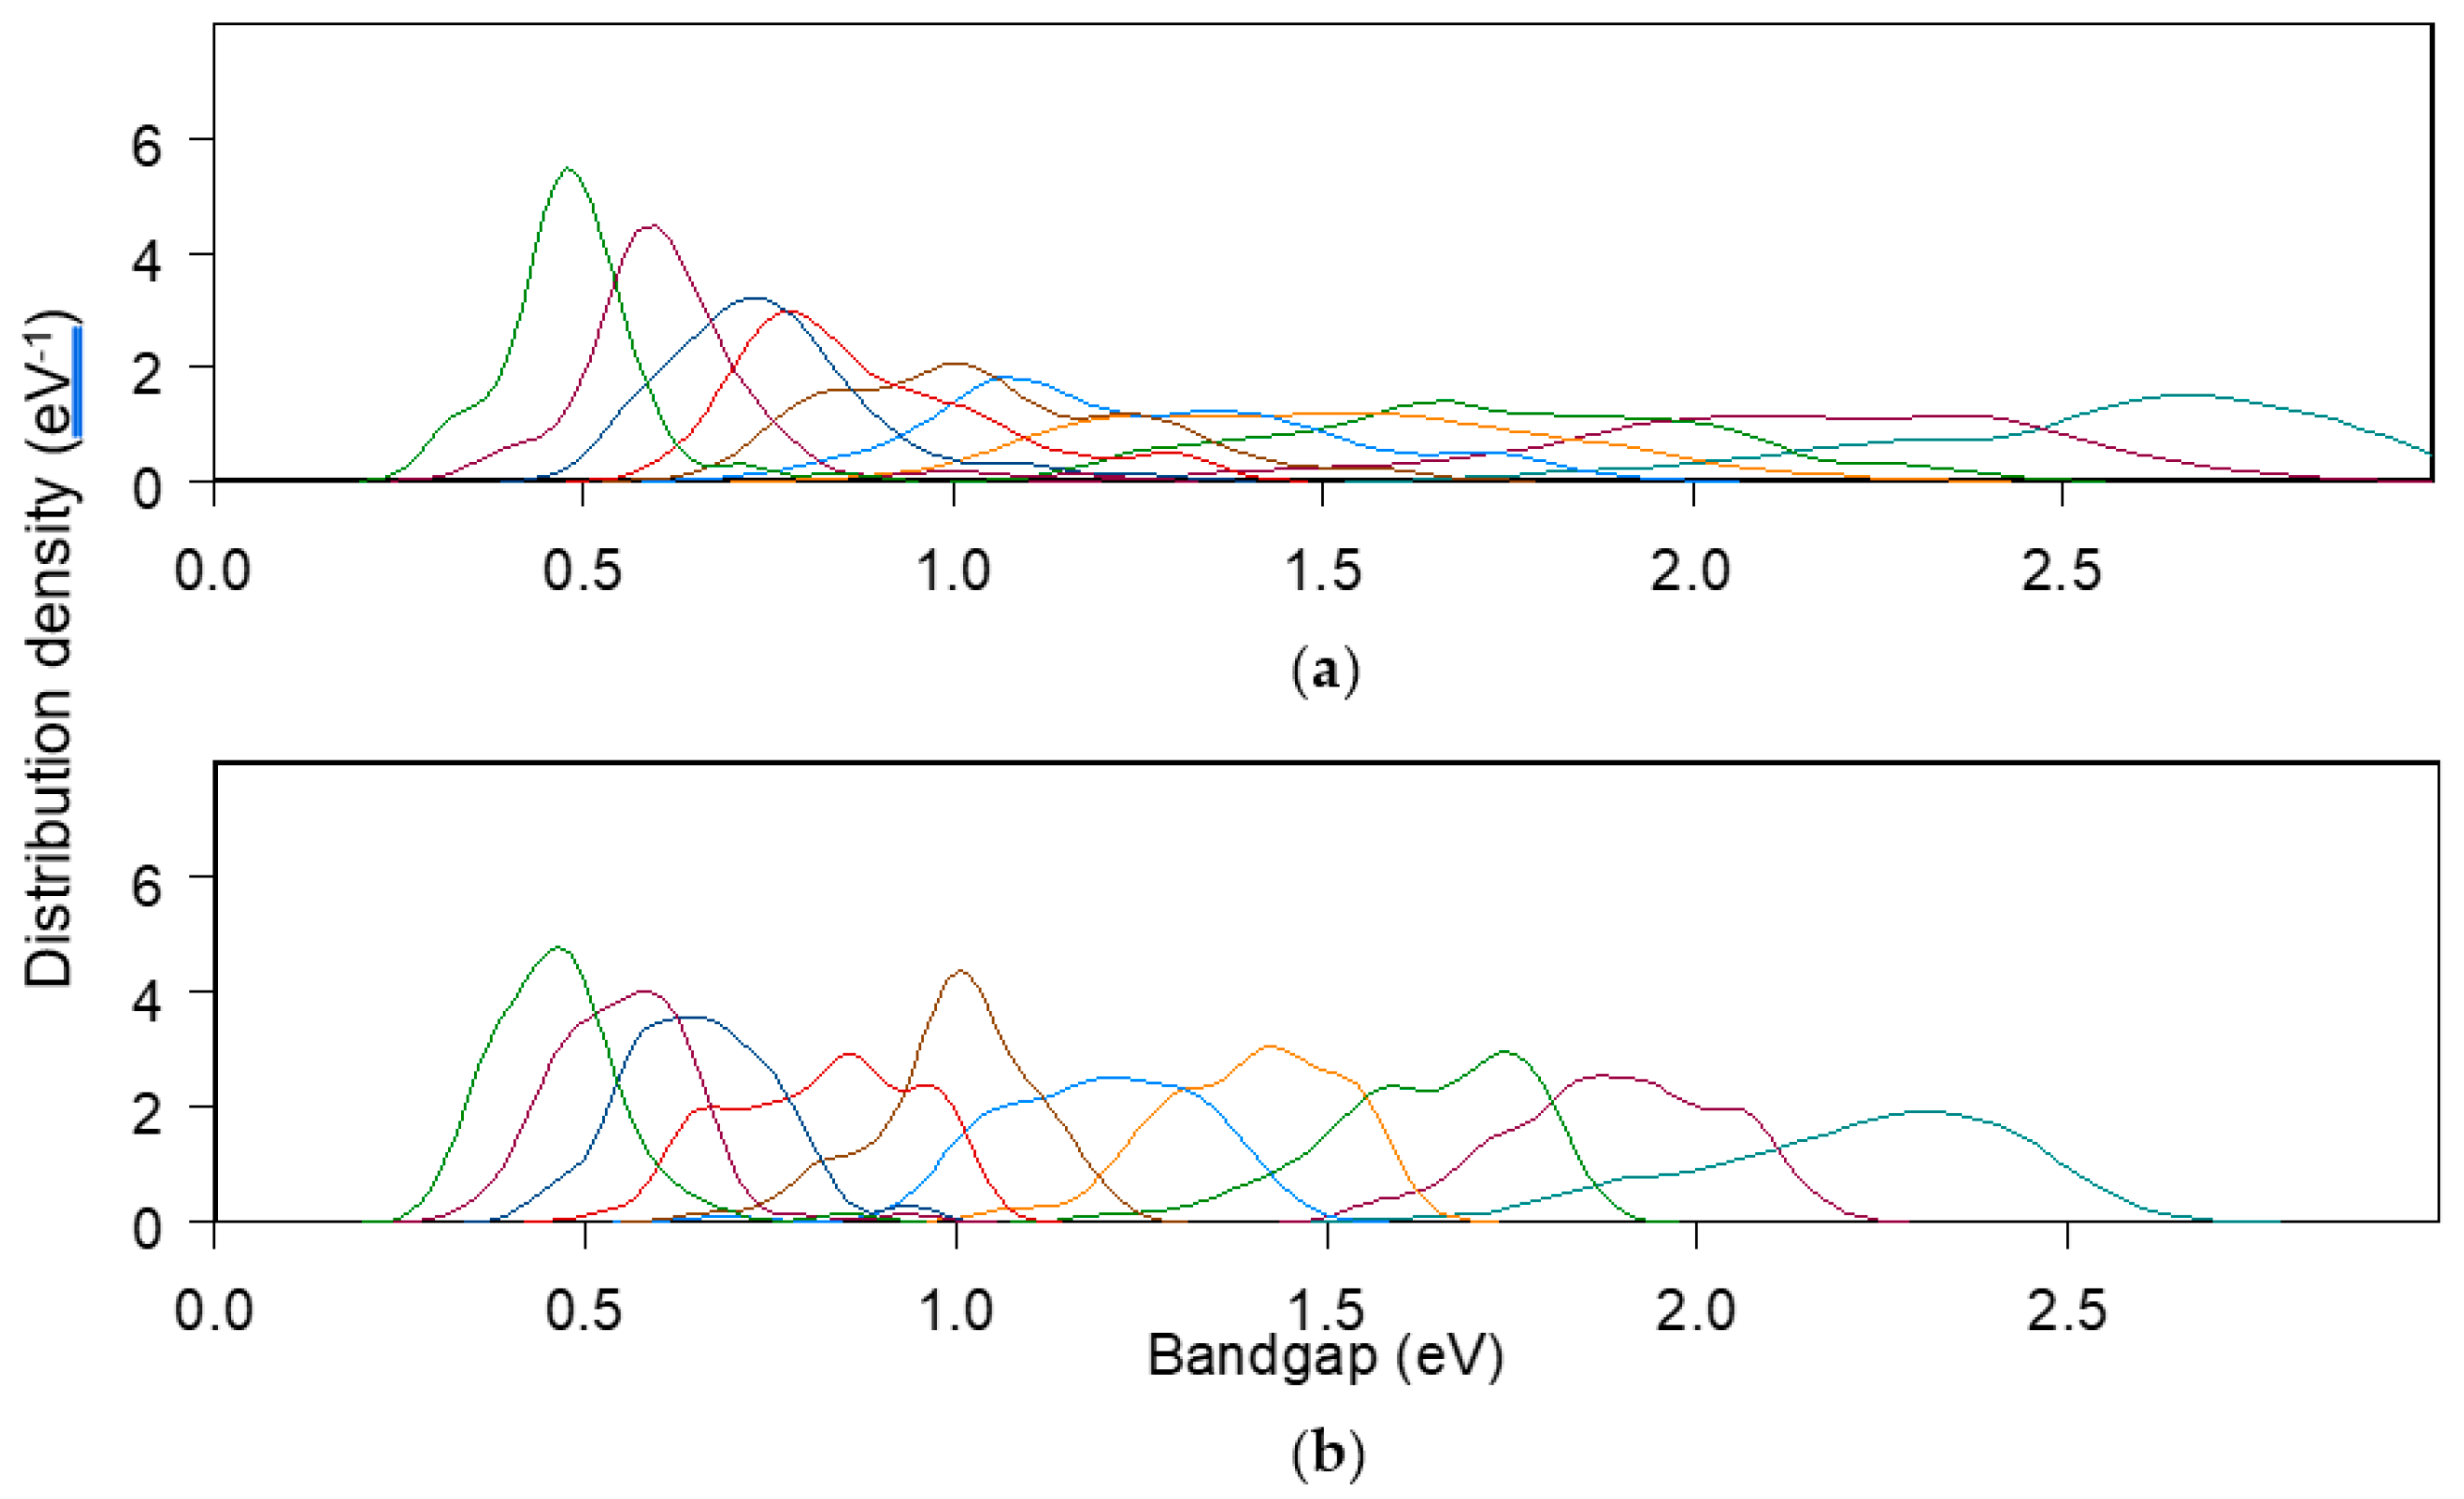
| Bandgap Energy (eV) from Top to Bottom Junction | ||||||||||
|---|---|---|---|---|---|---|---|---|---|---|
| 2J | 1.72 ± 0.03 | 1.12 ± 0.02 | ||||||||
| 3J | 1.89 ± 0.05 | 1.33 ± 0.07 | 0.89 ± 0.08 | |||||||
| 4J | 1.99 ± 0.07 | 1.47 ± 0.07 | 1.07 ± 0.09 | 0.73 ± 0.11 | ||||||
| 5J | 2.11 ± 0.09 | 1.63 ± 0.07 | 1.27 ± 0.09 | 0.97 ± 0.08 | 0.72 ± 0.10 | |||||
| 6J | 2.08 ± 0.15 | 1.68 ± 0.11 | 1.34 ± 0.11 | 1.07 ± 0.11 | 0.84 ± 0.11 | 0.66 ± 0.11 | ||||
| 7J | 2.17 ± 0.16 | 1.80 ± 0.11 | 1.48 ± 0.10 | 1.21 ± 0.12 | 0.99 ± 0.11 | 0.77 ± 0.12 | 0.62 ± 0.12 | |||
| 8J | 2.19 ± 0.16 | 1.84 ± 0.09 | 1.53 ± 0.11 | 1.28 ± 0.10 | 1.05 ± 0.10 | 0.86 ± 0.09 | 0.67 ± 0.09 | 0.55 ± 0.09 | ||
| 9J | 2.25 ± 0.19 | 1.88 ± 0.13 | 1.61 ± 0.12 | 1.37 ± 0.11 | 1.13 ± 0.10 | 0.95 ± 0.10 | 0.70 ± 0.10 | 0.62 ± 0.08 | 0.52 ± 0.08 | |
| 10J | 2.21 ± 0.21 | 1.89 ± 0.14 | 1.63 ± 0.14 | 1.40 ± 0.12 | 1.19 ± 0.14 | 1.00 ± 0.11 | 0.82 ± 0.12 | 0.66 ± 0.10 | 0.55 ± 0.09 | 0.46 ± 0.09 |
© 2019 by the authors. Licensee MDPI, Basel, Switzerland. This article is an open access article distributed under the terms and conditions of the Creative Commons Attribution (CC BY) license (http://creativecommons.org/licenses/by/4.0/).
Share and Cite
Araki, K.; Ota, Y.; Saiki, H.; Tawa, H.; Nishioka, K.; Yamaguchi, M. Super-Multi-Junction Solar Cells—Device Configuration with the Potential for More Than 50% Annual Energy Conversion Efficiency (Non-Concentration). Appl. Sci. 2019, 9, 4598. https://doi.org/10.3390/app9214598
Araki K, Ota Y, Saiki H, Tawa H, Nishioka K, Yamaguchi M. Super-Multi-Junction Solar Cells—Device Configuration with the Potential for More Than 50% Annual Energy Conversion Efficiency (Non-Concentration). Applied Sciences. 2019; 9(21):4598. https://doi.org/10.3390/app9214598
Chicago/Turabian StyleAraki, Kenji, Yasuyuki Ota, Hiromu Saiki, Hiroki Tawa, Kensuke Nishioka, and Masafumi Yamaguchi. 2019. "Super-Multi-Junction Solar Cells—Device Configuration with the Potential for More Than 50% Annual Energy Conversion Efficiency (Non-Concentration)" Applied Sciences 9, no. 21: 4598. https://doi.org/10.3390/app9214598
APA StyleAraki, K., Ota, Y., Saiki, H., Tawa, H., Nishioka, K., & Yamaguchi, M. (2019). Super-Multi-Junction Solar Cells—Device Configuration with the Potential for More Than 50% Annual Energy Conversion Efficiency (Non-Concentration). Applied Sciences, 9(21), 4598. https://doi.org/10.3390/app9214598