Microscopic Multiple Fatigue Crack Simulation and Macroscopic Damage Evolution of Concrete Beam


1
Jiansu Key Laboratoryof Engineering Mechanics, Southeast Uiversity, Nanjing 210096, China
2
Department of Engineering Mechanics, Southeast University, Nanjing 210096, China
3
School of Aerospace Engineering and Applied Mechanics, Tongji University, Shanghai 200092, China
*
Author to whom correspondence should be addressed.
Appl. Sci. 2019, 9(21), 4664; https://doi.org/10.3390/app9214664
Submission received: 5 October 2019
/
Revised: 24 October 2019
/
Accepted: 31 October 2019
/
Published: 1 November 2019
(This article belongs to the Special Issue Fracture and Fatigue Assessments of Structural Components)
Abstract
:Microcracks in concrete can coalesce into larger cracks that further propagate under repetitive load cycles. Complex process of crack formation and growth are essentially involved in the failure mechanism of concrete. Understanding the crack formation and propagation is one of the core issues in fatigue damage evaluation of concrete materials and components. In this regard, a numerical model was formulated to simulate the thorough failure process, ranging from microcracks growth, crack coalescence, macrocrack formation and propagation, to the final rupture. This model is applied to simulate the fatigue rupture of three-point bending concrete beams at different stress levels. Numerical results are qualitatively consistent with the experimental observations published in literature. Furthermore, in the framework of damage mechanics, one damage variable is defined to reflect stiffness reduction caused by fatigue loading. S-N curve is subsequently computed and the macroscopic damage evolution of concrete beams are achieved. By employing the combined approaches of fracture mechanics and damage mechanics, made possible is the damage evolution of concrete beam as well as the microscopic multiple fatigue crack simulation. The proposed approach has the potential to be applied to the fatigue life assessment of materials and components at various scales in engineering practice.
1. Introduction
Fatigue problems are prevalent in the service life of concrete structures such as bridge slabs, highway pavements and offshore structures [1,2,3]. Concrete lies in the category of quasi-brittle material and it is microscopically heterogeneous. Combination of concrete and other materials are extensively applied in engineering practice [4,5,6]. A large number of flaws are inevitably created before the loading, which can be considerably attributed to the loss of concrete moisture [7]. Under repetitive fatigue load cycles, pre-existing flaws or microcracks in concrete can trigger the initiation, coalesce into larger cracks that further propagate, ultimately leading to the final rupture. The so-called fatigue damage accumulation is a progressive, permanent and localized internal changes in the concrete. Complex process of crack formation and growth are essentially involved in the failure mechanism of concrete. Understanding the crack formation and propagation is one of the core issues in fatigue damage evaluation of concrete materials and components. How crack progression throughout the fatigue life affects and causes the final failure modes remains to be clarified.
The approaches of damage mechanics and fracture mechanics are generally employed to model the progressive fatigue accumulation in concrete materials [8,9,10,11,12]. In the framework of damage mechanics, a damage variable is required to be defined. A physically reasonable damage evolution law needs to be formulated such that the progressive material degradation caused by microcrack initiation, coalescence and propagation is reflected through the process. Both the microcrack evolution and stiffness reduction simultaneously reflect the material deterioration, microscopically and macroscopically. It should be pointed out that, in the concepts of damage mechanics, it is assumed that there are no pre-existing microcracks or flaws in material specimens. Damage evolution is a continuous process that describes damage or strain localization and characterizes the fatigue behavior of concrete, though microcracks are randomly distributed in specimens.
A series of fatigue models have been formulated based on thermodynamics concepts in the framework of damage mechanics [13,14]. Progressive stiffness reduction is straightforwardly reflected in these models. Nevertheless, most of these models are empirical and lack of physical basis. Damage parameters are highly dependent on experimental data. In recent years, state-of-the-art experimental technology has been introduced to this field. By using industrial computed tomography (ICT) technology, spatial distribution of fatigue cracks within concrete is observed. Subsequently a macroscopic fatigue damage parameter D is subsequently defined based on the quantitative description method of the overall distribution of fatigue cracks in concrete [15]. This combined micro–macro approach can better characterize the evolution process of material fatigue damage of concrete under compression from the overall distribution of fatigue cracks. A refined engineering rule for the assessment of remaining fatigue life of concrete under compressive cyclic loading with varying amplitude is proposed in [16]. The proposed empirical rule is derived based on a combined numerical and experimental investigation of the loading sequence effect. The equivalent tensile strain rate is adopted to govern the fatigue damage evolution in the applied modeling approach. It is generally accepted that models derived from physical principles are relatively reliable compared to the empirical models. These physical laws include energy principles, dimensional analysis as well as similitude concepts. It is noteworthy, a fatigue model for plain concrete under variable amplitude loading is proposed in [17] by unifying the concepts of damage mechanics and fracture mechanics through an energy equivalence. The whole work is on the basis of thermodynamic framework using the principles of dimensional analysis and self-similarity. A closed form expression for dual dissipation potential is derived. A damage evolution law is further proposed to compute damage in the volume element subjected to fatigue loading. This proposed model incorporates the complex behavior of concrete under fatigue and provides a more rational method for fatigue life evaluation of concrete materials and components. Some other physically based constitutive modeling of concrete fatigue can be found in [9,14,18].
Fracture mechanics serves the ideal mechanistic tool for concrete fatigue damage evolution, considering the inherent microcracks and flaws in concrete. Fracture mechanics approach is also extensively applied to crack initiation, crack growth rate, crack density evolution and stiffness degradation in other materials such as composite laminates [19,20,21]. The fatigue models in fracture mechanics are mostly the empirical Paris type equation, in which the crack growth rate with respect to number of fatigue load cycles is correlated to the stress intensity factor range. Not surprisingly, the Paris law is empirically formulated on the basis of metallic fatigue. Efforts have been taken to modify the Paris law by introducing extra crack growth influencing parameters [22,23]. Based on previous models, a newly proposed fatigue crack propagation model for concrete beam incorporates the effect of loading frequency of applied load, loading history as well as size effect parameters. An analytical crack growth model is developed to predict fatigue behavior of quasi-brittle materials in [24]. Early work related to concrete fatigue implies that parameters in the classical power law are dependent on micro-structural size, crack size and size scale [23]. An improved crack propagation model for plain concrete under fatigue loading is derived in [25], considering the effect of critical energy dissipation in fatigue. The so-called fatigue fracture energy is able to capture the observed size effect in concrete fatigue. The model is analytical and influence of fracture process zone is incorporated in the proposed formulation. An irreversible cohesive zone model for interface fatigue crack growth simulation is developed in [26]. The improved CZM is physically based and the traction–separation behavior does not follow a predefined approach. This proposed model for the computational simulation of FCG provides a crucial step in the direction of mechanistic mode developments in the area of fatigue crack growth. A predictive cohesive modeling framework for corrosion fatigue is proposed in [27]. These CZMs could also offer reference for concrete fatigue modeling.
In recent years, it is noteworthy that efforts are particularly being devoted to both microscopic and macroscopic aspects [28,29,30]. A microplane constitutive damage model is developed in [28]. The proposed model is able to describe both the fatigue crack growth and the nonlinear triaxial damage behavior of concrete. A discrete element modeling approach for fatigue damage growth in cemented materials are developed in [29]. The model formulation is based on coupling damage mechanics and plasticity theory and combining with a fatigue damage evolution law to describe the degrading response of cemented materials subjected to cyclic loading. Global fatigue damage response as well as microstructural effects could be reflected. A physical stochastic damage model for concrete subjected fatigue loading is formulated in [30]. It could be put in the framework of mesoscopic stochastic fracture models that are capable of reflecting the general nonlinearity and randomness in the mechanical behavior of concrete. It is fair to say, our work is motivated by the aforementioned efforts.
In this context, the purpose of approaches related to damage or fracture mechanics is to develop effective models that are able to reflect the progressive material degradation under fatigue loading. It shall be pointed out that the model is stipulated to pure concrete materials, the internal longitudinal and transverse reinforcements with related effects [4,5,6] are not considered in the present work. Based on these proposed models, attempts have been particularly made to the numerical simulation of fatigue [18,31]. The advantage of implementing a developed fatigue model in available finite element codes is that both constitutive equations and interface models can be included in the numerical simulation. The fatigue and mechanical behaviors of concrete materials and components are predicted through the numerical implementation in commercial FE software. A numerical procedure is developed to simulate crack propagation behaviors at the concrete aggregate-matrix interface in [31]. It shall be pointed out that, modeling of single aggregate-matrix interface crack is studied. Based on the conclusions in [31], it is assumed that interface crack can be mapped into idealized crack along the main axis of aggregate to solve the multiple crack coalescence and propagation in concrete. This leads to the work described in [32]. On the basis of these work, microscopic multiple fatigue crack simulation and macroscopic damage evolution of concrete beam subjected to cyclic loads is investigated in the present work. We are mainly focused on the fatigue damage analysis microscopically and macroscopically. In this regard, the aim of the present work is to define a damage variable that reflect the fatigue evolution of concrete specimens, on the basis of the multiple crack simulation in concrete beams.
The work presented in this paper is structured as follows: described in Section 2 are the numerical model for multiple crack simulation and fatigue crack growth law. Numerical modeling of three-point bending beams are presented in Section 3. Macroscopic fatigue damage analysis is discussed in Section 4. The main conclusions are summarized in Section 5.
2. Microscopic Multiple Crack Simulation and Fatigue Crack Growth Law
At early age, initial microcracks usually emerge at the interface of cement paste and aggregate due to the natural shrinkage combined with other factors at the time of curing. The crack could propagate along the interface or penetrate into matrix or aggregate. In our previous work [31], modeling of one crack propagation in concrete is made possible (Figure 1). The multiple-phase structure of concrete material could be simplified as a continuum with multiple microcracks. Here we are mainly focused on simulation of multiple cracks as well as their parallel growths under fatigue loads. Figure 2 shows an example of the multiple crack model for concrete material.
2.1. Modeling of Multiple Crack Growth
When a number of microcracks start to propagate simultaneously, induced by external fatigue load, the morphology of crack linking with each other may be very complex. However, it could be decomposed into three basic modes. As shown in Figure 3a, the two endpoints of Crack 1 and 2 meet together such that the two cracks merge into a single crack. Figure 3b shows Crack 4 is growing intersecting with Crack 3. In this situation, stress singularity at the intersected endpoint of Crack 4 vanishes—this crack tip will stop growing. Therefore, the situation of Figure 3c will not happen in the present work, though it could be simulated as well.
In the present study, a program has been developed comprehensively to achieve all crack growing situations, including detecting and treating crack merging and intersecting, multiple crack growth, and detecting boundary edges [32]. Presented in the highlighted area of Figure 2 is a relatively complicated situation of crack growth and multiple crack linking. It could be seen that the method could successfully simulate the concurrent growth of microcracks, crack coalescence, the formulation and growth of macrocracks, and the final rupture. Details of the approach can be found in [31,32]. On the basis of the formulated multiple crack simulation, we are mainly focused on the fatigue crack growth in concrete materials.
2.2. Fatigue Crack Growth Law
The fatigue crack propagation law is formulated by Paris and Erdogan based on experiments [33], which points out the relationship between stress intensity factor and crack growth rate, namely
Here refers to the crack growth rate. a is the current crack length, and is the incremental stress intensity factor. C and m are the empirical fatigue constants obtained from material tests. In this paper, a modified Paris law is introduced to govern the growth behavior of microcracks. The whole crack growth process is divided into three stages as displayed in Figure 4.
- In the low rate zone (Stage I) , the crack is set not to propagate because the rate is very low. The fatigue threshold is chosen as
- In the high rate zone (Stage III) , the crack will quickly propagate in an unstable fashion, finally lead to rupture. For the convenience of numerical simulation, here in this zone, the growth rate is practically set to be . Also, the 2nd fatigue threshold is set to be
Microcracks subjected to repetitive load, start to propagate, though advancement of some cracks can be ignored. Subsequently, these cracks may coalesce into several macrocracks and finally reach to the stage of final rupture. In the actual computing process, one ‘computational step’ is not equal to one ‘load cycle step’. Since the crack shows a ‘significant’ growth only after the load has been repeated for a certain number of cycles, -controlled rather than N-controlled strategy is used here. In each step, marked by superscript i, the growth length of the crack that has the highest rate, assuming to be the crack, is controlled to be . The number of load cycles is determined by the following formula
Then, incremental lengths for all cracks in this step could be calculated as
Summing up to get the total fatigue life
Displayed in Figure 5 is the flowchart of numerical algorithm for multiple fatigue crack simulation. It shall be emphasized that both macroscopic and microscopic models are created such that a multi-scale model is further created via interface linking. Fatigue crack growth law is subsequently adopted to study the multiple microcrack growth, coalescence and macrocrack formation. After the final rupture is reached, result extraction and data analysis is made possible.
3. Fatigue Modeling of Three-Point Bending Beams
3.1. Three-Point Bending Beam Model
Beam is an important object in the study of concrete fatigue. Liner elastic constitution law is adopted for concrete. The model discussed in this paper is a three-point bending beam with a length of L, height of H and thickness of T. A concentrated force F is applied at the mid-span point, refer to Figure 6.
In order to improve the computational efficiency, the whole model is divided into two areas, the macro-scale area (side area) and the micro-scale area (middle area). The difference between the two regions is: (1) The macro-scale region is considered as homogeneous material, while the micro-scale region is heterogeneous, meaning that this area contains randomly distributed microcracks, (2) the typical element size d of the two regions is different, is usually about 10 to 40 times of . The element size of middle area is usually about 0.2–0.4 mm. Eight-node quadrilateral elements are subsequently generated.
In order to accurately simulate the stress field at the crack tip and to obtain stress intensity factor in the microscale area, singular elements needs to be added at crack tips, as shown in the Figure 7d. On the interface between these two regions, the connections are made by forcing the displacements to be equal. On the interface, the nodes of the coarse mesh are the master nodes, and the nodes of the fine mesh are the slave nodes. That is to say, for any microscopic node locating at , its displacement is forced to be
Figure 8 shows a stress contour of a bending concrete beam at the stage of fatigue rupture. It could be seen that in a global sense, the numerical results agree with the corresponding conclusion from classical beam theory. Moreover, the stress level may fluctuate in the local area, which can be attributed to the microscopic heterogeneity in concrete material.
3.2. Case Design
As shown in Figure 6, beam height mm, length 800 mm, The concentrated sinusoidal loading is located at the middle span, and the loading frequency is 10 Hz. The parameter
is chosen to be constant 0.1, where and denote the maximum and minimum force per cycle, respectively. Considering that
We have
That is to say, in each step, we can simply apply on the beam to get at all crack tips. Also, stress level S is introduced as
Here is the bending capacity of this beam. For three-point bending case, could be estimated as 100 N via the formula
where is the tensile strength of concrete. In this paper, the value of S is tuned from 0.1 to 0.9, to investigate the influence of fatigue stress ratio.
3.3. Fatigue Failure Analysis
In order to perform fatigue failure analysis, it shall be defined that the ultimate fatigue load is reached once the nominal stiffness of the beam is only 5% left. The so-called macroscopic mechanical behaviors are substantially influenced by microscopic fatigue crack growth. A cycle-jump technique is employed to model load cycles such that the computational cost can be saved. In the simulations of regular cyclic loading scenarios with the same loading range, a cycle can be adopted to reduce the computational cost. As an example, the results at the stress level are shown here. The three-point bending concrete beam is ruptured after 42,000 load cycles. Figure 9 shows crack propagation diagrams of the whole failure process, where is the fatigue life of this specimen.
There are naturally a large number of distributed microscopic cracks in concrete, usually occurring on the mortar-aggregate interfaces during cement hydration process. Under the fatigue load, microcracks in tensile zone of the beam start to stably grow at a medium rate (Stage II) according to Paris law, as shown in Figure 9a,b. As the number of fatigue load increases, crack coalescence initially takes place at the lower left corner of the specimen. Localized damage subsequently appears. It shall be pointed out that, crack coalescence does not necessarily occur in the designated area. The localized damage at the lower left corner of the specimen here is a reflection of random distribution of microcracks in concrete. To be able to describe this stochastic behavior is the strongest point of our algorithm. Once macrocrack appears, fatigue crack growth start to accelerate (but still in a stable fashion), gradually entering into Stage III, as shown in Figure 9c,d. The formation of macrocrack can be firstly seen in Figure 9c. Its further propagation will lead to final beam rupture. It should be noted that at this stage, cracks in other areas still grow at a low or medium rate. At later period of fatigue rupture, the neutral axis gradually moves up, the macrocrack on the left side propagates at a high rate, and the localized damage (on the upper left side) increases dramatically, which eventually leads to the rupture of beam, as shown in Figure 9e.
It is noteworthy that the unsymmetrical pattern of crack formation and propagation is clearly displayed in the middle area of concrete beam. It is reflective of the microscopically stochastic phenomenon of crack distribution. This is the strong point that our proposed model is able to achieve.
3.4. Influence of Stress Level on Fatigue Behaviors
Figure 10 shows different failure patterns under various stress levels, where (a) and (b) represent the final crack configurations at low stress level () and high stress level (), respectively.
It could be observed that under low fatigue stress level, a relatively smaller number of microcracks propagate during the failure process. Rupture of the beam is mainly caused by one macrocrack, so the damage is highly localized. While in high fatigue stress situation, it could be seen that a relatively larger number of cracks have been propagating, thus macrocracks appear in large quantities. In rupture state, macrocracks scatter over the entire area. Calculated failure modes are basically consistent with the observed ones in literature [35], which could verify the effectiveness of the numerical model. In the experimental observation, macrocracks firstly emerge at certain local areas. Further crack progression will lead to final failure. It shall be emphasized that the experimental observation phenomenologically agrees with our numerical results. Quantitative agreement is limited.
4. Fatigue Damage Analysis of Concrete Beams
Numerical experiments are executed under different fatigue stress levels varying from to , from which the fatigue life could be extracted for each stress level. Made possible is the S-N curve that is for engineering reference. Furthermore, since the whole fatigue response has been recorded, macroscopic damage evolution could also be quantitatively analyzed.
4.1. Fatigue Life and S-N Curve
Table 1 lists the calculated results of the numerical experiments. It shows that when the stress level S of the fatigue load decreases from 0.9 to 0.1, the fatigue life of specimen gradually increases from 3000 to 201,000 cycles, refer to Figure 11.
S-N curve could also be plotted by fitting above data using the classical S-N exponential formula. Note each point represents the fatigue life under designated stress level.
Here we have and .
4.2. Macroscopic Damage Analysis
Though S-N curve is enough for engineering use to estimate remaining life, it has some limits when it comes to evaluating the current performance state of structure. This is because fatigue life estimation based on S-N curve has an implicit assumption that the fatigue damage is linearly accumulated. In fact, the fatigue damage evolution is a nonlinear process. The period from microcracks propagation and coalescence to the formation of macroscopic cracks is relatively longer, while the speed from the initiation of macrocracks to the final rupture is relatively fast. In this sense, damage evolution based fatigue evaluation is required. According to Lemaitre’s concept of damage variable [36], damage is related to stiffness reduction [37,38].
Here, D is the damage variable, denotes the effective stiffness in defect-free state, and is the stiffness in damaged state. Obviously, the larger D grows, especially near 1, the closer material or structure is to the failure state. For three-point bending beams, effective stiffness could be defined as
Here, F and d are mid-span force and displacement respectively, which could be extracted from calculated database. In defect-free or damage-free status, could be obtained as
where E is the initial Young’s modulus of concrete.
Curves of damage evolution at different stress levels are plotted in Figure 12. It can be observed that the fatigue damage evolution of concrete can be roughly divided into three stages. When the cycle ratio is less than 0.2, the damage value is relatively small, and the damage evolution rate is also slow. Growth rate of most microcracks fall in zone I. Crack coalescence has not occurred yet. With the increase of load cycles, damage evolution enters into a stable stage that the value of damage increases linearly with the number of load cycles. In this period, microscopic crack growth rate may vary from area to area (some areas in zone II, some still in zone I). Microcracks begin to link with others, gradually forming macroscopic cracks (crack coalescence). When cycle ratio reaches 0.8, structure enters into an unstable crack growth stage. Macroscopic cracks continue to propagate forward, merging small or microcracks along the rupture path. Correspondingly, the value of damage rapidly approaches the value of 1, finally leading to the fracture of beams.
5. Conclusions
The numerical model developed in this paper is directly based on microscopic mechanism of concrete fatigue. Thus it can simulate the fatigue growth of multiple microcracks in concrete, as well as the macroscopic damage evolution. The numerical method is applied to three-point bending beams. Results clearly show that, no matter from macroscopic or microscopic view, fatigue rupture of beams endures three stages: (1) Microcrack growth and coalescence, (2) the formulation of macrocracks and stable fatigue damage evolution, and (3) unstable crack growth and the final fracture of concrete beam.
It is also observed from the simulation that different stress levels of fatigue load can lead to different failure patterns. At low stress level, the rupture of beam is mainly caused by one (or several) macrocrack and damage is highly localized. For high fatigue stress situation, macrocracks appear in large quantities, mostly scattering over the entire area. The computed results are consistent with experimental observation in published literature.
The numerical model could be used to calculate S-N curve. The macroscopic damage evolution of concrete beams is achieved. Based on the results of damage evolution, structural fatigue assessment is also made possible.
Although the present work is about plain concrete, the method can also be applied to other types of concretes, such as high-performance concrete or fiber reinforce concrete, or even masonry materials and structures, as long as the fatigue failure is mainly caused by the growth of microcracks. Last but not least, it shall be pointed out that the numerical modeling is currently stipulated to 2D problems. Computational cost will be substantially added once it comes to 3D. Computational efficiency shall be further improved in our forthcoming work.
Author Contributions
Conceptualization, B.W., K.T. and Z.L.; methodology, code and software, B.W.; data analysis, K.W.; writing—original draft preparation, B.W.; writing—review and editing, K.T. and B.W.; supervision, Z.L.; funding acquisition, Z.L. and K.T.
Funding
This research was funded by National Natural Science Foundation of China under grant No. 11872278 and 51878154, and by the National Program on Major Research Project under grant No. 2016YFC0701301.
Conflicts of Interest
The authors declare no conflict of interest.
References
- Ovuoba, B.; Prinz, G.S. Investigation of residual fatigue life in shear studs of existing composite bridge girders following decades of traffic loading. Eng. Struct. 2018, 161, 134–145. [Google Scholar] [CrossRef]
- Dias, I.F.; Oliver, J.; Lemos, J.V.; Lloberas-Valls, O. Modeling tensile crack propagation in concrete gravity dams via crack-path-field and strain injection techniques. Eng. Fract. Mech. 2016, 154, 288–310. [Google Scholar] [CrossRef] [Green Version]
- Sun, Z.H.; Scherer, G.W. Effect of air voids on salt scaling and internal freezing. Cem. Concr. Res. 2010, 40, 260–270. [Google Scholar] [CrossRef]
- D’Amato, M.; Laterza, M.; Casamassima, V.M. Seismic performance evaluation of a multi-span existing masonry arch bridge. Open Civ. Eng. J. 2017, 11, 1191–1207. [Google Scholar] [CrossRef]
- Laterza, M.; D’Amato, M.; Braga, F.; Gigliotti, R. Extension to rectangular section of an analytical model for concrete confined by steel stirrups and/or FRP jackets. Compos. Struct. 2017, 176, 910–922. [Google Scholar] [CrossRef]
- Mander, J.B.; Priestley, M.J.N.; Park, R. Theoretical Stress-Strain Model for Confined Concrete. J. Struct. Eng.-ASCE 1988, 114, 1804–1826. [Google Scholar] [CrossRef]
- Khalilpour, S.; BaniAsad, E.; Dehestani, M. A review on concrete fracture energy and effective parameters. Cem. Concr. Res. 2019, 120, 294–321. [Google Scholar] [CrossRef]
- Ding, Z.D.; Li, J. A physically motivated model for fatigue damage of concrete. Int. J. Damage Mech. 2018, 27, 1192–1212. [Google Scholar] [CrossRef]
- Feng, D.C.; Ren, X.D.; Li, J. Stochastic damage hysteretic model for concrete based on micromechanical approach. Int. J. Non-Linear Mech. 2016, 83, 15–25. [Google Scholar] [CrossRef]
- Mai, S.H.; Le-Corre, F.; Foret, G.; Nedjar, B. A continuum damage modeling of quasi-static fatigue strength of plain concrete. Int. J. Fatigue 2012, 37, 79–85. [Google Scholar] [CrossRef] [Green Version]
- Ray, S.; Kishen, J.M.C. Fatigue crack growth due to overloads in plain concrete using scaling laws. Sadhana-Acad. Proc. Eng. Sci. 2012, 37, 107–124. [Google Scholar] [CrossRef]
- Simon, K.M.; Kishen, J.M.C. A multiscale approach for modeling fatigue crack growth in concrete. Int. J. Fatigue 2017, 98, 1–13. [Google Scholar] [CrossRef]
- Papa, E.; Taliercio, A. Anisotropic damage model for the multiaxial static and fatigue behaviour of plain concrete. Eng. Fract. Mech. 1996, 55, 163–179. [Google Scholar] [CrossRef]
- Rezazadeh, M.; Carvelli, V. A damage model for high-cycle fatigue behavior of bond between FRP bar and concrete. Int. J. Fatigue 2018, 111, 101–111. [Google Scholar] [CrossRef]
- Fan, Z.; Sun, Y. Detecting and evaluation of fatigue damage in concrete with industrial computed tomography technology. Constr. Build. Mater. 2019, 223, 794–805. [Google Scholar] [CrossRef]
- Baktheer, A.; Hegger, J.; Chudoba, R. Enhanced assessment rule for concrete fatigue under compression considering the nonlinear effect of loading sequence. Int. J. Fatigue 2019, 126, 130–142. [Google Scholar] [CrossRef]
- Keerthana, K.; Kishen, J.M.C. An experimental and analytical study on fatigue damage in concrete under variable amplitude loading. Int. J. Fatigue 2018, 111, 278–288. [Google Scholar] [CrossRef]
- Ding, Z.D.; Feng, D.C.; Ren, X.D.; Wang, J.F. Physically based constitutive modeling of concrete fatigue and practical numerical method for cyclic loading simulation. Eng. Fail. Anal. 2019, 101, 230–242. [Google Scholar] [CrossRef]
- Maragoni, L.; Carraro, P.A.; Peron, M.; Quaresimin, M. Fatigue behaviour of glass/epoxy laminates in the presence of voids. Int. J. Fatigue 2017, 95, 18–28. [Google Scholar] [CrossRef]
- Sisodia, S.M.; Gamstedt, E.K.; Edgren, F.; Varna, J. Effects of voids on quasi-static and tension fatigue behaviour of carbon-fibre composite laminates. J. Compos. Mater. 2015, 49, 2137–2148. [Google Scholar] [CrossRef]
- Malekan, M.; Carvalho, H. Analysis of a main fatigue crack interaction with multiple micro-cracks/voids in a compact tension specimen repaired by stop-hole technique. J. Strain Anal. Eng. Des. 2018, 53, 648–662. [Google Scholar] [CrossRef]
- Bazant, Z.P.; Xu, K.M. Size Effect in Fatigue Fracture of Concrete. ACI Mater. J. 1991, 88, 390–399. [Google Scholar]
- Bazant, Z.P.; Schell, W.F. Fatigue Fracture of High-Strength Concrete and Size Effect. ACI Mater. J. 1993, 90, 472–478. [Google Scholar]
- Paggi, M. Modelling fatigue in quasi-brittle materials with incomplete self-similarity concepts. Mater. Struct. 2011, 44, 659–670. [Google Scholar] [CrossRef]
- Bhowmik, S.; Ray, S. An improved crack propagation model for plain concrete under fatigue loading. Eng. Fract. Mech. 2018, 191, 365–382. [Google Scholar] [CrossRef]
- Roe, K.L.; Siegmund, T. An irreversible cohesive zone model for interface fatigue crack growth simulation. Eng. Fract. Mech. 2003, 70, 209–232. [Google Scholar] [CrossRef]
- Del Busto, S.; Betegon, C.; Martinez-Paneda, E. A cohesive zone framework for environmentally assisted fatigue. Eng. Fract. Mech. 2017, 185, 210–226. [Google Scholar] [CrossRef] [Green Version]
- Kirane, K.; Bazant, Z.P. Microplane damage model for fatigue of quasibrittle materials: Sub-critical crack growth, lifetime and residual strength. Int. J. Fatigue 2015, 70, 93–105. [Google Scholar] [CrossRef]
- Nguyen, N.H.T.; Bui, H.H.; Kodikara, J.; Arooran, S.; Darve, F. A discrete element modeling approach for fatigue damage growth in cemented materials. Int. J. Plast. 2019, 112, 68–88. [Google Scholar] [CrossRef]
- Wang, Y.P. Physical stochastic damage model for concrete subjected to fatigue loading. Int. J. Fatigue 2019, 121, 191–196. [Google Scholar] [CrossRef]
- Wu, B.; Tang, K. Modelling on crack propagation behaviours at concrete matrix-aggregate interface. Fatigue Fract. Eng. Mater. Struct. 2019, 42, 1803–1814. [Google Scholar] [CrossRef]
- Wu, B.; Li, Z.; Tang, K. Numerical modeling and analysis on micro-to-macro evolution of crack network for concrete materials. 2019; submitted. [Google Scholar]
- Paris, P.; Erdogan, F. A critical analysis of crack propagation laws. J. Basic Eng. 1963, 85, 528–533. [Google Scholar] [CrossRef]
- Lou, J.; Bhalerao, K.; Soboyejo, A.B.O.; Soboyejo, W.O. An investigation of the effects of mix strength on the fracture and fatigue behavior of concrete mortar. J. Mater. Sci. 2006, 41, 6973–6977. [Google Scholar] [CrossRef]
- Chen, C.; Cheng, L.J. Fatigue Behavior and Prediction of NSM CFRP-Strengthened Reinforced Concrete Beams. J. Compos. Constr. 2016, 20. [Google Scholar] [CrossRef]
- Lemaitre, J. A Course on Damage Mechanics; Springer Science & Business Media: Berlin/Heidelberg, Germany, 2010. [Google Scholar]
- Tang, K.K.; Li, Z.X.; Wang, J. Numerical simulation of damage evolution in multi-pass wire drawing process and its applications. Mater. Des. 2011, 32, 3299–3311. [Google Scholar] [CrossRef]
- Tang, K.K.; Li, Z.X.; He, D.D.; Zhang, Z.H. Evolution of plastic damage in welded joint of steel truss with pre-existing defects. Theor. Appl. Fract. Mech. 2010, 54, 117–126. [Google Scholar] [CrossRef]
Figure 1.
Schematic of single crack growth in concrete. (a) Schematic of concrete material; (b) growth of single microcrack.
Figure 1.
Schematic of single crack growth in concrete. (a) Schematic of concrete material; (b) growth of single microcrack.

Figure 2.
Multiple microcrack growth and linking: an example.
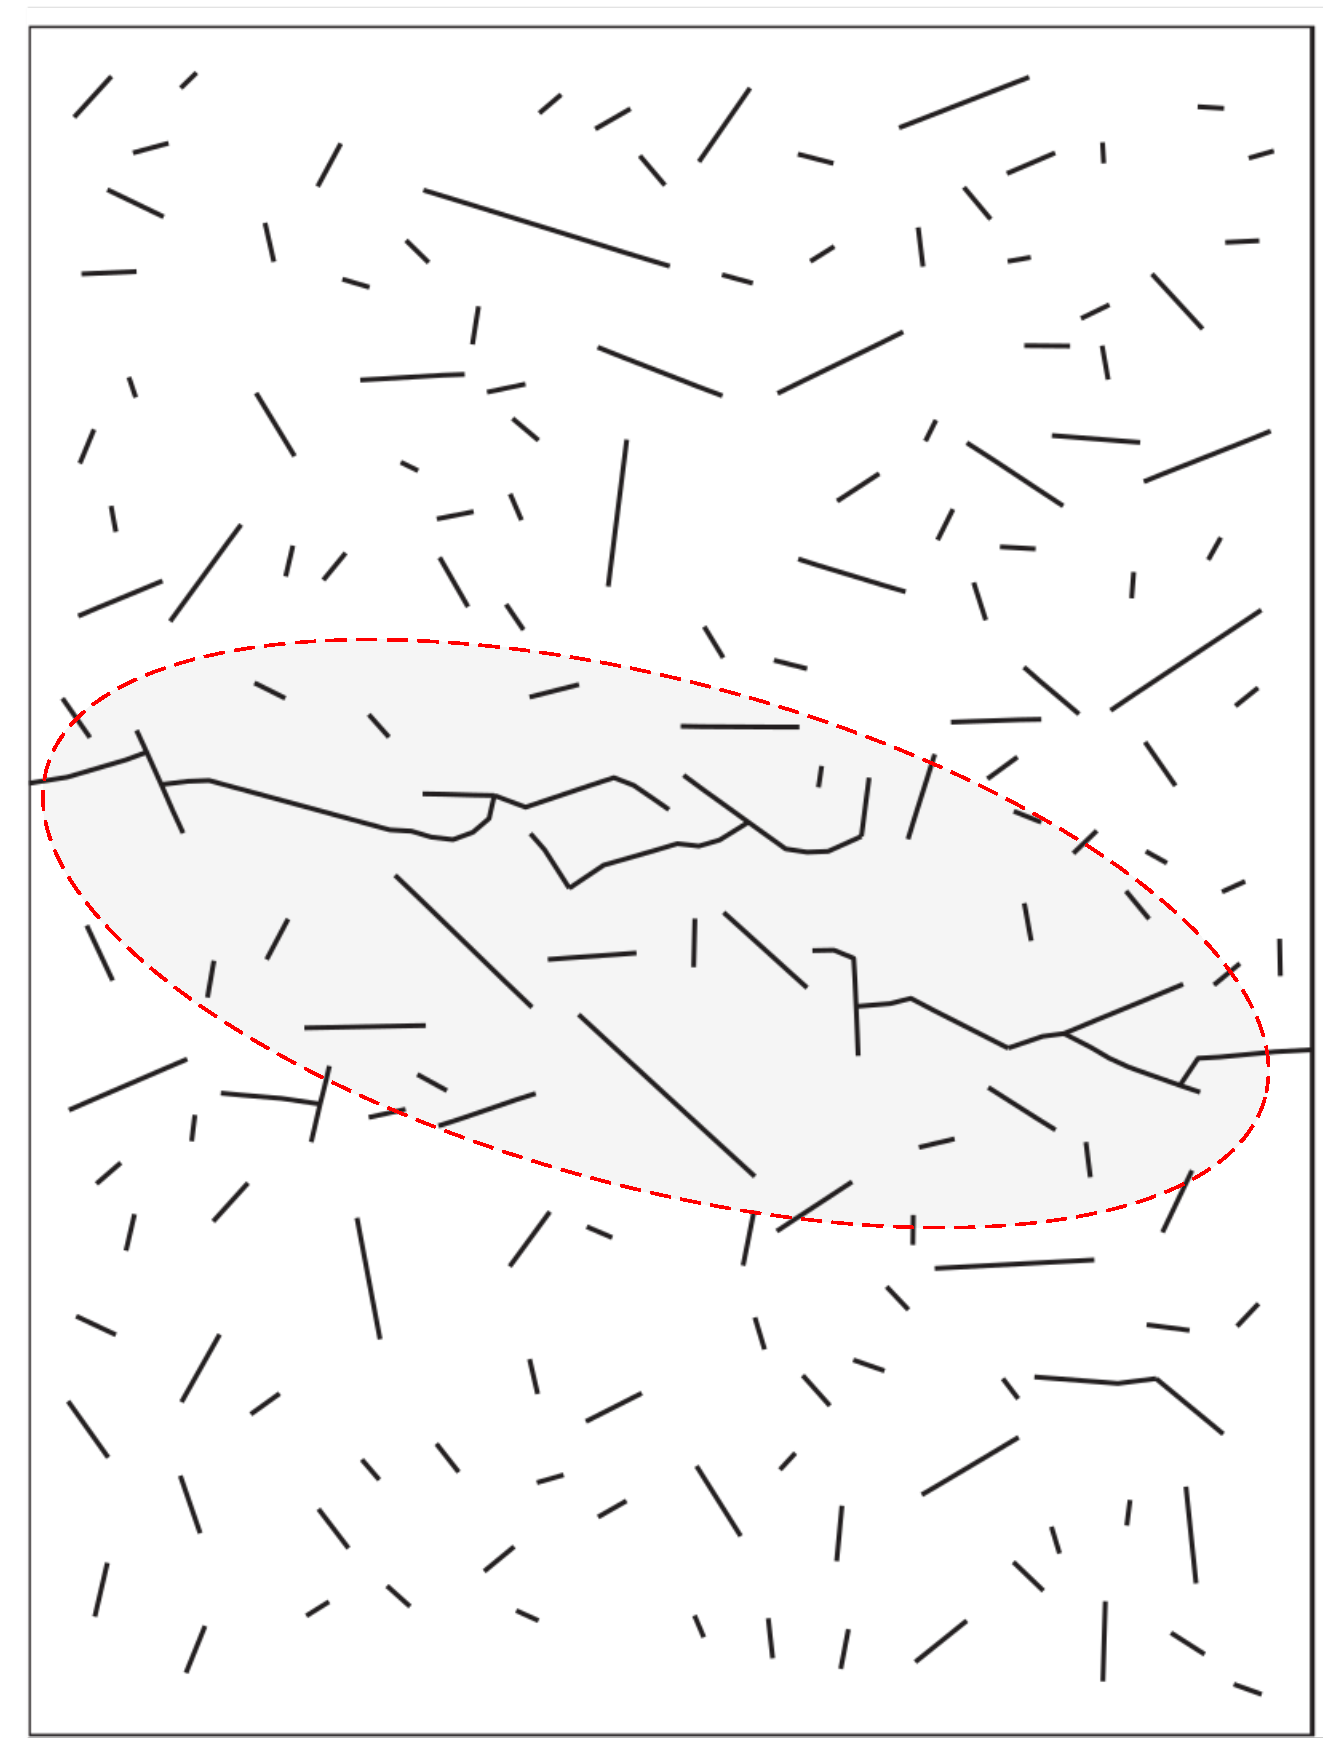
Figure 3.
Basic modes of crack linking. (a) meeting; (b) merging; (c) intersecting.

Figure 4.
Fatigue crack growth rate.

Figure 5.
Algorithm for concrete fatigue simulation.
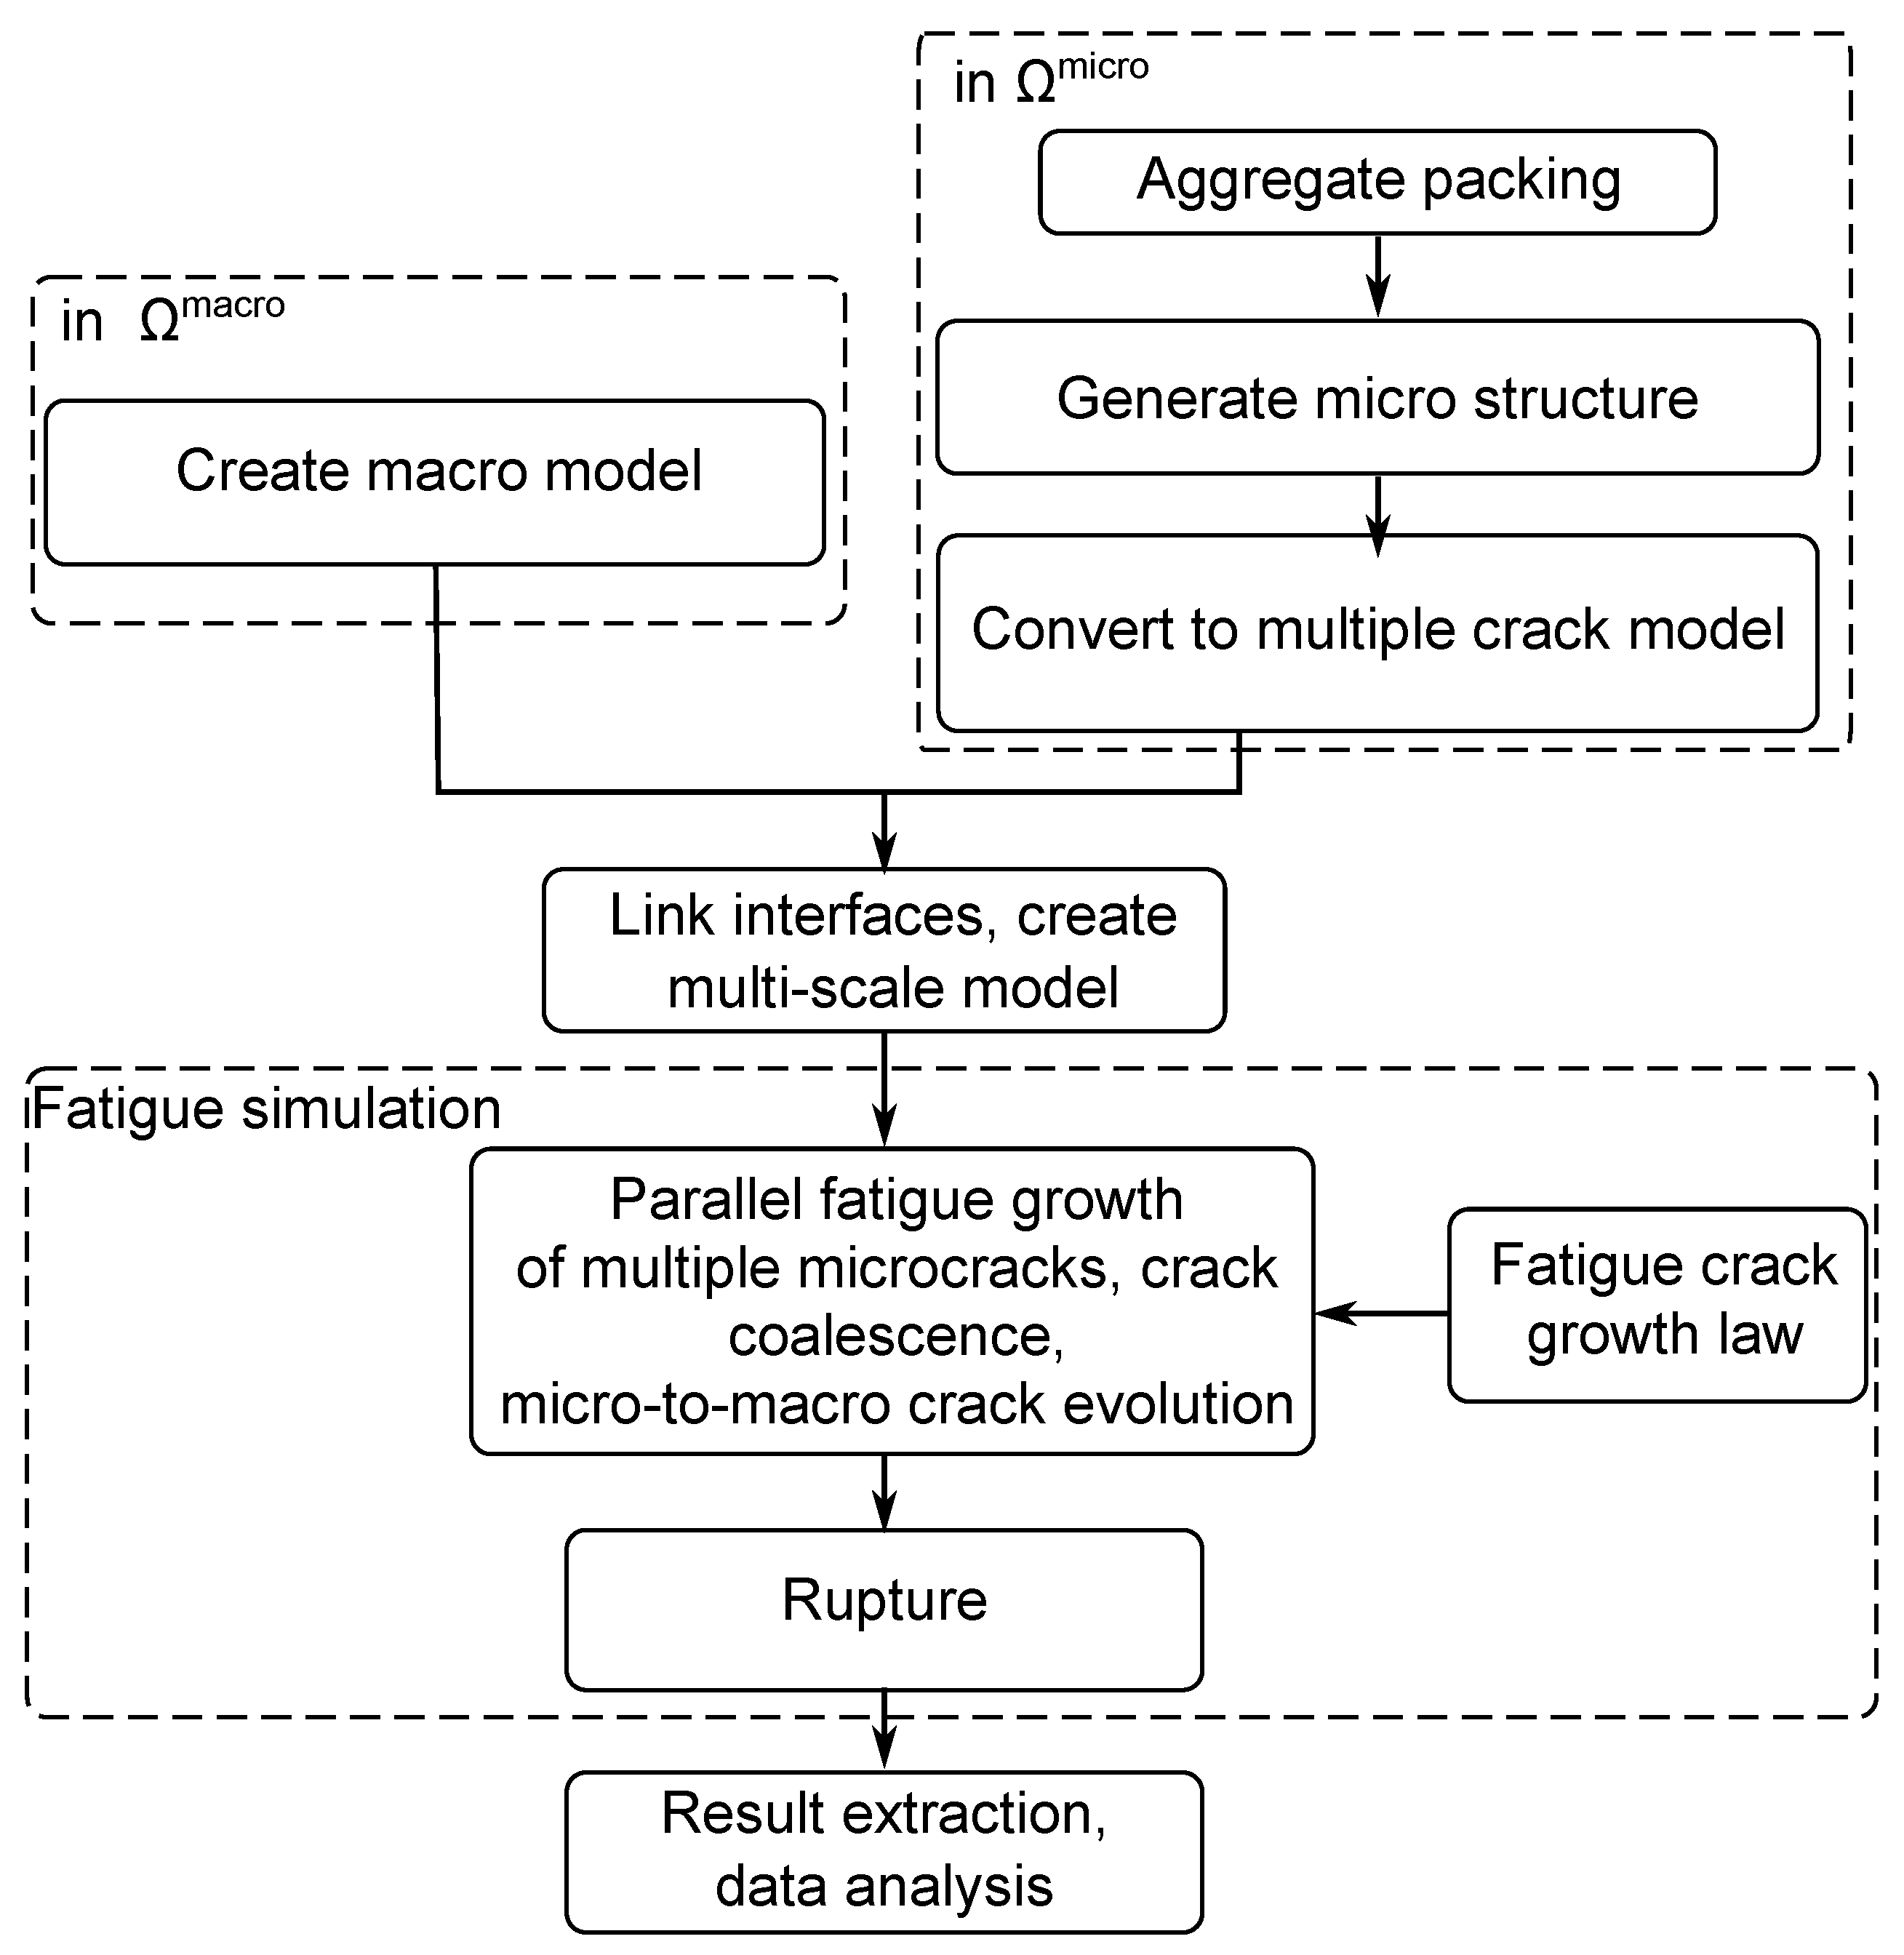
Figure 6.
Model of a three-point bending concrete beam.
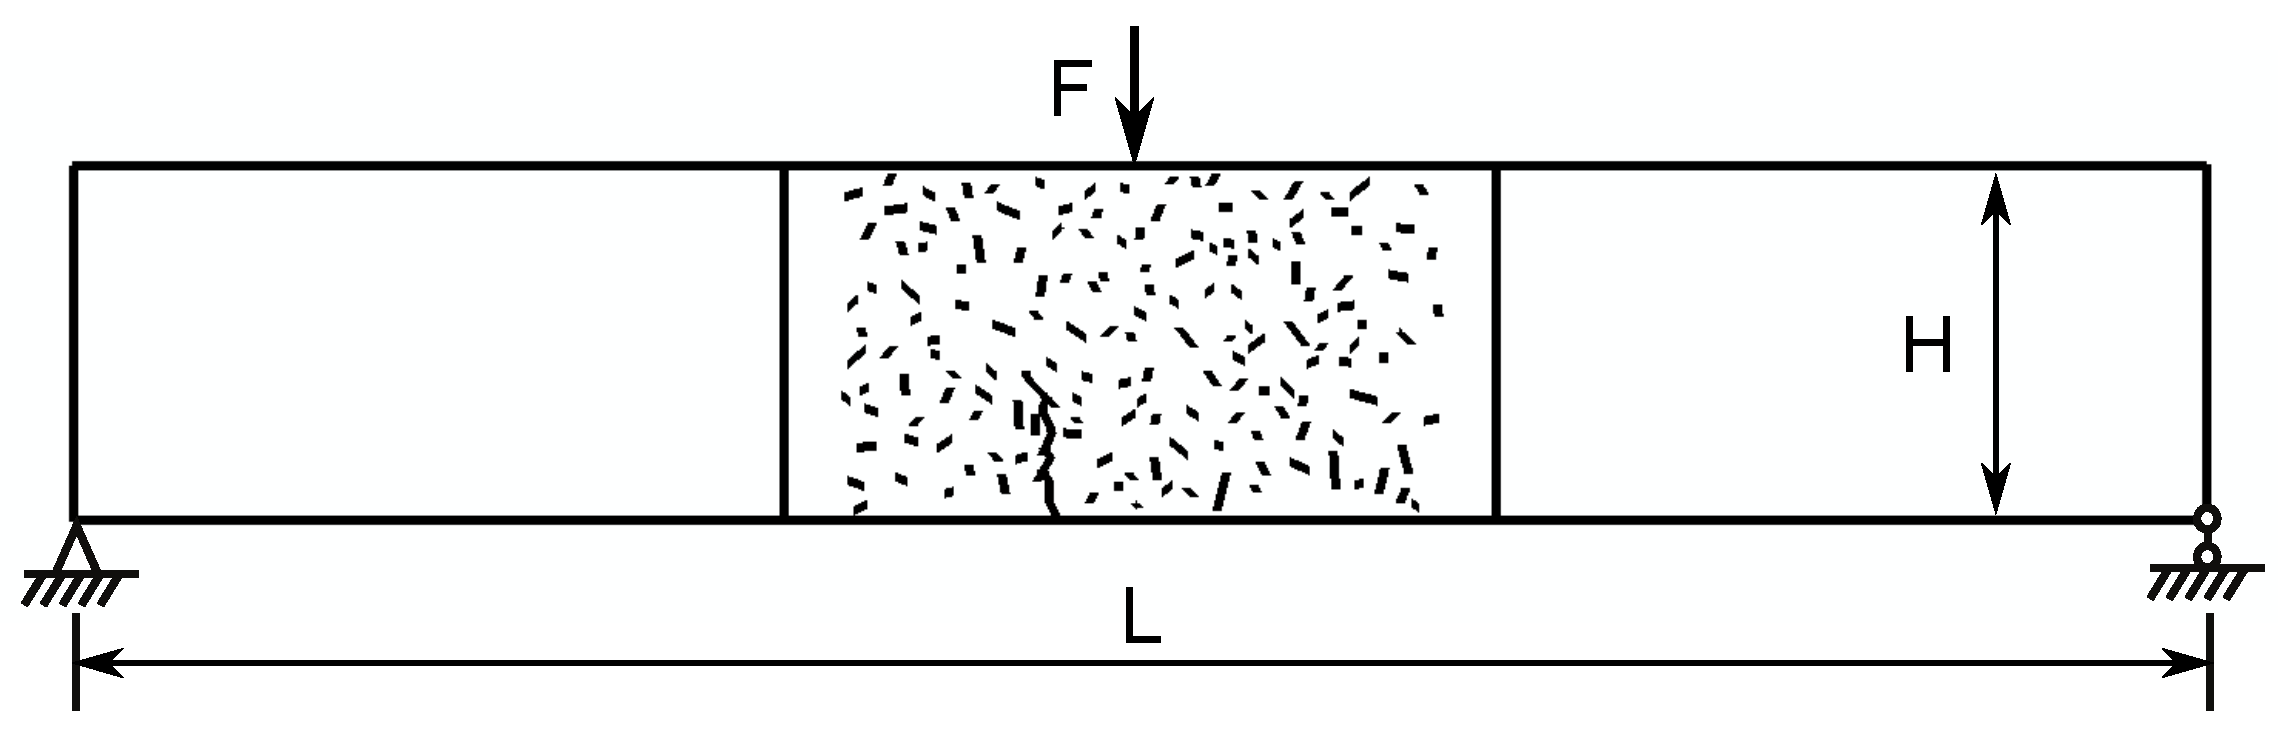
Figure 7.
Multi-scale model of concrete beams. (a) Concrete model; (b) interface of macro-scale area and micro-scale area; (c) microcracks at micro-scale area; (d) singular elements.
Figure 7.
Multi-scale model of concrete beams. (a) Concrete model; (b) interface of macro-scale area and micro-scale area; (c) microcracks at micro-scale area; (d) singular elements.

Figure 8.
Stress contour of micro-scale area of concrete beam.

Figure 9.
Evolution of crack diagrams.

Figure 10.
Stress level and failure pattern.
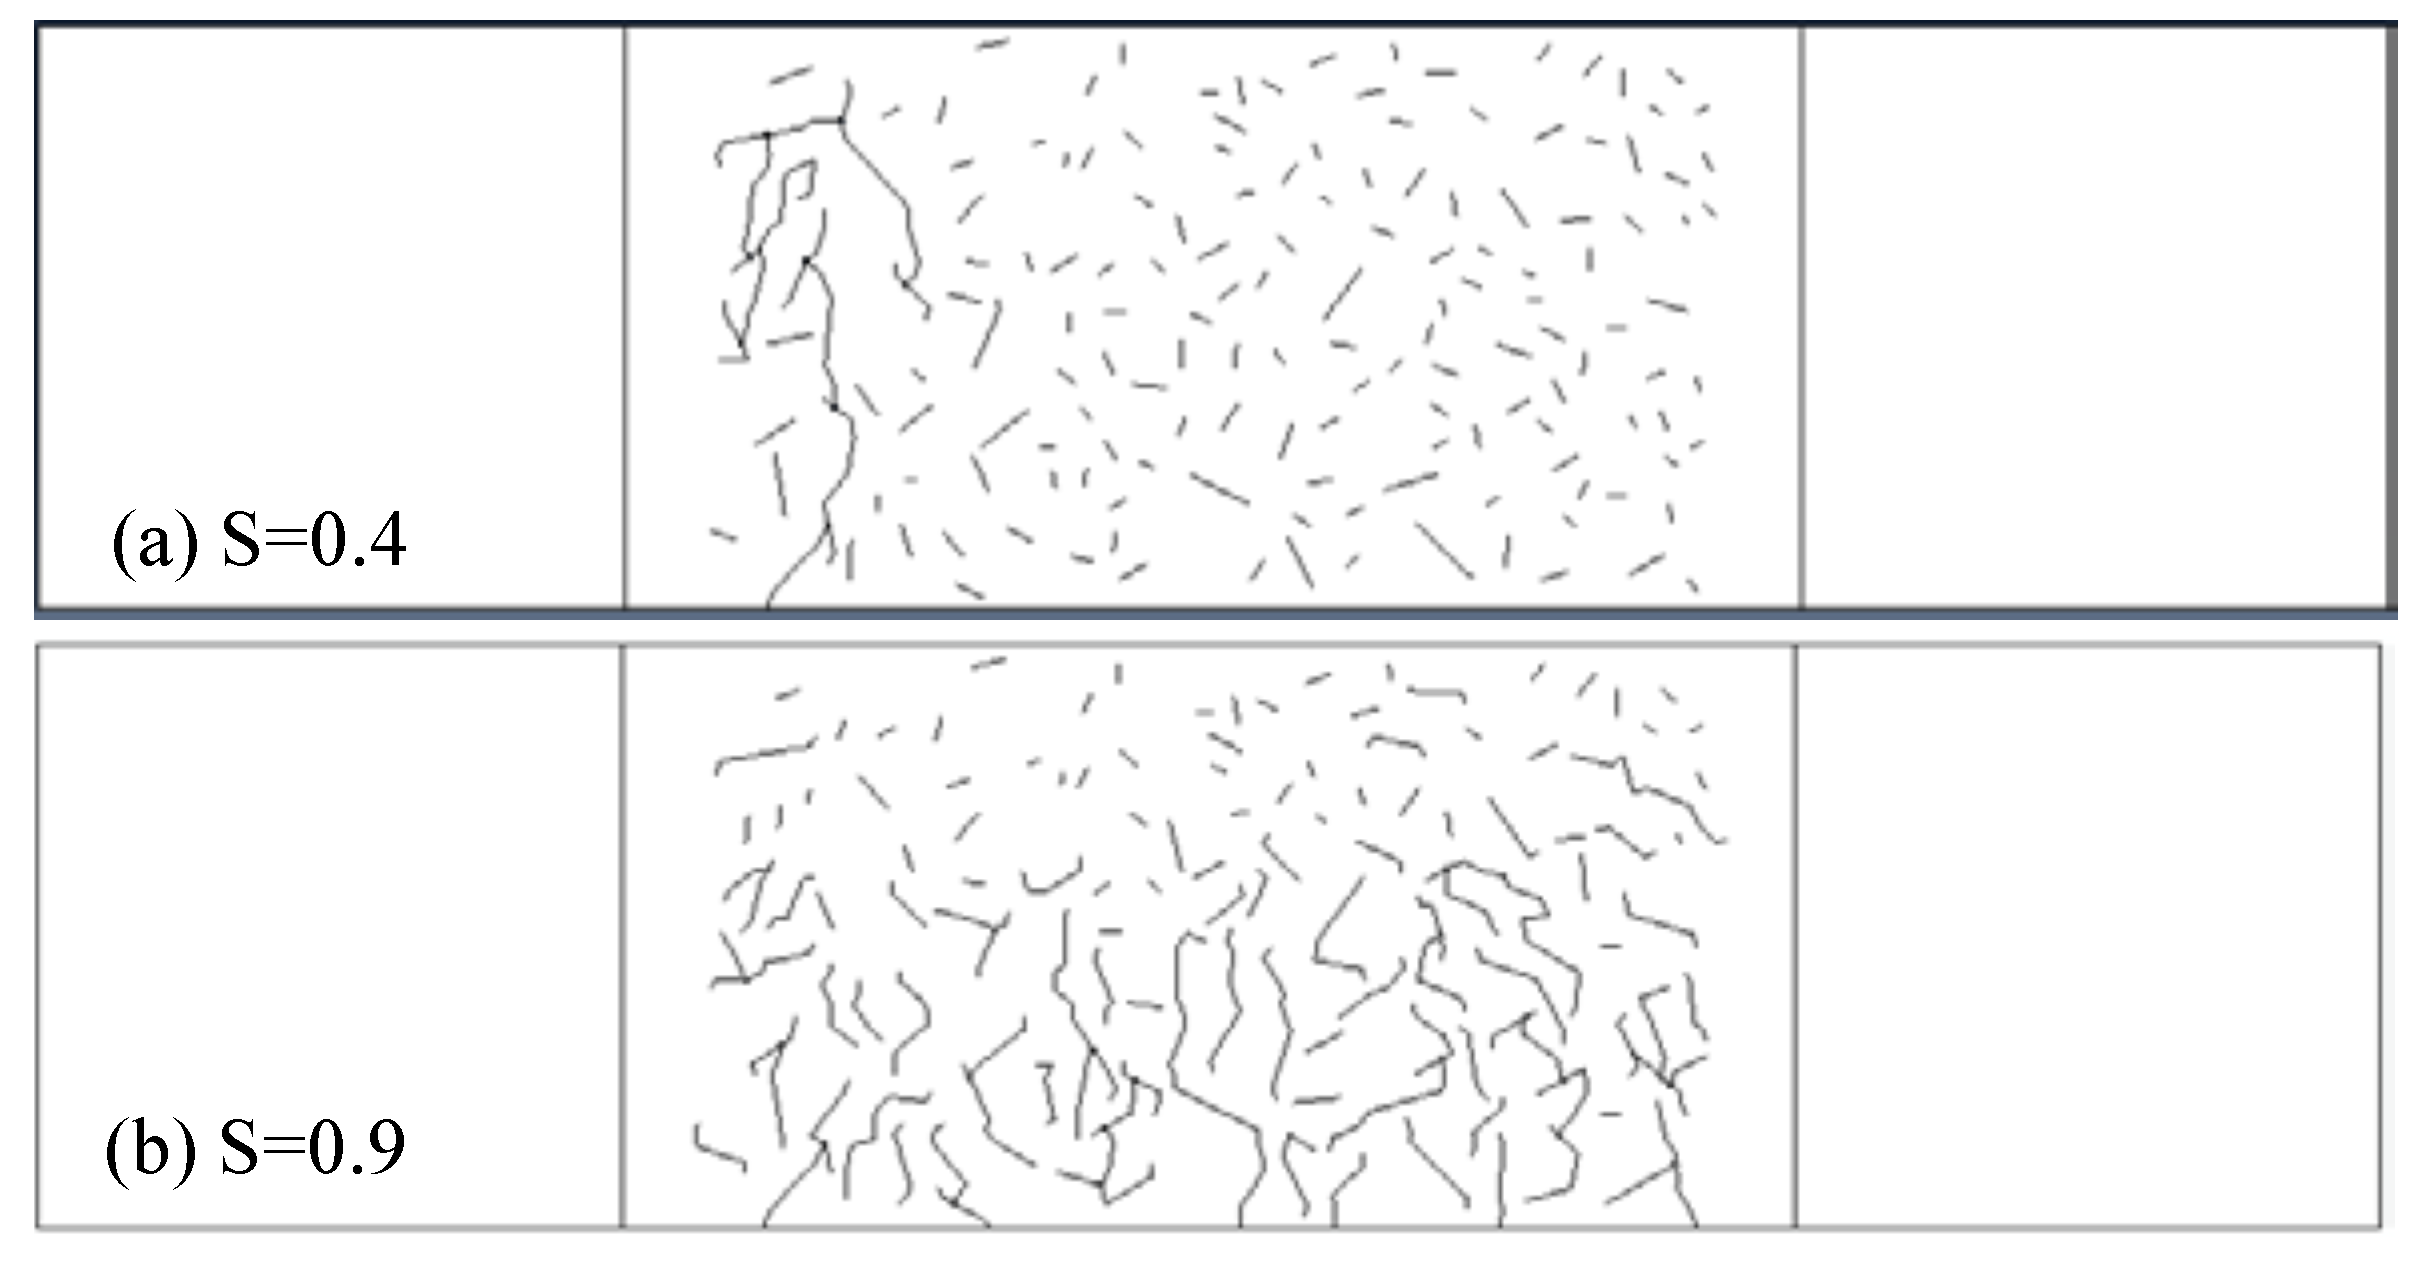
Figure 11.
S-N curve obtained by numerical modeling.

Figure 12.
Curves of fatigue damage evolution of concrete beams.


Table 1.
Stress level of load and corresponding fatigue life.
| No. | S | (N) | () |
|---|---|---|---|
| 1 | 0.9 | 90 | 3 |
| 2 | 0.8 | 80 | 5 |
| 3 | 0.7 | 70 | 10 |
| 4 | 0.6 | 60 | 25 |
| 5 | 0.5 | 50 | 36 |
| 6 | 0.4 | 40 | 42 |
| 7 | 0.3 | 30 | 66 |
| 8 | 0.2 | 20 | 122 |
| 9 | 0.1 | 10 | 201 |
© 2019 by the authors. Licensee MDPI, Basel, Switzerland. This article is an open access article distributed under the terms and conditions of the Creative Commons Attribution (CC BY) license (http://creativecommons.org/licenses/by/4.0/).
Share and Cite
MDPI and ACS Style
Wu, B.; Li, Z.; Tang, K.; Wang, K. Microscopic Multiple Fatigue Crack Simulation and Macroscopic Damage Evolution of Concrete Beam. Appl. Sci. 2019, 9, 4664. https://doi.org/10.3390/app9214664
AMA Style
Wu B, Li Z, Tang K, Wang K. Microscopic Multiple Fatigue Crack Simulation and Macroscopic Damage Evolution of Concrete Beam. Applied Sciences. 2019; 9(21):4664. https://doi.org/10.3390/app9214664
Chicago/Turabian StyleWu, Baijian, Zhaoxia Li, Keke Tang, and Kang Wang. 2019. "Microscopic Multiple Fatigue Crack Simulation and Macroscopic Damage Evolution of Concrete Beam" Applied Sciences 9, no. 21: 4664. https://doi.org/10.3390/app9214664
Note that from the first issue of 2016, this journal uses article numbers instead of page numbers. See further details here.