Article

Predicting Rice Pest Population Occurrence with Satellite-Derived Crop Phenology, Ground Meteorological Observation, and Machine Learning: A Case Study for the Central Plain of Thailand

1
Remote Sensing and Geographic Information System FoS, School of Engineering and Technology, Asian Institute of Technology, P.O. Box 4, Khlong Luang, Pathum Thani 12120, Thailand
2
Geo-Informatics and Space Technology Development Agency (Public Organisation) 120, The Government Complex (Building B), Chaeng Wattana Road, Laksi, Bangkok 10210, Thailand
3
Graduate School of Sciences and Technology for Innovation, Yamaguchi University, 2-16-1 Tokiwadai, Ube, Yamaguchi 755-8611, Japan
4
Agricultural and Food Engineering Department, Indian Institute of Technology Kharagpur, Kharagpur 721302, India
*
Author to whom correspondence should be addressed.
Appl. Sci. 2019, 9(22), 4846; https://doi.org/10.3390/app9224846
Submission received: 8 October 2019 / Revised: 9 November 2019 / Accepted: 11 November 2019 / Published: 12 November 2019
(This article belongs to the Special Issue Remote Sensing and Geoscience Information Systems in Applied Sciences)

Abstract

:

Featured Application

Integration of ground-based weather variables, satellite-derived host-plant phenology and ANN modelling were applied for rice pest warning and prediction to support an integrated pest management (IPM) programme in the central plain of Thailand.

Abstract

The brown planthopper Nilaparvata lugens (BPH) is one of the most harmful insect pests in rice paddy fields, which causes considerable yield loss and consequent economic problems, particularly in the central plain of Thailand. Accurate and timely forecasting of pest population incidence would support farmers in planning effective mitigation. In this study, artificial neural network (ANN), random forest (RF) and classic linear multiple regression (MLR) analyses were applied and compared to forecast the BPH population using weather and host-plant phenology factors during the crop dry season from 2006 to 2016 in the central plain of Thailand. Data from satellite earth observation was used to monitor crop phenology factors affecting BPH population density. An ANN model with integrated ground-based meteorological variables and satellite-derived host plant variables was more accurate for short-term forecasting of the peak abundance of BPH when compared with RF and MLR, according to a reasonably validating dataset (RMSE of natural log-transformed (ln) BPH light trap catches = 1.686, 1.737, and 2.015, respectively). This finding indicates that the utilization of ground meteorological observations, satellite-derived NDVI time series, and ANN have the potential to predict BPH population density in support of integrated pest management programs. We expect the results from this study can be applied in conjunction with the satellite-based rice monitoring system developed by the Geo-Informatic and Space Technology Development Agency of Thailand (GISTDA) to support an effective pest early warning system.

1. Introduction

Nilaparvata lugens (brown planthopper; hereafter BPH) is one of the most damaging rice insect pests in the temperate and tropical regions of East and Southeast Asia [1]. It causes serious crop loss directly by sucking the sap of plants, causing the plants to wilt (known as hopper burn), as well as indirectly by transmitting viral diseases [2]. The life cycle of the BPH lasts around 30 to 40 days, consisting of an egg stage, five nymphal instar stages, and an adult stage. In the tropics, the egg stage lasts 7 to 11 days. The nymphal stage takes about 10 to 18 days from the hatching of the first-instar nymph to the adult stage, and adult planthoppers live for 18 to 20 days [3]. Both BPH nymphs and adults can damage rice plants [4]. For short duration rice varieties, BPH can feed on rice plants throughout the cropping season and reproduce continuously for three to four generations. From 2010 to 2013, BPH infestation in Thailand was estimated to have affected at least 800,000 hectares of rice and caused a 60% loss in production costing $800 million per year, especially in the central plain and lower northern regions [5]. This damage was partly a result of the rapid increase in insect populations, with farmers being unable to forecast outbreaks. Continual monitoring and accurate forecasting of pest population during the crop growing period could be useful in protecting rice crops against BPH.
Both abiotic and biotic factors are believed to be responsible for changes in BPH populations [6]. The influence of abiotic factors such as weather variables has been well documented. Yadav, Chander, and Selvaraj [7] found that temperature and evening relative humidity were key factors influencing BPH light trap catches. In addition, Win et al. [6] found that temperature, rainfall, and relative humidity influenced populations of both BPH and white-backed planthoppers during the rainy and summer seasons. Prasannakumar and Chander [8] similarly observed that weekly maximum temperature, rainfall, and evening humidity were significant factors that affected BPH light trap catches in the rainy season. Thus, climatic factors can be expected to be indicators of BPH attacks [9].
Biotic factors such as host plant phenology can also affect BPH populations [10]. Alam [11] found that crop age has a highly significant effect on populations. In addition, BPH tends to be more numerous after 60 days’ post-transplantation when crops are close to maturity, as well as between the heading and harvesting stages during dry seasons [12,13]. Otuka et al. [14] found that BPH is a monophagous insect whose occurrence depends on host rice plants. Therefore, the temporal and spatial patterns of rice cultivation in the region should affect BPH incidence.
Satellite images present an alternative approach for investigating the spatiotemporal pattern of rice phenology by providing information on phenological stages on a large scale. Vegetation indices derived from satellite images are used as an essential parameter for crop growth information detection, especially the normalized difference vegetation index (NDVI). A time series of NDVI data has been popularly used in continuous monitoring of land cover characteristics and vegetation phenology [15,16,17,18,19,20,21]. Among optical satellite data, the moderate resolution imaging spectroradiometer (MODIS) is advantageous in that it provides broad coverage, high spectral and temporal resolution, and free access to data. Therefore, many researchers in remote sensing have applied MODIS NDVI-time series data to study the growth stages of rice [22,23,24,25]. To date, however, remote sensing data have not been used to model BPH fluctuations in Thailand.
Statistical modelling for early prediction of pest risks is one strategy that has been widely adopted. The multiple linear regression model (MLR) is a statistical method used to investigate the relationship between one response variable (the dependent variable) with two or more variables (independent variables). Some studies have used this approach to predict BPH population abundance in both field and light trap catches [6,7,9,26,27,28,29,30]. Yadav, Chander, and Selvaraj [7] applied MLR and Geographic Information Systems with light trap and weather data to develop BPH outbreak potential zones at Maruteru in India. They used MLR pest–weather models to determine the risk of BPH outbreaks. Jayanthi [31] used the occurrence of small immature guajava (Psidium Guajava) fruits as a single and accurate indicator of host plant phenology variables and found that it was a more reliable indicator of changes in fruit fly (Bactrocera dorsalis) populations than variables. However, due to the nature of the linear relationships in the parameters, linear regression models may not provide accurate predictions in some complex situations such as with non-linear and extreme values data [32].
The artificial neural network (ANN) model is a tool that can model complex and non-linear relationships without any prior assumptions about the relations between independent and dependent variables. ANN is a type of machine learning model and is relatively competitive in terms of usefulness with conventional regression and statistical models. ANN has been successfully applied in various disciplines, such as agriculture, medical science, education, finance, management, security, engineering, trading commodity, and art [33,34,35,36,37,38,39,40,41,42]. For pest forecasting, ANN has been applied to model the pest population dynamics for the pod borer Helicoverpa armigera (Lepidoptera: Noctuidae) [43], the fruit fly Bactrocera dorsalis (Diptera: Tephritidae) [44], rice pests [45] and the paddy stem borer (Scirpophaga incertulas) [46]. In most of these studies, the authors referred to the limitation of linear multiple regression (MLR) and concluded that the ANN technique is more precise than MLR and is a good choice for predicting pest occurrence. However, ANN is unfamiliar to most entomology researchers so its use is not widespread in entomological research [46].
Random forest (RF) is an ensemble algorithm proposed by Breiman [47]. The algorithm combines bagging a sampling approach and the random selection of features to construct a collection of decision trees with controlled variation [48]. RF are fast and easy to implement, yields highly accurate predictions and can handle a very large number of input variables without overfitting [49]. This method has been implemented in many different fields in recent years [50] including crop pest and disease prediction. Ayub [51] applied several data mining techniques such as random forest, support vector machine, neural network, k-nearest neighbors, decision tree, and Gaussian naïve bayes to predict grass grub damage and indicated that neural network and random forest performed slightly better than other classifiers. Balaban et al. [52] used RF to predict the nymphal stage percentages of the sunn pest in the Middle Eastern region and showed that their models have accuracy over 99% and also offer credible confidence intervals. However, the benefits of RF in predicting the crop pest population are still limited.
This study focused on the use of ground-based weather parameters, time series of satellite-derived vegetation indices, and machine learning approaches. We aimed to: (1) investigate the association between lagged ground meteorological parameters and satellite-based rice phenology in relation to the temporal patterns of BPH population incidences; (2) compare models with only weather variables and models with a combination of weather and host-plant variables; (3) develop a predictive model for the population occurrence of BPH based on ANN and RF; and (4) evaluate the performance of the ANN and RF models using a traditional MLR model.
We expected this method to result in an improved approach to BPH management for the following reasons:
  • In contrast to previous studies that have only used weather factors from ground stations for pest population forecasting, this study proposed an approach that also uses host-plant phenology data extracted from satellite-based NDVI time series in order to improve the accuracy of forecasting models.
  • By using a combination of weather and host-plant phenology data integrated with an ANN algorithm, a more accurate and precise forecasting can be provided (in comparison to the traditionally used linear regression models). These findings could be applied to support an integrated pest management (IPM) programme to help farmers reduce pesticide use and minimize crop loss in rice paddy fields, such as in the central plain of Thailand.

2. Materials and Methods
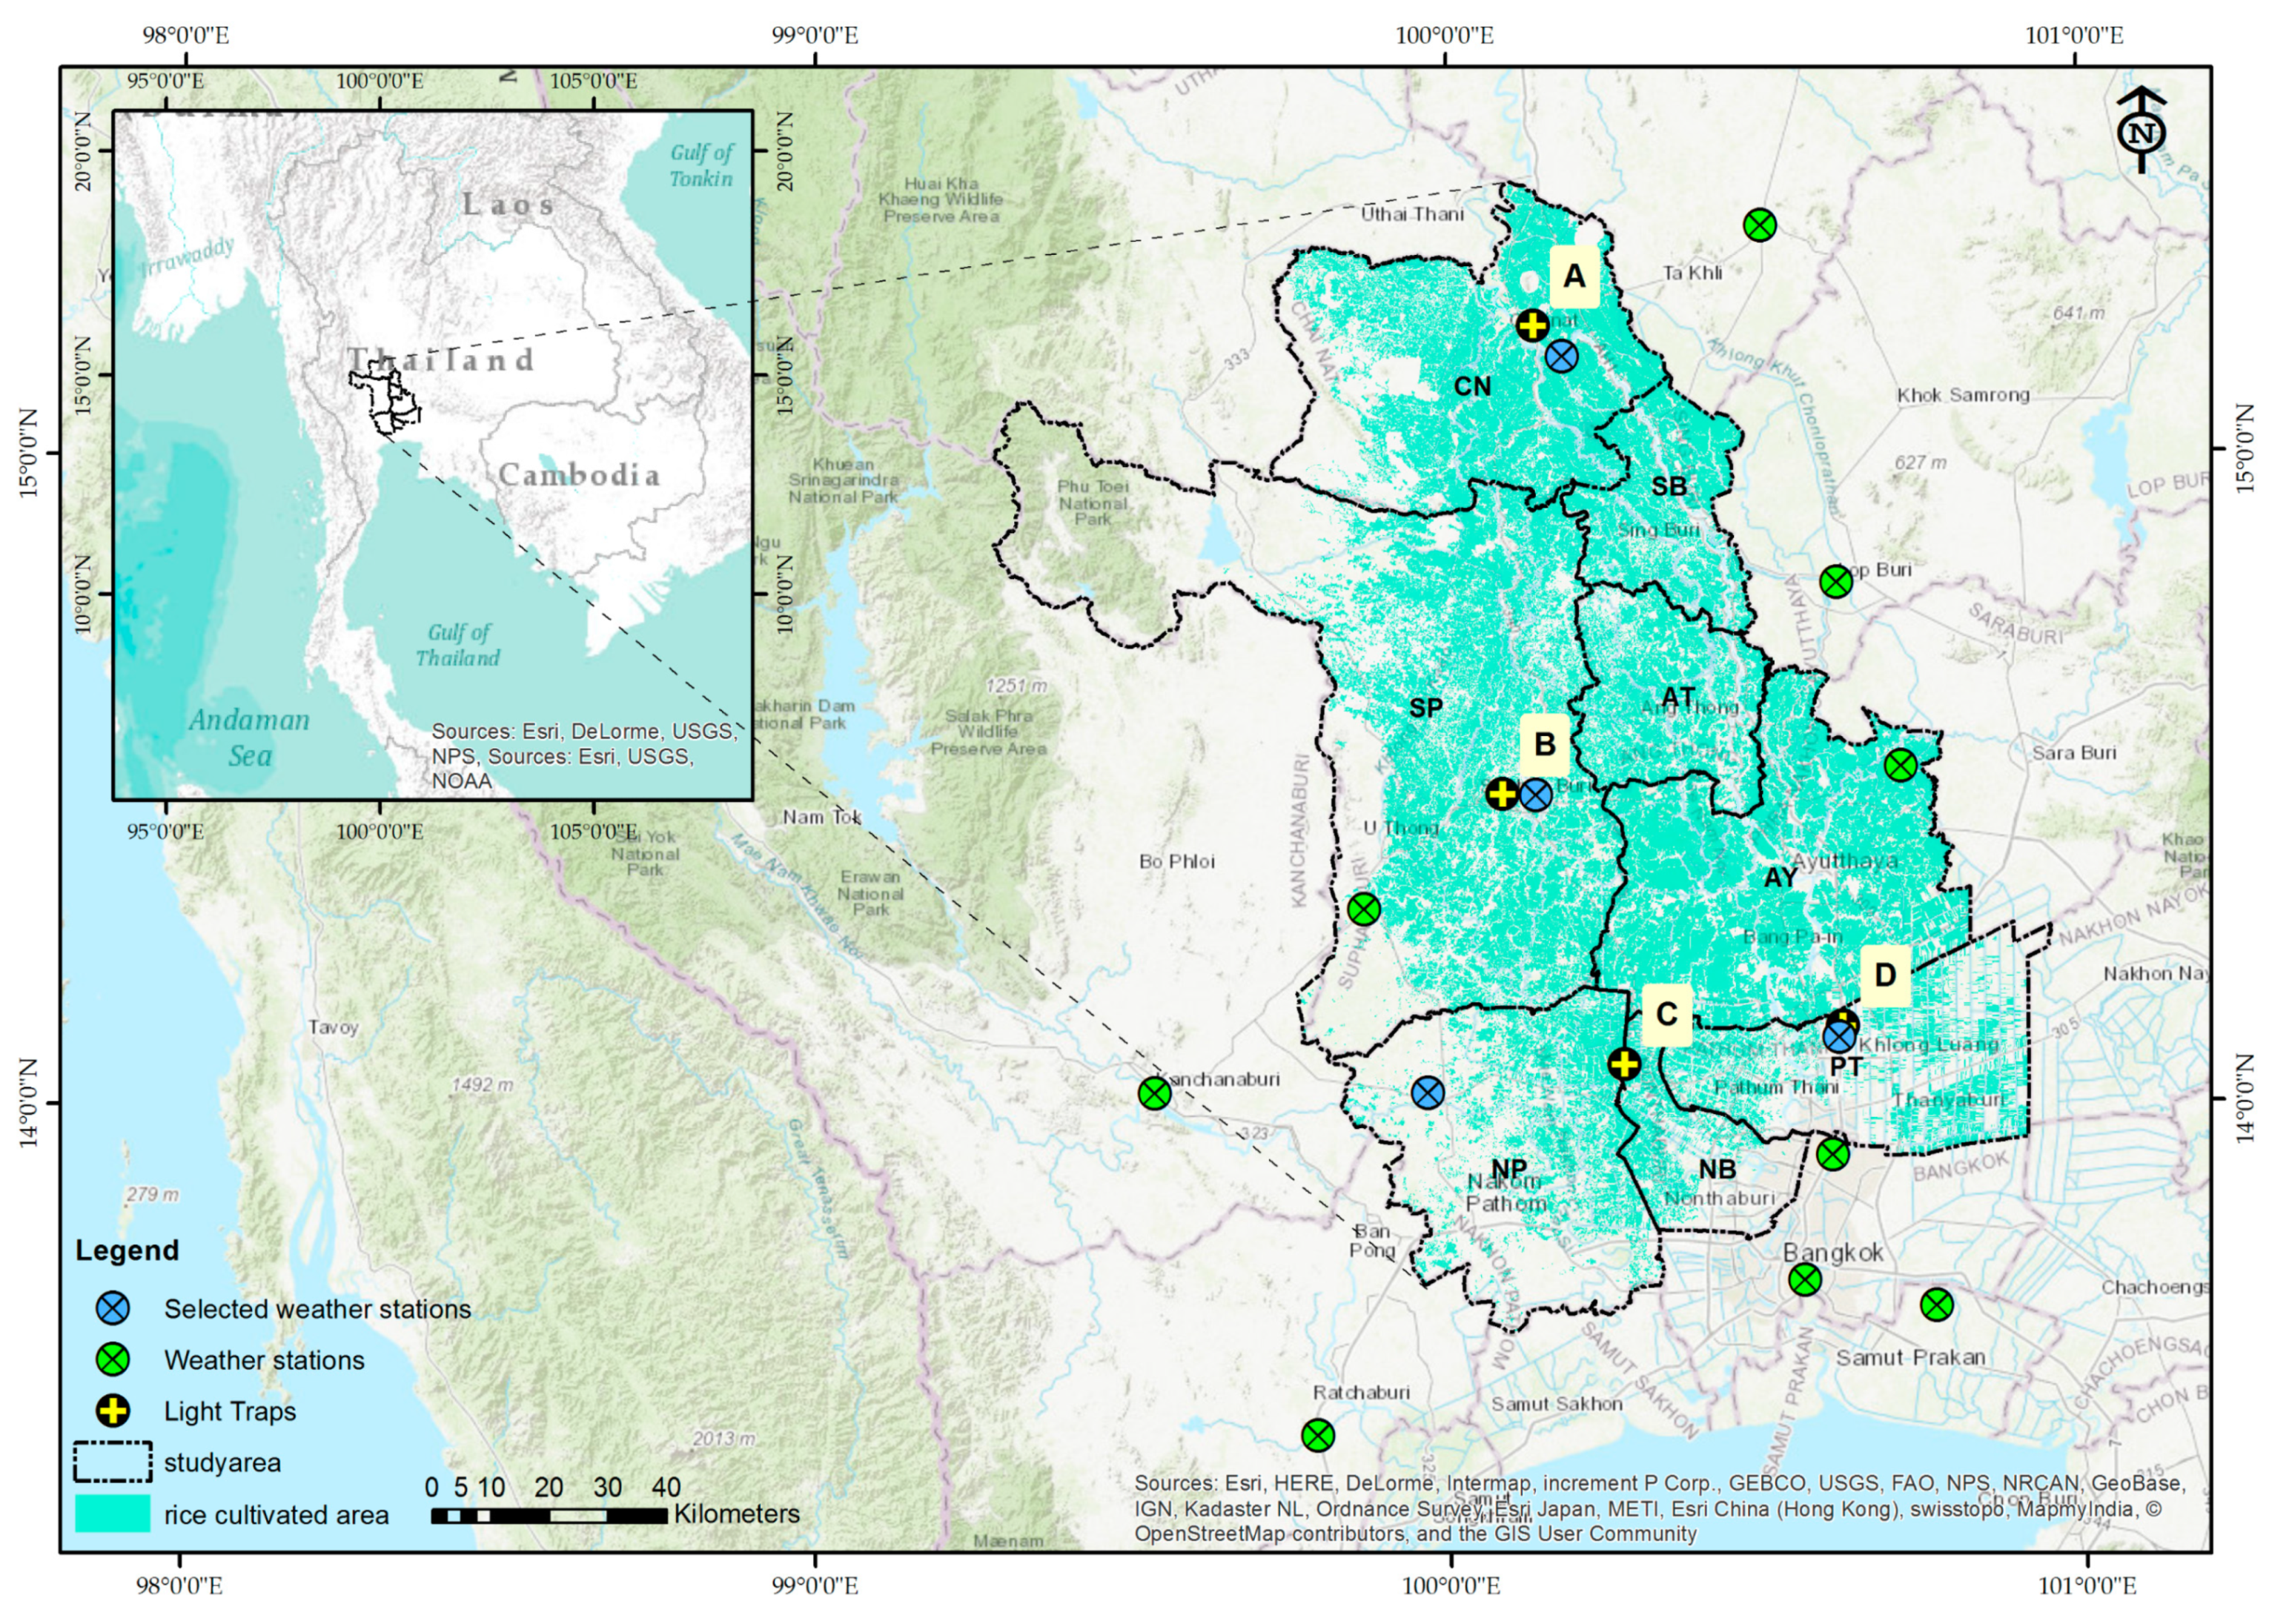
2.1. Study Sites

Four study sites were equipped with light trap stations installed near the rice paddy fields. The site were located at (A) Chai Nat Rice Research Centre in the Mueang district of Chai Nat province (15.197° N, 100.137° E), (B) Suphan Buri Rice Research Centre in the Mueang district of Suphan Buri province (14.476° N, 100.086° E), (C) a private paddy field in the Sai Noi district of Nonthaburi province (14.060° N, 100.277° E) and (D) Khlong Luang Rice Research Centre in the Khlong Luang district of Pathum Thani province (14.118° N, 100.622° E) (Figure 1). Weather stations were located 0.2, 5.5, 33.8, and 1.5 km from sites A, B, C, and D, respectively.
All sites were situated within the central plain of Thailand, which is characterized by flat topography, alluvium soil, and a tropical climate. Most agriculture in this area is rice plantation. Two main rice crop seasons pertain to the dry season and the wet season, where the dry season crop is generally planted in November–December and harvested in March–April and the rainy season crop is planted in May–June and harvested in September–October. Water for cultivation is mainly supplied by well-irrigation systems, so that double or continuous rice cropping with staggered planting times is sometimes practiced. The rice varieties most planted in the area are non-photoperiod sensitive and takes around 100 to 140 days to mature, including such types as “Pathum Thani-1”, “Chai Nat-1”, and “Suphan Buri-1”. Due to the suitable environment and continuous rice planting throughout the year, BPH outbreaks occur frequently in this area.

2.2. Data Collection
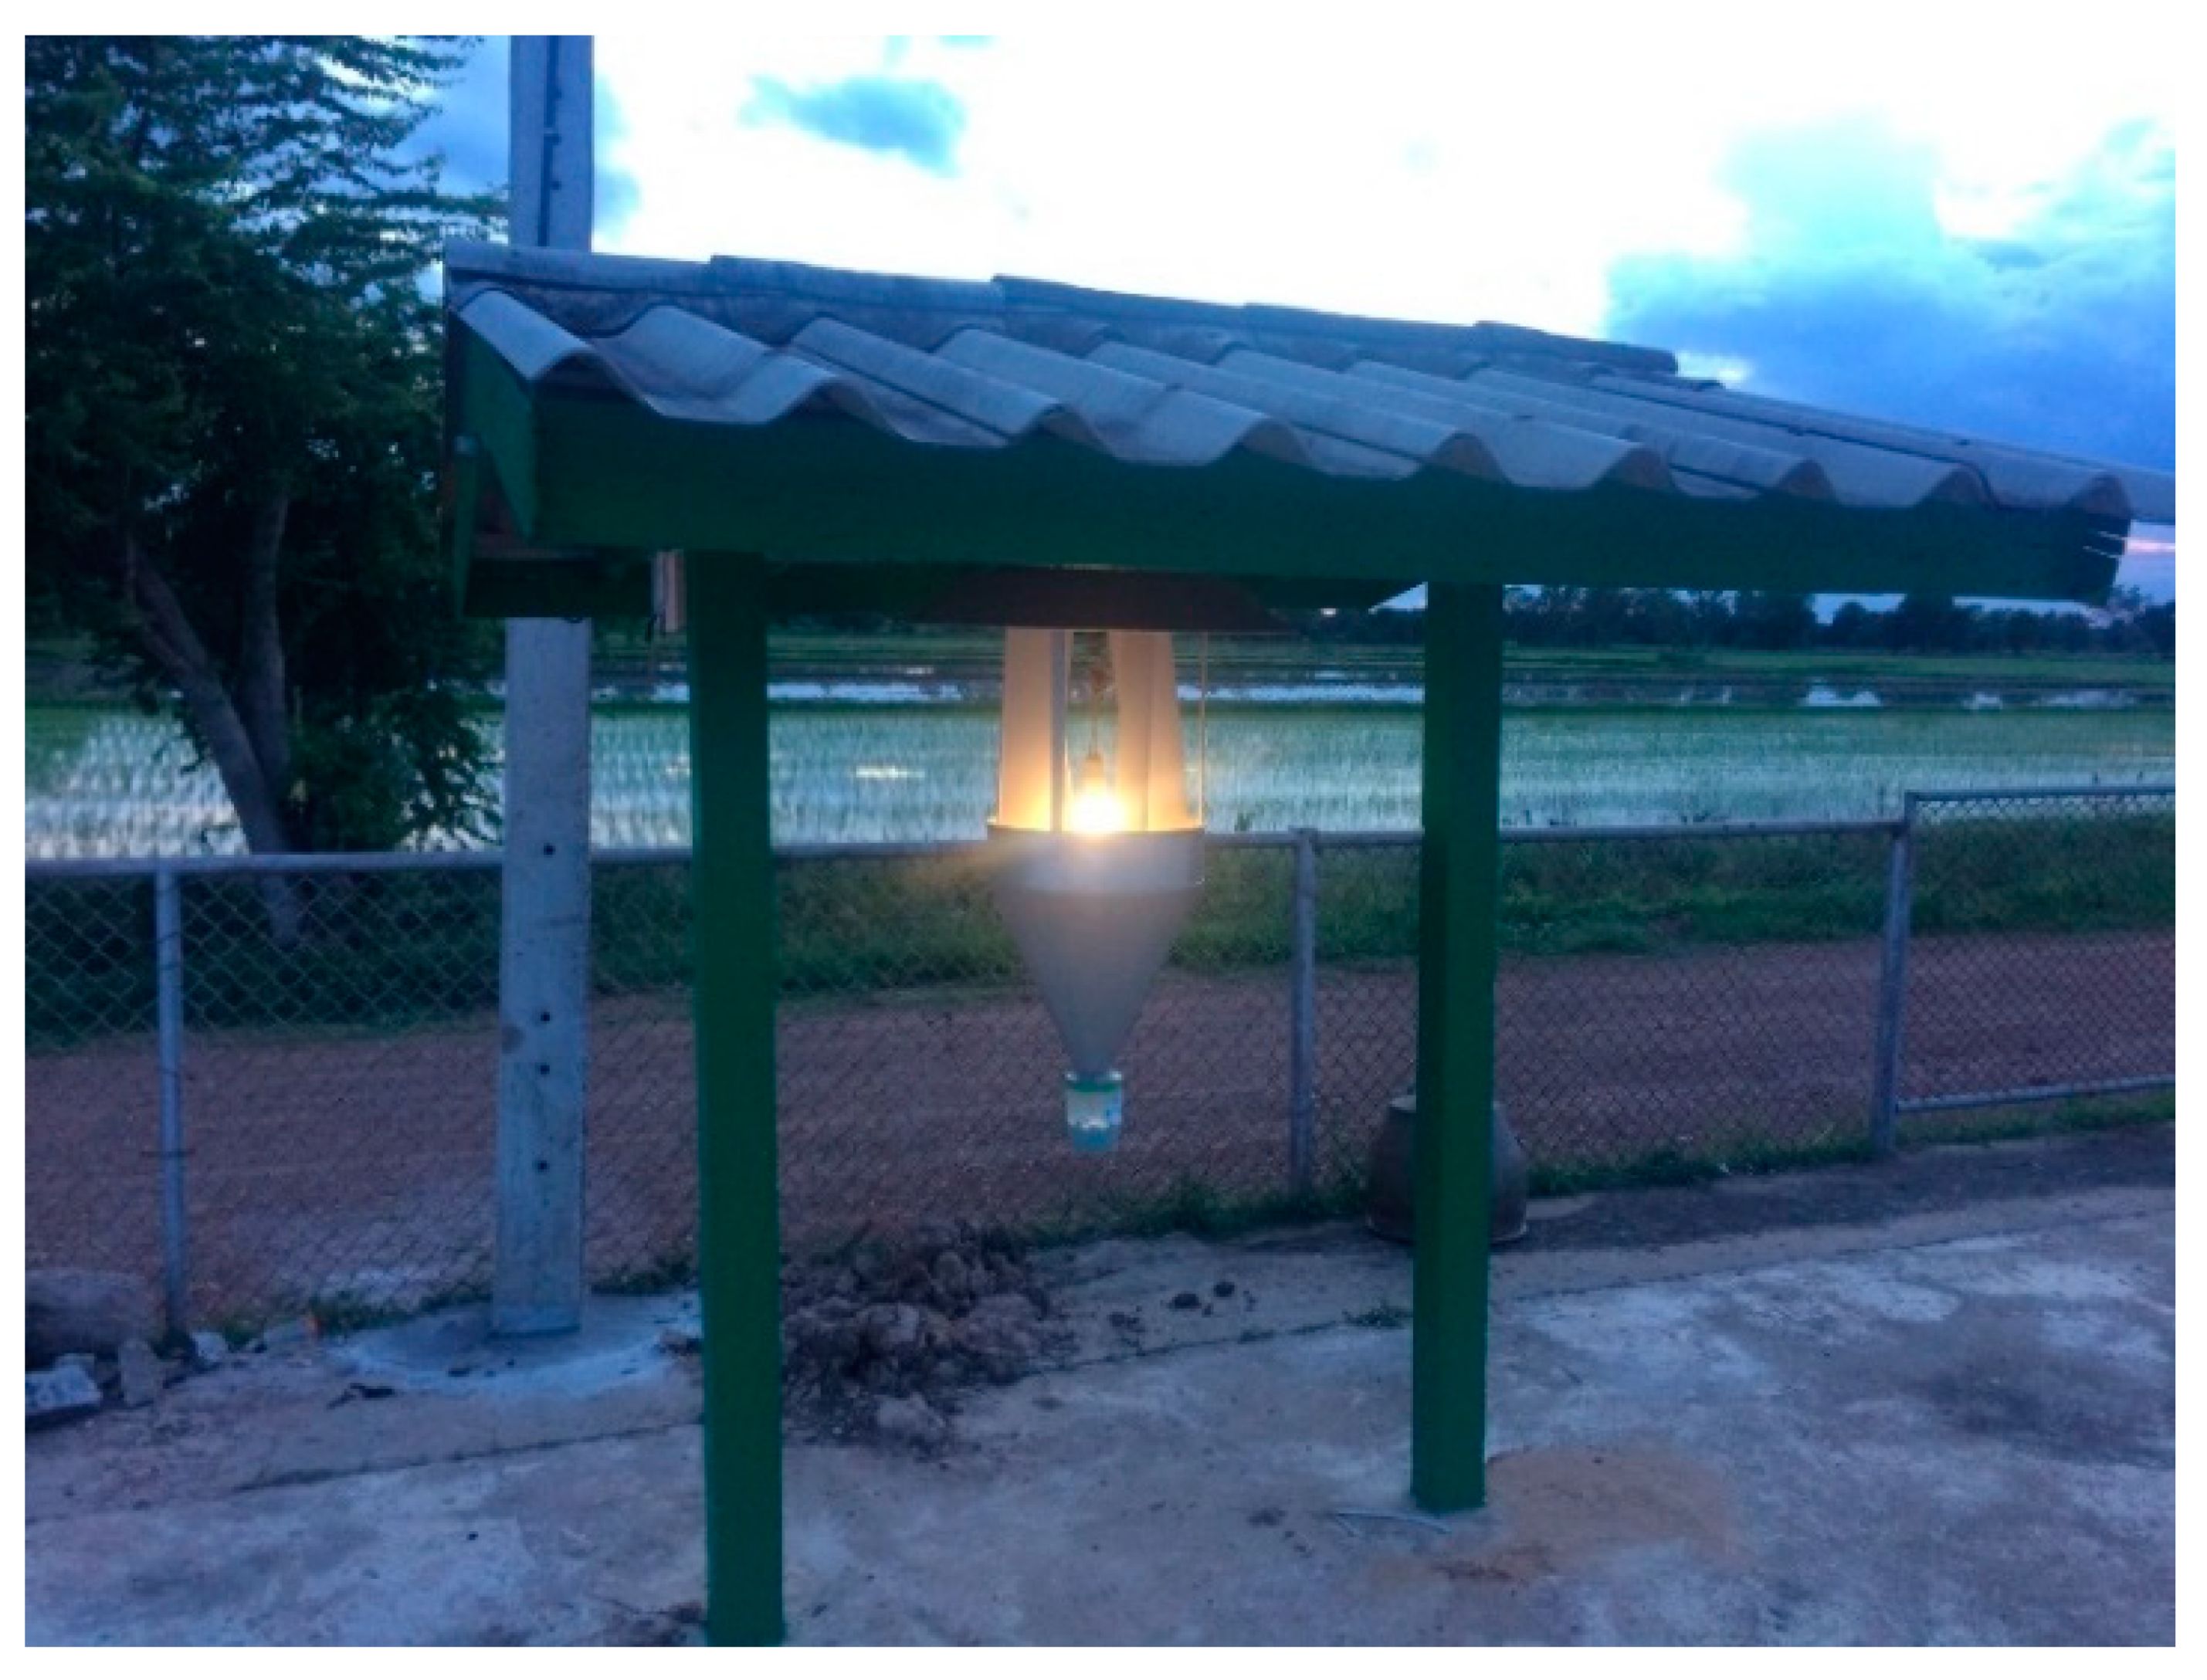
2.2.1. Pest Data

Long-winged adult BPH were collected by a light trap set from 18:00 to 21:00 hours at Sites A (2006–2016), B (2011–2013), C (2010–2012), and D (2010–2012) (Figure 2). Insects in the trap were removed every morning and placed in paper bags, then identified and counted. The daily data were aggregated as monthly averages.

2.2.2. Meteorological Data

Daily meteorological data including minimum temperature (Tmin), maximum temperature (Tmax), mean relative humidity (RH) and rainfall were collected from a weather logger at Site A from 2006 to 2016 and three meteorological stations belonging to the Thai Meteorological Department from 2010 to 2013. All daily data were calculated as average monthly minimum and maximum temperature, average monthly relative humidity, and accumulated monthly rainfall.

2.2.3. Satellite Data
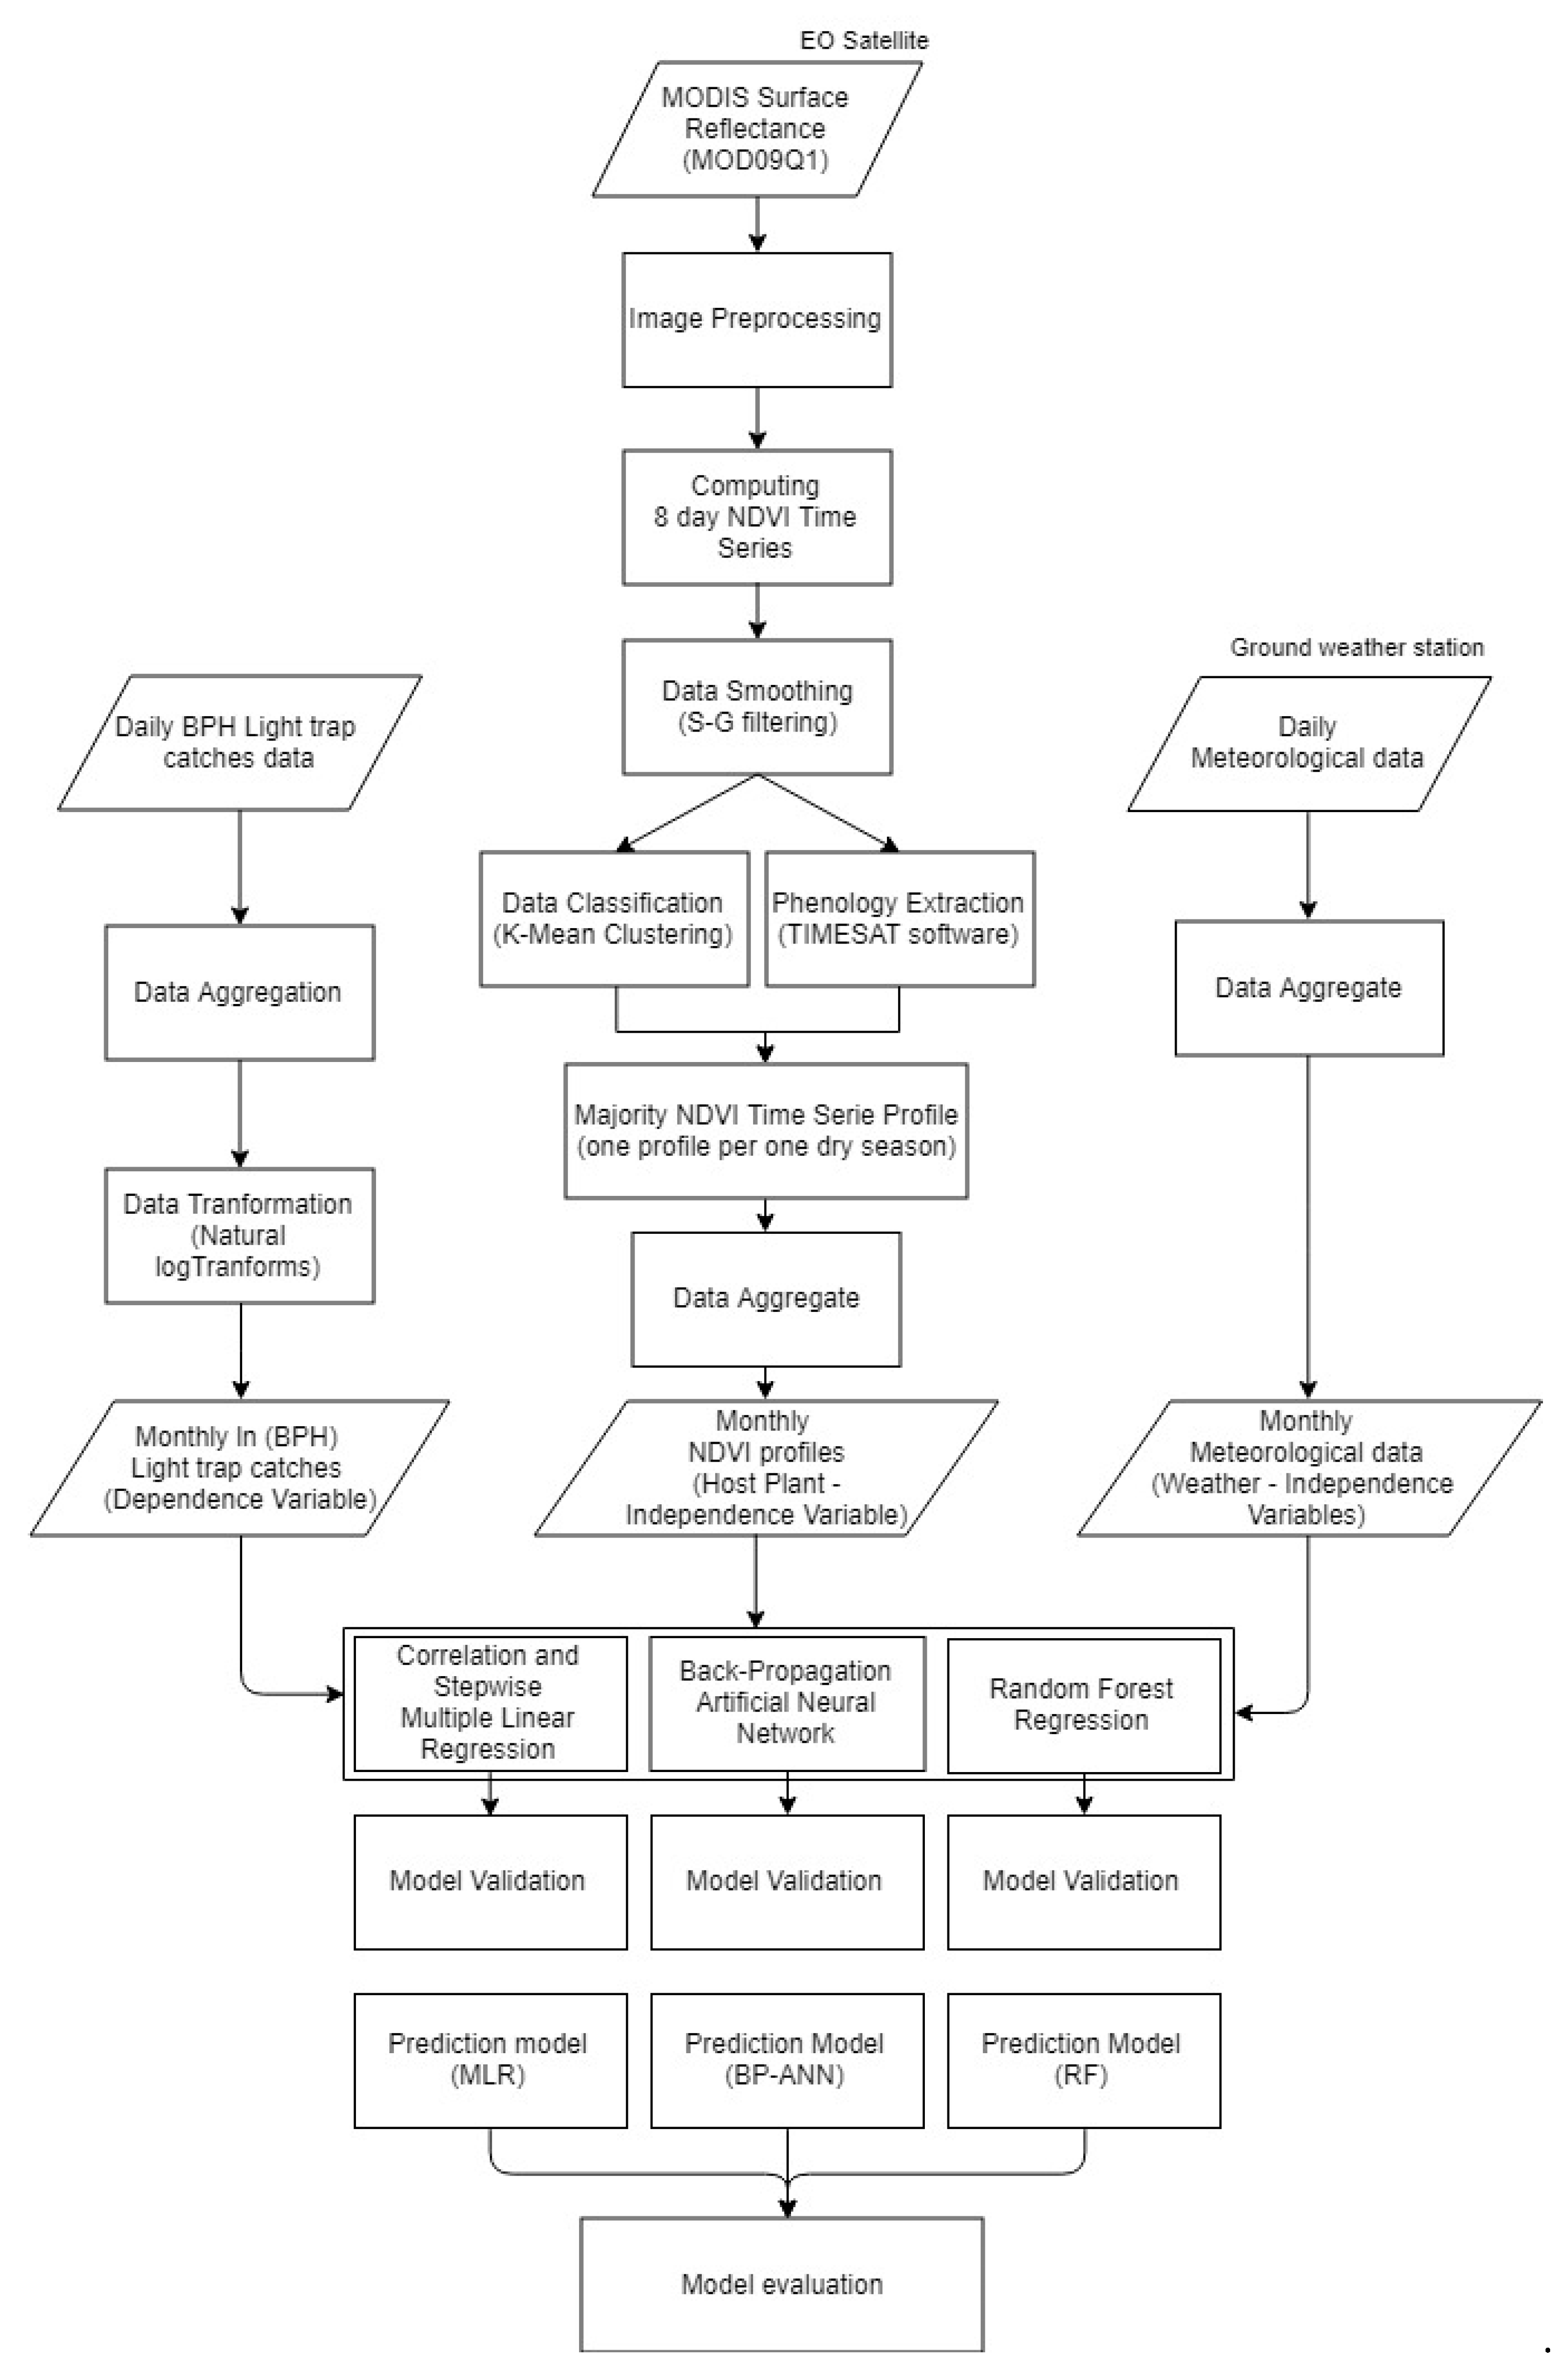
The MODIS Surface Reflectance (MOD09Q1) instrument was used in this study to detect the growth stages of rice crops through a time-series profile of vegetation indices. These data were derived from the TERRA MODIS satellite and downloaded from the Land Processes Distributed Active Archive Center (https://lpdaac.usgs.gov) on a REVERB interface with h27v07 tile between 2006 and 2016 in 10-year periods. These data provided an eight-day composite at a 250-metre spatial resolution as a gridded level-3 product in a sinusoidal projection.

2.3. Methods

2.3.1. BPH trap Catches and Weather Data Preprocessing

To predict BPH abundances, weather variables (including Tmin, Tmax, RH, and rainfall) and host-plant variables such as NDVI derived from satellite remote sensed data for the prediction months and one-month prior were used as input variables. In addition, the monthly BPH light trap catches were natural log-transformed prior to analysis in order to meet the assumptions of the regression [53,54,55,56], which were considered as an output variable in all models. The dataset for all variables during December–March from crop season 2006/2007 to 2014/2015 at the CHN site, crop season 2011/2012 at the SPB site, crop season 2010/2011 at the NTB site, and crop season 2010/2011 at the KKL site was used as a training dataset; the training dataset consisted of a total of 48 samples. The remaining observations from crop season 2015/2016, 2012/2013, 2011/2012, and 2011/2012 at the CHN, SPB, NTB, and KKL sites, respectively, were used as the testing dataset to verify the prediction models. The duration time of the data between December to March was chosen to develop the model because this period is usually used for planning pest monitoring and surveillance. All details are summarized in Table 1.

2.3.2. Processing of Satellite-Based NDVI-Time Series

MODIS HDF products were re-projected from the sinusoidal projection to geographical projection WGS84 and converted from an HDF to a GeoTIFF format using the MODIS Reprojection Tool. Both the eight-day red band and NIR band data were then calculated to eight-day NDVI data and stacked to the original 8-day NDVI time series. After preprocessing, TIMESAT software was used to remove noise and generate the smoothed eight-day NDVI time series using a Savitzky and Golay filter [57].
We obtained monthly NDVI values for each crop during the dry season, which are shown in Table 1 according to each study site, to use as input variables for the host-plant phenology factor for model development. The method was as follows:
(1)
The buffer was drawn with a radius of 10 km around the light trap. This distance is considered appropriate in terms of the migratory behavior of BPH [58].
(2)
Only the rice paddy fields that are within the buffer from the land use map were extracted.
(3)
Only the grids within the rice paddy fields from the smoothed eight-day NDVI-time series data obtained from MODIS were selected (Figure 3). The values in the grid are the NDVI profile of the rice at that grid location from 2006 to 2016.
(4)
Then, the NDVI profiles from each grid were classified into ten groups using the k-mean clustering classification method, so that they have a similar NDVI profile pattern within each group. This classification method can be used to identify and monitor the same information in the same group based on Euclidean distance analysis [59].
(5)
The start date of season data was extracted from the smoothed eight-day NDVI-time series data using TIMESAT software.
(6)
One of ten groups that has a sowing date similar to the start date of season was selected based on the start date of season data.
(7)
The selected NDVI profile group was analyzed using median statistics in order to obtain a single NDVI profile that could represent the rice paddy field area in the buffer zone.
(8)
Finally, the eight-day NDVI-time series data were used to compute monthly means.

2.3.3. Model Development

Multiple Linear Regression (MLR)

Population occurrences of BPH have quantified the relationship with climatic and host-plant phenology variables, including Tmin, Tmax, RH, rainfall, and NDVI at both the prediction months and one month prior, using Pearson correlation analyses with regard to the crop dry season from December to March. Significant correlation coefficient (R) values were taken as criteria to select suitable factor(s) for developing linear models with trap catches of BPH.
An MLR model with a stepwise selection method was developed, considering only weather variables and a combination of weather and host-plant phenology variables to achieve a maximum coefficient of determination (R2) for estimating the trap catch.
MLR is a statistical method in regression for analysis of relationships between a single dependent variable and two or more independent variables [60] in the form (Equation (1)):
y = β 0 + β 1 x 1 + β 2 x 2 + + β k x k   +   ε
where y is a response variable, x 1   to   x k     are explanatory variables, β 0 represents the intercept, β 1 to β k are the slopes of the relationship between y and x 1   to   x k , and ε is the residual or fitted error. Stepwise regression is an automatic method, useful when the number of explanatory variables is large and where it is not possible to fit all potential models [61]. The MLR model was generated by IBM SPSS Statistic 25.

Artificial Neural Networks (ANNs)

Artificial neural network (ANN) modelling is a non-linear statistical technique. It can be used to solve problems for which conventional statistical methods are not suitable [40]. The main neural network topology consists of an input layer, an output layer, and usually one or more hidden layers. Each layer contains nodes connected to nodes at the adjacent layer(s). Each connection link has an associated weight which, in a typical neural network, multiplies the signal being transmitted. Then, each neuron applies an activation function (usually non-linear) to its net input to determine its output signal.
A three-layer (including input, hidden, and output layers) back propagation-ANN (BP-ANN) with sigmoid activation function was employed to predict monthly BPH trap catches using the same set of independent variables considered in the MLR. The number of hidden neurons was determined, to follow Morariu [62]. Optimal learning rates, momentum constants, and the number of training epochs were adjusted empirically based on training efficiency and accuracy. All analytic parameters for the trained neural network applied to BPH trap catch estimation are specified in Table 2. In this work, a customized python script has been used to construct the ANN models.

Random Forest (RF)

Generally, random forest is used for data classification and regression [63]. RF for regression is formed by growing trees depending on a random vector such that the tree predictor takes on numerical values as opposed to class labels [47].
To train the RF model, we experimented with the set of a number of trees, consisting of 200, 500 and 1000 trees. Other hyperparameters were set to the default. The training dataset consisted of all variables that remained, following the ANN and MLR modelling procedure. A regression tree grew based on the training data for each of the boostrap samples. At each node, predictors were randomly sampled and the best split from those variables was selected. Next, new data were predicted by aggregating the predictions. The RF model then have n-estimators, and the models with the highest R2 and smallest root mean square error (RMSE) were selected as the best RF model. The importance of the input variables was calculated and plotted. In this study, the scikit-learn library with python was applied to develop the model.

2.3.4. Model Validity and Performance Evaluation for MLR, ANN, and RF Models

A test dataset of BPH light trap catches that was not used for the training process was obtained from the CHN, SPB, NTB, and KKL light trap stations in the 2016, 2013, 2012, and 2012 crop dry seasons, respectively. These data were used to evaluate the statistical prediction performance of the ANN, RF, and MLR models according to R2 values between observed and predicted values and the RMSE [64,65].
All procedures from Section 2.2 and Section 2.3 are summarized in the methodology flowchart in Figure 4.

3. Results

3.1. Relationship between Climatic and Host-Plant Phenology Variables and the BPH Light Trap Catch

Correlation coefficients (R) were calculated between the natural log-transformed BPH light trap catch (lnBPH) and the time-lagged environmental variables selected (0 and 1-previous-month weather and host plant parameters) (Table 3). The results showed that the BPH light trap catch had significant positive relationships with minimum temperatures with no lag (R = 0.608, p < 0.01) and with maximum temperatures at no lag and at a lag of one month (R = 0.546 and 0.457, p < 0.01, respectively) and NDVI at a lag of one month (R = 0.738, p < 0.01). Meanwhile, the relationships between trap catch and RH and rainfall were not significant. The highly significant correlation variables were selected into the linear and non-linear models for predicting BPH light trap catches.

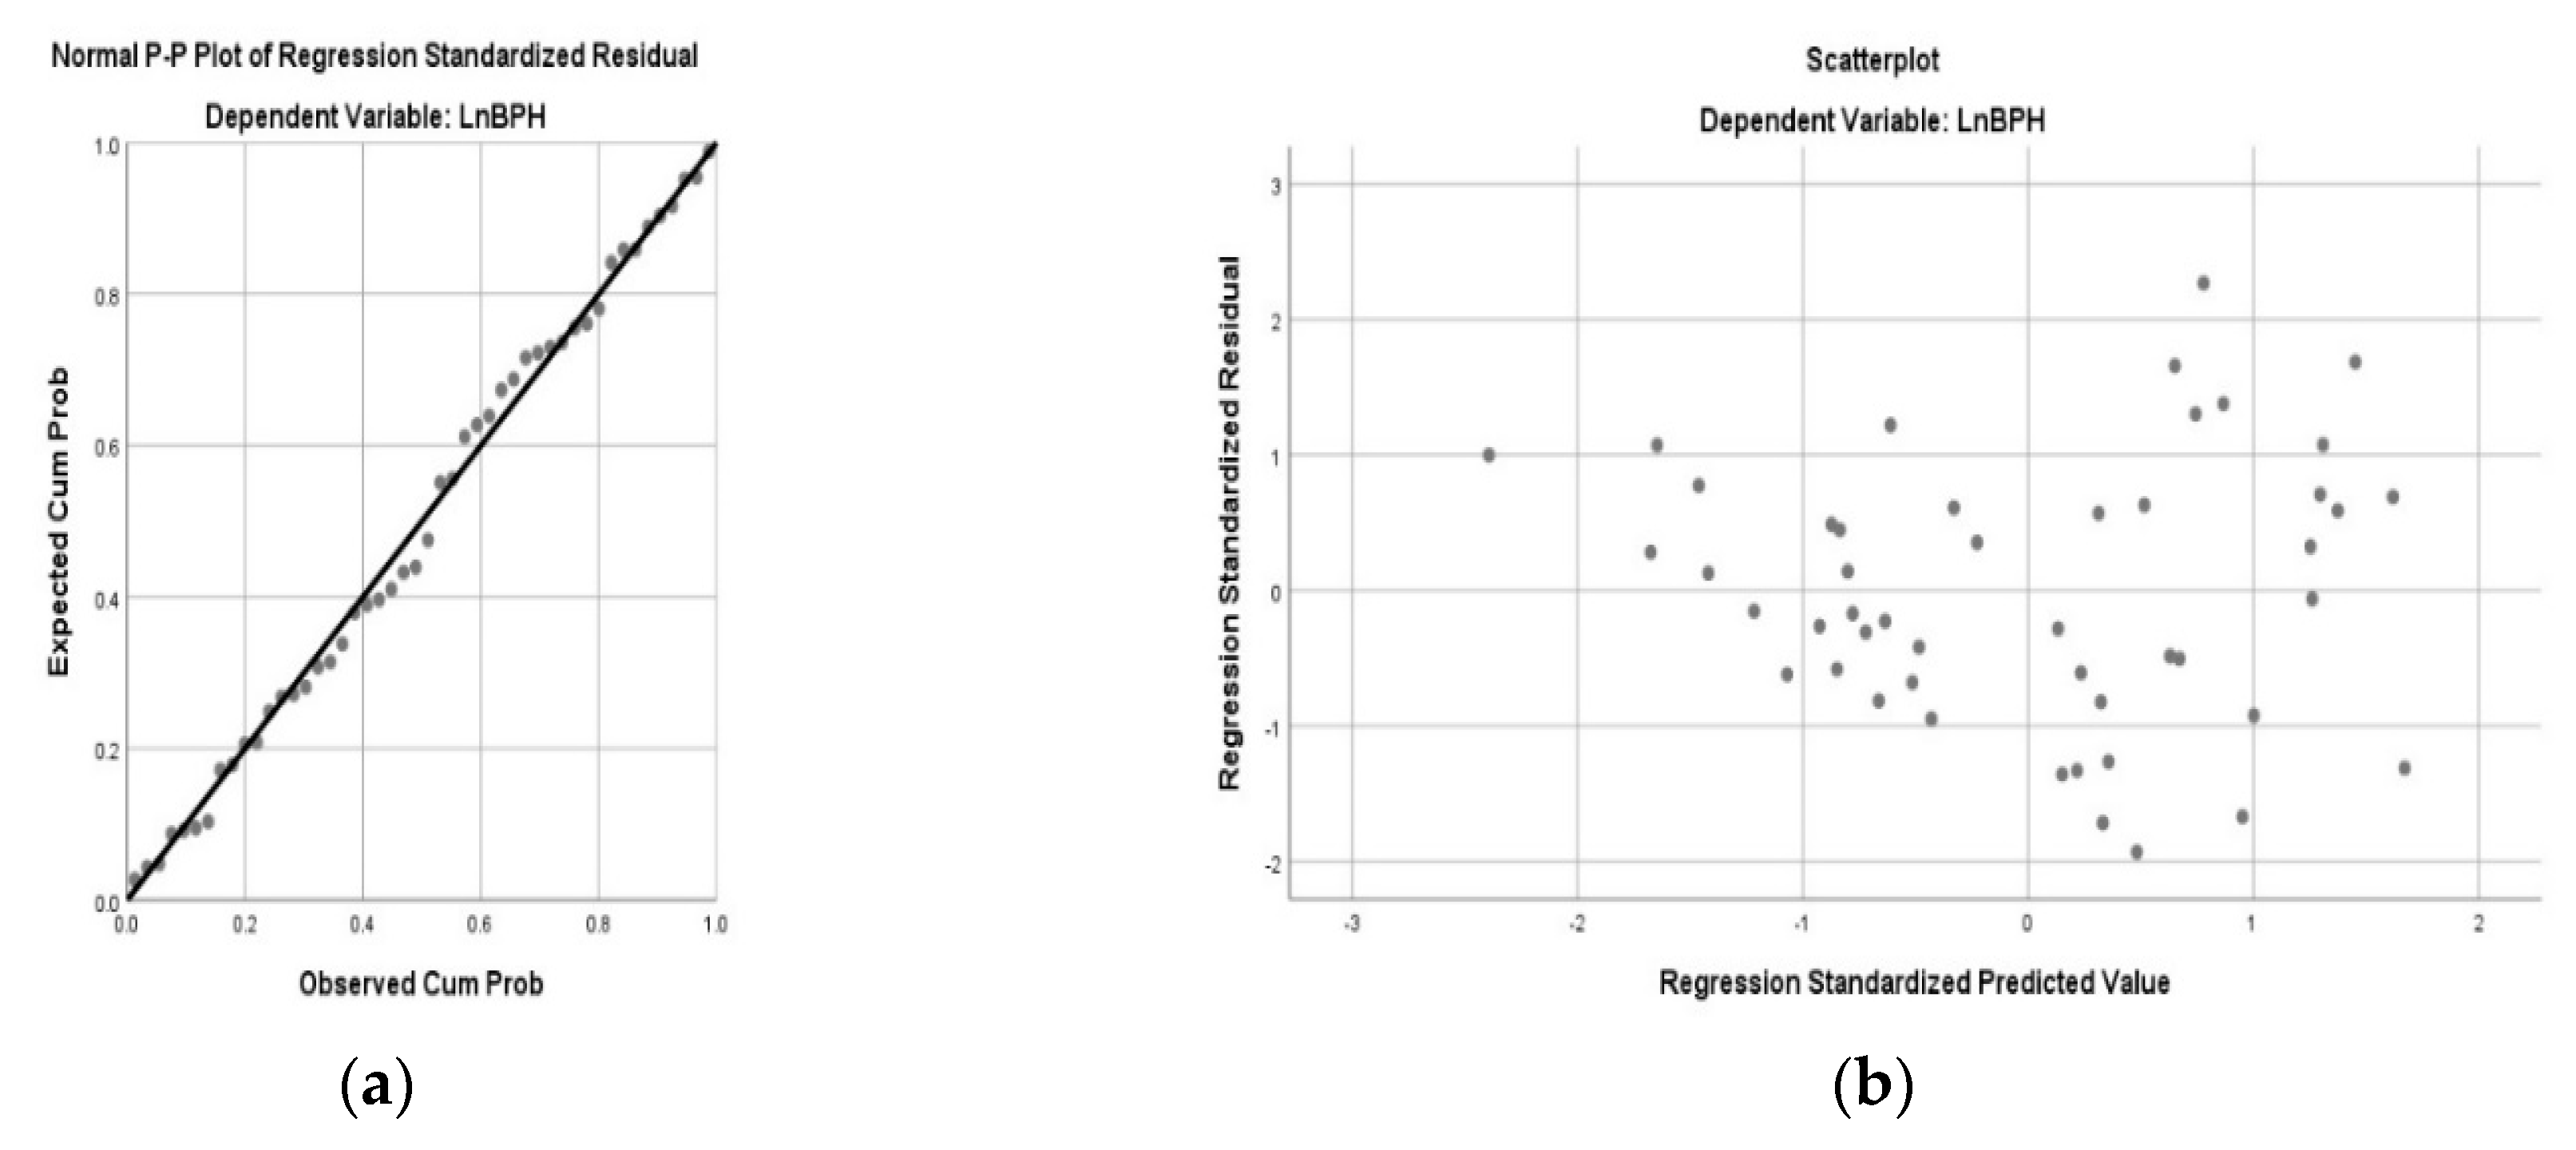
3.2. Prediction with Multiple Linear Regression

An MLR model with stepwise selection was employed based on a combination of weather and host-plant phenology variables (Table 4). Table 4 shows the standardized beta coefficients that present the contributions of each variable to the model. The t and p values show the impact of the independent variables on the dependent variable. Only Tmin and NDVI showed a significant positive relationship with BPH trap catches. The large t value (t = 5.140) and corresponding lowest p-value (p < 0.01) support the result for NDVI at a one-month lag, which had the highest beta coefficient.
A model based on weather variables alone (Model 1) could explain approximately 35% (adjusted R2 = 0.356) of the variability in the BPH light trap catch. In contrast, the model involving incorporated weather and host-plant phenology variables could explain approximately 58% of the variability of the light trap catch (adjusted R2 = 0.585) (Model 2) with an acceptable variance inflation factor (VIF <10) value, indicating that there was no multicollinearity among independent variables. Considering both the adjusted R2 and the standard error of estimate (SEE), the model with the combination of both significant weather and host-plant phenology was selected as the best model (Model 2). The SEE represents the degree to which the predicted values differ from the observed values on the criterion measure. Lower values of the SEE indicate greater accuracy in prediction [66].
The residual of the stepwise regression model for the prediction of BPH was tested for normality and homoscedasticity. The normal probability plot (Figure 5a) indicates that residuals follow normality. However, the residual plot (Figure 5b) showed a signal of funneling-shape, suggesting that the residuals were not random.
Based on the stepwise regression model results shown in Table 4, the predictive models can be expressed using regression equations (Equation (2)):
ln (BPH) = ‒11.470 + (0.432 × Tmin at lag 0 month) + (10.512 × NDVI at lag 1 month)
where the response variable ln (BPH) denotes the natural log of BPH incidence, and the explanatory variables Tmin at lag 0 month denotes the minimum temperature during the current month, and NDVI at lag 1 month denotes NDVI during the previous month.

3.3. Prediction with Artificial Neural Network

The layer and processor elements of the neural network were trained to produce the optimum number that fulfills the process of prediction with the lowest error, using trial and error. The neuron number in this hidden layer was found to be five. The learning rate was taken as 0.4, the momentum was 0.5, and the maximum iteration number was 1000. The optimum number of different neural network elements is shown in Table 5, and their architecture structure is shown in Figure 6.
The ANN model applied on the training dataset yielded a coefficient of determination value of approximately 95% (R2 = 0.952) with an RMSE of 0.661. The range of natural log-transformed (ln) BPH light trap catches were between 0.304 and 10.802.

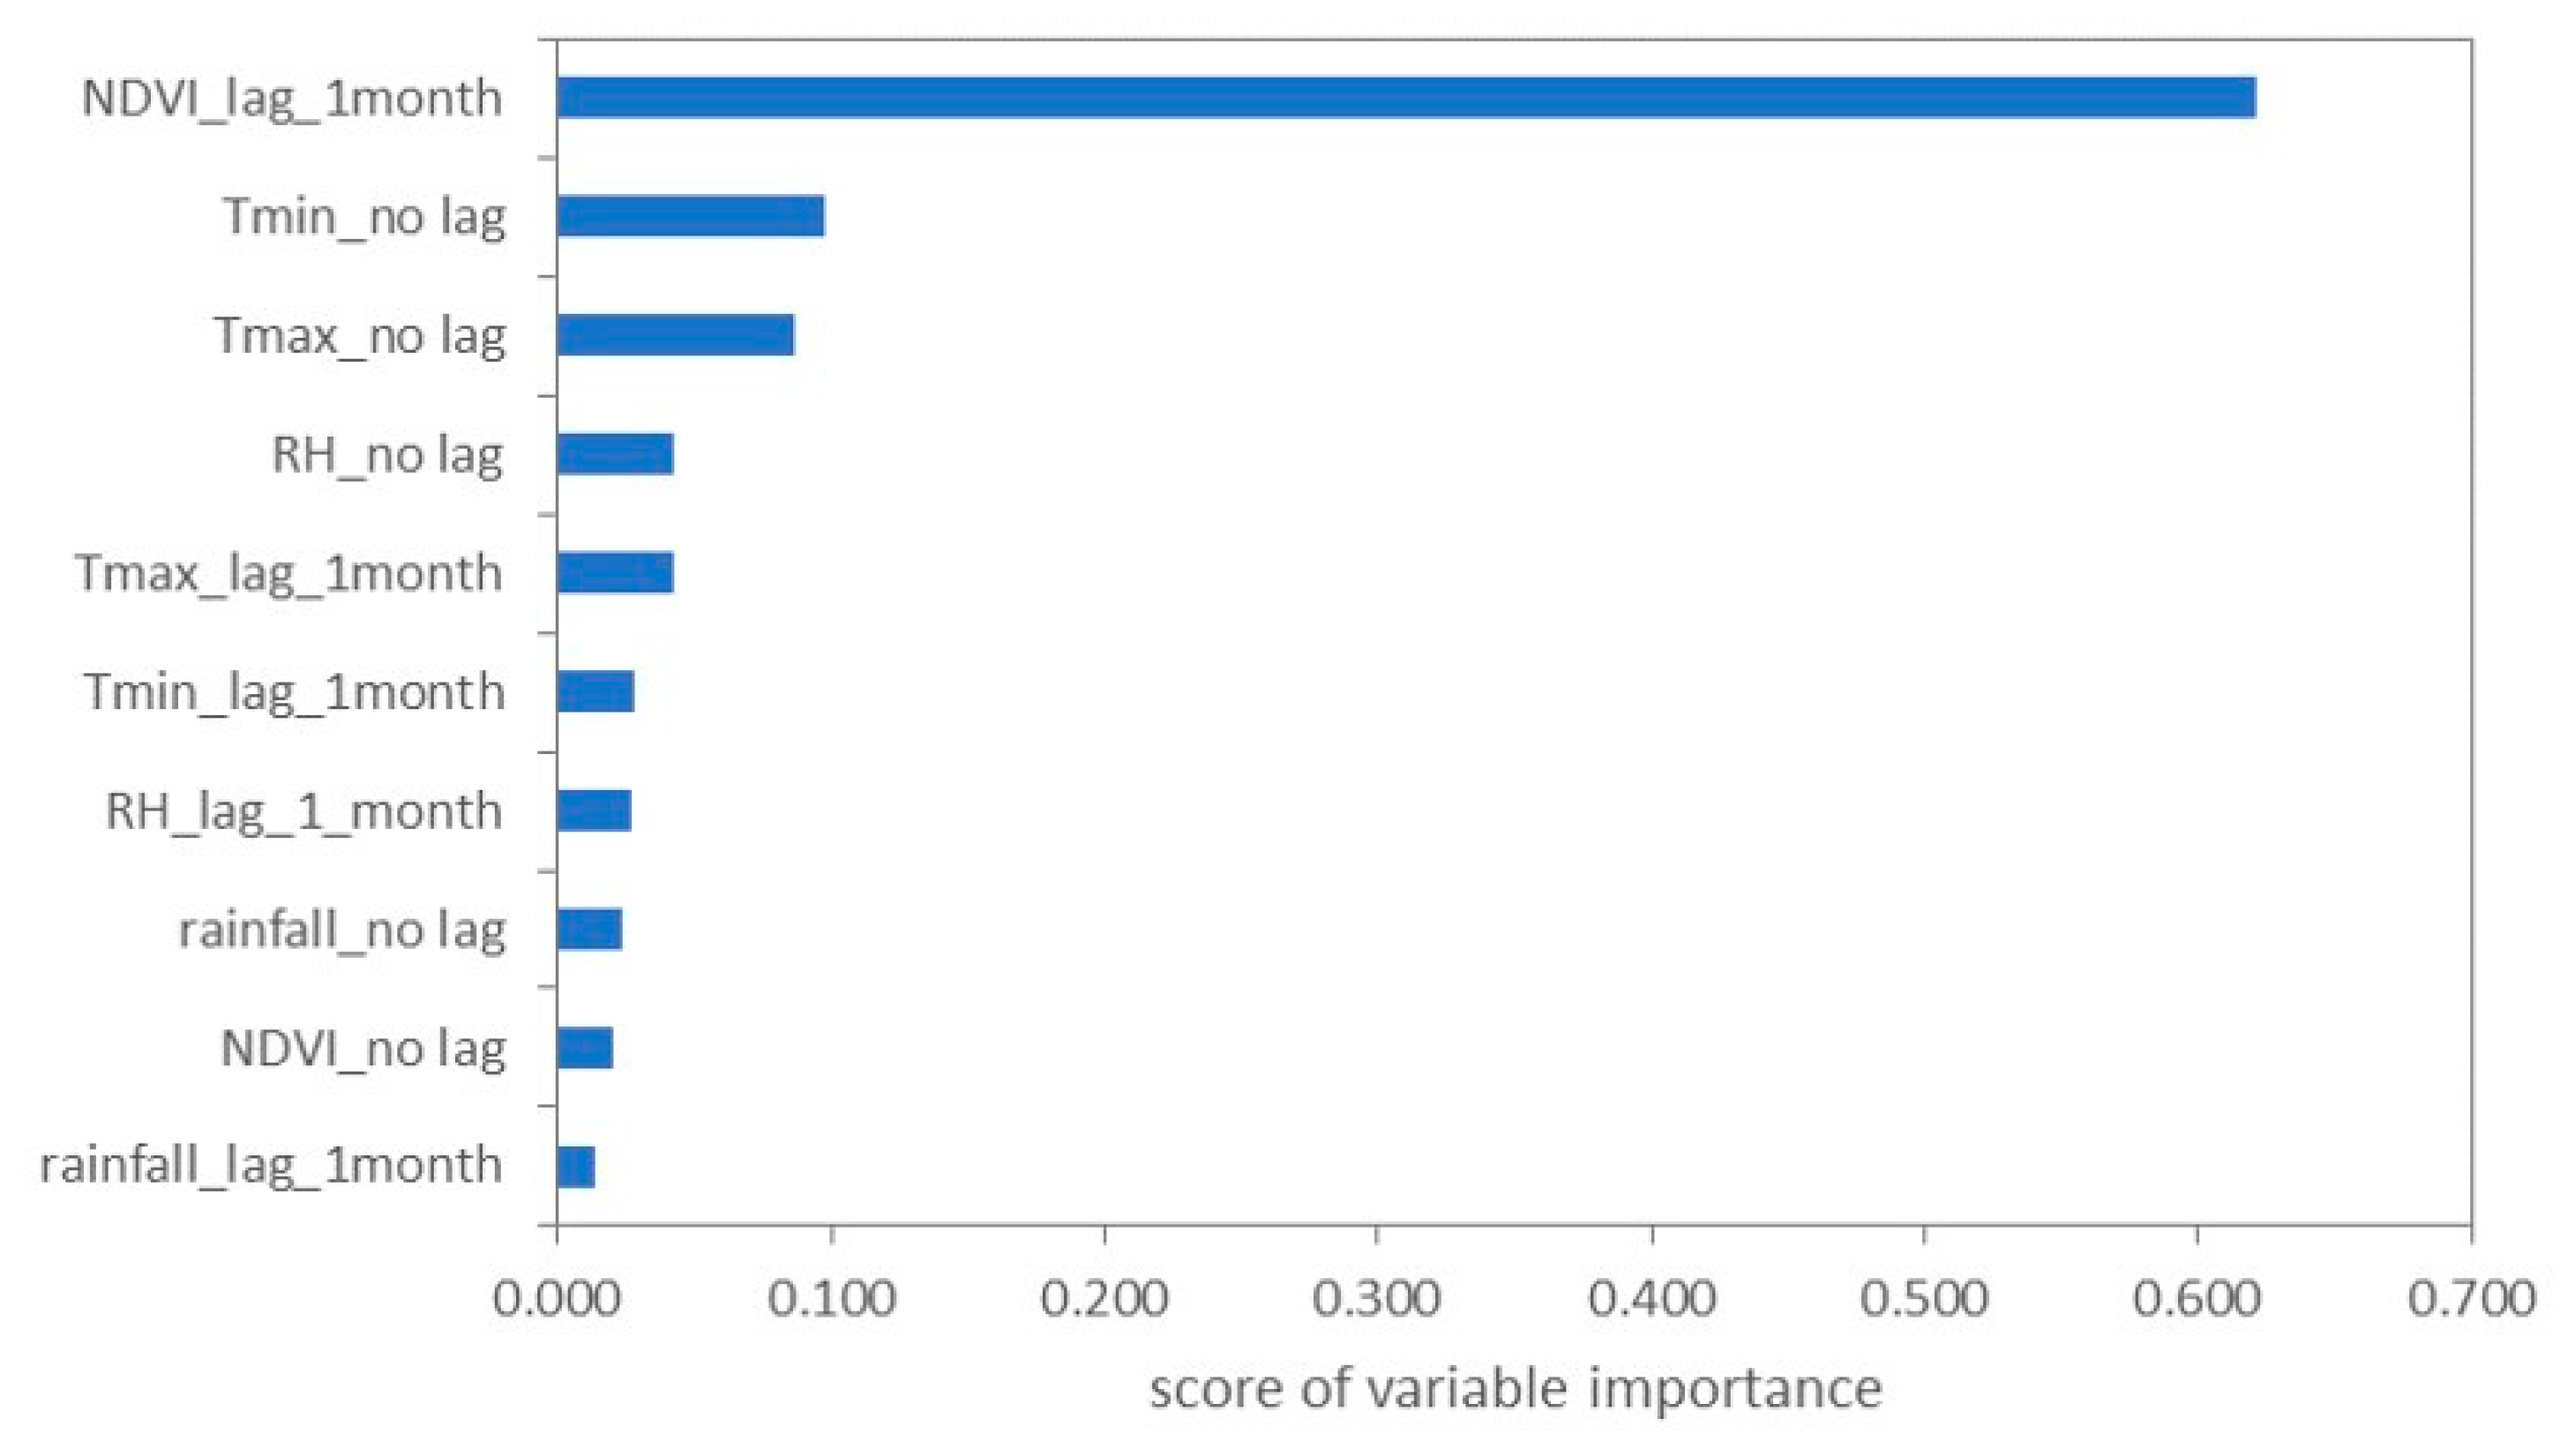
3.4. Prediction with Random Forest

Based on the training dataset, the result indicated that the RF models with different numbers of trees (ntree = 200, 500, and 1000) produced nearly identical results (R2 = 0.956, 0.953, and 0.951; RMSE = 0.723, 0.731, and 0.738, respectively). Figure 7 provides an indication of the importance of the input variables in the RF model of natural log-transformed (ln) BPH light trap catches. NDVI at a lag time of one month is the most important input variable. Rainfall at a lag time of one month is the least important input variable in the RF model.

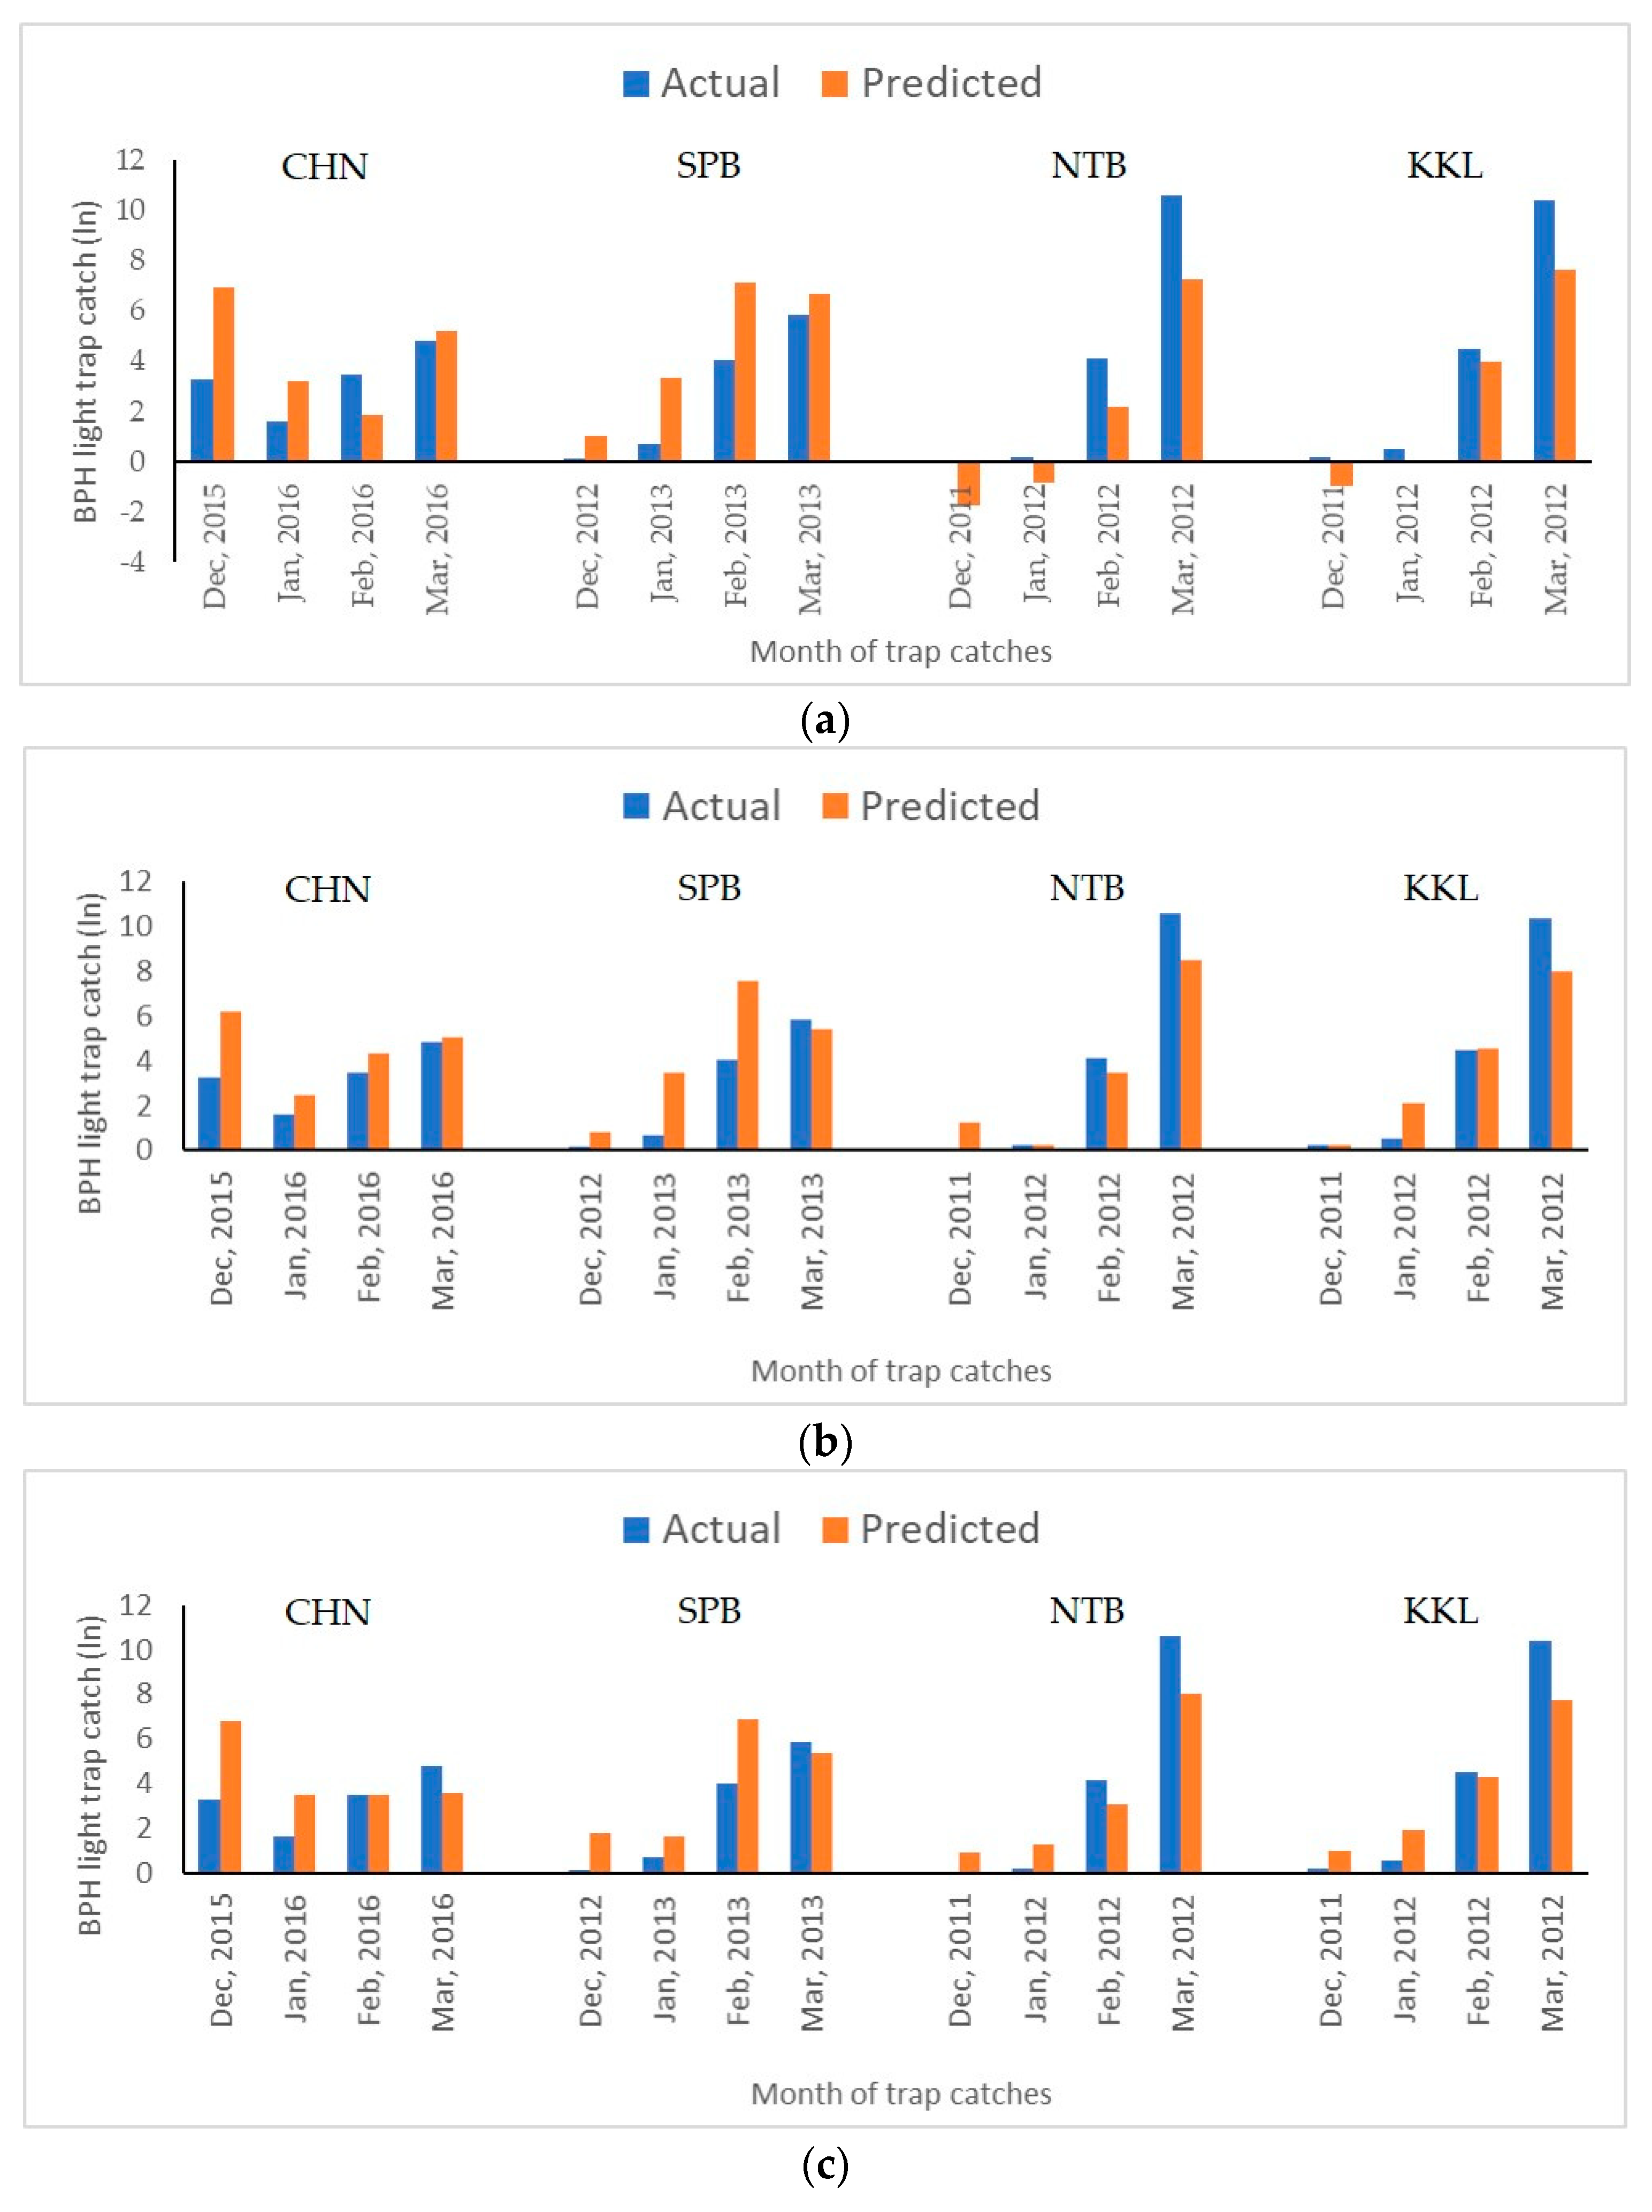
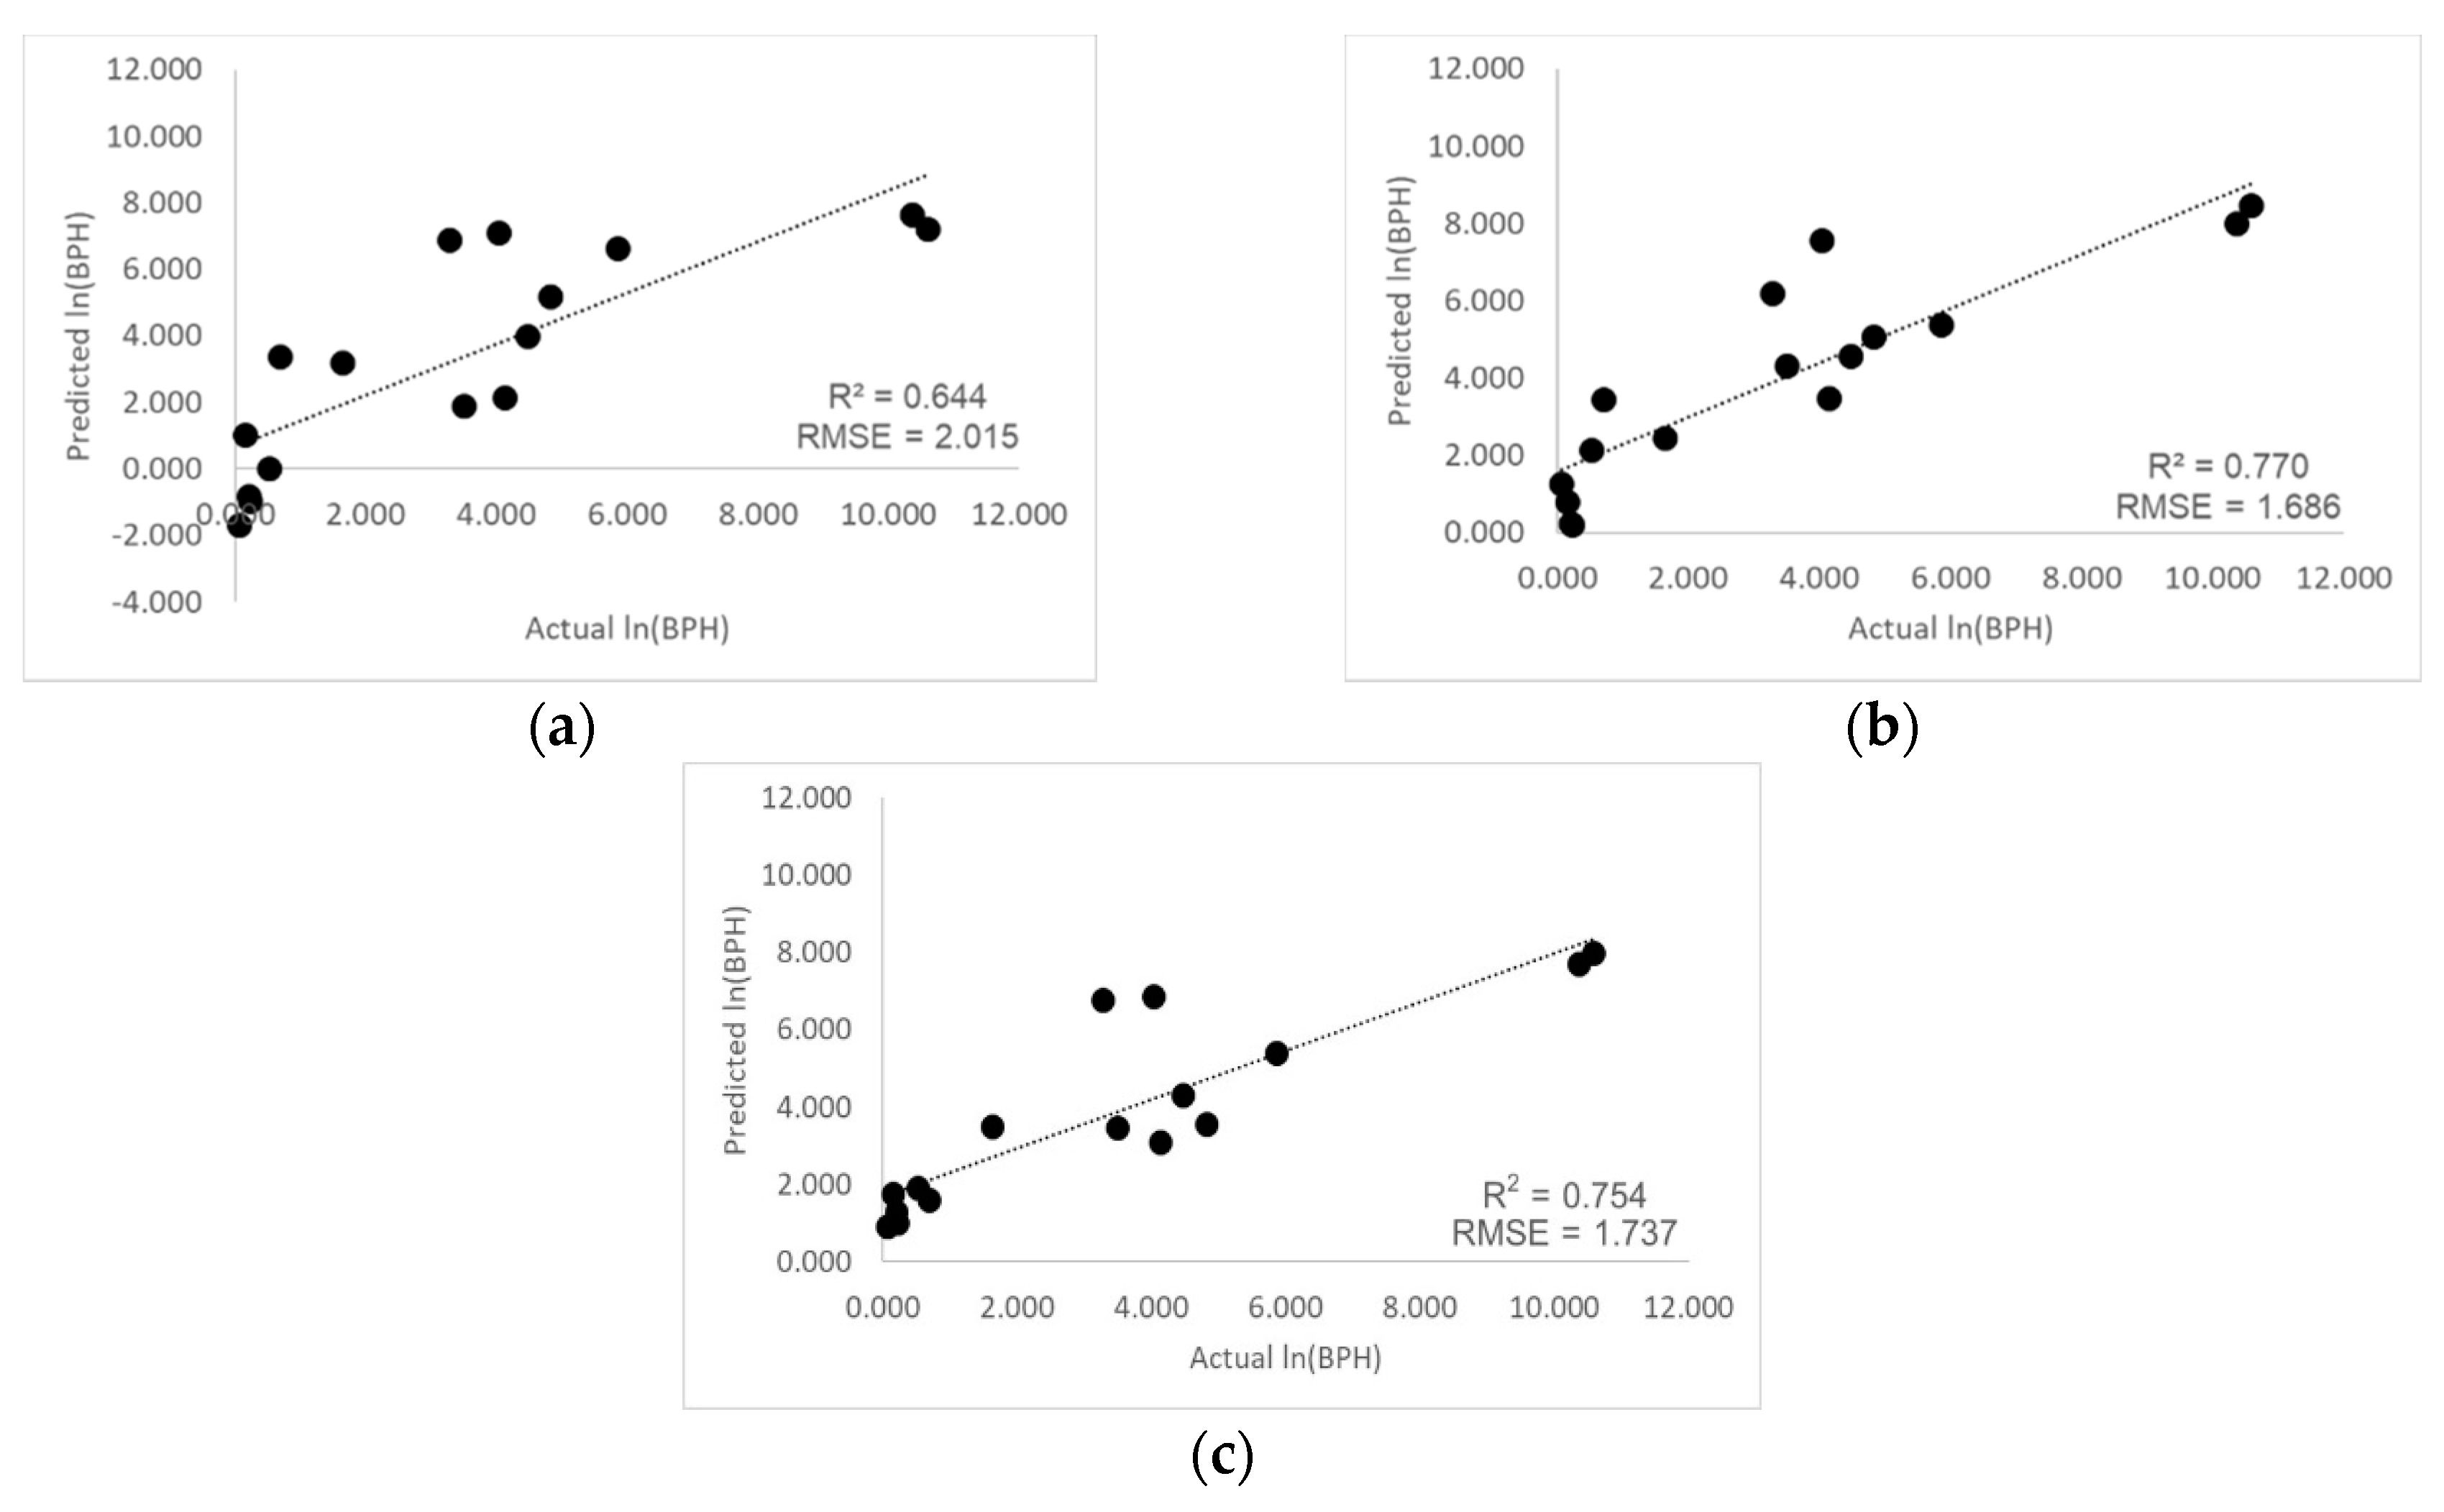
3.5. Model Validation and Prediction Performance Comparison between MLR, ANN and RF Models

Plot validation comparing the actual and predicted natural log-transformed (ln) BPH light trap catches for the testing dataset in the different light trap stations and different crop dry seasons using the traditional MLR, ANN, and RF modelling is shown in Figure 8. The results indicated that all three models usually provided good prediction in February and March for all sites except in the cases of abnormally high BPH population levels.
Figure 9 shows the scatter plots of the comparison between actual natural log transformed BPH populations as predicted by the MLR, ANN and RF models. Comparing R2 and RMSE, ANN produced more accurate yield predictions than MLR but was slightly different to RF. The R2 for ANN, RF, and MLR were 0.770, 0.754, and 0.645, respectively. The RMSE for ANN, RF, and MLR were 1.686, 1.737, and 2.015, respectively.

4. Discussion

Forecasting pest population abundance can help in developing pest management strategies that reduce the quantity of insecticide application, and is a useful component for successful area-wide implementation of IPM [31]. For a pest forecasting model, weather variables such as temperature, humidity, rainfall, sunshine duration and others are often used as abiotic predictors for model development [54,67,68,69]. Biotic factors such as host plant phenology can also affect pest population dynamics [31,70]. We found that the minimum temperature affects BPH development and population dynamics. This is similar to Ali et al. [27] who found that increasing temperatures positively influence BPH populations at low temperatures but have a negative influence at high temperatures.
Satellite-based NDVI time series were applied to represent the host plant phenology factor to study the association between rice growth stages and pest population. We found that during the months of January and March in the dry crop season, NDVI at a lag time of one month with regard to rice paddy fields has a significant positive correlation with BPH population fluctuations. This relationship may be due to the association between peak BPH population in each generation and different rice growth stages [10,71]. In general, the peak catches of adult BPH were observed when rice was mature and post-harvest, as a result of peak nymph populations occurring in the rice paddy fields in the preceding month [71]. In terms of the utilization of phenological information with regard to rice paddy fields based on the satellite time series, these results are in agreement with a previous study in which rice phenology was assessed by remote sensing for the first time to observe BPH migration in the Vietnamese Mekong Delta; the peak BPH occurrence periodically changed according to the harvesting stage in the rice cultivated area [14]. One advantage of this remotely sensed host-plant indicator is the reduction in cost, time and labor required to obtain rice development status from field observations, since satellite earth observation data can take advantage of both spatial and temporal crop information.
The stepwise multiple regression model developed in this study suggests that the combination of the satellite-based rice phenology variable and ground-based weather variables could slightly increase the accuracy of the model (adjusted R2 = 0.585) when compared with weather factors alone (adjusted R2 = 0.356), to a statistically significant degree (R2change = 0.229, p < 0.01).
ANN is an appropriate choice for pest occurrence forecasting [46]. As has been observed in previous studies [45], our findings indicated that the ANN model yielded more accurate pest prediction than the MLR model. This may be because the weights assigned to each neural network connection allow a more precise pattern in the input data to be identified [44]. The RF model also performed better than the MLR model, but not better than the ANN model for our dataset. This difference does not mean that RF could not predict the insect catches. To make the ANN and RF models more robust, all related factors such as hyperparameters should be adjusted appropriately and the amount of collected data (in terms of spatial area and length of collection period) should be greater.
Since a rice paddy field is an open environment, factors driving BPH population growth are variable. Apart from meteorological and host plant factors, natural enemies, rice resistance and even farmer practices may affect BPH population dynamics. The differences between the observed and predicted BPH abundance, especially at the SPB light trap station, could be due to changes in the seasonal and surrounding environment [26]. The patterns of rice cultivation and rice phenological stage, as observed by satellites with greater spatial, spectral, and temporal resolution, could be considered in further work.

5. Conclusions

This investigation examined the use of integrated ground-based meteorological variables and satellite-derived host plant variables to build a prediction model for population occurrence of BPH during the rice crop dry season in the central plain of Thailand. MLR, ANN, and RF models were developed based on these variables. MLR was employed to investigate the prediction ability of weather variables alone or in combination with host-plant phenology, while ANN and RF models were established to enhance the prediction performance of the model compared to MLR.
Tmin without lag and NDVI at a one-month lag were selected as the major factors in the MLR model based on their high correlation coefficients. Moreover, we found that the combination of these variables yielded higher accuracy in predicting light trap catches than weather variables alone. Use of ANN (with a 10-5-1 structure) and RF (with number of trees: 500) yielded a more efficient performance than the MLR in terms of R2 and RMSE in testing (ANN model: R2 = 0.770, RMSE = 1.686; RF model: R2 = 0.754, RMSE = 1.737; and MLR model: R2 = 0.645, RMSE = 2.015) dataset validation.
In summary, an ANN model integrating ground-based meteorological variables and satellite-derived host plant variables can be utilized for short-term forecasting of the peak abundance of BPH, to be applied in timely management of crop pests after reasonable validation with different location and seasonal data. We expect that these results can be applied in conjunction with the satellite-based rice monitoring system developed by the Geo-Informatic and Space Technology Development Agency (GISTDA; http://rice.gistda.or.th) to support an effective pest early warning system.

Author Contributions

Conceptualization, S.S. and M.N.; data curation, S.S.; formal analysis, S.S. and M.N.; methodology, S.S.; software, S.S.; validation, S.S.; writing—original draft preparation, S.S.; writing—review and editing, S.S., M.N., N.K.T. and P.S.; supervision, M.N., N.K.T. and P.S.

Funding

This research received no external funding.

Acknowledgments

We are thankful to Chairat Channoo, Agricultural Research Officer (Professional Level), Chai Nat Rice Research Center for providing the BPH light trap catches data and Siam Lawawirojwong, Geo-Informatic and Space Technology Development Agency (Public Organization) for supporting the BP-ANN Python script.

Conflicts of Interest

The authors declare no conflict of interest.

References

  1. Hu, G.; Lu, F.; Zhai, B.-P.; Lu, M.-H.; Liu, W.-C.; Zhu, F.; Wu, X.-W.; Chen, G.-H.; Zhang, X.-X. Outbreaks of the Brown Planthopper Nilaparvata lugens (Stål) in the Yangtze River Delta: Immigration or Local Reproduction? PLoS ONE 2014, 9, e88973. [Google Scholar] [CrossRef] [PubMed]
  2. Sawada, H.; Kusmayadi, A.; Gaib Subroto, S.W.; Suwardiwijaya, E. Comparative analysis of population characteristics of the brown planthopper, Nilaparvata lugens Stål, between wet and dry rice cropping seasons in West Java, Indonesia. Res. Popul Ecol. 1993, 35, 113–137. [Google Scholar] [CrossRef]
  3. Heong, K.L.; Hardy, B. Planthoppers: New Threats to the Sustainability of Intensive Rice Production Systems in Asia; International Rice Research Institute: Los Baños, Philippines, 2009. [Google Scholar]
  4. Ali, M.; Alghamdi, S.; Begum, M.; Anwar Uddin, A.; Alam, M.; Huang, D. Screening of rice genotypes for resistance to the brown planthopper, Nilaparvata lugens Stål. Cereal Res. Commun. 2012, 40, 502–508. [Google Scholar] [CrossRef]
  5. Jannoey, P.; Pongprasert, W.; Lumyong, S.; Roytrakul, S.; Nomura, M. Comparative proteomic analysis of two rice cultivars (“Oryza sativa” L.) contrasting in Brown Planthopper (BPH) stress resistance. Pl. Omics 2015, 8, 96. [Google Scholar]
  6. Win, S.S.; Muhamad Awang, R.; Mior Ahmad, Z.A.; Adam, N.A. Population fluctuations of brown plant hopper Nilaparvata lugens and white backed plant hoper Sogatella furcifera on rice. J. Entomol. 2010, 8, 183–190. [Google Scholar]
  7. Yadav, D.S.; Chander, S.; Selvaraj, K. Agro-ecological zoning of brown planthopper [Nilaparvata lugens (Stal)] incidence on rice (Oryza sativa L.). JSIR 2010, 69, 818–822. [Google Scholar]
  8. Prasannakumar, N.R.; Chander, S. Weather-based brown planthopper prediction model at Mandya, Karnataka. J. Agrometeorol. 2014, 16, 126. [Google Scholar]
  9. Susanti, E.; Ramadhani, F.; June, T.; Amiena, L.I. Utilization of climate information for development of early warning system for Brown Plant Hopper attack on rice. Indones. J. Agric. 2010, 3, 17–25. [Google Scholar]
  10. Hafizal, M.M.; Idris, A.B. Field population abundance of leafhopper (Homoptera: Cicadelidae) and planthopper (Homoptera: Delphacidae) as affected by rice growth stages. AIP Conf. Proc. 2013, 1571, 359–362. [Google Scholar]
  11. Alam, S. Population Dynamics of the Common Leafhopper and Planthopper Pests of Rice. Ph.D Thesis, Cornell University, Ithaca, NY, USA, 1972. [Google Scholar]
  12. Bae, S.H.; Pathak, M.D. Common Leafhopper-Planthopper Populations and Incidence of Tungro Virus in Diazinon-Treated and Untreated Rice Plots. J. Econ. Entomol. 1969, 62, 772–775. [Google Scholar] [CrossRef]
  13. Mangalgikar, P.; Harsur, M. Incidence of Brown Planthopper (BPH) Nilaparvata lugens Stal. (Delphacidae:Hemiptera) in relation to age of the Rice Crop. Int. J. Agric. Sci. 2012, III, 197–200. [Google Scholar]
  14. Otuka, A.; Sakamoto, T.; Chien, H.V.; Matsumura, M.; Sanada-Morimura, S. Occurrence and short-distance migration of Nilaparvata lugens (Hemiptera: Delphacidae) in the Vietnamese Mekong Delta. Appl. Entomol. Zool. 2014, 49, 97–107. [Google Scholar] [CrossRef]
  15. Bolton, D.K.; Friedl, M.A. Forecasting crop yield using remotely sensed vegetation indices and crop phenology metrics. Agric. For. Meteorol. 2013, 173, 74–84. [Google Scholar] [CrossRef]
  16. Knight, J.F.; Lunetta, R.S.; Ediriwickrema, J.; Khorram, S. Regional Scale Land Cover Characterization Using MODIS-NDVI 250 m Multi-Temporal Imagery: A Phenology-Based Approach. GISci. Remote Sens. 2006, 43, 1–23. [Google Scholar] [CrossRef]
  17. Lunetta, R.S.; Knight, J.F.; Ediriwickrema, J.; Lyon, J.G.; Worthy, L.D. Land-cover change detection using multi-temporal MODIS NDVI data. Remote Sens. Environ. 2006, 105, 142–154. [Google Scholar] [CrossRef]
  18. Sakamoto, T.; Yokozawa, M.; Toritani, H.; Shibayama, M.; Ishitsuka, N.; Ohno, H. A crop phenology detection method using time-series MODIS data. Remote Sens. Environ. 2005, 96, 366–374. [Google Scholar] [CrossRef]
  19. Zhang, X.; Friedl, M.A.; Schaaf, C.B.; Strahler, A.H.; Hodges, J.C.F.; Gao, F.; Reed, B.C.; Huete, A. Monitoring vegetation phenology using MODIS. Remote Sens. Environ. 2003, 84, 471–475. [Google Scholar] [CrossRef]
  20. Zhang, X.; Friedl, M.A.; Schaaf, C.B. Global vegetation phenology from Moderate Resolution Imaging Spectroradiometer (MODIS): Evaluation of global patterns and comparison with in situ measurements. J. Geophys. Res. 2006, 111, G04017. [Google Scholar] [CrossRef]
  21. Son, N.-T.; Chen, C.-F.; Chen, C.-R.; Duc, H.-N.; Chang, L.-Y. A Phenology-Based Classification of Time-Series MODIS Data for Rice Crop Monitoring in Mekong Delta, Vietnam. Remote Sens. 2013, 6, 135–156. [Google Scholar] [CrossRef]
  22. Boschetti, M.; Stroppiana, D.; Brivio, P.A.; Bocchi, S. Multi-year monitoring of rice crop phenology through time series analysis of MODIS images. Int. J. Remote Sens. 2009, 30, 4643–4662. [Google Scholar] [CrossRef]
  23. Boschetti, M.; Busetto, L.; Manfron, G.; Laborte, A.; Asilo, S.; Pazhanivelan, S.; Nelson, A. PhenoRice: A method for automatic extraction of spatio-temporal information on rice crops using satellite data time series. Remote Sens. Environ. 2017, 194, 347–365. [Google Scholar] [CrossRef]
  24. Nuarsa, I.W.; Nishio, F.; Nishio, F.; Hongo, C.; Hongo, C. Relationship between Rice Spectral and Rice Yield Using Modis Data. J. Agric. Sci. 2011. [Google Scholar] [CrossRef]
  25. Tingting, L.; Chuang, L. Study on extraction of crop information using time-series MODIS data in the Chao Phraya Basin of Thailand. Adv. Sp. Res. 2010, 45, 775–784. [Google Scholar] [CrossRef]
  26. Li, X.-Z.; Zou, Y.; Yang, H.-Y.; Xiao, H.-J.; Wang, J.-G. Meteorological driven factors of population growth in brown planthopper, Nilaparvata lugens St’l (Hemiptera: Delphacidae), in rice paddies: Driven Factors of BPH growth. Entomol. Res. 2017, 47, 309–317. [Google Scholar] [CrossRef]
  27. Ali, M.P.; Huang, D.; Nachman, G.; Ahmed, N.; Begum, M.A.; Rabbi, M.F. Will Climate Change Affect Outbreak Patterns of Planthoppers in Bangladesh? PLoS ONE 2014, 9, e91678. [Google Scholar] [CrossRef]
  28. Isichaikul, S.; Ichikawa, T. Relative humidity as an environmental factor determining the microhabitat of the nymphs of the rice brown planthopper, Nilaparvata lugens (Stål) (Homoptera: Delphacidae). Res. Popul. Ecol. 1993, 35, 361–373. [Google Scholar] [CrossRef]
  29. Romadhon, S.; Koesmaryono, Y.; Hidayati, R. Influence of Climate Variability on Brown Planthopper Population Dynamics and Development Time. IOP Conf. Ser. Earth Environ. Sci. 2017, 58, 012042. [Google Scholar] [CrossRef]
  30. Chaudhary, S.; Raghuraman, M.; Kumar, H. Seasonal abundance of brown plant hopper Nilaparvata lugens in Varanasi region India. Int. J. Curr. Microbiol. Appl. Sci. 2014, 3, 1014–1017. [Google Scholar]
  31. Kamala Jayanthi, P.D.; Verghese, A. Host-plant phenology and weather based forecasting models for population prediction of the oriental fruit fly, Bactrocera dorsalis Hendel. Crop Prot. 2011, 30, 1557–1562. [Google Scholar] [CrossRef]
  32. Paswan, R.P.; Begum, S.A. Regression and Neural Networks Models for Prediction of Crop Production. Int. J. Sci. Eng. Res. 2013, 4, 11. [Google Scholar]
  33. Abiodun, O.I.; Jantan, A.; Omolara, A.E.; Dada, K.V.; Mohamed, N.A.; Arshad, H. State-of-the-art in artificial neural network applications: A survey. Heliyon 2018, 4, e00938. [Google Scholar] [CrossRef] [PubMed]
  34. Gandhi, N.; Petkar, O.; Armstrong, L.J. Rice crop yield prediction using artificial neural networks. In Proceedings of the 2016 IEEE Technological Innovations in ICT for Agriculture and Rural Development (TIAR), Chennai, India, 15–16 July 2016; pp. 105–110. [Google Scholar]
  35. Sathe, P.M.; Venitz, J. Comparison of Neural Network and Multiple Linear Regression as Dissolution Predictors. Drug Dev. Ind. Pharm. 2003, 29, 349–355. [Google Scholar] [CrossRef] [PubMed]
  36. Arsad, P.M.; Buniyamin, N.; Ab Manan, J. Neural Network and Linear Regression Methods for Prediction of Students’ Academic Achievement. In Proceedings of the 2014 IEEE Global Engineering Education Conference (EDUCON), Istanbul, Turkey, 3–5 April 2014; pp. 916–921. [Google Scholar]
  37. Lin, S.L. A two-stage logistic regression-ANN model for the prediction of distress banks: Evidence from 11 emerging countries. Afr. J. Bus. Manag. 2010, 4, 3149–3168. [Google Scholar]
  38. Law, R. Back-propagation learning in improving the accuracy of neural network-based tourism demand forecasting. Tour. Manag. 2000, 21, 331–340. [Google Scholar] [CrossRef]
  39. Dilek, S.; Cakır, H.; Aydın, M. Applications of Artificial Intelligence Techniques to Combating Cyber Crimes: A Review. Int. J. Artif. Intell. Appl. (IJAIA) 2015, 6, 21–39. [Google Scholar] [CrossRef]
  40. Malinova, T.; Guo, Z.X. Artificial neural network modelling of hydrogen storage properties of Mg-based alloys. Mater. Sci. Eng. A 2004, 365, 219–227. [Google Scholar] [CrossRef]
  41. Kulkarni, S.; Haidar, I. Forecasting Model for Crude Oil Price Using Artificial Neural Networks and Commodity Futures Prices. Int. J. Comput. Sci. Inf. Secur. (IJCSIS) 2009, 2, 1. [Google Scholar]
  42. Barone, G.; Mazzoleni, P.; Spagnolo, G.V.; Raneri, S. Artificial neural network for the provenance study of archaeological ceramics using clay sediment database. J. Cult. Herit. 2019, 38, 147–157. [Google Scholar] [CrossRef]
  43. Narayana, B.V.L.; Reddy, P.K.; Rao, G.V.R.; Gowda, C.L.L.; Reddy, Y.V.R.; Murthy, G.R. Understanding Helicoverpa armigera pest population dynamics related to chickpea crop using neural networks. In Proceedings of the Third IEEE International Conference on Data Mining, Melbourne, FL, USA, 22–22 November 2003; pp. 723–726. [Google Scholar]
  44. Jayanthi, P.D.K.; Verghese, A.; Sreekanth, P.D. Predicting the oriental fruit fly Bactrocera dorsalis (Diptera: Tephritidae) trap catch using artificial neural networks: A case study. Int. J. Trop. Insect Sci. 2011, 31, 205–211. [Google Scholar] [CrossRef]
  45. Kumar, S.P.; Mazumdar, D.; Kamei, D.; Kamei, A. Advantages of artificial neural network over regression method in prediction of pest incidence in rice crop. Int. J. Agric. Stat. Sci. 2018, 14, 357–363. [Google Scholar]
  46. Yang, L.; Peng, L.; Zhang, L.; Zhang, L.; Yang, S. A prediction model for population occurrence of paddy stem borer (Scirpophaga incertulas), based on Back Propagation Artificial Neural Network and Principal Components Analysis. Comput. Electron. Agric. 2009, 68, 200–206. [Google Scholar] [CrossRef]
  47. Breiman, L. Random Forests. Mach. Learn. 2001, 45, 5–32. [Google Scholar] [CrossRef]
  48. Fawagreh, K.; Gaber, M.M.; Elyan, E. Random forests: From early developments to recent advancements. Syst. Sci. Control Eng. 2014, 2, 602–609. [Google Scholar] [CrossRef] [Green Version]
  49. Biau, G. Analysis of a Random Forests Model. J. Mach. Learn. Res. 2012, 13, 1063–1095. [Google Scholar]
  50. van der Heide, E.M.M.; Veerkamp, R.F.; van Pelt, M.L.; Kamphuis, C.; Athanasiadis, I.; Ducro, B.J. Comparing regression, naive Bayes, and random forest methods in the prediction of individual survival to second lactation in Holstein cattle. J. Dairy Sci. 2019, 102, 9409–9421. [Google Scholar] [CrossRef] [PubMed]
  51. Ayub, U.; Moqurrab, S.A. Predicting crop diseases using data mining approaches: Classification. In Proceedings of the 2018 1st International Conference on Power, Energy and Smart Grid (ICPESG), Mirpur, Azad Kashmir, Pakistan, 9–10 April 2018; pp. 1–6. [Google Scholar]
  52. Balaban, İ.; Acun, F.; Arpalı, O.Y.; Murat, F.; Babaroğlu, N.E.; Akci, E.; Çulcu, M.; Özkan, M.; Temizer, S. Development of a Forecasting and Warning System on the Ecological Life-Cycle of Sunn Pest. arXiv 2019, arXiv:1905.01640. [Google Scholar]
  53. Duo-quan, W.; Lin-hua, T.; Zhen-cheng, G.; Xiang, Z.; Man-ni, Y.; Wei-kang, J. Comparative Evaluation of Light-Trap Catches, Electric Motor Mosquito Catches and Human Biting Catches of Anopheles in the Three Gorges Reservoir. PLoS ONE 2012, 7, e28988. [Google Scholar] [CrossRef] [Green Version]
  54. Sharma, M.K.; Atsedewoin, A.; Fanta, S. Forewarning models of the insects of paddy crop. Int. J. Biodivers. Conserv. (IJBC) 2011, 3, 367–375. [Google Scholar]
  55. Yan, Y.; Feng, C.-C.; Wan, M.P.-H.; Chang, K.T.-T. Multiple Regression and Artificial Neural Network for the Prediction of Crop Pest Risks. In Proceedings of the International Conference on Information Systems for Crisis Response and Management in Mediterranean Countries, Tunis, Tunisia, 28–30 October 2015; Bellamine Ben Saoud, N., Adam, C., Hanachi, C., Eds.; Springer International Publishing Switzerland: Cham, Switzerland, 2015; pp. 73–84. [Google Scholar]
  56. Yamamura, K.; Yokozawa, M.; Nishimori, M.; Ueda, Y.; Yokosuka, T. How to analyze long-term insect population dynamics under climate change: 50-year data of three insect pests in paddy fields. Popul. Ecol. 2006, 48, 31–48. [Google Scholar] [CrossRef]
  57. Suepa, T.; Qi, J.; Lawawirojwong, S.; Messina, J.P. Understanding spatio-temporal variation of vegetation phenology and rainfall seasonality in the monsoon Southeast Asia. Environ. Res. 2016, 147, 621–629. [Google Scholar] [CrossRef] [Green Version]
  58. Riley, J.R.; Reynolds, D.R.; Farrow, R.A. The migration of Nilaparvata lugens (stål) (delphacidae) and other hemiptera associated with rice during the dry season in the Philippines: A study using radar, visual observations, aerial netting and ground trapping. Bull. Entomol. Res. 1987, 77, 145–169. [Google Scholar] [CrossRef]
  59. Rakwatin, P.; Prakobya, A.; Sritarapipat, T.; Khobkhun, B.; Pannangpetch, K.; Sobue, S.; Oyoshi, K.; Okumura, T.; Tomiyama, N. Rice crop monitoring in Thailand using field server and satellite remote sensing. Crop Monit. Improv. Food Secur. 2014, 79–84. [Google Scholar]
  60. Ghani, I.M.M.; Ahmad, S. Stepwise Multiple Regression Method to Forecast Fish Landing. Procedia—Soc. Behav. Sci. 2010, 8, 549–554. [Google Scholar] [CrossRef] [Green Version]
  61. Amiri, S.S.; Mottahedi, M.; Asadi, S. Using multiple regression analysis to develop energy consumption indicators for commercial buildings in the US. Energy Build. 2015, 109, 209–216. [Google Scholar] [CrossRef]
  62. Morariu, D.; Crețulescu, R.; Breazu, M. The weka multilayer perceptron classifier. Int. J. Adv. Stat. IT C Econ. Life Sci. 2018, 7, 1–9. [Google Scholar]
  63. Nawar, S.; Mouazen, A. Comparison between Random Forests, Artificial Neural Networks and Gradient Boosted Machines Methods of On-Line Vis-NIR Spectroscopy Measurements of Soil Total Nitrogen and Total Carbon. Sensors 2017, 17, 2428. [Google Scholar] [CrossRef]
  64. Persson, M.; Uvo, C.B. Estimating soil solution electrical conductivity from time domain reflectometry measurements using neural networks. J. Hydrol. 2003, 273, 249–256. [Google Scholar] [CrossRef]
  65. Keshavarzi, A.; Sarmadian, F. Comparison of artificial neural network and multivariate regression methods in prediction of soil cation exchange capacity. World Acad. Sci. Eng. Technol. Int. J. Environ. Chem. Ecol. Geol. Geophys. Eng. 2010, 4, 644–649. [Google Scholar]
  66. Palmer, P.B. Regression Analysis for Prediction: Understanding the Process. Cardiopulm. Phys. Ther. J. 2009, 20, 4. [Google Scholar] [CrossRef]
  67. Mandal, P.; Roy, K.; Saha, G. Weather based prediction model of Scirpophaga incertulas (Walk.). Ann. Plant Prot. Sci. 2011, 19, 20–24. [Google Scholar]
  68. Mouly, R.; Shivananda, T.N.; Verghese, A. Weather based forecasting models for prediction of leafhopper population Idioscopus nitidulus Walker; (Hemiptera: Cicadellidae) in mango orchard. J. Entomol. Zool. Stud. 2017, 5, 163–168. [Google Scholar]
  69. Rahmathulla, V.K.; Kumar, C.M.K.; Angadi, B.S.; Sivaprasad, V. Association of Climatic Factors on Population Dynamics of Leaf Roller, Diaphania pulverulentalis Hampson (Lepidoptera: Pyralidae) in Mulberry Plantations of Sericulture Seed Farm. Psyche A J. Entomol. 2012, 2012, e186214. [Google Scholar] [CrossRef] [Green Version]
  70. Hu, G.; Cheng, X.N.; Qi, G.J.; Wang, F.Y.; Lu, F.; Zhang, X.X.; Zhai, B.P. Rice planting systems, global warming and outbreaks of Nilaparvata lugens (Stål). Bull. Entomol. Res. 2011, 101, 187–199. [Google Scholar] [CrossRef] [PubMed]
  71. Wangsilabat, P. Ecology of Brown Planthopper and Quantity Control; Division of Entomology and Zoology, Department of Agriculture: Bangkok, Thailand, 2002; ISBN 974-436-201-4. [Google Scholar]
Figure 1. Locations of study sites, light traps, and weather stations.
Applsci 09 04846 g001
Figure 2. A light trap at the Chai Nat Rice Research Centre was used to collect brown planthoppers.
Applsci 09 04846 g002
Figure 3. The selected MODIS grid cells that are completely within the rice paddy fields surrounding the light trap station for a radius of about 10 km, used for the NDVI-time series analysis.
Applsci 09 04846 g003
Figure 4. Methodology flowchart for data evaluation.
Applsci 09 04846 g004
Figure 5. (a) Normal probability plot diagram; (b) plot of standardized residuals versus standardized predicted values.
Applsci 09 04846 g005
Figure 6. Structure of the artificial neural network model used in this study.
Applsci 09 04846 g006
Figure 7. Variable importance derived from the RF model for natural log-transformed (ln) BPH light trap catches.
Applsci 09 04846 g007
Figure 8. Predicted results of BPH light trap catches from the test dataset using (a) MLR modelling, (b) ANN modelling, and (c) RF modelling. CHN: Chai Nat province, SPB: Suphan Buri province, NTB: Nonthaburi province, KKL: Khlong Luang district in Pathum Thani province.
Applsci 09 04846 g008
Figure 9. Actual versus predicted natural log transformed ln (BPH) developed by (a) the MLR model, (b) the ANN model, and (c) the RF model.
Applsci 09 04846 g009
Table 1. The details of data used for model development.
SitePlaceInput VariablesOutput VariableMonthRice Crop SeasonTraining/Testing Data
AChai Nat Rice Research Center (CHN)Tmin, Tmax, RH, rainfall and NDVI at lag 0 and 1 monthLn (BPH)December to MarchFrom 2006/2007 to 2014/2015Training
2015/2016Testing
BSuphan Buri Rice Research Center (SPB)2011/2012Training
2012/2013Testing
CFarmer’s paddy field (NTB)2010/2011Training
2011/2012Testing
DKhlong Luang Rice Research Center (KKL)2010/2011Training
2011/2012Testing
Table 2. Parameters for the trained neural network applied to brown planthopper trap catch estimation.
Parameters
Number of inputs variables10 variables (Tmin, Tmax, RH, RF and NDVI at 0 and 1-previous-month)
Number of hidden layers1 layer
Number of neuron node in hidden layers5 nodes
Number of output layers1 layer (natural log-transformed BPH light trap catches)
Learning rate0.1, 0.2, 0.3, 0.4, 0.5, 0.6, 0.7, 0.8 and 0.9
Momentum0.1, 0.2, 0.3, 0.4, 0.5, 0.6, 0.7, 0.8 and 0.9
Number of training epochs500, 1000, 5000 and 10,000
Table 3. Pearson’s correlation coefficient (R) between the natural log-transformed BPH light trap catch and its lag-distributed environmental factors from December to March in the dry rice crop season.
Predictor VariablesCorrelation Coefficient (R)Sig.
Tmin at lag 0 month0.6080.000 **
Tmin at lag 1 month0.1470.318
Tmax at lag 0 month0.5460.000 **
Tmax at lag 1 month0.4570.001 **
RH at lag 0 month0.2270.121
RH at lag 1 month0.2300.115
RF at lag 0 month0.2840.050
RF at lag 1 month0.0590.691
NDVI at lag 0 month0.1830.213
NDVI at lag 1 month0.7380.000 **
** Significant at p < 0.01, Tmin: minimum temperature (°C), Tmax: maximum temperature (°C), RH: relative humidity (%), RF: rainfall (mm), NDVI: normalized differential vegetation index.
Table 4. Statistical diagnostic of the stepwise multiple linear regression models. SEE: standard error of estimate.
ModelVariablesBetaStd. Betat valuep ValueVIF
(1) Weather (constant)−15.879 −4.1200.000
Tmin at lag 0 month0.9090.6085.1920.0001.000
N = 48 R2 = 0.369 Adjusted R2 = 0.356 SEE = 2.447
(2) Weather and Host Plant(constant)−11.470 −3.5730.001
Tmin at lag 0 month0.4320.2892.5640.0141.436
NDVI at lag 1 month10.5120.5795.1400.0001.436
N = 48, R2 = 0.603, adjusted R2 = 0.585, SEE = 1.964, Durbin–Watson = 2.016
Table 5. Architecture, specification, and statistical information of the optimal neural network model.
ParametersValue
Number of input layers10
Number of hidden layers1
Number of neuron node in hidden layers5
Number of output layers1
Learning rate0.4
Momentum0.5
Number of iterations1000

