Effects of Toe-Out and Toe-In Gaits on Lower-Extremity Kinematics, Dynamics, and Electromyography
by
 , ,
, ,
Weiling Cui
1 ,
,
Changjiang Wang
2,
Weiyi Chen
1,*,
Yuan Guo
1,
Yi Jia
3,
Weijin Du
1 and
Chenyan Wang
1 1
College of Biomedical Engineering, Taiyuan University of Technology, Taiyuan 030024, Shanxi, China
2
School of Engineering and Informatics, University of Sussex, Brighton BN1 9QJ, UK
3
School of Sport and Physical Education, North University of China, Taiyuan 030051, Shanxi, China
*
Author to whom correspondence should be addressed.
Appl. Sci. 2019, 9(23), 5245; https://doi.org/10.3390/app9235245
Submission received: 15 October 2019
/
Revised: 28 November 2019
/
Accepted: 28 November 2019
/
Published: 2 December 2019
(This article belongs to the Section Applied Biosciences and Bioengineering)
Abstract
:Toe-in and toe-out gait modifications have received increasing attention as an effective, conservative treatment for individuals without severe osteoarthritis because of its potential for improving knee adduction moment (KAM) and knee flexion moment (KFM). Although toe-in and toe-out gaits have positive effects on tibiofemoral (TF) joint pain in the short term, negative impacts on other joints of the lower extremity may arise. The main purpose of this study was to quantitatively compare the effects of foot progression angle (FPA) gait modification with normal walking speeds in healthy individuals on lower-extremity joint, ground reaction force (GRF), muscle electromyography, joint moment, and TF contact force. Experimental measurements using the Vicon system and multi-body dynamics musculoskeletal modelling using OpenSim were conducted in this study. Gait analysis of 12 subjects (n = 12) was conducted with natural gait, toe-in gait, and toe-out gait. One-way repeated measures of ANOVA (p < 0.05) with Tukey’s test was used for statistical analysis. Results showed that the toe-in and toe-out gait modifications decreased the max angle of knee flexion by 8.8 and 12.18 degrees respectively (p < 0.05) and the max angle of hip adduction by 1.28 and 0.99 degrees respectively (p < 0.05) compared to the natural gait. Changes of TF contact forces caused by FPA gait modifications were not statistically significant; however, the effect on KAM and KFM were significant (p < 0.05). KAM or combination of KAM and KFM can be used as surrogate measures for TF medial contact force. Toe-in and toe-out gait modifications could relieve knee joint pain probably due to redistribution of TF contact forces on medial and lateral condylar through changing lateral contact centers and shifting bilateral contact locations.
1. Introduction
Being a critical load-bearing and movement joint for the lower extremity, the knee joint is often afflicted by diseases, and a variety of complicated factors are associated with the development, maintenance, and health of the joint tissues [1,2]. It is not surprising that a significant level of research is devoted to the knee joint. For patients with mild knee disease, joint replacement and medication (associated with a high risk of side effects) are not necessarily required to reduce knee joint load and pain [3]. Therefore, there is a need for conservative treatments to reduce peak values of tibiofemoral (TF) contact force or knee joint reaction force (JRF), such as valgus knee bracing [4], variable-stiffness shoes [5], lateral wedges [6], and gait modification/retraining [7,8].
Gait modification includes adjustments in trunk lean, walking speed, and the foot progression angle (FPA). It has been reported that gait modifications have a significant effect on ground reaction force (GRF) and knee adduction moment (KAM) during stance phases [9,10,11], the effects of which depend on participant type (age, gender, and with osteoarthritis or healthy), gait modification type, and implementation level of gait modification. Trunk lean is reported to be highly efficient in reducing peak KAM values, while potential adverse effects including lower back discomfort, imbalance, and difficulty in maintenance for a long time [12,13]. Although the toe-in and toe-out gait patterns could alleviate the progression of knee OA (osteoarthritis), the detailed mechanism is still vague [14,15]. Gait modification has showed positive benefits at the knee joint, but it might be associated with negative effects on other joints; the longer-term effects of the toe-in and toe-out gait modifications in patients with knee OA is unknown. Previous work reported that peak value of KAM is positively related to walking speed; however, whilst peak KAM reduces with decreasing walking speed, the load duration on the knee joint increases and the effect of gait modifications on neuromuscular function is less [16,17]. Bennet et al. [18] reported that toe-in and toe-out with wider step width gaits seem to be viable options to reduce peak adduction moment but that sagittal and transverse knee loadings should be monitored. Controlling FPA implies modifying the gait by either toe-in or toe-out adjustment. Individualized toe-in and toe-out would lead to immediate quadricep and hamstring co-contraction increases in healthy adults. However, after adjusting the gait for a short period of time, the co-activations of these muscles were not significant [11].
The effective outcome of FPA gait modification is mainly adjusting the peak values of KAM in a short period of time [10,11]. Because it is very difficult to directly measure TF contact forces, KAM has often been used for predicting total TF force and has been considered as a proxy for medial TF contact force [9,16,19]. From literature, it is not clear whether KAM should be used as a surrogate measure for total TF force or medial TF contact force. Higher KAM is related to radiographic structure changes at knee joints and cartilage degeneration [1,20]. Some research work also has suggested that the knee flexion moment (KFM) also plays an important role in knee loading and that it should also be taken into account [14,21]. Richards et al. [14] suggested that the combination of KAM and KFM yields an improved surrogate measure for TF contact force than KAM alone; however, it improved only the first peak values not the second peak values of knee contact force during the stance phase. While FPA gait modification showed that the first peak KAM is reduced, it remains unclear whether these treatments subsequently increased the peak KFM and TF contact force. Previous studies showed that the reduced peak KFM also carries the risk of causing quadricep weakness, which might be associated with developing knee osteoarthritis (OA) [7,21]. Increasing quadricep strength could improve functional outcomes and could alleviate pain in patients with OA [22]. However, it is still unclear whether an increase in KFM is related to quadriceps strength and whether it would increase the KAM and/or the TF contact force, which further affects the progression of OA [20]. On the other hand, modified gait patterns will involve changes at more than one body segment and one joint. Positive benefits at the TF joint might be linked with negative impact on other joints concurrently [11]. Furthermore, muscle coordination also plays a key role in contributing TF contact force [23,24,25,26]. Miller et al. [27] conducted only computer simulations to predict contact forces by gait modification; they reported that gait modification can reduce the peak KAM from normal walking. From the literature review, it was found that there was little information on the study of Chinese subjects through gait modifications, especially lacking analysis by using musculoskeletal modelling. To address the above issues, quantitatively comparing differences in lower-extremity kinematics, dynamics, and electromyography caused by FPA gait modification is important and will be conducted herein.
Therefore, the first objective of this paper was to study the effects of toe-in and toe-out gaits through experimental measurement and computer modelling at normal walking speeds on lower-extremity joint angles, GRF, electromyography (EMG) of muscles crossing the knee joint, lower-extremity joint moment, and TF contact force during level walking. The second objective was to evaluate whether KAM can be used as a surrogate measure for medial or total TF contact force.
2. Methods
2.1. Experimental Data
Twelve healthy participants (6 males and 6 females) were recruited in this study; the mean values of the participants are as follows: age 24.3 ± 2.12 years old, weight 57.6 ± 11.58 kg, height 1.7 ± 0.07 m, and BMI 19.8 ± 2.67 kg/m2. All participants have no history of lower-extremity injury that required surgery and no joint instability phenomenon within the previous six months. The study was approved by the University Research Ethics Committee, Taiyuan University of Technology, and all participants agreed to and signed consent forms for the study.
Three-dimensional body motion was recorded by using the 10-camera Vicon system and 16 light-reflecting skin markers of 14-mm diameter, with a sampling frequency of 100 Hz. The Vicon Plug-in Gait markers were attached at anatomical landmarks of the lower extremity; upper limb kinematic data were not collected. Detailed information on the markers and the surface EMG locations are shown in Figure 1a; the locations of the markers were selected based on the anatomical skeleton landmarks with the help of an orthopedist. Prior to attaching the markers, anthropometric measurements (leg length, knee width, and ankle width) were taken for scaling and establishing the lower-extremity model in the Vicon system. After attaching surface markers, EMG data of nine muscles (rectus femoris, vastus medialis, vastus lateralis, peroneus longus, tibialis anterior, semitendinosus, biceps femoris, gastrocnemius medialis, and gastrocnemius laterialis) surrounding the right knee were sampled at 1500 Hz using surface electrodes to qualitatively compare muscle activations that are directly related to muscle forces [28,29]. EMG electrode locations of the muscles were identified from the muscle belly or muscle orientation; participants were asked to make specified postures and to touch the muscles by hand. Prior to application of electrodes, selected sites were shaven, abraded, and cleaned with alcohol based on published guidelines [30]. GRF data were collected synchronously at 1500 Hz using three AMTI force plates embedded in the laboratory floor during the gait trials and a metronome-controlled frequency of approximately 1.58 Hz (95 steps/min), which was chosen after measuring subjects’ walking speed. Three gait patterns including natural, toe-in, and toe-out were selected and measured to understand their influence on lower-extremity joint kinematics, dynamics, and muscle forces [9,10,31]. To control the FPA of participants, prior to collecting each gait pattern data, the participants were asked to adapt their FPA to the required angles for the toe-in and toe-out gait patterns, which are shown Figure 2; the FPA were marked on the floor with white tapes. Five trials were conducted for each gait pattern. The study hypothesized that the FPAs of the five trials for each gait were consistent and would not affect the validity of the results.
2.2. Musculoskeletal Model
An adapted model was developed in OpenSim 3.3 to analyze the joint inverse dynamics (ID) and TF contact force of the lower extremity based on the generic musculoskeletal model Gait2354_Simbody (Figure 1b). The model consists of pelvis, left and right thigh, shank, and foot. The lower extremity—a five degrees-of-freedom (DOF) hip—was modelled as a ball-and-socket joint (3 DOFs), and the knee and ankle were modeled as revolute joints, with one DOF. In order to obtain the knee abduction/adduction moment, the right knee was assigned an additional one DOF in the frontal plane. All DOFs were free to move, except for knee adduction/abduction, which was locked during the inverse kinematics (IK) solution. However, knee adduction/abduction DOF was permitted when using the ID tool. After scaling the generic model based on the static trial and anthropometric measurements, a sequence of calculations including IK, ID, static optimization (SO), and JRF analysis was performed to estimate joint moment and TF contact forces. IK calculated model joint angles that best match the experimental motion data. Obtaining high-accuracy results from IK was essential for using ID, SO, and JRF analysis tools. ID determined the net forces and torques at each joint responsible for a given movement and GRF. SO predicted muscle forces based on the objective function, which is the minimization of the sum of squared muscle activations [32]. OpenSim’s JRF analysis was used to compute joint reaction forces using the SO results as inputs, following the previous study [33].
2.3. Data Analysis
The experimental results (joint angle, GRF, and EMG signal) and modelling results (joint moment and TF joint contact force) were analyzed. The dynamic Plug-in Gait model in the Vicon system was used to generate required joint angles. Data processing for the recorded markers, EMGs, and GRFs were based on previous study [34]. Raw marker data and GRFs were stored in .C3D file formats; they need to be converted to OpenSim file formats (.trc and .mot files) by a Matlab programme with zero-lag second-order low pass Butterworth filter at the cutoff frequencies of 6 Hz and 8 Hz respectively. Considering the delay of 312 ms, preprocessed EMGs of each muscle were normalized to the peak values, which were obtained from a series of gait trials and exported to .mot files. The processed marker trajectories and GRFs were imported into OpenSim software to compute joint moments and JRF of the TF joint using ID, OS, and JRF analysis sequentially. The compressive TF contact force was computed as a component of the resultant force acting on the tibia and parallel to the long axis of the tibia [17]. A complete gait cycle (from the right heel strike to the next right heel strike) of three gait patterns (natural, toe-in, and toe-out) was analyzed to obtain lower limb joint angle, muscle EMG, joint moment, TF, and JRF. The stance phase (right heel strike to right toe off) was analyzed to produce the GRF curves.
One-way repeated measures of ANOVA were performed for maximum joint angles, GRFs, JRFs, and joint moment to detect statistically significant differences among the gait patterns; Tukey’s test was used to determine statistically significant difference between the gaits. Variables with statistically significant differences are denoted by * or # in the paper. The alpha level was set to 0.05; all statistical analysis was carried out using OriginPro 9. Maximum joint angles, GRFs, JRFs, and joint moment were presented in tables as mean ± SD (standard deviation) of the 12 participants with 5 trials of each gait pattern. However, mean ± SD of peak EMG/activation of 5 trials for each muscle of an individual participant were presented in Appendix A due to large differences among 12 participants.
3. Results
3.1. Joint Angles
The lower-extremity joint angles during the gait cycle of the three gait patterns are presented in Figure 3, and statistical analysis of maximum values are listed in Table 1. The results in Figure 3 and the following figures will be qualitatively described. Three gait patterns showed similar trends for joint angles in the sagittal plane (hip flexion, knee flexion, and ankle plantarflexion). Compared to the natural gait, a post hoc test revealed that the toe-in and toe-out gaits decreased the max angle of knee flexion by 8.8 and 12.18 degrees respectively (p < 0.05) and the max angle of hip adduction by 1.28 and 0.99 degrees respectively (p < 0.05). The toe-in gait reduced the max angle of hip abduction by 2.19 degrees (p < 0.05), while the toe-out gait increased it by 2.34 degrees (p < 0.05). The toe-out gait reduced the hip adduction angles and ankle adduction angles (stance phase cycle) in the frontal plane. The toe-in gait pattern increased hip adduction angles during the early stance and swing phases; however, the ankle adduction angles were decreased during the stance phase. Change of angles in the transverse plane (hip rotation and ankle rotation) was directly linked to the angle differences caused by the FPA gait modifications. More information on the joint angle changes are shown in Figure 3 and Table 1.
3.2. Ground Reaction Force
The mean measured GRFs of 12 participants with 5 trials of the natural, toe-in, and toe-out gait patterns during the stance phase are presented in Figure 4, and statistical analysis of maximum and peak values are listed in Table 2. The second peak force in the Medial-Lateral (ML) direction was statistical significantly different among the three gait patterns (p = 0.04). Tukey’s test did not reveal significant differences between the natural gait and the toe-in gait. However, the toe-out increased the second peak value in the ML direction by 20% compared to the natural gait. GRF differences caused by the toe-in and toe-out gait patterns in the Anterior-Posterior (AP) and vertical directions were not significant.
3.3. Electromyography
The measured muscle activations of each participant with three gait conditions are shown in Appendix A. The results showed that each muscle of the same participant has similar EMG trends among the three gaits but that the trends are different from other participants (Figure A1, Figure A2, Figure A3, Figure A4, Figure A5, Figure A6, Figure A7, Figure A8, Figure A9, Figure A10, Figure A11 and Figure A12). In order to compare EMG/activation of each muscles caused by FPA modifications, EMG data that satisfy the following criteria were presented: when SD of muscle EMG data of the natural gait is less than 0.1 and when SD of muscle EMG of both modified gaits is less than 0.1 (Table A1, Table A2, Table A3, Table A4, Table A5, Table A6, Table A7, Table A8, Table A9, Table A10, Table A11 and Table A12). Total number of trials of each muscle’s EMG satisfying the criteria is named as number of significant EMG data. Frequencies of increase or decrease of activation time of each muscle over number of significant EMG data are presented in Table 3. In most cases, the toe-in and toe-out gaits resulted in higher values for quadriceps (rectus femoris, vastus medialis, and vastus lateralis) and peroneus longus while reduced peak values for biceps femoris and gastrocnemius lateralis. Toe-in and toe-out gaits showed opposite effects on tibialis anterior, semitendinosus, and gastrocnemius medialis.
3.4. Joint Moment
The joint moment results calculated with inverse dynamics tool in OpenSim are presented in Figure 5, and statistical analysis results are listed in Table 4. Although the results showed that differences among hip joint moments (flexion, adduction, and rotation moment) and knee flexion moment were not statistically significant (p > 0.05), differences in knee adduction moment and ankle plantarflexion moment were statistically significant (p < 0.05). Compared to the natural gait, Tukey’s test revealed that the first peak of KAM was reduced by 11.7% in the toe-in gait but that the toe-out gait showed an increase of the first peak by 0.8%. The second peak of KAM was reduced by 5.7% in the toe-out gait. Compared to the natural gait, the toe-in gait and the toe-out gaits decreased the ankle joint plantarflexion moment by 3.7% and 1.7% respectively (p = 0.04).
3.5. Tibiofemoral Contact Force
The JRFs extracted from the musculoskeletal model are shown in Figure 6, and statistical analysis of peak values are listed in Table 5. The differences of JRFs caused by the FPA modification were not statistically significant based on the p-values (p > 0.05). In other words, the TF joint contact forces were not changed by the toe-in and toe-out gaits.
4. Discussion
This study used the experimental measurements and musculoskeletal modeling to study and compare the effects of toe-in and toe-out gaits at normal walking speeds on the lower-extremity kinematics, dynamics, and EMGs. The results showed that the toe-in and toe-out gaits indeed influenced these values, especially on the joint moments and EMGs. This study also showed that the peak value of JRFs does not decrease with reducing peak KAM, which is consistent with previous research findings [35].
Gait modification changed moments and angle of joints; for example, the toe-in gait changed joint rotation angles at the ankle and hip joints, as shown in Table 1, and knee adduction moments at knee joint, as shown in Figure 5. The obtained joint angles and joint moments during the natural gait are slightly different from those reported by Hamner et al. [25], who used the IK and residual reduction algorithm (RRA) tool to calculate joint angles during a running gait. Both the toe-in and toe-out gaits have no statistically significant effects on reducing the peak values of GRFs in the three directions except for the second peak ML force in the toe-out gait, as shown in Table 2.
EMG is used to detect and assess muscle coordination and activation levels; EMG signal across different gaits may be able to provide insight into muscular force production and function of individual muscles during movement. The use of EMG has been controversial because of considerable variations between subjects; however, it still has reference value in individual cases where a baseline has been established. The EMG profiles recorded for the knee-crossing muscles revealed there were differences in EMG activations among the three gait patterns. As shown in Table 3, the toe-in and toe-out gaits resulted in higher values for quadriceps and peroneus longus; however, they reduced EMG values for biceps femoris and gastrocnemius lateralis. The toe-in and toe-out gaits resulted in the opposite effect on the activations of tibialis anterior, semitendinosus, and gastrocnemius medialis.
Many studies suggested that an elevated KAM value represents an elevated TF contact force or medial TF contact force, which has been considered as one of the important contributors to knee osteoarthritis [36,37,38]. The toe-out gait increased the first peak KAM and decreased the second peak KAM, as shown in Table 4, which is consistent with the existing literature [9]. The second peak value of the KAM, as shown in Figure 5, is higher than the first peak which is inconsistent with those in the literature during the natural and toe-in gaits. It might be due to variations in the placement of markers and because healthy individuals were measured in this paper while other studies measured subjects with OA or TKA [14,17,35]. However, the results in Figure 4 and Figure 6 showed that the toe-in and toe-out gaits had little effects on the GRFs and TF joint contact forces (p > 0.05) but that it has significant influence on the KAM and KFM during the stance phase (p < 0.05), as shown in Figure 5. The toe-in and toe-out gaits, on the one hand, are able to relieve pain by laterally changing the center of contact location [31,39,40]. On the other hand, a shift in the bilateral contact point locations caused by the gait patterns also has a direct effect on the lower limb joint moment and redistribution of TF contact forces [41]. Based on the results of significant changes in KAM, KAM or a combination of KAM and KFM can be used as surrogate measures for TF medial contact force but not total contact force.
Although very good outcomes were obtained in this paper, there are a number of shortcomings that should be addressed in future studies. First, participants only walking at a single speed were studied; previous work showed that peak value of KAM is positively related to walking speed [16,17]. Therefore, the results may not be applicable to the healthy or knee OA population, especially to people with knee arthroplasty. Second, the musculoskeletal model used in OpenSim was scaled using weight of the subject and 16 markers. The simulation of the joint moments and knee JRFs could be improved by using more markers. Third, the musculoskeletal model does not include ligament and soft tissues, which also are associated with TF contact forces directly. Finally, the difference in lower-limb kinematics, dynamics, and EMG caused by FPA gait modification were compared in this paper but long-term effects were not assessed. Further work is needed to address these limitations, the TF contact force may alter over time [14].
The results presented in the paper were based on an exploratory study with a relatively small sample size; however, FPA modification results might be used by physiotherapists to help OA patients to relieve pain and could provide loading information for engineers when they design knee replacement implants for patients who may have toe-in or toe-out gaits. It seems more reasonable to assume that toe-in and toe-out gaits could relieve patient pain by redistributing TF contact forces of medial and lateral condylar due to the change of lateral contact center and the shift of bilateral contact points. When exploring new conservative treatment methods of OA in the future, it might be more reasonable to study the joint contact forces, contact locations, and contact areas in addition to TF joint KAM and KFM.
5. Conclusions
The paper found that the effects of the toe-in and toe-out gaits on lower-extremity joint angles and joint moment are statistically significant at normal walking speed. The results showed that the toe-in and toe-out gaits reduced the maximum angle of knee flexion by 8.8 and 12.18 degrees respectively (p < 0.05) and the maximum angle of hip adduction by 1.28 and 0.99 degrees respectively (p < 0.05) with reference to the natural gait. The toe-in and toe-out gaits caused opposite effects on the first peak KAM during the early stance. EMG results showed large differences in trend and magnitude of each muscle among the participants; however, the same participant showed similar trends of each muscle. In most cases, the toe-in and toe-out gaits resulted in higher values for quadriceps (rectus femoris, vastus medialis, and vastus lateralis) and peroneus longus, while they reduced peak values of biceps femoris and gastrocnemius lateralis. The differences of TF contact forces caused by FPA gait modification were not statistically significant, while the effects on KAM and KFM were significant. The results supported that KAM or a combination of KAM and KFM can be used as surrogate measures for TF medial contact force.
Author Contributions
Conceptualization, W.C. (Weiling Cui); data curation, W.C. (Weiling Cui), W.D. and C.W. (Chenyan Wang); formal analysis, W.C. (Weiling Cui); funding acquisition, C.W. (Changjiang Wang) and W.C. (Weiyi Chen); investigation, W.C. (Weiling Cui); methodology, W.C. (Weiling Cui); project administration, W.C. (Weiling Cui); resources, W.C. (Weiyi Chen), Y.G., and Y.J.; software, W.C. (Weiling Cui); supervision, W.C. (Weiyi Chen); validation, W.C. (Weiling Cui); visualization, W.C. (Weiling Cui); writing—original draft, W.C. (Weiling Cui); writing—review and editing, W.C. (Weiling Cui) and C.W. (Changjiang Wang).
Funding
The work was supported by the National Natural Science Foundation of China under grant numbers 11772214 and 11972243.
Conflicts of Interest
The authors declare no conflict of interest.
Appendix A
Electromyography of 12 Participants
Figure A1.
Peak EMGs/activations of nine muscles for subject 1.


Table A1.
Peak EMGs/activations of nine muscles for subject 1.
| Muscles | Normal | Toe-In | Toe-Out | |||
|---|---|---|---|---|---|---|
| Mean | SD | Mean | SD | Mean | SD | |
| Rectus femoris | 0.12 | < 0.01 | 0.14 | 0.01 | 0.56 | 0.23 |
| Vastus medialis | 0.59 | 0.01 | 0.55 | < 0.01 | 0.70 | 0.13 |
| Vastus laterals | 0.51 | 0.08 | 0.50 | 0.13 | 0.71 | 0.07 |
| Peroneus longus | 0.64 | 0.19 | 0.59 | 0.18 | 0.53 | 0.11 |
| Tibialis anterior | 0.42 | 0.08 | 0.57 | 0.11 | 0.44 | 0.14 |
| Semitendinosus | 0.32 | 0.07 | 0.60 | 0.23 | 0.19 | 0.06 |
| Biceps femoris | 0.20 | 0.01 | 0.21 | 0.03 | 0.20 | 0.15 |
| Gastrocnemius medialis | 0.47 | 0.07 | 0.58 | 0.16 | 0.45 | 0.07 |
| Gastrocnemius lateralis | 0.38 | 0.04 | 0.68 | 0.22 | 0.19 | 0.03 |
Figure A2.
Peak EMGs/activations of nine muscles for subject 2.

Table A2.
Peak EMGs/activations of nine muscles for subject 2.
| Muscles | Normal | Toe-In | Toe-Out | |||
|---|---|---|---|---|---|---|
| Mean | SD | Mean | SD | Mean | SD | |
| Rectus femoris | 0.31 | 0.04 | 0.30 | 0.04 | 0.30 | 0.28 |
| Vastus medialis | 0.68 | 0.21 | 0.61 | 0.03 | 0.57 | 0.14 |
| Vastus laterals | 0.52 | 0.12 | 0.49 | 0.08 | 0.57 | 0.13 |
| Peroneus longus | 0.55 | 0.11 | 0.55 | 0.08 | 0.46 | 0.09 |
| Tibialis anterior | 0.39 | 0.08 | 0.33 | 0.04 | 0.37 | 0.06 |
| Semitendinosus | 0.50 | 0.19 | 0.50 | 0.07 | 0.59 | 0.08 |
| Biceps femoris | 0.45 | 0.06 | 0.39 | 0.19 | 0.53 | 0.08 |
| Gastrocnemius medialis | 0.36 | 0.09 | 0.25 | 0.07 | 0.40 | 0.19 |
| Gastrocnemius lateralis | 0.69 | 0.09 | 0.57 | 0.16 | 0.64 | 0.14 |
Figure A3.
Peak EMGs/activations of nine muscles for subject 3.

Table A3.
Peak EMGs/activations of nine muscles for subject 3.
| Muscles | Normal | Toe-In | Toe-Out | |||
|---|---|---|---|---|---|---|
| Mean | SD | Mean | SD | Mean | SD | |
| Rectus femoris | 0.41 | 0.03 | 0.26 | 0.03 | 0.56 | 0.08 |
| Vastus medialis | 0.57 | 0.19 | 0.40 | 0.20 | 0.46 | 0.06 |
| Vastus laterals | 0.64 | 0.28 | 0.73 | 0.16 | 0.82 | 0.06 |
| Peroneus longus | 0.72 | 0.14 | 0.69 | 0.11 | 0.69 | 0.08 |
| Tibialis anterior | 0.49 | 0.09 | 0.43 | 0.14 | 0.56 | 0.22 |
| Semitendinosus | 0.47 | 0.11 | 0.52 | 0.21 | 0.36 | 0.08 |
| Biceps femoris | 0.32 | 0.05 | 0.26 | 0.10 | 0.48 | 0.16 |
| Gastrocnemius medialis | 0.54 | 0.17 | 0.37 | 0.14 | 0.49 | 0.20 |
| Gastrocnemius lateralis | 0.28 | 0.16 | 0.52 | 0.23 | 0.20 | 0.05 |
Figure A4.
Peak EMGs/activations of nine muscles for subject 4.

Table A4.
Peak EMGs/activations of nine muscles for subject 4.
| Muscles | Normal | Toe-In | Toe-Out | |||
|---|---|---|---|---|---|---|
| Mean | SD | Mean | SD | Mean | SD | |
| Rectus femoris | 0.29 | 0.02 | 0.41 | 0.03 | 0.37 | 0.06 |
| Vastus medialis | 0.51 | 0.09 | 0.67 | 0.12 | 0.50 | 0.12 |
| Vastus laterals | 0.60 | 0.15 | 0.76 | 0.08 | 0.70 | 0.17 |
| Peroneus longus | 0.81 | 0.03 | 0.84 | 0.04 | 0.90 | 0.03 |
| Tibialis anterior | 0.65 | 0.15 | 0.75 | 0.14 | 0.53 | 0.13 |
| Semitendinosus | 0.55 | 0.14 | 0.38 | 0.06 | 0.37 | 0.07 |
| Biceps femoris | 0.52 | 0.21 | 0.54 | 0.03 | 0.54 | 0.25 |
| Gastrocnemius medialis | 0.76 | 0.06 | 0.73 | 0.06 | 0.75 | 0.09 |
| Gastrocnemius lateralis | 0.26 | 0.02 | 0.46 | 0.10 | 0.25 | 0.11 |
Figure A5.
Peak EMGs/activations of nine muscles for subject 5.

Table A5.
Peak EMGs/activations of nine muscles for subject 5.
| Muscles | Normal | Toe-In | Toe-Out | |||
|---|---|---|---|---|---|---|
| Mean | SD | Mean | SD | Mean | SD | |
| Rectus femoris | 0.39 | 0.24 | 0.36 | 0.11 | 0.43 | 0.33 |
| Vastus medialis | 0.47 | 0.07 | 0.47 | 0.13 | 0.47 | 0.07 |
| Vastus laterals | 0.58 | 0.19 | 0.56 | 0.17 | 0.64 | 0.15 |
| Peroneus longus | 0.41 | 0.10 | 0.43 | 0.06 | 0.36 | 0.13 |
| Tibialis anterior | 0.44 | 0.11 | 0.50 | 0.14 | 0.77 | 0.21 |
| Semitendinosus | 0.76 | 0.12 | 0.77 | 0.19 | 0.45 | 0.07 |
| Biceps femoris | 0.46 | 0.10 | 0.47 | 0.21 | 0.46 | 0.22 |
| Gastrocnemius medialis | 0.69 | 0.15 | 0.71 | 0.18 | 0.56 | 0.11 |
| Gastrocnemius lateralis | 0.30 | 0.06 | 0.53 | 0.19 | 0.30 | 0.03 |
Figure A6.
Peak EMGs/activations of nine muscles for subject 6.

Table A6.
Peak EMGs/activations of nine muscles for subject 6.
| Muscles | Normal | Toe-In | Toe-Out | |||
|---|---|---|---|---|---|---|
| Mean | SD | Mean | SD | Mean | SD | |
| Rectus femoris | 0.71 | 0.19 | 0.57 | 0.25 | 0.65 | 0.06 |
| Vastus medialis | 0.63 | 0.03 | 0.47 | 0.29 | 0.59 | 0.12 |
| Vastus laterals | 0.66 | 0.11 | 0.58 | 0.19 | 0.79 | 0.05 |
| Peroneus longus | 0.30 | 0.08 | 0.41 | 0.23 | 0.38 | 0.13 |
| Tibialis anterior | 0.43 | 0.11 | 0.50 | 0.23 | 0.44 | 0.09 |
| Semitendinosus | 0.54 | 0.08 | 0.42 | 0.16 | 0.41 | 0.08 |
| Biceps femoris | 0.58 | 0.06 | 0.51 | 0.25 | 0.56 | 0.14 |
| Gastrocnemius medialis | 0.35 | 0.12 | 0.35 | 0.04 | 0.36 | 0.17 |
| Gastrocnemius lateralis | 0.37 | 0.15 | 0.38 | 0.08 | 0.33 | 0.06 |
Figure A7.
Peak EMGs/activations of nine muscles for subject 7.

Table A7.
Peak EMGs/activations of nine muscles for subject 7.
| Muscles | Normal | Toe-In | Toe-Out | |||
|---|---|---|---|---|---|---|
| Mean | SD | Mean | SD | Mean | SD | |
| Rectus femoris | 0.65 | 0.03 | 0.65 | 0.09 | 0.61 | 0.21 |
| Vastus medialis | 0.27 | 0.07 | 0.43 | 0.03 | 0.33 | 0.08 |
| Vastus laterals | 0.50 | 0.04 | 0.65 | 0.05 | 0.56 | 0.17 |
| Peroneus longus | 0.47 | 0.07 | 0.67 | 0.15 | 0.53 | 0.05 |
| Tibialis anterior | 0.43 | 0.08 | 0.50 | 0.07 | 0.39 | 0.05 |
| Semitendinosus | 0.68 | 0.02 | 0.71 | 0.04 | 0.68 | 0.02 |
| Biceps femoris | 0.90 | 0.01 | 0.88 | 0.02 | 0.83 | 0.01 |
| Gastrocnemius medialis | 0.53 | 0.11 | 0.58 | 0.10 | 0.60 | 0.19 |
| Gastrocnemius lateralis | 0.47 | 0.05 | 0.71 | 0.13 | 0.47 | 0.04 |
Figure A8.
Peak EMGs/activations of nine muscles for subject 8.

Table A8.
Peak EMGs/activations of nine muscles for subject 8.
| Muscles | Normal | Toe-In | Toe-Out | |||
|---|---|---|---|---|---|---|
| Mean | SD | Mean | SD | Mean | SD | |
| Rectus femoris | 0.39 | 0.08 | 0.50 | 0.05 | 0.78 | 0.13 |
| Vastus medialis | 0.82 | 0.05 | 0.67 | 0.17 | 0.83 | 0.05 |
| Vastus laterals | 0.77 | 0.09 | 0.75 | 0.04 | 0.86 | 0.04 |
| Peroneus longus | 0.08 | 0.01 | 0.22 | 0.39 | 0.07 | <0.01 |
| Tibialis anterior | 0.51 | 0.13 | 0.58 | 0.13 | 0.58 | 0.10 |
| Semitendinosus | 0.43 | 0.15 | 0.55 | 0.11 | 0.75 | 0.03 |
| Biceps femoris | 0.34 | 0.10 | 0.47 | 0.07 | 0.28 | 0.09 |
| Gastrocnemius medialis | 0.53 | 0.14 | 0.55 | 0.2 | 0.61 | 0.17 |
| Gastrocnemius lateralis | 0.48 | 0.2 | 0.72 | 0.29 | 0.54 | 0.07 |
Figure A9.
Peak EMGs/activations of nine muscles for subject 9.

Table A9.
Peak EMGs/activations of nine muscles for subject 9.
| Muscles | Normal | Toe-In | Toe-Out | |||
|---|---|---|---|---|---|---|
| Mean | SD | Mean | SD | Mean | SD | |
| Rectus femoris | 0.57 | 0.03 | 0.40 | 0.13 | 0.62 | 0.29 |
| Vastus medialis | 0.76 | 0.21 | 0.69 | 0.10 | 0.77 | 0.16 |
| Vastus laterals | 0.47 | 0.12 | 0.53 | 0.07 | 0.64 | 0.22 |
| Peroneus longus | 0.68 | 0.21 | 0.40 | 0.12 | 0.42 | 0.09 |
| Tibialis anterior | 0.61 | 0.06 | 0.44 | 0.14 | 0.53 | 0.19 |
| Semitendinosus | 0.63 | 0.10 | 0.75 | 0.15 | 0.31 | 0.04 |
| Biceps femoris | 0.79 | 0.16 | 0.70 | 0.21 | 0.37 | 0.06 |
| Gastrocnemius medialis | 0.52 | 0.11 | 0.59 | 0.22 | 0.40 | 0.12 |
| Gastrocnemius lateralis | 0.47 | 0.13 | 0.55 | 0.11 | 0.37 | 0.09 |
Figure A10.
Peak EMGs/activations of nine muscles for subject 10.

Table A10.
Peak EMGs/activations of nine muscles for subject 10.
| Muscles | Normal | Toe-In | Toe-Out | |||
|---|---|---|---|---|---|---|
| Mean | SD | Mean | SD | Mean | SD | |
| Rectus femoris | 0.31 | 0.11 | 0.37 | 0.11 | 0.48 | 0.14 |
| Vastus medialis | 0.47 | 0.13 | 0.54 | 0.12 | 0.51 | 0.18 |
| Vastus laterals | 0.62 | 0.02 | 0.73 | 0.16 | 0.87 | 0.07 |
| Peroneus longus | 0.37 | 0.17 | 0.49 | 0.16 | 0.44 | 0.14 |
| Tibialis anterior | 0.28 | 0.11 | 0.30 | 0.06 | 0.41 | 0.07 |
| Semitendinosus | 0.58 | 0.21 | 0.55 | 0.10 | 0.26 | 0.09 |
| Biceps femoris | 0.30 | 0.07 | 0.45 | 0.02 | 0.29 | <0.01 |
| Gastrocnemius medialis | 0.28 | 0.12 | 0.27 | 0.12 | 0.41 | 0.11 |
| Gastrocnemius lateralis | 0.32 | 0.11 | 0.53 | 0.09 | 0.42 | 0.05 |
Figure A11.
Peak EMGs/activations of nine muscles for subject 11.

Table A11.
Peak EMGs/activations of nine muscles for subject 11.
| Muscles | Normal | Toe-In | Toe-Out | |||
|---|---|---|---|---|---|---|
| Mean | SD | Mean | SD | Mean | SD | |
| Rectus femoris | 0.46 | 0.16 | 0.50 | 0.10 | 0.30 | 0.02 |
| Vastus medialis | 0.76 | 0.07 | 0.84 | 0.10 | 0.85 | 0.11 |
| Vastus laterals | 0.75 | 0.21 | 0.56 | 0.11 | 0.34 | 0.04 |
| Peroneus longus | 0.45 | 0.17 | 0.61 | 0.13 | 0.57 | 0.26 |
| Tibialis anterior | 0.52 | 0.06 | 0.67 | 0.16 | 0.56 | 0.19 |
| Semitendinosus | 0.76 | 0.16 | 0.60 | 0.03 | 0.59 | 0.08 |
| Biceps femoris | 0.54 | 0.11 | 0.37 | 0.07 | 0.53 | 0.08 |
| Gastrocnemius medialis | 0.43 | 0.05 | 0.44 | 0.06 | 0.47 | 0.14 |
| Gastrocnemius lateralis | 0.41 | 0.05 | 0.39 | 0.02 | 0.36 | 0.07 |
Figure A12.
Peak EMGs/activations of nine muscles for subject 12.

Table A12.
Peak EMGs/activations of nine muscles for subject 12.
| Muscles | Normal | Toe-In | Toe-Out | |||
|---|---|---|---|---|---|---|
| Mean | SD | Mean | SD | Mean | SD | |
| Rectus femoris | 0.63 | 0.02 | 0.51 | 0.04 | 0.61 | 0.12 |
| Vastus medialis | 0.66 | 0.18 | 0.59 | 0.17 | 0.59 | 0.12 |
| Vastus laterals | 0.30 | 0.27 | 0.11 | 0.02 | 0.15 | 0.02 |
| Peroneus longus | 0.44 | 0.13 | 0.62 | 0.22 | 0.48 | 0.09 |
| Tibialis anterior | 0.41 | 0.11 | 0.50 | 0.10 | 0.46 | 0.10 |
| Semitendinosus | 0.40 | 0.03 | 0.64 | 0.16 | 0.37 | 0.06 |
| Biceps femoris | 0.94 | 0.02 | 0.62 | 0.07 | 0.73 | 0.04 |
| Gastrocnemius medialis | 0.48 | 0.17 | 0.51 | 0.22 | 0.53 | 0.12 |
| Gastrocnemius lateralis | 0.46 | 0.08 | 0.56 | 0.10 | 0.40 | 0.10 |
References
- Bennell, K.L.; Bowles, K.A.; Wang, Y.; Cicuttini, F.; Davies-Tuck, M.; Hinman, R.S. Higher dynamic medial knee load predicts greater cartilage loss over 12 months in medial knee osteoarthritis. Ann. Rheum. Dis. 2011, 70, 1770–1774. [Google Scholar] [CrossRef] [PubMed]
- Øiestad, B.E.; Juhl, C.B.; Eitzen, I.; Thorlund, J.B. Knee extensor muscle weakness is a risk factor for development of knee osteoarthritis. A systematic review and meta-analysis. Osteoarthr. Cartil. 2015, 23, 171–177. [Google Scholar]
- Deshpande, B.R.; Katz, J.N.; Solomon, D.H.; Yelin, E.H.; Hunter, D.J.; Messier, S.P.; Suter, L.G.; Losina, E. Number of Persons with Symptomatic Knee Osteoarthritis in the US: Impact of Race and Ethnicity, Age, Sex, and Obesity. Arthritis Care Res. 2016, 68, 1743–1750. [Google Scholar] [CrossRef] [PubMed]
- Pollo, F.E.; Otis, J.C.; Backus, S.I.; Warren, R.F.; Wickiewicz, T.L. Reduction of medial compartment loads with valgus bracing of the osteoarthritic knee. Am. J. Sports Med. 2015, 30, 414–421. [Google Scholar] [CrossRef] [PubMed]
- Erhart-Hledik, J.C.; Elspas, B.; Giori, N.J.; Andriacchi, T.P. Effect of variable-stiffness walking shoes on knee adduction moment, pain, and function in subjects with medial compartment knee osteoarthritis after 1 year. J. Orthop. Res. 2012, 30, 514–521. [Google Scholar] [CrossRef] [PubMed]
- Kerrigan, D.C.; Lelas, J.L.; Goggins, J.; Merriman, G.J.; Kaplan, R.J.; Felson, D.T. Effectiveness of a lateral-wedge insole on knee varus torque in patients with knee osteoarthritis. Arch. Phys. Med. Rehabil. 2002, 83, 889–893. [Google Scholar] [CrossRef]
- Henriksen, M.; Graven-Nielsen, T.; Aaboe, J.; Andriacchi, T.P.; Bliddal, H. Gait changes in patients with knee osteoarthritis are replicated by experimental knee pain. Arthritis Care Res. 2010, 17, S83–S84. [Google Scholar] [CrossRef]
- Simic, M.; Hinman, R.S.; Wrigley, T.V.; Bennell, K.L.; Hunt, M.A. Gait modification strategies for altering medial knee joint load: A systematic review. Arthritis Care Res. 2011, 63, 405–426. [Google Scholar] [CrossRef]
- Hunt, M.A.; Takacs, J. Effects of a 10-week toe-out gait modification intervention in people with medial knee osteoarthritis: A pilot, feasibility study. Osteoarthr. Cartil. 2014, 22, 904–911. [Google Scholar] [CrossRef]
- Khan, S.S.; Khan, S.J.; Usman, J. Effects of toe-out and toe-in gait with varying walking speeds on knee joint mechanics and lower limb energetics. Gait Posture 2017, 53, 185–192. [Google Scholar] [CrossRef]
- Uhlrich, S.D.; Silder, A.; Beaupre, G.S.; Shull, P.B.; Delp, S.L. Subject-specific toe-in or toe-out gait modifications reduce the larger knee adduction moment peak more than a non-personalized approach. J. Biomech. 2017, 66, 103–110. [Google Scholar] [CrossRef] [PubMed]
- Mündermann, A.; Asay, J.L.; Mündermann, L.; Andriacchi, T.P. Implications of increased medio-lateral trunk sway for ambulatory mechanics. J. Biomech. 2008, 41, 165–170. [Google Scholar] [CrossRef] [PubMed]
- Shull, P.B.; Lurie, K.L.; Cutkosky, M.R.; Besier, T.F. Training multi-parameter gaits to reduce the knee adduction moment with data-driven models and haptic feedback. J. Biomech. 2011, 44, 1605–1609. [Google Scholar] [CrossRef] [PubMed]
- Richards, R.E.; Andersen, M.S.; Harlaar, J.; Van Den Noort, J.C. Relationship between knee joint contact forces and external knee joint moments in patients with medial knee osteoarthritis: Effects of gait modifications. Osteoarthr. Cartil. 2018, 26, 1203–1214. [Google Scholar] [CrossRef]
- Chang, A.; Hurwitz, D.; Dunlop, D.; Song, J.; Cahue, S.; Hayes, K.; Sharma, L. The relationship between toe-out angle during gait and progression of medial tibiofemoral osteoarthritis. Ann. Rheum. Dis. 2007, 66, 1271–1275. [Google Scholar] [CrossRef]
- Robbins, S.M.K.; Maly, M.R. The effect of gait speed on the knee adduction moment depends on waveform summary measures. Gait Posture 2009, 30, 543–546. [Google Scholar] [CrossRef]
- Lerner, Z.F.; Haight, D.J.; DeMers, M.S.; Board, W.J.; Browning, R.C. The effects of walking speed on tibiofemoral loading estimated via musculoskeletal modeling. J. Appl. Biomech. 2014, 30, 197–205. [Google Scholar] [CrossRef]
- Bennett, H.J.; Shen, G.; Cates, H.E.; Zhang, S. Effects of toe-in and toe-in with wider step width on level walking knee biomechanics in varus, valgus, and neutral knee alignments. Knee 2017, 24, 1326–1334. [Google Scholar] [CrossRef]
- Schwachmeyer, V.; Kutzner, I.; Bornschein, J.; Bender, A.; Dymke, J.; Bergmann, G. Medial and lateral foot loading and its effect on knee joint loading. Clin. Biomech. 2015, 30, 860–866. [Google Scholar] [CrossRef]
- Chehab, E.F.; Favre, J.; Erhart-Hledik, J.C.; Andriacchi, T.P. Baseline knee adduction and flexion moments during walking are both associated with 5year cartilage changes in patients with medial knee osteoarthritis. Osteoarthr. Cartil. 2014, 22, 1833–1839. [Google Scholar] [CrossRef]
- Boyer, K.A.; Angst, M.S.; Asay, J.; Giori, N.J.; Andriacchi, T.P. Sensitivity of gait parameters to the effects of anti-inflammatory and opioid treatments in knee osteoarthritis patients. J. Orthop. Res. 2012, 30, 1118–1124. [Google Scholar] [CrossRef] [PubMed]
- Amin, S.; Baker, K.; Niu, J.; Clancy, M.; Goggins, J.; Guermazi, A.; Grigoryan, M.; Hunter, D.J.; Felson, D.T. Quadriceps strength and the risk of cartilage loss and symptom progression in knee osteoarthritis. Arthritis Rheumatol. 2010, 60, 189–198. [Google Scholar] [CrossRef] [PubMed]
- Demers, M.S.; Pal, S.; Delp, S.L. Changes in tibiofemoral forces due to variations in muscle activity during walking. J. Orthop. Res. 2014, 32, 769–776. [Google Scholar] [CrossRef] [PubMed]
- Sasaki, K.; Neptune, R.R. Individual muscle contributions to the axial knee joint contact force during normal walking. J. Biomech. 2010, 43, 2780–2784. [Google Scholar] [CrossRef]
- Hamner, S.R.; Seth, A.; Delp, S.L. Muscle contributions to propulsion and support during running. J. Biomech. 2010, 43, 2709–2716. [Google Scholar] [CrossRef]
- Stevens-Lapsley, J.E.; Balter, J.E.; Kohrt, W.M.; Eckhoff, D.G. Quadriceps and hamstrings muscle dysfunction after total knee arthroplasty. Clin. Orthop. Relat. Res. 2010, 468, 2460–2468. [Google Scholar] [CrossRef]
- Miller, R.H.; Esterson, A.Y.; Shim, J.K. Joint contact forces when minimizing the external knee adduction moment by gait modification: A computer simulation study. Knee 2015, 22, 481–489. [Google Scholar] [CrossRef]
- Roberts, T.J.; Gabaldón, A.M. Interpreting muscle function from EMG: Lessons learned from direct measurements of muscle force. Integr. Comp. Biol. 2008, 48, 312–320. [Google Scholar] [CrossRef]
- Newham, D.J.; Hsiao, S.F. Knee muscle isometric strength, voluntary activation and antagonist co-contraction in the first six months after stroke. Disabil. Rehabil. 2001, 23, 379–386. [Google Scholar]
- Konrad, P. The ABC of EMG; Noraxon: Scottsdale, AZ, USA, 2005. [Google Scholar]
- Jenkyn, T.R.; Hunt, M.A.; Jones, I.C.; Giffin, J.R.; Birmingham, T.B. Toe-out gait in patients with knee osteoarthritis partially transforms external knee adduction moment into flexion moment during early stance phase of gait: A tri-planar kinetic mechanism. J. Biomech. 2008, 41, 276–283. [Google Scholar] [CrossRef]
- Anderson, F.; Guendelman, E.; Habib, A.; Hammer, S.; Holzbaur, K.; John, C.; Ku, J.; Liu, M.; Loan, P.; Reinbolt, J.; et al. OpenSim User’s Guide. 2011. Available online: https://simtk-confluence.stanford.edu:8443/display/OpenSim33/User%27s+Guide (accessed on 1 December 2019).
- Mokhtarzadeh, H.; Yeow, C.H.; Goh, J.C.H.; Oetomo, D.; Malekipour, F.; Lee, P.V.S. Contributions of the soleus and gastrocnemius muscles to the anterior cruciate ligament loading during single-leg landing. J. Biomech. 2013, 46, 1913–1920. [Google Scholar] [CrossRef] [PubMed]
- Mantoan, A.; Pizzolato, C.; Sartori, M.; Sawacha, Z.; Cobelli, C.; Reggiani, M. MOtoNMS: A MATLAB toolbox to process motion data for neuromusculoskeletal modeling and simulation. Source Code Biol. Med. 2015, 10, 12. [Google Scholar] [CrossRef] [PubMed]
- Walter, J.P.; D’Lima, D.D.; Colwell, C.W., Jr.; Fregly, B.J. Decreased knee adduction moment does not guarantee decreased medial contact force during gait. J. Orthop. Res. 2010, 28, 1348–1354. [Google Scholar] [CrossRef] [PubMed] [Green Version]
- Zhao, D.; Banks, S.A.; Mitchell, K.H.; D’Lima, D.D.; Colwell, C.W., Jr.; Fregly, B.J. Correlation between the knee adduction torque and medial contact force for a variety of gait patterns. J. Orthop. Res. 2010, 25, 789–797. [Google Scholar] [CrossRef]
- Haim, A.; Rubin, G.; Rozen, N.; Goryachev, Y.; Wolf, A.; Salai, M. Six-week gait retraining program reduces knee adduction moment, reduces pain, and improves function for individuals with medial compartment knee osteoarthritis. J. Orthop. Res. 2014, 32, 351–352. [Google Scholar] [CrossRef]
- Birmingham, T.B.; Hunt, M.A.; Jones, I.C.; Jenkyn, T.R.; Giffin, J.R. Test-retest reliability of the peak knee adduction moment during walking in patients with medial compartment knee osteoarthritis. Arthritis Care Res. 2010, 57, 1012–1017. [Google Scholar] [CrossRef]
- Simic, M.; Wrigley, T.V.; Hinman, R.S.; Hunt, M.A.; Bennell, K.L. Altering foot progression angle in people with medial knee osteoarthritis: The effects of varying toe-in and toe-out angles aremediated by pain and malalignment. Osteoarthr. Cartil. 2013, 21, 1272–1280. [Google Scholar] [CrossRef] [Green Version]
- Shull, P.B.; Shultz, R.; Silder, A.; Dragoo, J.L.; Besier, T.F.; Cutkosky, M.R.; Delp, S.L. Toe-in gait reduces the first peak knee adduction moment in patients with medial compartment knee osteoarthritis. J. Biomech. 2013, 46, 122–128. [Google Scholar] [CrossRef]
- Lerner, Z.F.; DeMers, M.S.; Delp, S.L.; Browning, R.C. How tibiofemoral alignment and contact locations affect predictions of medial and lateral tibiofemoral contact forces. J. Biomech. 2015, 48, 644–650. [Google Scholar] [CrossRef] [Green Version]
Figure 1.
(a) Surface markers (blue circle) and electromyography (EMG) electrodes (red circle) used for trials and (b) musculoskeletal model of the lower extremity.
Figure 1.
(a) Surface markers (blue circle) and electromyography (EMG) electrodes (red circle) used for trials and (b) musculoskeletal model of the lower extremity.
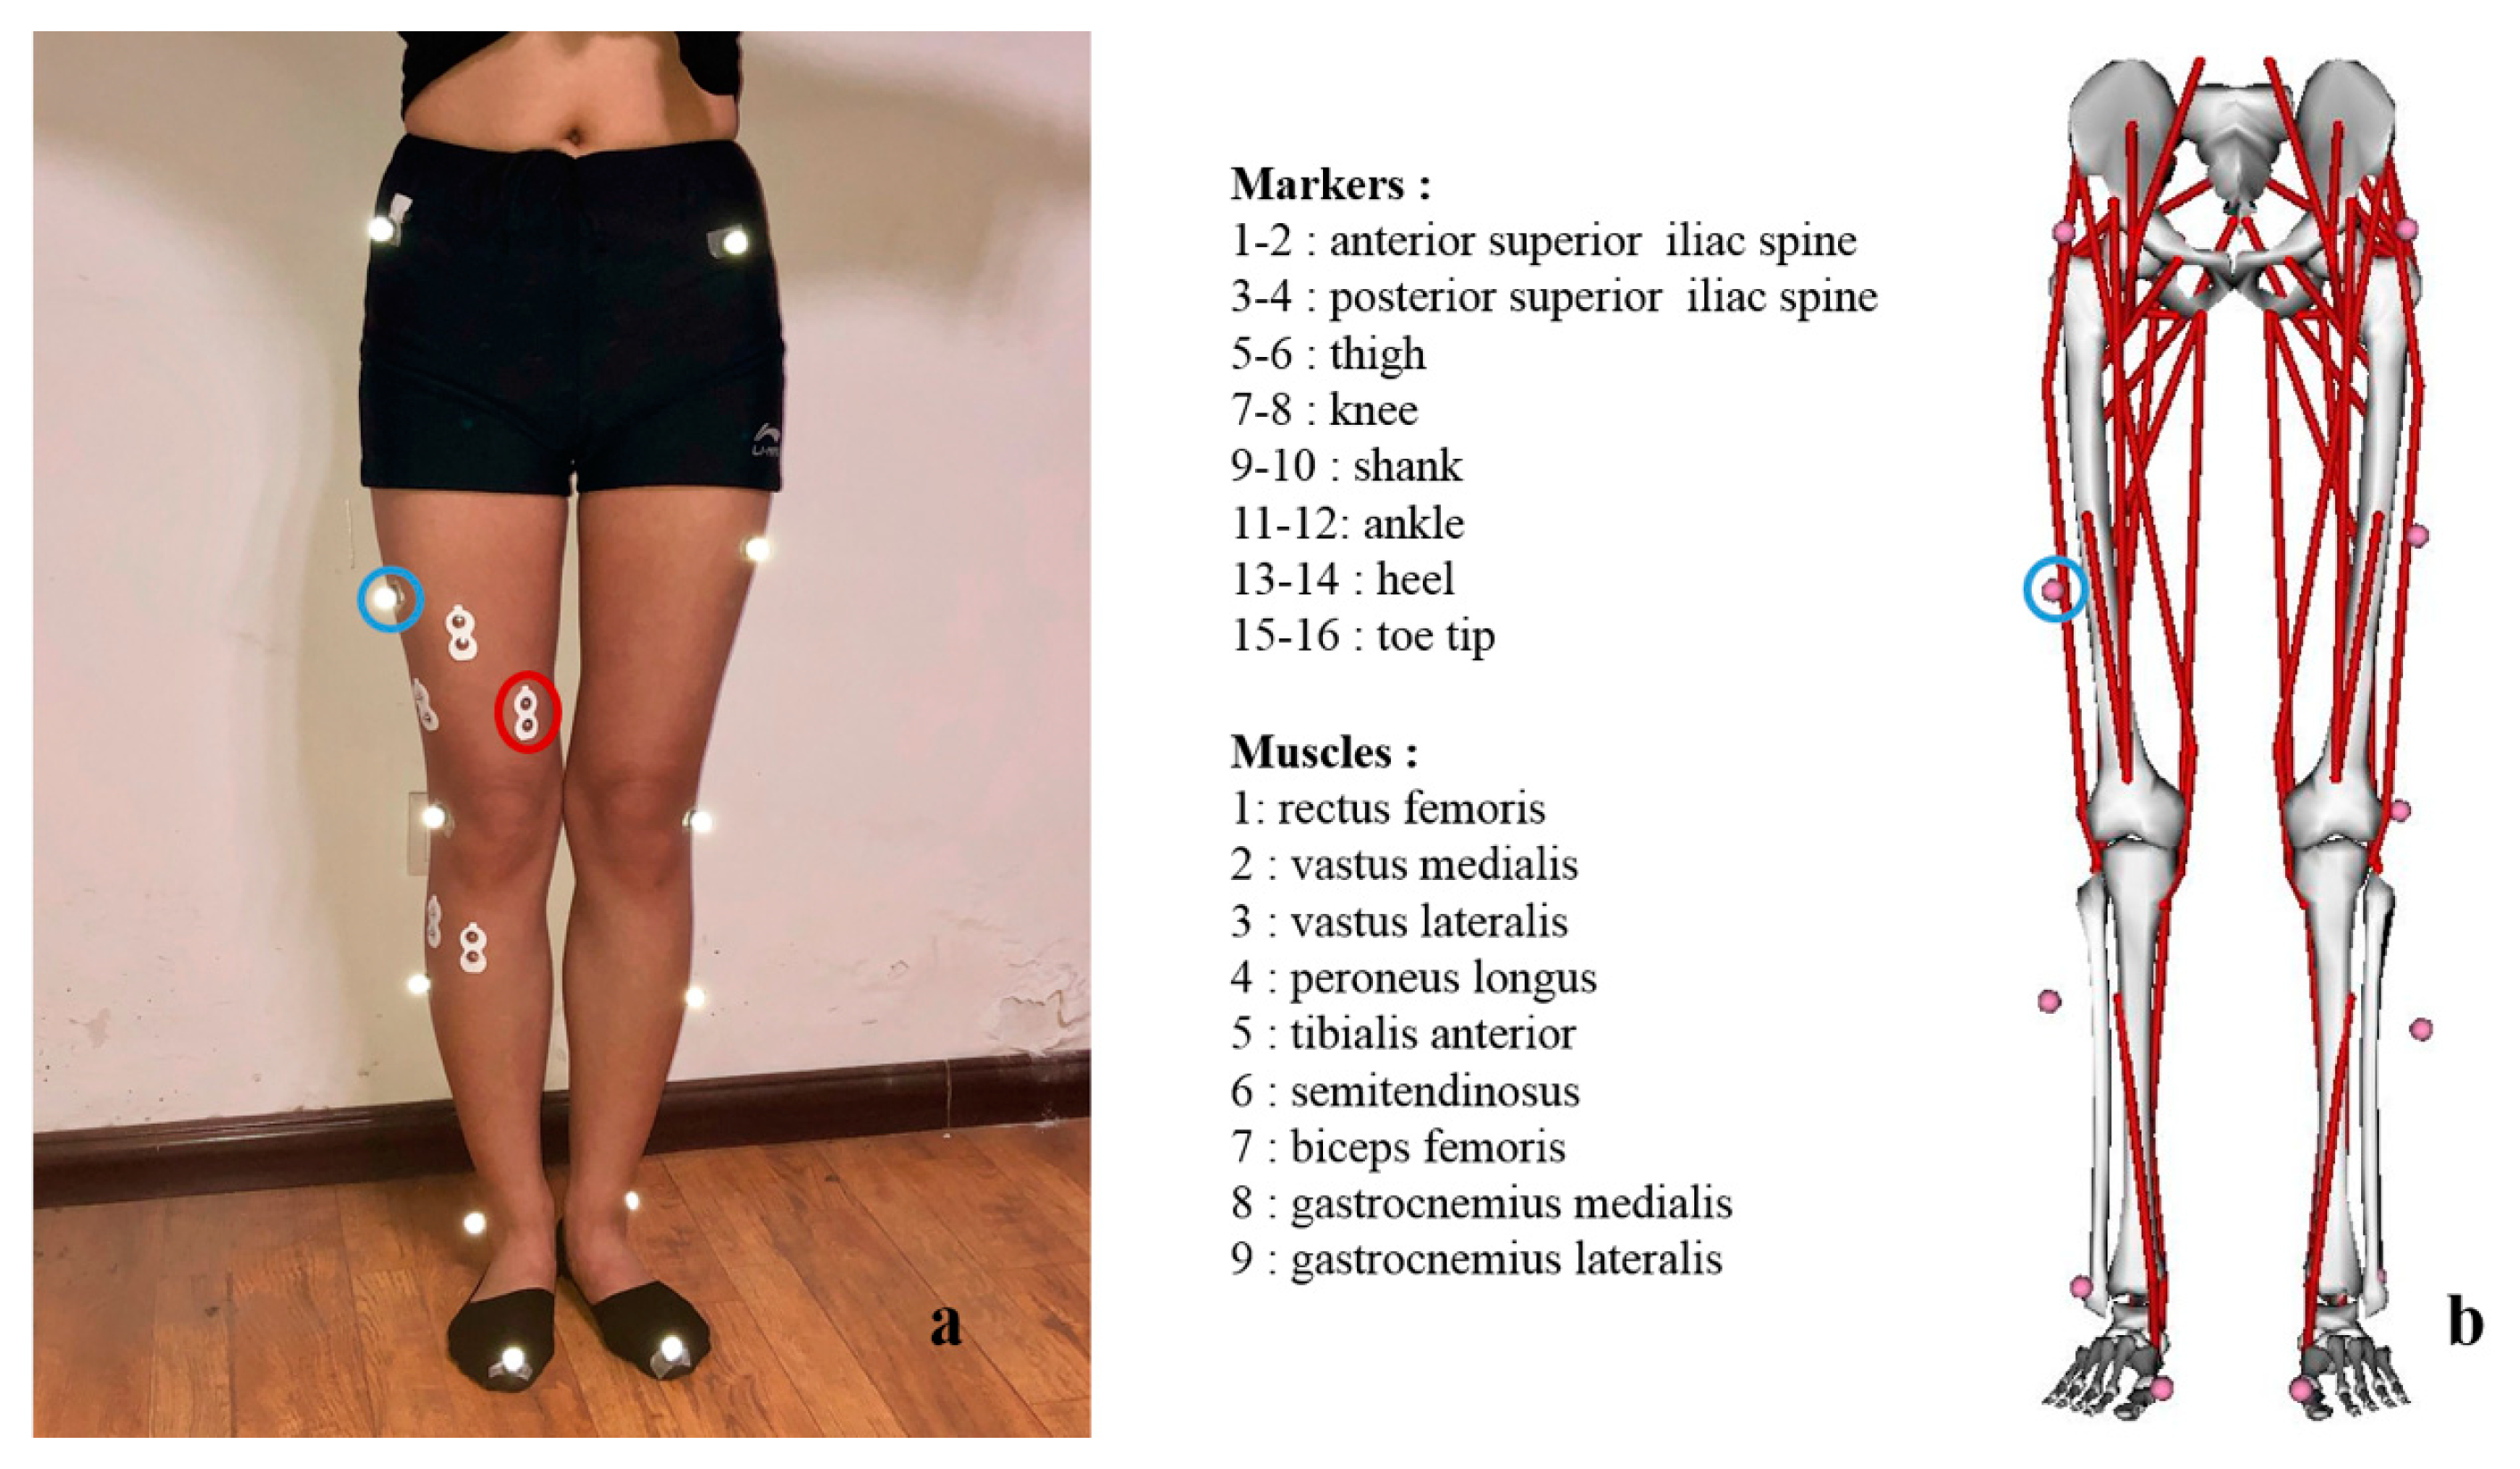
Figure 2.
Schematic diagram for foot progression angle in the toe-out and toe-in gait patterns: L represents the left foot position, R the right foot position, and the arrow represents the forward direction while walking.
Figure 2.
Schematic diagram for foot progression angle in the toe-out and toe-in gait patterns: L represents the left foot position, R the right foot position, and the arrow represents the forward direction while walking.

Figure 3.
Measured joint angles (mean and standard deviation) of a gait cycle for the natural, toe-in, and toe-out gait patterns (12 participants and 5 trials for each gait pattern).
Figure 3.
Measured joint angles (mean and standard deviation) of a gait cycle for the natural, toe-in, and toe-out gait patterns (12 participants and 5 trials for each gait pattern).

Figure 4.
Measured ground reaction forces (GRFs; mean and standard deviation) of the stance phase for the natural, toe-in, and toe-out gait patterns (12 participants and 5 trials for each gait patterns).
Figure 4.
Measured ground reaction forces (GRFs; mean and standard deviation) of the stance phase for the natural, toe-in, and toe-out gait patterns (12 participants and 5 trials for each gait patterns).

Figure 5.
Joint moments (mean and standard deviation) calculated from the musculoskeletal model for the natural, toe-in, and toe-out gait patterns (12 participants and 5 trials for each gait patterns).
Figure 5.
Joint moments (mean and standard deviation) calculated from the musculoskeletal model for the natural, toe-in, and toe-out gait patterns (12 participants and 5 trials for each gait patterns).

Figure 6.
Knee joint reaction forces (JRFs; mean and standard deviation) calculated from the musculoskeletal model for the natural, toe-in, and toe-out gait patterns (12 participants and 5 trials for each gait patterns).
Figure 6.
Knee joint reaction forces (JRFs; mean and standard deviation) calculated from the musculoskeletal model for the natural, toe-in, and toe-out gait patterns (12 participants and 5 trials for each gait patterns).

Table 1.
Max joint angles of hip, knee, and ankle joints (mean ± SD).
| Joint Angle (Degree) | Natural | Toe-In | Toe-Out | p-Value |
|---|---|---|---|---|
| Max hip flexion | 34.46 (2.94) | 36.73 (5.65) | 37.95 (4.45) | 0.13 |
| Max hip extension | 5.26 (3.63) | 4.6 (4.51) | 4.18 (4.90) | 0.21 |
| Max hip adduction | 7.17 (1.72) | 5.89 (3.35) * | 6.18 (1.71) # | 0.04 |
| Max hip abduction | 5.96 (5.25) | 3.77 (2.41) * | 8.30 (3.26) *# | 0.01 |
| Max hip internal | 2.71 (5.88) | 10.54 (4.11) * | −2.70 (4.08) *# | 0.01 |
| Max hip external | 9.67 (9.66) | −3.02 (9.95) * | 19.15 (8.50) *# | 0.03 |
| Max knee flexion | 75.60 (8.86) | 67.43 (8.83) * | 63.42 (7.84) *# | 0.03 |
| Min knee flexion | 8.95 (0.92) | 10.93 (2.27) | 9.64 (0.69) | 0.07 |
| Max ankle dorsiflexion | 19.46 (18.90) | 19.01 (17.80) | 30.71 (2.69) | 0.29 |
| Max ankle plantar | 4.42 (14.93) | 2.52 (13.47) | −10.25 (7.46) | 0.07 |
| Max ankle adduction | 38.41 (4.37) | 34.33 (5.50) | 38.28 (3.84) | 0.06 |
| Max ankle internal | 17.16 (12.78) | 22.99 (15.73) * | 7.07 (7.24) *# | 0.01 |
* Significantly different from natural gait, # significantly different from toe-in gait.
Table 2.
GRFs in three directions (mean ± SD).
| GRF (BW) | Natural | Toe-In | Toe-Out | p-Value |
|---|---|---|---|---|
| Max posterior force | 0.134 (0.02) | 0.142 (0.02) | 0.128 (0.02) | 0.23 |
| Max anterior force | 0.099 (0.02) | 0.095 (0.01) | 0.098 (0.01) | 0.42 |
| 1st peak in the SI direction | 0.97 (0.02) | 0.96 (0.04) | 0.96 (0.03) | 0.57 |
| 2nd peak in the SI direction | 0.99 (0.03) | 0.99 (0.02) | 0.99 (0.03) | 0.44 |
| 1st peak in the ML direction | 0.05 (< 0.01) | 0.05 (0.01) | 0.05 (0.01) | 0.43 |
| 2nd peak in the ML direction | 0.05 (0.05) | 0.04 (0.02) | 0.06 (0.01) # | 0.04 |
SI: supior-inferior, ML: medial-lateral, # significantly different from toe-in gait.
Table 3.
Frequency of increase or decrease of activation of each muscles/number of significant EMG data.
Table 3.
Frequency of increase or decrease of activation of each muscles/number of significant EMG data.
| Muscles | RF | VM | VL | PL | TA | ST | BF | GM | GL |
|---|---|---|---|---|---|---|---|---|---|
| Toe-in | 3/7 ↑ | 2/3 ↑ | 1/1 ↑ | 1/1 ↑ | 1/2 ↑ | 1/1 ↑ | 3/5 ↓ | 1/2 ↑ | 1/1 ↓ |
| Toe-out | 2/2 ↑ | 2/3 ↑ | 3/3 ↑ | 2/3 ↑ | 2/2 ↓ | 3/4 ↓ | 4/6 ↓ | 2/2 ↓ | 4/5 ↓ |
RF: rectus femoris, VM: vastus medialis, VL: vastus laterals, PL: peroneus longus, TA: tibialis anterior, ST: semitendinosus, BF: biceps femoris, GM: gastrocnemius medialis, GL: gastrocnemius lateralis, ↑ increase of activation, ↓ decrease of activation.
Table 4.
Joint moments of hip, knee, and ankle (mean ± SD).
| Joint Moment (%BW*Ht) | Natural | Toe-In | Toe-Out | p-Value |
|---|---|---|---|---|
| Max hip flexion | 3.21 (0.94) | 3.54 (0.86) | 3.34 (0.77) | 0.19 |
| Max hip extension | 3.16 (0.43) | 2.89 (0.57) | 3.22 (0.51) | 0.43 |
| 1st hip adduction | 4.43 (0.66) | 3.97 (0.85) | 4.46 (0.70) | 0.12 |
| 2nd hip adduction | 4.77 (0.95) | 4.51 (1.05) | 4.65 (0.85) | 0.55 |
| Peak hip rotation | 0.79 (0.39) | 0.74 (0.35) | 0.90 (0.37) | 0.07 |
| 1st peak knee flexion | 2.35 (0.41) | 2.29 (0.55) | 3.23 (0.65) | 0.22 |
| 2nd peak knee flexion | 1.63 (1.12) | 1.45 (0.94) | 1.60 (0.99) | 0.50 |
| 1st knee adduction | 2.23 (0.35) | 1.97 (0.43) * | 2.25 (0.29) # | 0.04 |
| 2nd peak adduction | 2.45 (0.54) | 2.06 (0.72) | 2.31 (0.57) # | 0.03 |
| Peak ankle plantarflexion | 8.48 (0.45) | 8.17 (0.59) * | 8.34 (0.24) *# | 0.04 |
BW: body weight, Ht: height, * significantly different from natural gait, # significantly different from toe-in gait.
Table 5.
JRFs of the tibiofemoral (TF) joint (mean ± SD).
| JRF (%BW*Ht) | Natural | Toe-In | Toe-Out | p-Value |
|---|---|---|---|---|
| 1st peak in the AP direction | 0.34 (0.05) | 0.34 (0.09) | 0.40 (0.05) | 0.27 |
| 2nd peak in the AP direction | 0.45 (0.11) | 0.36 (0.07) | 0.46 (0.11) | 0.20 |
| 1st peak in the compressive direction | −1.19 (0.05) | −1.19 (0.10) | −1.25 (0.08) | 0.20 |
| 2nd peak in the compressive direction | −1.24 (0.05) | −1.21 (0.04) | −1.26 (0.03) | 0. 35 |
| Peak in the ML direction | 0.10 (0.02) | 0.12 (0.01) | 0.09 (0.01) | 0.26 |
AP: anterior-posterior.
© 2019 by the authors. Licensee MDPI, Basel, Switzerland. This article is an open access article distributed under the terms and conditions of the Creative Commons Attribution (CC BY) license (http://creativecommons.org/licenses/by/4.0/).
Share and Cite
MDPI and ACS Style
Cui, W.; Wang, C.; Chen, W.; Guo, Y.; Jia, Y.; Du, W.; Wang, C. Effects of Toe-Out and Toe-In Gaits on Lower-Extremity Kinematics, Dynamics, and Electromyography. Appl. Sci. 2019, 9, 5245. https://doi.org/10.3390/app9235245
AMA Style
Cui W, Wang C, Chen W, Guo Y, Jia Y, Du W, Wang C. Effects of Toe-Out and Toe-In Gaits on Lower-Extremity Kinematics, Dynamics, and Electromyography. Applied Sciences. 2019; 9(23):5245. https://doi.org/10.3390/app9235245
Chicago/Turabian StyleCui, Weiling, Changjiang Wang, Weiyi Chen, Yuan Guo, Yi Jia, Weijin Du, and Chenyan Wang. 2019. "Effects of Toe-Out and Toe-In Gaits on Lower-Extremity Kinematics, Dynamics, and Electromyography" Applied Sciences 9, no. 23: 5245. https://doi.org/10.3390/app9235245
Note that from the first issue of 2016, this journal uses article numbers instead of page numbers. See further details here.