Indices to Determine the Reliability of Rocks under Fatigue Load Based on Strain Energy Method


1
Key Laboratory of Shale Gas and Geoengineering, Institute of Geology and Geophysics, Chinese Academy of Sciences, Beijing 100029, China
2
Institutions of Earth Science, Chinese Academy of Sciences, Beijing 100029, China
3
College of Earth Science, University of Chinese Academy of Sciences, Beijing 100049, China
4
State Key Laboratory of Geohazard Prevention and Geoenvironment Protection, Chengdu University of Technology, Chengdu 610059, China
*
Author to whom correspondence should be addressed.
Appl. Sci. 2019, 9(3), 360; https://doi.org/10.3390/app9030360
Submission received: 14 November 2018
/
Revised: 12 January 2019
/
Accepted: 15 January 2019
/
Published: 22 January 2019
(This article belongs to the Special Issue Fatigue and Fracture of Non-metallic Materials and Structures)
Abstract
:Rock is a complicated material which includes randomly distributed grains and cracks. The reliability of rocks under fatigue load is very important during the construction and operation of rock engineering. In this paper, we studied the deformation and failure process of red sandstone under fatigue load in a laboratory based on a new division method of strain energy types. The traditional elastic strain energy density is divided into two categories: grain strain energy density and crack strain energy density. We find that the proportion of the grain strain energy density to total strain energy density can be used as an indicator of rock yield and the proportion of the crack strain energy density to total strain energy density can be used as an indicator of rock failure. Subsequently, through extensive literature research, we found that such a phenomenon is widespread. We also find the proportion of grain strain energy density to total strain energy density when yielding is affected by rock types and elastic modulus. The proportion of crack strain energy density to total strain energy density in the pre-peak stage is stable and not affected by rock types and elastic modulus, which is about 0.04~0.13. These findings should be very helpful for rock stable state judging in rock engineering.
1. Introduction
Rock is a kind of complicated material composed of mineral grains and cracks [1,2,3,4]. The deformation and failure process of rock is mainly controlled and affected by cracks [5,6,7,8,9,10,11]. During earthquakes, mining, and engineering construction, rock suffers deformation, producing fractures or failure as a result of fatigue load, which can impacts human lives and the environment [12,13,14]. Studies on the mechanical properties of rocks under fatigue loads are usually conducted using stress-based, strain-based, or strain energy-based approaches [15,16,17,18]. Due to the essence of rock material, deformation and failure is an energy-driven process [19] and energy evolution runs through the whole process of rock deformation and failure. The analyses based on the strain energy based-approach proved to be an effective approach [20,21,22,23]. In rocks, yield point and peak stress point are very important in evaluating the mechanical properties of rocks [9,24,25,26,27,28,29,30]. During the yield stage, rock deformation is not easily controlled by stress, and the rock structure becomes unstable. When the deformation of rock exceeds the peak stress point, the whole rock is destroyed. Therefore, it is more significant to determine whether the rock enters the yield state than whether it breaks in engineering practice. From the point of view of elastic–plastic mechanics, the mechanical energy input from outside is divided into two parts in rock without considering heat exchange. One part is elastic strain energy, which accumulates in the rock. The other part is plastic strain energy, which leads to the cracks growing, structural changes, and unrecoverable deformations. When some kind of strain energy reaches a certain state, the rock also enters a corresponding deformation or failure stage [31]. Therefore, the study of the effects of elastic and plastic strain energy on the rock deformation process can deepen our understanding of the mechanical behavior of rocks.
Presently there are no studies in literature that described or proposed a method to determine whether rock has entered the yield stage or failure stage from the point of view of strain energy. Some studies have focused on the evolution of elastic and plastic strain energy in rock and the associated damage to rock structures [32,33,34,35]. Some studies also analyzed the external factors that affect the evolution of elastic energy and plastic strain energy [36,37]. In addition, some studies analyzed the deformation and failure behavior of rocks under different fatigue loads [13,38,39,40]. These studies provide a good baseline for understanding the relationship between rock and strain energy and the mechanical behavior of rocks under fatigue loads. However, most of these studies are based on the traditional elastic and plastic strain energy division method, which cannot reflect the strain energy effect of rock grains and cracks in the process of rock deformation; hence, it is difficult to make a break through. At the same time, almost all of these studies only explain the phenomena, and do not give indices of strain energy when the rock enters the yielding stage or failure. Therefore, with the further research, the new strain energy division method and the index to determine the rock from stable to unstable stage should to be discussed.
Focusing on the abovementioned questions, this study tries to give indices to determine whether rocks have entered the yielding stage or failure. Through the new classification of strain energy density types, we found that the ratio of some kinds of strain energy densities to corresponding total strain energy densities obtained by the new method could be used as the index to determine whether the rock has entered the yield stage or failed. We subsequently collected experimental data from extensive literature to confirm this finding. We believe that this discovery is of great significance in rock engineering and earthquake prediction for judging or predicting rock stability.
2. Classification and Calculation Methods of Rock Strain Energy by Tests Results
2.1. Classifications and Methods of CalculatingStrain Energy
It is of great importance to divide suitable strain energy types to explain the elastic–plastic transformation and the mechanical properties of rocks. Although many methods in rock researches are derived from metal, the unique properties of properties of rocks clearly makes the two materials to be treated differently in some instances. In this study, we use the strain energy density to represent the strain energy in rocks.
In conventional rock cyclic loading and unloading studies, the researchers only divided the strain energy density into elastic strain energy density and plastic strain energy density , which as shown in Figure 1a. The deformation of rock consists of two parts: deformation of rock grains and deformation of cracks. Cai et al. [3] pointed out that during the unloading process, due to the previously compacted cracks and the opening of newly formed crack as a result of decrease in load, the slope of the unloading curve would gradually slow down. The deformation rebound of rock, at the beginning of unloading, was mainly due to the elastic deformation of grains because the crack in the rock cannot immediately change from compression to opening. Therefore, in the pre-peak stage, in order to obtain the elastic strain energy density of rock grains when unloading. We draw a line section with the slope of unloading modulus obtained at the initial stage of unloading from the unloading point A, and then cross the strain axis at point C, as the line AC shown in Figure 1b. So in this paper, the elastic strain energy density is divided into two parts. One part is the elastic strain energy density of rock grains , the second part is the crack strain energy density . The represents the strain energy density generated by the recoverable deformation of cracks. The method of dividing strain energy in post-peak stage is the same as that in pre-peak stage which are shown in Figure 1c,d.
Thus, the relationship between these kinds of strain energy density can be written as
According to Figure 1b,d, the calculation method of strain energy density in a loading and unloading process can be written as follows:
In these equations, u represents strain energy density, σ and σ′ represent the loading stress and unloading stress respectively; ε represents the strain; subscript i represents a rock unit; numbers 1, 2, and 3 represent three principal stress directions; and superscript p, e, g, and c represent plastic strain, elastic strain, elastic strain of rock grains, and elastic strain of cracks, respectively. The letters a and b represent the strain values corresponding to the stress unloading to the lowest point and the unloading start point, respectively.
2.2. Testing Schemes and Experimental Data
The test schemes adopted cyclic loading and unloading tests under different confining pressures and conducted with the MTS-815 servo-controlled testing machine in the State Key Laboratory of Geo-hazard Prevention and Geo-environment Protection (SKLGP), Chengdu, Sichuan, China. The fresh red sandstone blocks, which were taken from a quarry in Leshan, Sichuan, China were selected for this test. The blocks were cut into several cylindrical samples with 50mm in diameter and 100mm in height. The average density of dried red sandstone specimens is about 2.06 g/cm3 and the main mineral constituents are calcite (78.2%) and quartz (0.5%). The X-ray diffraction pattern is shown in Figure 2.
In this study, cyclic loading and unloading tests under confining pressures of 0MPA, 5 MPa, 10 MPa, and 20 MPa were designed. By comparing the uniaxial compression deformation stages of rocks classified by some researchers [2,41,42] and the deformation stages of cyclic loading and unloading test, stress–strain curves can be divided into 5 stages: (I) crack closure, (II) elastic deformation, (III) crack initiation and stable crack growth,(IV) crack damage and unstable crack growth, and(V) failure and post-peak behavior. In general, the point between stage III and IV is called the crack damage point and be treated as the yield point and the point between stage IV and V is called the peak point.
During the cyclic loading and unloading test, the rock samples were subjected to axial force with the loading rate of 1kN/s. When the axial force reaches 10 kN, we stopped the loading and start the unloading process. The unloading force was also set at 1kN/s. In order to avoid the impact of the testing machine on the sample during the reloading process, the sample is loaded when the axial force is 1 kN in the successive unloading process. For subsequent unloading cycles, we increased the unloading force by 10 kN, i.e., during the first cycle the unloading force was set at 10 kN and was 20 kN during the second cycle. In order to obtain more cycles when the rock deformation enters the yield stage, we decreased the unloading force of subsequent cycle to 5 kN. We adopted this loading method until the rock deformation reaches the peak point and failure occurred. During post peak stage, we controlled the unloading points manually. This makes the unloading force different for each sample. Despite this approach, the difference of strain energy density evolution in the post-peak and pre-peak stage is still obvious. A representative cyclic loading and unloading stress–strain curve is shown in Figure 3.
The mechanical properties of red sandstone samples under different confining pressures are shown in Table 1. In Table 1 σ3 represents confining stress, E represents the average elastic modulus, the σcd and εcd represents the average crack damage stress and strain respectively, the σp and εp represents the average peak strength and strain respectively.
3. Test Results
3.1. The Evolution of Strain Energy
Based on the strain energy types mentioned above and the laboratory test results, we obtained the strain energy evolution of red sandstone samples under different confining pressures. It should be noted that the data of these kinds of strain energies in the post-peak stages cannot be obtained in uniaxial compression tests, and two sets of post-peak strain energy data are obtained in the confining pressure tests of 5 MPa. A set of post-peak strain energy data is obtained in the confining pressure tests of 10 MPa and 20 MPa, respectively. According to the results of evolution of strain energy shown in Figure 4 and Figure 5, it can be found that the evolution of strain energies has some characteristics as follows:
(1) The characteristics of .
The grows in quadratic form during the whole deformation process. With the increase in strain, the numerical growth rate of is accelerated especially as it enters the yield stage. The value of is affected by the confining pressure, the higher the confining pressure the higher the value of .
(2) The characteristics of .
In the crack closure stage, the growth rate of is accelerated, and the growth rate in elastic stage is almost constant. After entering the yield stage, the growth rate of decreases, but the value of still increases. In the post-peak stage, the growth rate of becomes negative. With the increase of confining pressure, the values of increase, and the attenuation effect in the post-peak stage is also inhibited.
(3) The characteristics of .
The value of increases in S-shape during the deformation process and decreases after peak stress, which is similar to the stress–strain curve of rocks. The growth rate of decreases once the sample enters the yield stage. For some samples, the value of will still increase slightly due to confining pressure in the early post-peak stage. The value of will also increase with the increase of confining pressure.
(4) The characteristics of .
The value of increases slightly with the increase of strain before the peak point. After entering the post-peak stage, the of each sample is highly discrete. For most samples, the decrease in the post-peak stage and even becomes negative, only a small number of them increase. This may be as a result of the effects of confining pressures.
The results of Figure 4 and Figure 5 show that under the same test conditions, the same kind of strain energy of different samples shows a highly concentrated behavior, and the rock yielding or failure is because the strain energy reaching a certain value. However, due to different confining pressures, different strain energy is required for rock entering different deformation stages, which is relatively limited in application.
3.2. The Distribution of Strain Energy
Inspired by the above results, we check whether there is a relationship between the total strain energy absorbed by rock and other forms of strain energy in different deformation stages. Therefore, we divided , , , and at different deformation moments by at the corresponding moment. We then obtained the distribution law of the proportion of different strain energy to the total strain energy in the entire deformation process, which is shown in Figure 6. It is worth pointing out that the first two points of each curve are in the crack closure stage, which cannot reflect the properties of materials from the point of view of elastic-plastic mechanics, so they can be neglected in elastic–plastic analysis.
Figure 6 and Table 1, reveal the following characteristics about the distribution of strain energies:
- (1)
- Throughout the deformation process, the proportion of the same type of strain energy to the total strain energy under different confining pressures is concentrated in a certain range and shows the same growth trend.
- (2)
- Before the yield stage, the ratio of and to the is balanced. After entering the yield stage, the proportion of and increases and decreases rapidly, respectively.
- (3)
- The ratio of to rises rapidly to a certain level at the beginning of deformation, and remains relatively stable until it enters the yield stage. After entering the yield stage, the ratio of to decreases rapidly.
- (4)
- Except the first two points, the proportion of in the pre-peak stages almost remains a constant value, and decreases rapidly in the post-peak stage.
3.3. Discussions
Based on the above results, it can be found that the evolution of strain energy is related to the deformation and failure process of red sandstone. For a sample under a confining pressure, the plastic strain energy or elastic strain energy required to reach the yield stage is almost certain. The yield conditions can be constructed by testing the values of strain energy satisfied by different rocks under different test conditions. More importantly, when the proportion of , , , and in is plotted, it is found that the distribution of strain energy will appear as obvious points before or after the yield stage and pre-peak or post-peak stage.
As mentioned at the beginning in this paper, rock is a natural material composed of rock grains and cracks. Under the action of external force, the action of rock grains is to resist external force, and then weaken the damage as a result of external force to the structure. The crack in rock is a kind of existence that weakens the ability of rock to resist external force. We can assume that even though there are two opposing functions in rock, as long as their relationship is balanced, the strength of rock will increase with the increase of external forces within the energy storage range of rock grains. If this assumption is extended to the strain energy, that is, the ratio of strain energy density of different forms to total strain energy density are relatively stable before the big changes in rock structure. If the proportion of one type of strain energy density to total strain energy density changes significantly, the rock will enter the corresponding deformation stages, which is also consistent with the test results.
According to the definition of and , it can be seen that represents the elastic strain energy stored in rock grains in a rock unit, which can be released with unloading or rock structure damage. The represents the strain energy released by the recoverable deformation part of cracks. Therefore, we presume that the growth rate of the proportion of to becomes negative, which can be used as an indicator to judge the rock entering the yield stage. We also noticed that even under different confining pressures, the ratio of is almost the same in the pre-peak stage, which was a constant, and its ratio is about 0.06(±0.02). Therefore, we consider that whether the large-scale abrupt change of this proportion can be used as the basis for judging rock failure.
4. Verification and Extension of Strain Energy Index
Due to the limitation of the type and quantity of the test samples, we cannot draw general conclusions based on the experimental results only. Therefore, we first discuss the relationship between strain energy and rock deformation mechanism, and then obtained relevant data from published literature to verify the conclusions and assumptions in previous section.
4.1. The Relationship between Strain Energy and the Deformationmechanism of Rocks
Rock deformation process is related to the process of crack initiation and expansion. When the damage is within the range of rock resistance, the rock is stable, otherwise it becomes unstable. From the point of strain energy, the plastic strain energy reflects the energy consumed by the irreversible deformation of rock, including the irreversible deformation of most cracks and the displacement of a small part of rock grains. The elastic strain energy is mainly reflected by the elastic deformation of rock grains and a small number of recoverable cracks.
During the deformation of rock, the material properties of rock are activated with the closure of cracks. In the elastic stage, the elastic strain energy accumulated by rock particles is linear with the total strain energy, and the proportion of the total strain energy is relatively constant. Only after the yield stage, more and more energy is consumed by plastic deformation due to the unsteady propagation of cracks, so the proportion of elastic energy of rock grains decreases. For crack strain energy, the proportion of rock in the whole strain energy is relatively constant before rock failure because rock still has a relatively complete shape. When the rock has failed, the rock no longer has a complete shape, and the proportion of crack strain energy changes rapidly.
4.2. Collection of Experimental Results from PreviousStudies
We selected 94 rock cyclic loading and unloading tests of five types of rocks from published data for analysis. The basic information of the samples and test conditions are presented in Table 2. Although some of the data did not perform cyclic loading and unloading at the post-peak stage, it was impossible to analyze the post-peak condition, but the analysis in the pre-peak stage was still effective.
After analyzing the obtained data, it is found that the strain energy evolution of various samples is consistent with the strain energy evolution of red sandstone obtained in Section 3. For almost all samples, the proportion of grain strain energy will decrease after entering the yield stage. In this study, we choose the elastic modulus as abscissa axis because elastic modulus is affected by confining pressure, porosity, compactness of rock grains arrangement, and other comprehensive factors, which is the general embodiment of rock elastic properties. By analyzing the collected data, we observed that the ratio of grain strain energy to total strain energy increases with the increase in elastic modulus, different rocks show the distinct classification. The proportion of to of the same rock typeis linearly increasing with the elastic modulus. The relations between elastic modulus and proportion of to of different rocks while entering the yield stage are shown in Figure 7.
Let y denote the ratio of to when yielding and x denote the elastic modulus. Linear fitting of the data of different rocks in Figure 7 are given in the following equations:
The coal is
y = 0.08278x+0.38472, R2 = 0.99638
The sandstone is
y = 0.03025x+0.04219, R2 = 0.53828
The basalt is
y = 0.01229x+0.41971, R2 = 0.74461
The marble is
y = 0.00753x+0.12095, R2 = 0.7071
Finally, the granite is
y = 0.00603x+0.31933, R2 = 0.88499
From the results of linear fitting, it can be seen that the slope of linear equation from Equation (7) to Equation (11) decreases successively, while the uniaxial compressive strength of rock increases successively. It should be noted that the uniaxial compressive strength referred to here is not the uniaxial compressive strength specific to a particular rock, but the uniaxial compressive strength commonly used to classify rocks. This is because the uniaxial compressive strength of the sandstone, in some cases, is higher than that of the marble. The classification of rock uniaxial strength is stated in China’s national standards [55,56].
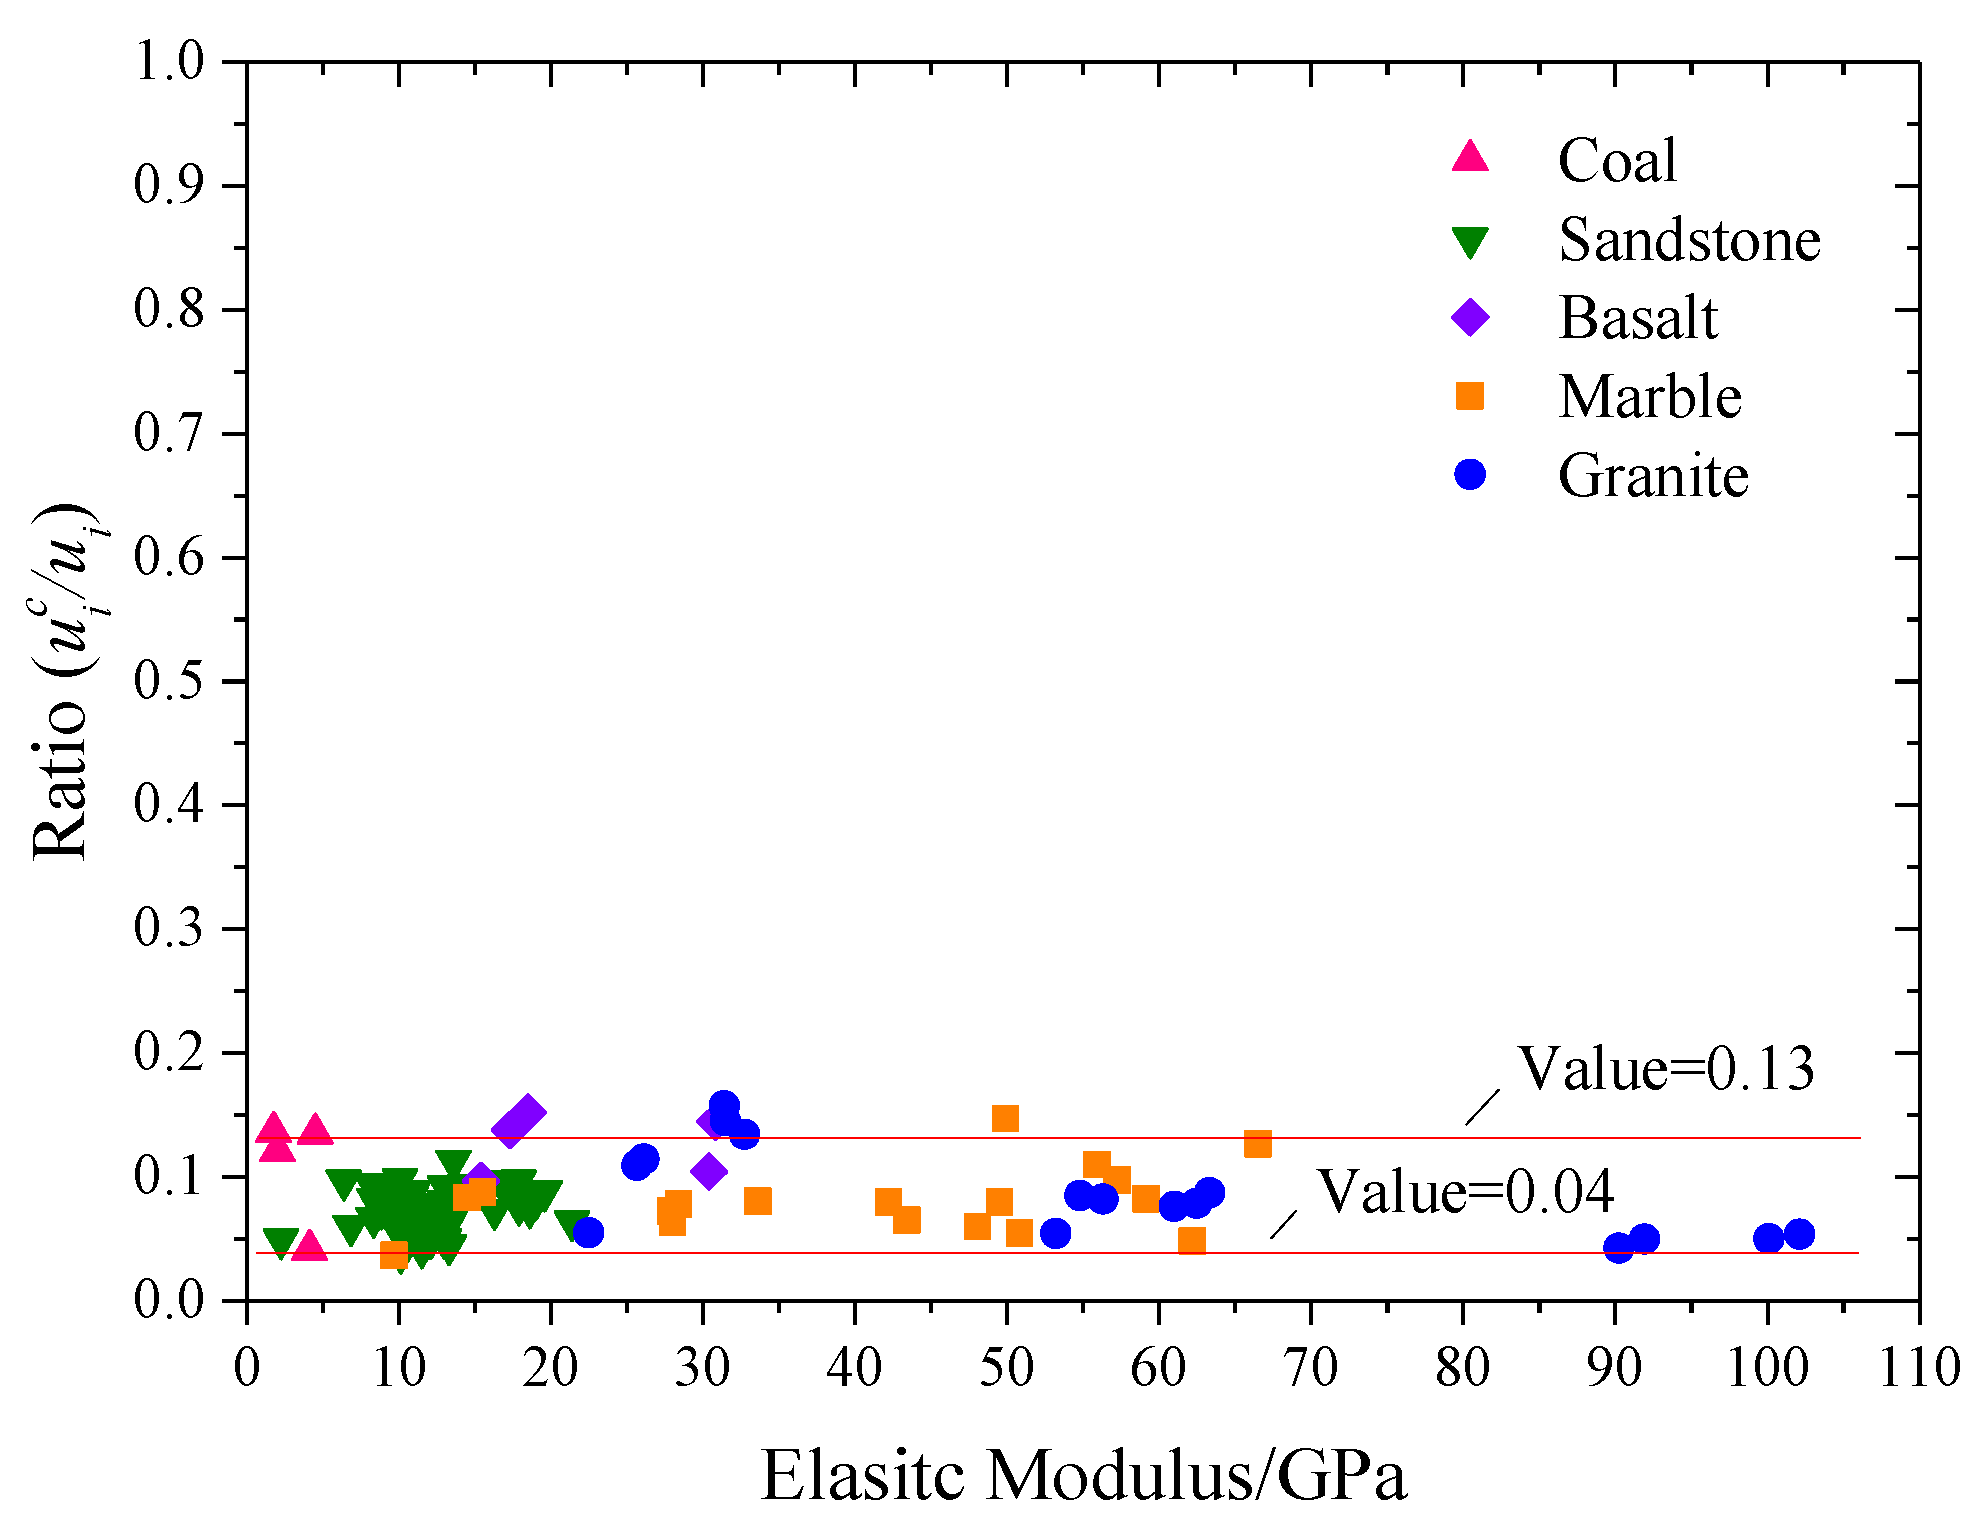
Through the analysis of the ratio of the to in these rock samples, it is found that this ratio is nearly stable in a range during the pre-peak period, and will not change until failure (Figure 8). In Figure 8, the data are concentrated in the range of 0.04~0.13 and are not affected by rock type and elastic modulus. The maximum value is 0.1534 and the minimum value is 0.0366.
However, due to the limitation of sample data, this finding needs more sample data and more rock types to confirm. We believe that by analyzing enough experimental data of different rock types, we can get more accurate and comprehensive evolution and proportion of grain strain energy density and crack strain energy density to total strain energy density, and can use these two indices to predict or analyze the stability or failure of rocks.
5. Conclusions
According to a series of analysis of test results and literature data, this work studied the evolution of strain energy in the process of rock deformation and its relationship with deformation mechanism classified by new strain energy types. It is observed that the proportion of grain strain energy density and crack strain energy density to total strain energy density can be used as the indices for determine rock stability or failure. The main findings of this study are as follows:
- (1)
- The elastic strain energy density of rock is composed of grain strain energy density and crack strain energy density according to the new division method. Both grain strain energy density and crack strain energy density increase before rock failure, but the growth rate of grain strain energy density decreases after it enters the yield stage.
- (2)
- From the point of view of energy distribution, the distribution of grain strain energy density is stable before the yield stage and the proportion of grain strain energy density decreases after entering the yield stage. This indicates that more strain energy density is allocated to the plastic strain energy density, which results in the decrease of grain strain energy density. This phenomenon is consistent with the deformation mechanism of cracks expansion after rock enters the yield stage. However, the distribution of crack strain energy is stable during the pre-peak deformation stage, and it decreases only after the peak stage. We believe that this phenomenon is related to the integrity of the rock because no matter how many cracks grow in the rock, as long as the rock has not failed, the restorable part of the crack is coordinated with the total strain energy density.
- (3)
- Through the analysis of the data obtained from other literatures, it is found that the proportion of grain strain energy density to total strain energy density can be used as the index to determine the stability of rock. The proportion of crack strain energy density to total strain energy density can be used as the index to determine rock failure.
- (4)
- The proportion of grain strain energy density to total strain energy density is concentrated in the same rock type, which has linear relationship with elastic modulus. The slope of the linear equation between different rocks and elastic modulus will decrease with the increase of uniaxial compression strength of rock under normal conditions.
- (5)
- The proportion of crack strain energy density to total strain energy density is stable in the range of 0.04~0.13, which is independent of rock type and elastic modulus.
It should be noted that these findings are based on limited data, but we believe these data have already opened the door to a new research area. Later, we will enrich these research findings by obtaining more data and popularizing it for engineering applications.
Author Contributions
Conceptualization, H.F. and S.W.; Methodology, H.F.; Validation, H.F., S.W. and X.P.; Formal analysis, H.F. and W.C.; Investigation, S.W. and H.F.; Resources, X.P.; Writing—original draft preparation, H.F.; Writing—review and editing, H.F. and S.W.; Visualization, H.F. and W.C.; Supervision, S.W. and X.P.; Project administration, H.F.; Funding acquisition, S.W.and X.P.
Funding
This research was funded by the Opening Fund of State Key Laboratory of Geohazard Prevention and Geoenvironment Protection (Chengdu University of Technology) No. SKLGP2016K001; National Key R&D Program of China No. 2017YFC1501002; the National Natural Science Foundation of China No. 41572302.
Acknowledgments
We would like to thank Cheng Cheng’s suggestions and Afolagboye lekan olatayo’s help in improving the English of manuscript. We also would like to thank the anonymous reviewers for their helpful comments.
Conflicts of Interest
The authors declare no conflict of interest.
References
- Gu, D. Fundamentals of Rock Engineering Geomechanics; Science Press: Beijing, China, 1979. [Google Scholar]
- MARTIN; CHANDLER. The progressive fracture of Lac du Bonnet granite. Int. J. Rock Mech. Min. Sci. Geomech. Abstr. 1994, 31, 643–659. [Google Scholar] [CrossRef]
- Meifeng, C.; Manchao, H.; Dongyan, L. Rock Mechanics and Engineering; Science Press: Beijing, China, 2002; pp. 52–61. [Google Scholar]
- Wang, S. Geological nature of rock and its deduction for rock mechanics. Chin. J. Rock Mech. Eng. 2009, 28, 433–450. [Google Scholar]
- Lockner, D. The role of acoustic emission in the study of rock fracture. Int. J. Rock Mech. Min. Sci. Geomech. Abstr. 1993, 30, 883–899. [Google Scholar] [CrossRef]
- Yamada, I.; Masuda, K.; Mizutani, H. Electromagnetic and acoustic emission associated with rock fracture. Phys. Earth Planet. Inter. 1989, 57, 157–168. [Google Scholar] [CrossRef]
- Rudajev, V.; Vilhelm, J.; Lokajı́Ček, T. Laboratory studies of acoustic emission prior to uniaxial compressive rock failure. Int. J. Rock Mech. Min. Sci. Geomech. Abstr. 2000, 37, 699–704. [Google Scholar] [CrossRef]
- Shah, K.R.; Labuz, J.F. Damage mechanisms in stressed rock from acoustic emission. J. Geophys. Res. Solid Earth 1995, 100, 15527–15539. [Google Scholar] [CrossRef]
- Wawersik, W.R.; Fairhurst, C. A study of brittle rock fracture in laboratory compression experiments. Int. J. Rock Mech. Min. Sci. Geomech. Abstr. 1970, 7, 561–575. [Google Scholar] [CrossRef]
- Carpinteri, A.; Lacidogna, G.; Corrado, M.; Battista, E.D. Cracking and crackling in concrete-like materials: A dynamic energy balance. Eng. Fract. Mech. 2016, 155, 130–144. [Google Scholar] [CrossRef]
- Iturrioz, I.; Lacidogna, G.; Carpinteri, A. Acoustic emission detection in concrete specimens: Experimental analysis and simulations by a lattice model. Int. J. Damage Mech. 2013, 23, 327–358. [Google Scholar] [CrossRef]
- Zhu, W.; Feng, C. Constitutive model of energy dissipation and its application to stability analysis of ship lock slope in three gorges project. Chin. J. Rock Mech. Eng. 2000, 19, 261–264. [Google Scholar]
- Wang, J.A.; Park, H.D. Comprehensive prediction of rockburst based on analysis of strain energy in rocks. Tunn. Undergr. Space Technol. Inc. Trenchless Technol. Res. 2001, 16, 49–57. [Google Scholar] [CrossRef]
- Xiao, J.Q.; Ding, D.X.; Jiang, F.L.; Xu, G. Fatigue damage variable and evolution of rock subjected to cyclic loading. Int. J. Rock Mech. Min. Sci. 2010, 47, 461–468. [Google Scholar] [CrossRef]
- Hua, A. Energy analysis of surrounding rocks in underground engineering. Chin. J. Rock Mech. Eng. 2003, 22, 1054–1059. [Google Scholar]
- Yu, M.H. Advances in strength theories for materials under complex stress state in the 20th Century. Adv. Mech. 2004, 34, 529–560. [Google Scholar] [CrossRef]
- Heping, X.; Yang, J.; Liyun, L.; Ruidong, P. Energy mechanism of deformation and failure of rock masses. Chin. J. Rock Mech. Eng. 2008, 27, 1729–1740. [Google Scholar]
- Carpinteri, A.; Corrado, M.; Lacidogna, G. Three different approaches for damage domain characterization in disordered materials: Fractal energy density, b-value statistics, renormalization group theory. Mech. Mater. 2012, 53, 15–28. [Google Scholar] [CrossRef]
- Xie, H.P.; Yang, J.U.; Li-Yun, L.I. Criteria for strength and structural failure of rocks based on energy dissipation and energy release principles. Chin. J. Rock Mech. Eng. 2005, 24, 3003–3010. [Google Scholar]
- Cai, M.; Dong, J.I.; Guo, Q. Study of rockburst prediction based on in-situ stress measurement and theory of energy accumulation caused by mining disturbance. Chin. J. Rock Mech. Eng. 2013, 32, 1973–1980. [Google Scholar]
- Zhang, Z.; Feng, G. Experimental investigations on energy evolution characteristics of coal,sandstone and granite during loading process. J. China Univ. Min. Technol. 2015, 44, 416–422. [Google Scholar]
- Jiang, C.; Duan, M.; Yin, G.; Wang, J.G.; Lu, T.; Xu, J.; Zhang, D.; Huang, G. Experimental study on seepage properties, AE characteristics and energy dissipation of coal under tiered cyclic loading. Eng. Geol. 2017, 221, 114–123. [Google Scholar] [CrossRef]
- Meng, Q.; Zhang, M.; Han, L.; Pu, H.; Chen, Y. Acoustic Emission Characteristics of Red Sandstone Specimens Under Uniaxial Cyclic Loading and Unloading Compression. Rock Mech. Rock Eng. 2018, 51, 1–20. [Google Scholar] [CrossRef]
- Cook, N.G.W. The failure of rock. Int. J. Rock Mech. Min. Sci. Geomech. Abstr. 1965, 2, 389–403. [Google Scholar] [CrossRef]
- Wawersik, W.R.; Brace, W.F. Post-failure behavior of a granite and diabase. Rock Mech. 1971, 3, 61–85. [Google Scholar] [CrossRef]
- Bukowska, M. Post-peak failure modulus in problems of mining geo-mechanics. J. Min. Sci. 2013, 49, 731–740. [Google Scholar] [CrossRef]
- Bogusz, A.; Bukowska, M. Stress-strain characteristics as a source of information on the destruction of rocks under the influence of load. J. Sustain. Min. 2015, 14, 46–54. [Google Scholar] [CrossRef] [Green Version]
- Pasternak, E.; Dyskin, A.V.; Sevel, G. Chains of oscillators with negative stiffness elements. J. Sound Vib. 2014, 333, 6676–6687. [Google Scholar] [CrossRef]
- Pasternak, E.; Dyskin, A. Dynamic Instability in Geomaterials Associated with the Presence of Negative Stiffness Elements. In Bifurcation and Degradation of Geomaterials in the New Millennium; Springer: Cham, Switzerland, 2015. [Google Scholar]
- Zhang, X.; Tahmasebi, P. Micromechanical evaluation of rock and fluid interactions. Int. J. Greenh. Gas Control 2018, 76, 266–277. [Google Scholar] [CrossRef]
- Bingye, X.; Xinsheng, L. Application Elastic- Plastic Mechanics; Tsinghua University Press: Beijing, China, 1995. [Google Scholar]
- Xingguang, Z.; Pengfei, L.; Like, M.; Rui, S.; Ju, W. Damage and dilation characteristics of deep granite at beishan under cyclic loading-unloading conditions. Chin. J. Rock Mech. Eng. 2014, 33, 1740–1748. [Google Scholar]
- Guo, S.; Qi, S.; Zhan, Z.; Zheng, B. Plastic-strain-dependent strength model to simulate the cracking process of brittle rocks with an existing non-persistent joint. Eng. Geol. 2017, 231, 114–125. [Google Scholar] [CrossRef]
- Zhang, C.; Tu, S.; Zhang, L. Analysis of Broken Coal Permeability Evolution Under Cyclic Loading and Unloading Conditions by the Model Based on the Hertz Contact Deformation Principle. Transp. Porous Med. 2017, 119, 1–16. [Google Scholar] [CrossRef]
- Fengqiang, G.; Jingyi, Y.; Xibing, L. A new criterion of rock burst proneness based on the linear energy storage law and the residual elastic energy index. Chin. J. Rock Mech. Eng. 2018, 37, 1993–2014. [Google Scholar]
- Bagde, M.N.; Petroš, V. Fatigue and dynamic energy behaviour of rock subjected to cyclical loading. Int. J. Rock Mech. Min. Sci. 2009, 46, 200–209. [Google Scholar] [CrossRef]
- Hui, Z.; Fanjie, Y.; Chuanqing, Z.; Rongchao, X.; Kai, Z. An elastoplastic coupling mechanical model for marble considering confining. Chin. J. Rock Mech. Eng. 2012, 31, 2389–2399. [Google Scholar]
- Ma, L.J.; Liu, X.Y.; Wang, M.Y.; Xu, H.F.; Hua, R.P.; Fan, P.X.; Jiang, S.R.; Wang, G.A.; Yi, Q.K. Experimental investigation of the mechanical properties of rock salt under triaxial cyclic loading. Int. J. Rock Mech. Min. Sci. 2013, 62, 34–41. [Google Scholar] [CrossRef]
- Zhou, Z.L.; Zhi-Bo, W.U.; Xi-Bing, L.I.; Xiang, L.I.; Chun-De, M.A. Mechanical behavior of red sandstone under cyclic point loading. Trans. Nonferrous Met. Soc. China 2015, 25, 2708–2717. [Google Scholar] [CrossRef]
- Li, D.; Sun, Z.; Xie, T.; Li, X.; Ranjith, P.G. Energy evolution characteristics of hard rock during triaxial failure with different loading and unloading paths. Eng. Geol. 2017, 228, 270–281. [Google Scholar] [CrossRef]
- Brace, W.F.; Paulding, B.W.; Scholz, C. Dilatancy in the fracture of crystalline rocks. J. Geophys. Res. 1966, 71, 3939–3953. [Google Scholar] [CrossRef]
- Bieniawski, Z.T. Mechanism of brittle fracture of rock: Part I—Theory of the fracture process. Int. J. Rock Mech. Min. Sci. Geomech. Abstr. 1967, 4, 395–406. [Google Scholar] [CrossRef]
- You, M. Experimental study on strengthening of marble specimen in cyclic loading of uniaxial or pseudo-triaxial compression. Chin. J. Solid Mech. 2008, 29, 66–72. [Google Scholar]
- Fukun, X.; Zhiliang, S.; Gang, L.; Ze, Z.; Fengrui, Z. Relationship between hysteresis loop and elastoplastic strain energy during cyclic loading and unloading. Chin. J. Rock Mech. Eng. 2014, 33, 1791–1797. [Google Scholar]
- Zhen, L.I.; Zhou, H.; Yang, F.J.; Zhao, H.B.; Zhong-Liang, R.U. Elastoplastic coupling strain definition and constitutive function. Rock Soil Mech. 2018, 39, 917–925. [Google Scholar]
- Zhizhen, Z.; Feng, G. Research on nonlinear characteristics of rock energy evolution under uniaxial compression. Chin. J. Rock Mech. Eng. 2012, 31, 1198–1207. [Google Scholar]
- Meng, Q.; Zhang, M.; Han, L.; Pu, H.; Nie, T. Effects of Acoustic Emission and Energy Evolution of Rock Specimens Under the Uniaxial Cyclic Loading and Unloading Compression. Rock Mech. Rock Eng. 2016, 49, 1–14. [Google Scholar] [CrossRef]
- Zhu, X.; Li, Y.; Wang, C.; Sun, X.; Liu, Z. Deformation Failure Characteristics and Loading Rate Effect of Sandstone Under Uniaxial Cyclic Loading and Unloading. Geotech. Geol. Eng. 2018, 1–8. [Google Scholar] [CrossRef]
- Heap, M.J.; Vinciguerra, S.; Meredith, P.G. The evolution of elastic moduli with increasing crack damage during cyclic stressing of a basalt from Mt. Etna volcano. Tectonophysics 2009, 471, 153–160. [Google Scholar] [CrossRef]
- Yang, S.Q.; Xu, P.; Ranjith, P.G.; Chen, G.F.; Jing, H.W. Evaluation of creep mechanical behavior of deep-buried marble under triaxial cyclic loading. Arabian J. Geosci. 2015, 8, 6567–6582. [Google Scholar] [CrossRef]
- Zhou, H.; Zhang, K.; Feng, X.T. Experimental study on progressive yielding of marble. Mater. Res. Innov. 2015, 15, s143–s146. [Google Scholar] [CrossRef]
- Jun, L.; Da-wei, H.; Hui, Z.; Jing-jing, L.; Tao, L.; Lin-ken, S. Gas permeability of granite in triaxial cyclic compression tests. Rock Soil Mech. 2018, 40, 1–8. [Google Scholar]
- Zhang, Z.; Zhu, J.; Wang, B.; Feng, Z.; Bo, L.U.; Zhang, L.; Jiang, Y. The damage and shear dilation property evolution based on energy dissipation mechanism of gneissic granite. Chin. J. Rock Mech. Eng. 2018, 37, 3441–3448. [Google Scholar]
- Peng, Z.; Hongguang, J.I.; Sun, L.; Zhang, Z.; Yu, G.; Hua, J.; Chengjiang, L.I. Experimental study of characteristics of irreversibility and fracture precursors of acoustic emission in rock under different confining pressures. Chin. J. Rock Mech. Eng. 2016, 35, 1333–1340. [Google Scholar]
- China, MOHURD. Code for Hydropower Engineering Geological Investigation. Available online: http://www.mohurd.gov.cn/wjfb/201702/t20170224_230737.html (accessed on 18 August 2016).
- China, MOHURD. Standard for Engineering Classification of Rock Mass; China Planning Press: Beijing, China, 2015. Available online: http://www.mohurd.gov.cn/wjfb/201508/t20150829_224347.html (accessed on 27 August 2014).
Figure 1.
Comparison of two methods for dividing strain energy in pre-peak stage and post-peak stage: (a) The pattern of strain energy division in pre-peak stage which has been used in the former studies; (b) the new pattern of strain energy division in pre-peak stage which has been used in this study; (c) the pattern of strain energy division in post-peak stage which has been used in the former studies; (d) the new pattern of strain energy division in post-peak stage which has been used in this study.
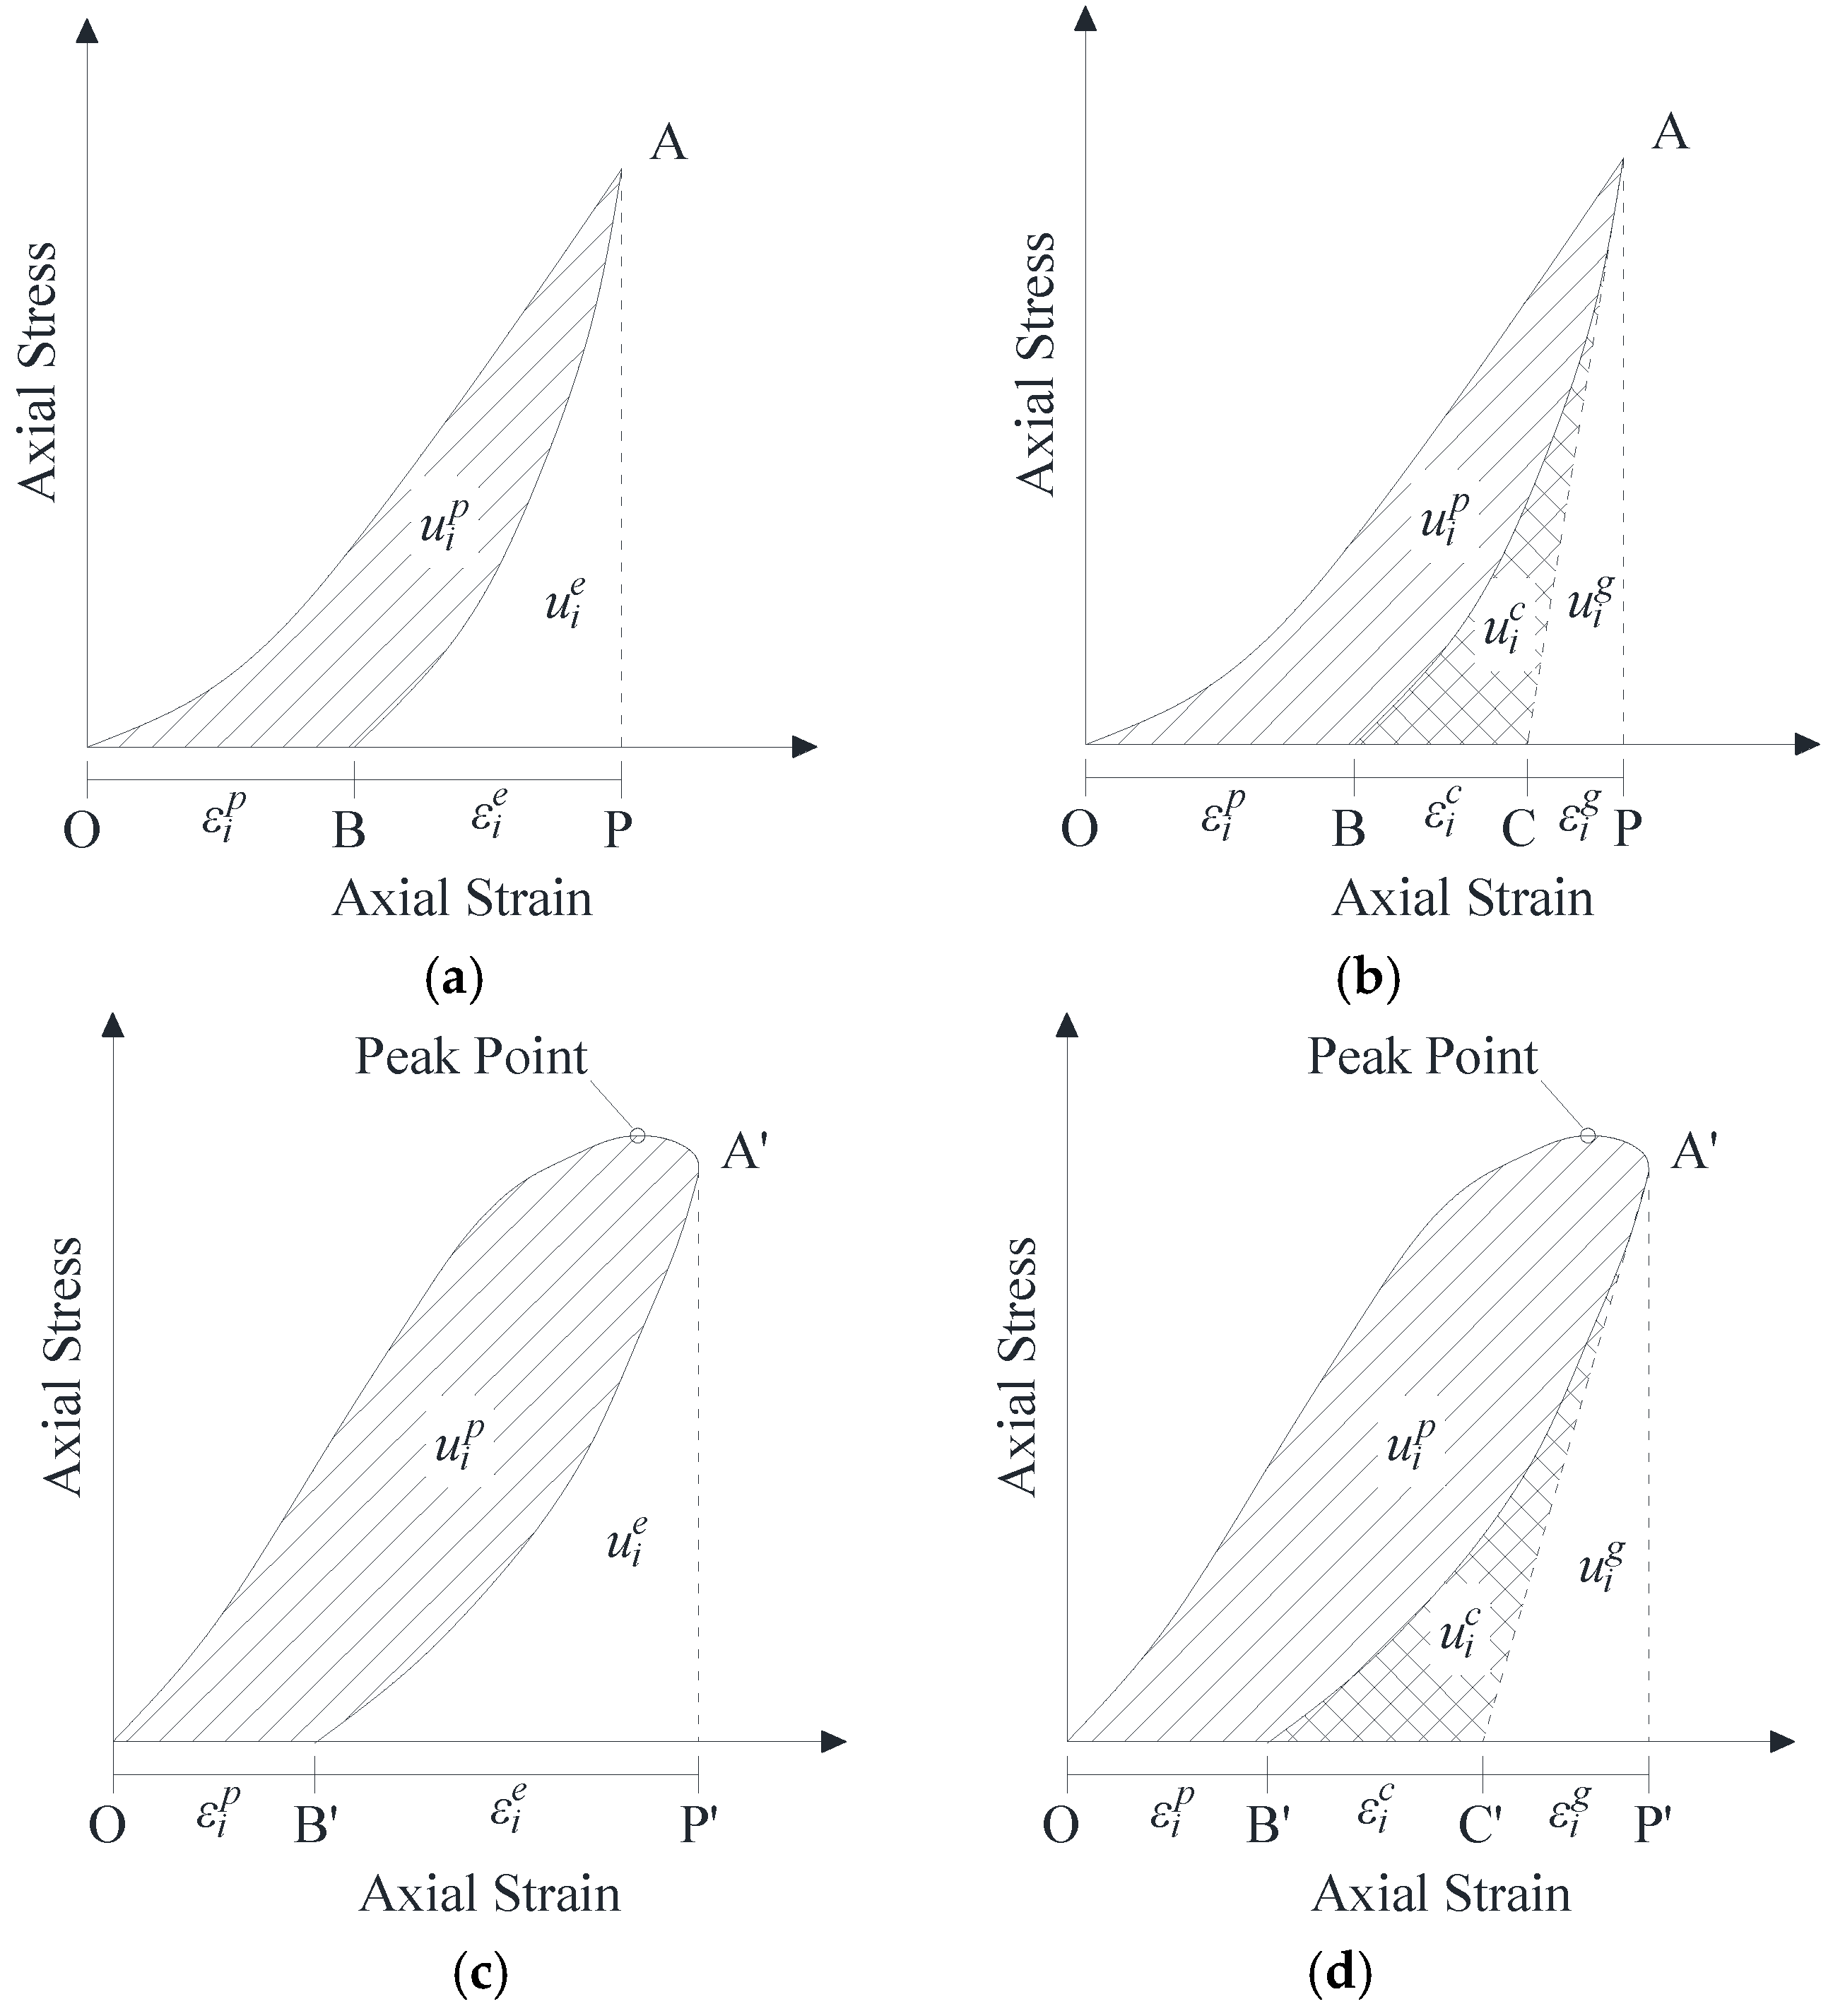
Figure 2.
X-ray diffraction pattern of sandstone samples in this study.
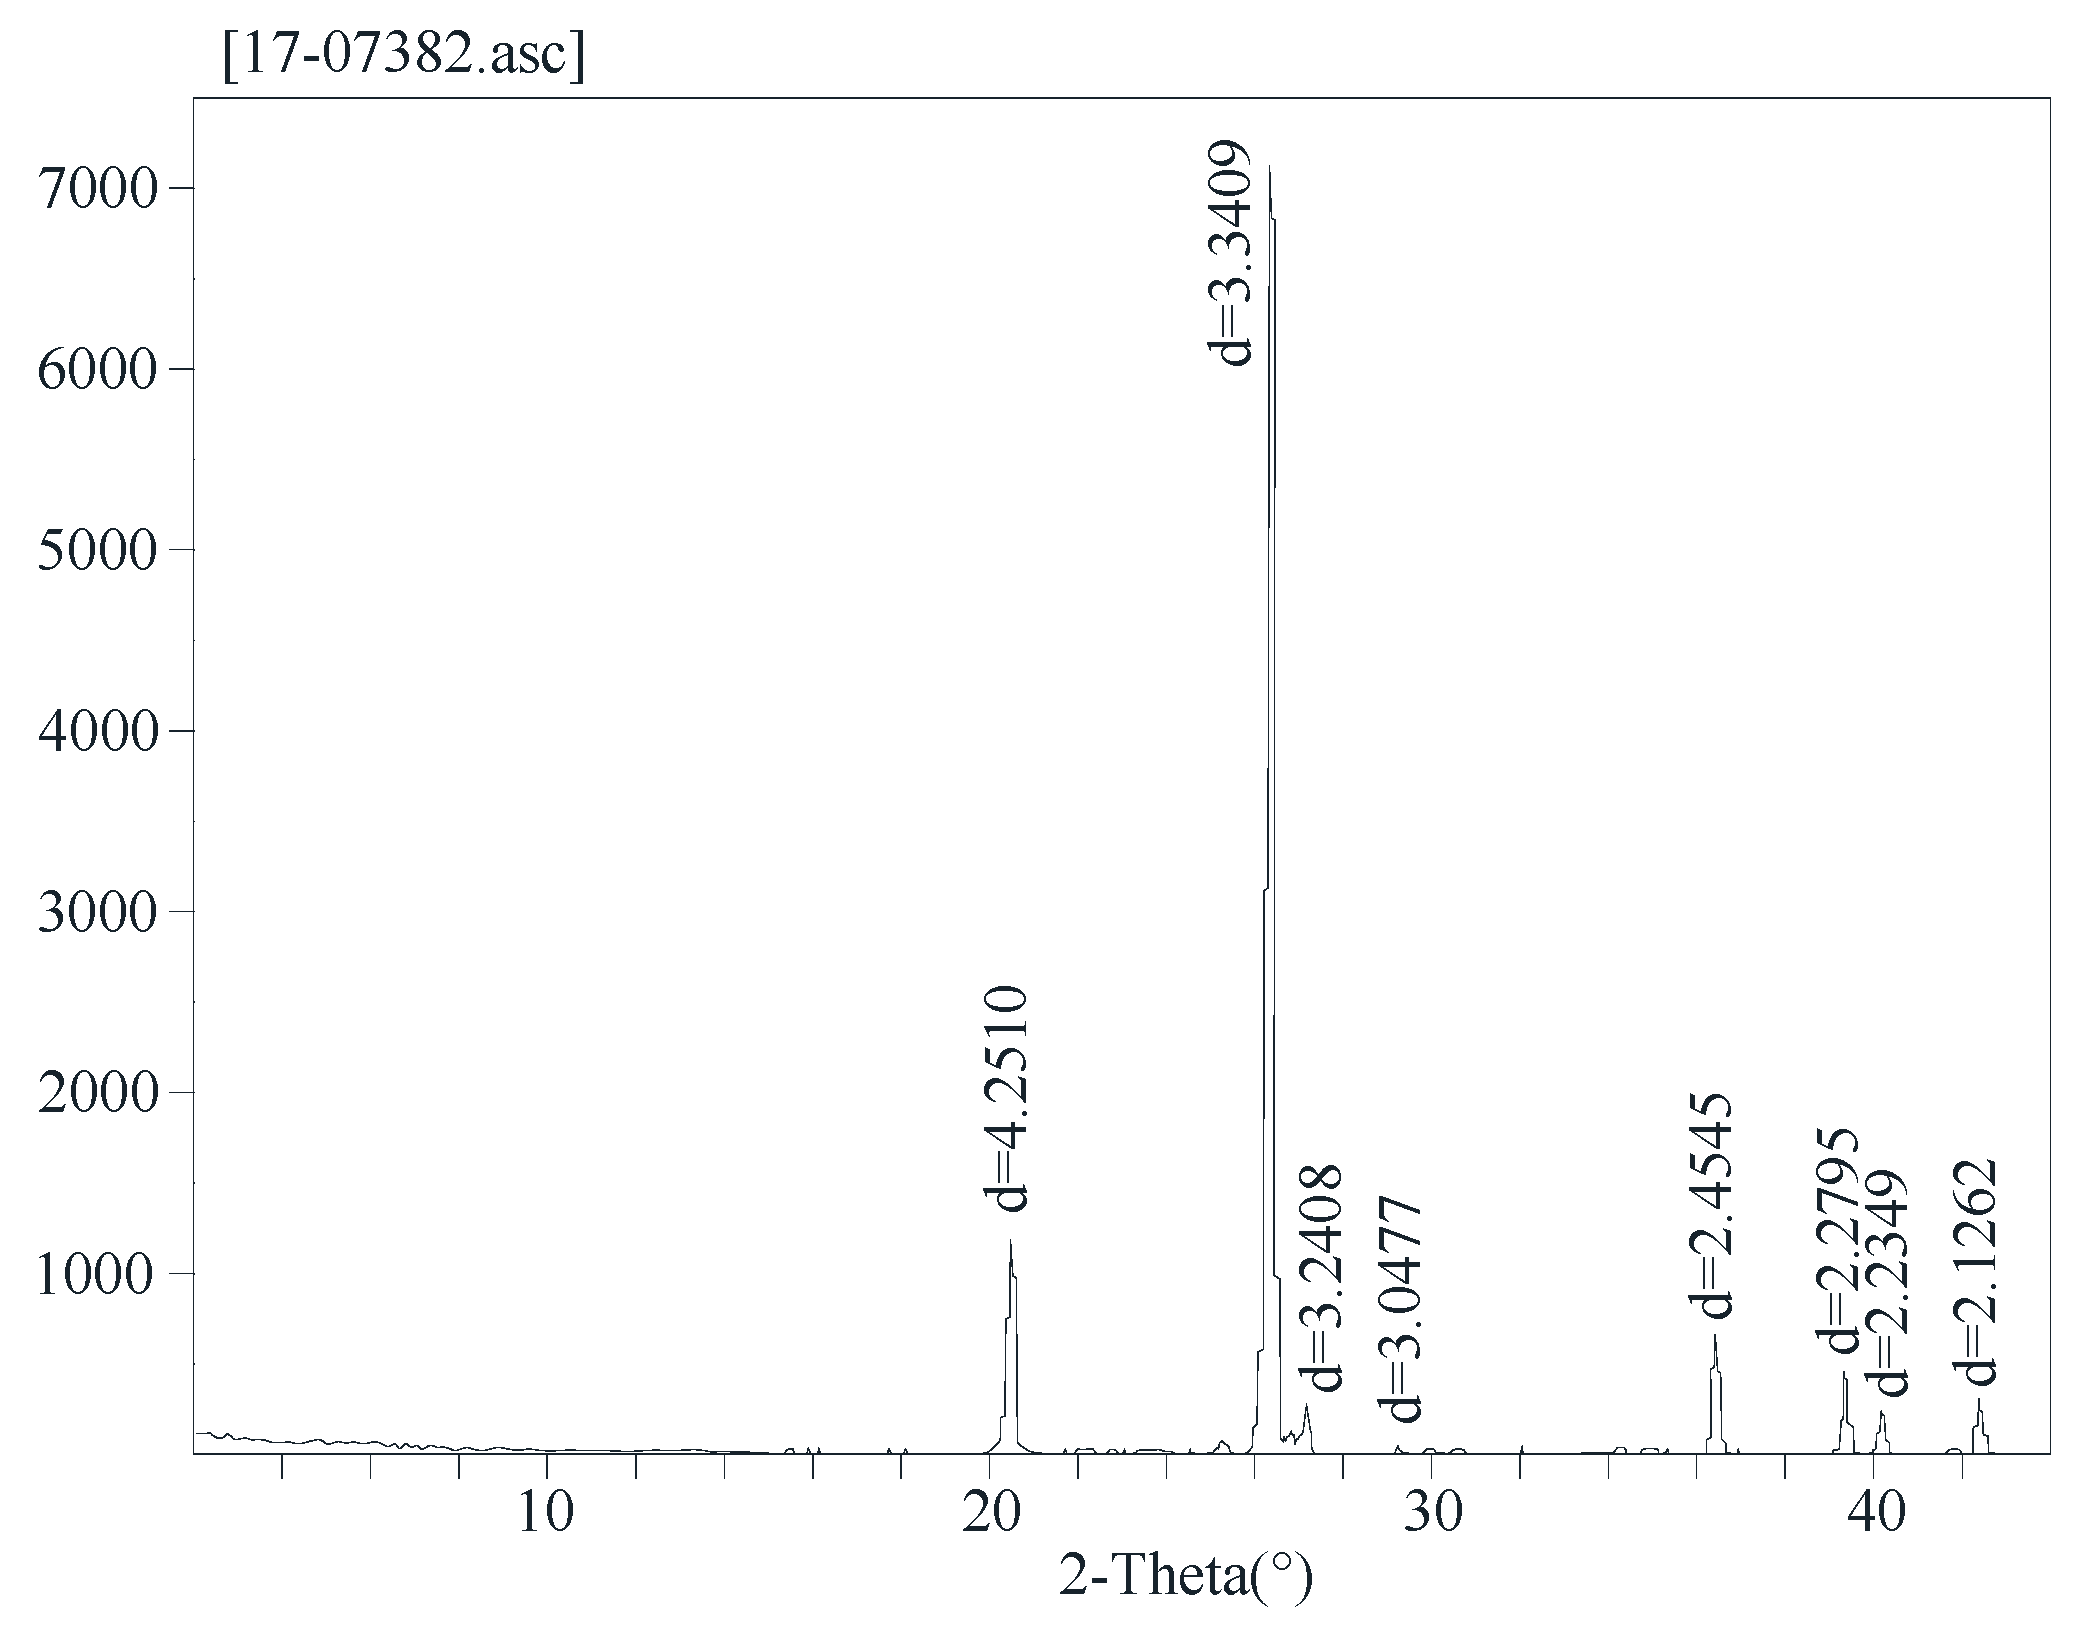
Figure 3.
A representative cyclic loading and unloading stress-strain curve under 5 MPa confining pressure.
Figure 3.
A representative cyclic loading and unloading stress-strain curve under 5 MPa confining pressure.
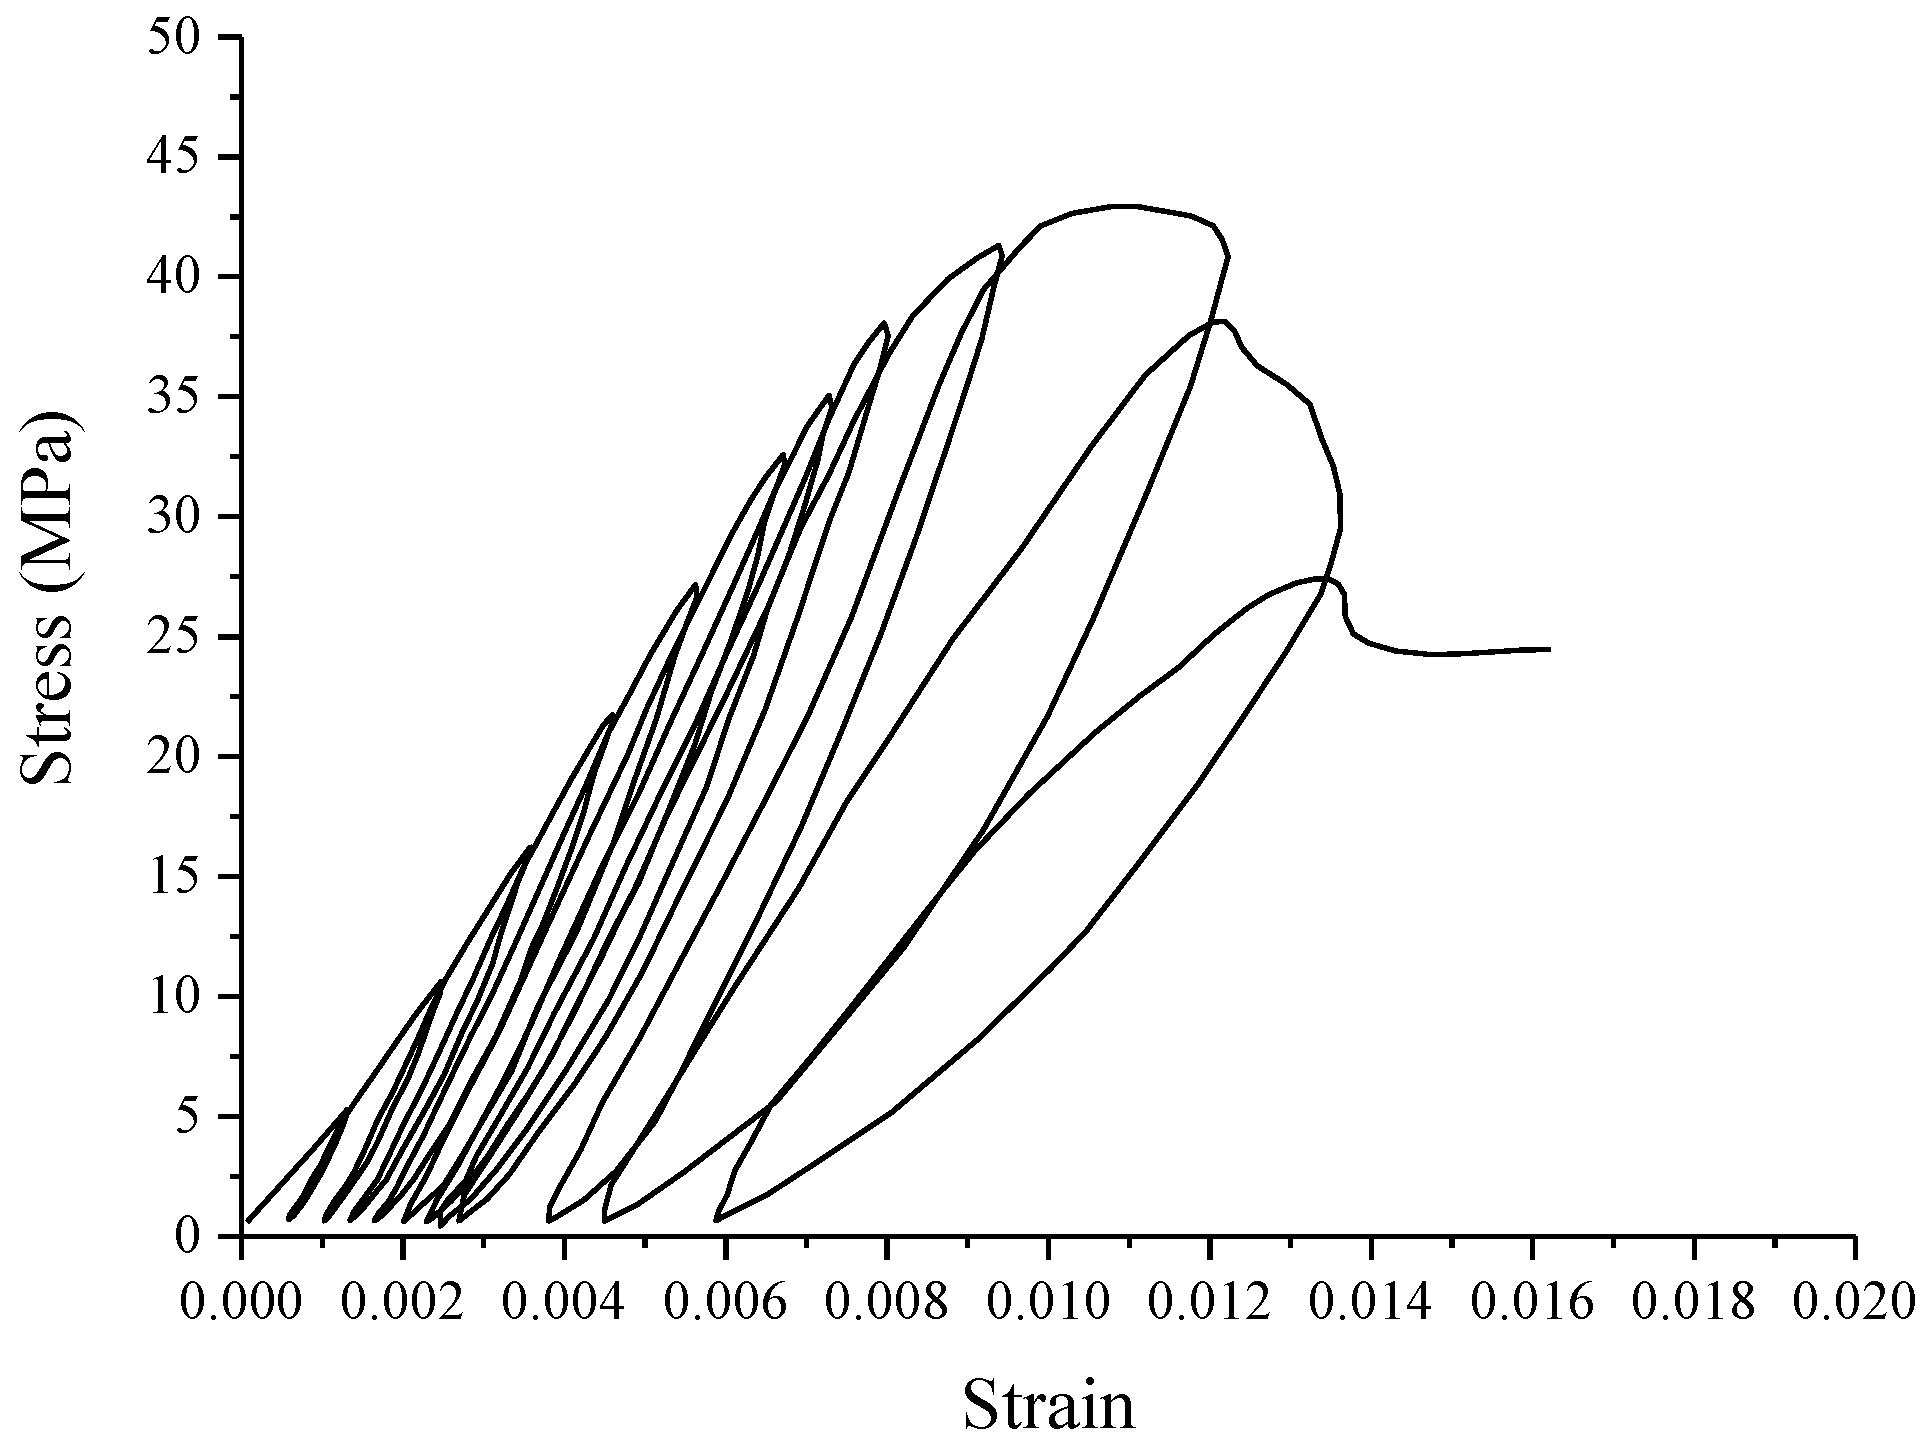
Figure 4.
The evolution of and of red sandstone samples under different confining pressures: (a) Confining pressure is 0 MPa; (b) Confining pressure is 5 MPa; (c) Confining pressure is 10 MPa; (d) Confining pressure is 20 MPa.
Figure 4.
The evolution of and of red sandstone samples under different confining pressures: (a) Confining pressure is 0 MPa; (b) Confining pressure is 5 MPa; (c) Confining pressure is 10 MPa; (d) Confining pressure is 20 MPa.
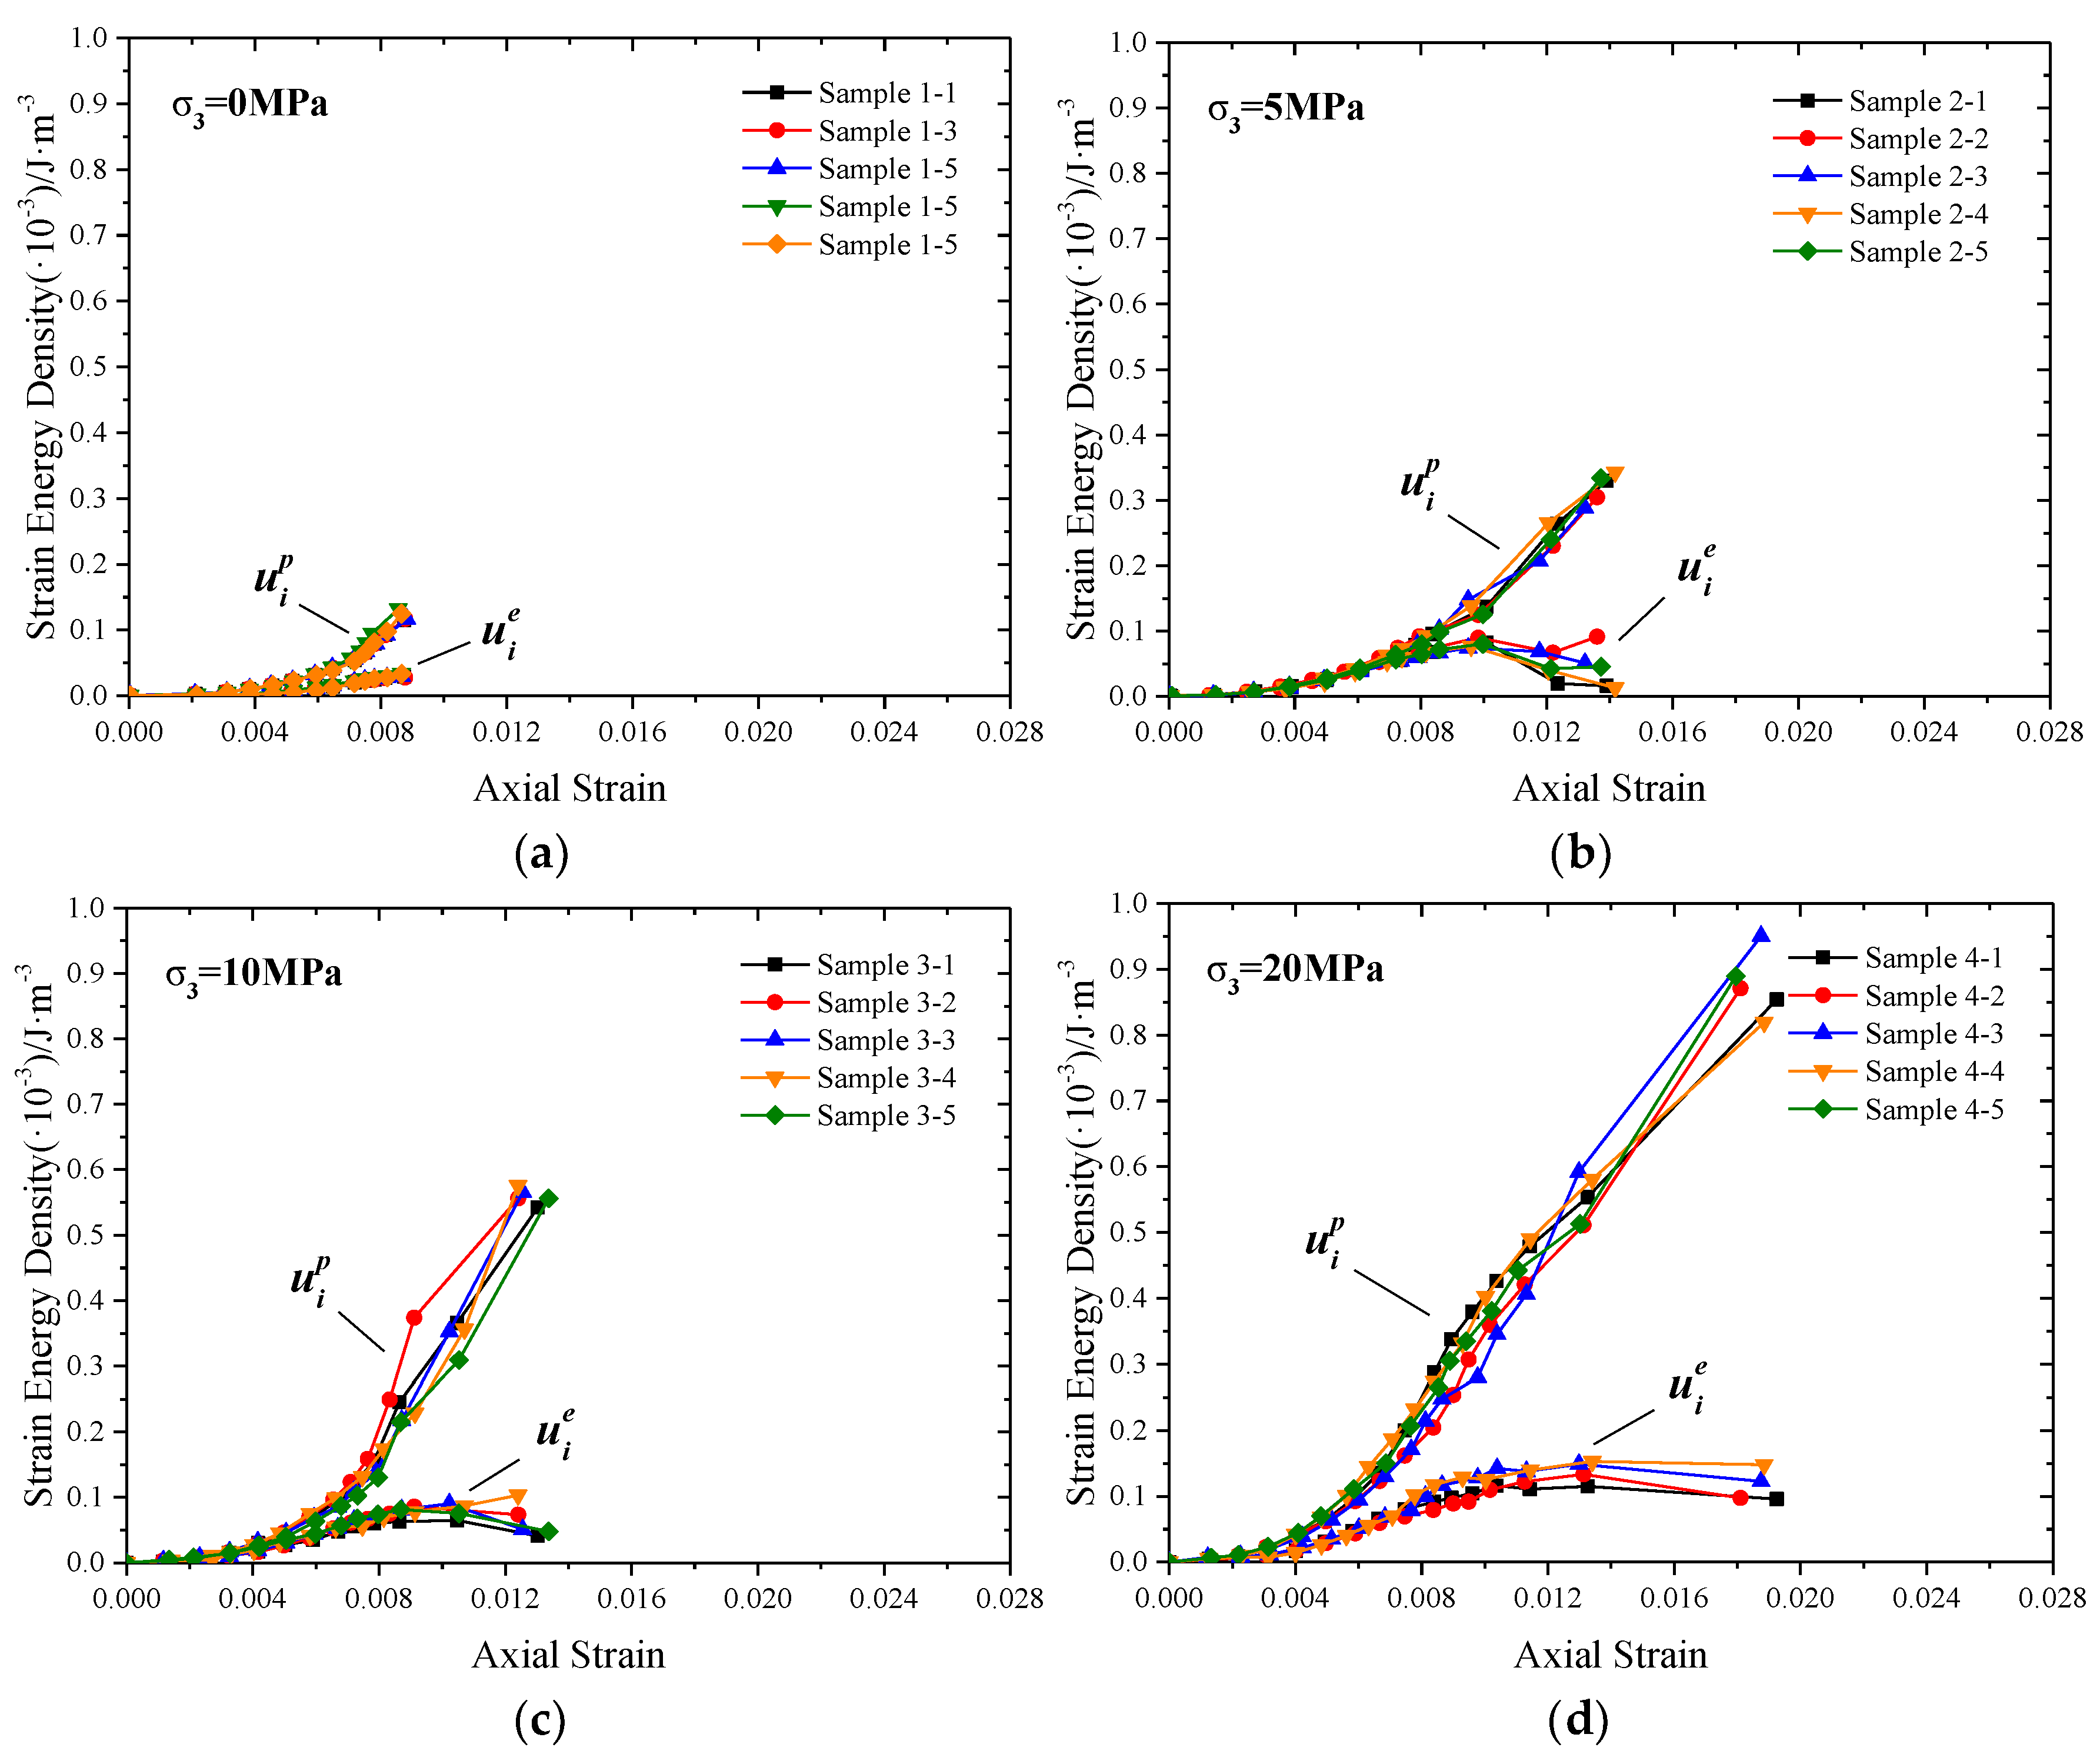
Figure 5.
The evolution of and of red sandstone samples under different confining pressures: (a) Confining pressure is 0 MPa; (b) Confining pressure is 5 MPa; (c) Confining pressure is 10 MPa; (d) Confining pressure is 20 MPa.
Figure 5.
The evolution of and of red sandstone samples under different confining pressures: (a) Confining pressure is 0 MPa; (b) Confining pressure is 5 MPa; (c) Confining pressure is 10 MPa; (d) Confining pressure is 20 MPa.

Figure 6.
The distribution of strain energies under different confining pressures obtained after normalization: (a) Confining pressure is 0 MPa; (b) Confining pressure is 5 MPa; (c) Confining pressure is 10 MPa; (d) Confining pressure is 20 MPa.
Figure 6.
The distribution of strain energies under different confining pressures obtained after normalization: (a) Confining pressure is 0 MPa; (b) Confining pressure is 5 MPa; (c) Confining pressure is 10 MPa; (d) Confining pressure is 20 MPa.
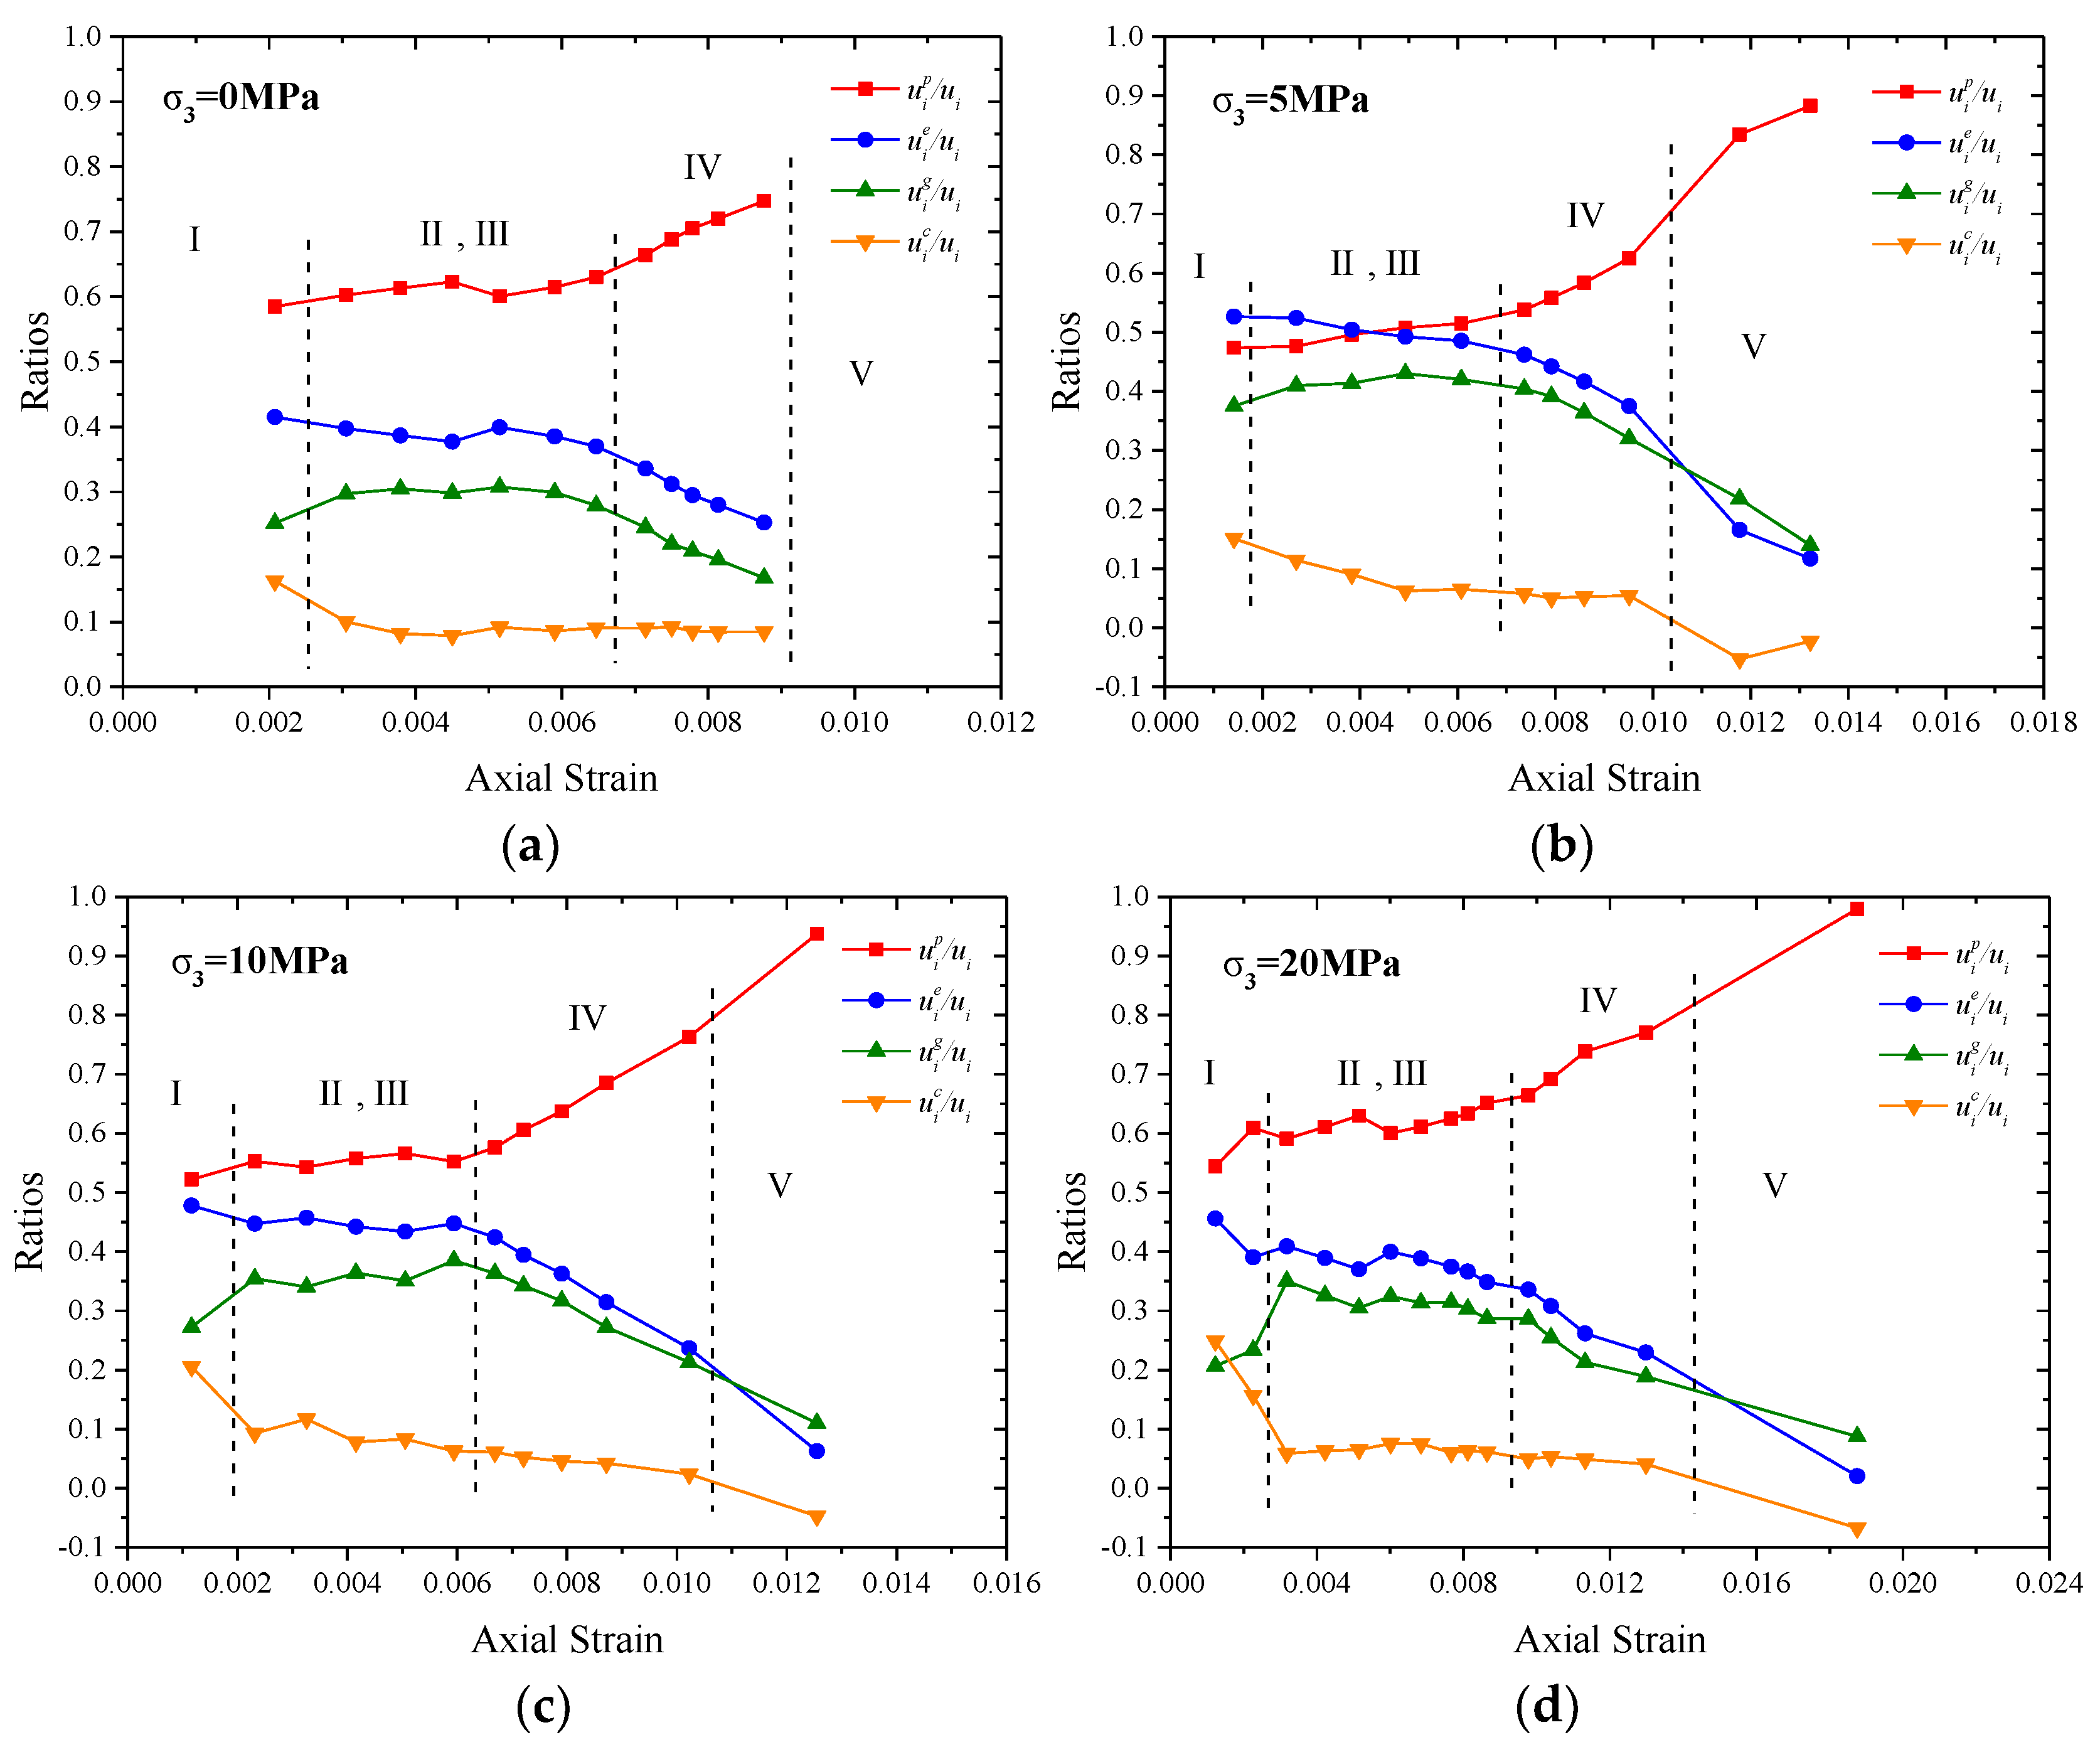
Figure 7.
The relation between the proportion of grain strain energy density to total strain energy density and elastic modulus of different rock while entering the yield stage: (a) Coal; (b) Sandstone; (c) Basalt; (d) Marble; (e) Granite.
Figure 7.
The relation between the proportion of grain strain energy density to total strain energy density and elastic modulus of different rock while entering the yield stage: (a) Coal; (b) Sandstone; (c) Basalt; (d) Marble; (e) Granite.
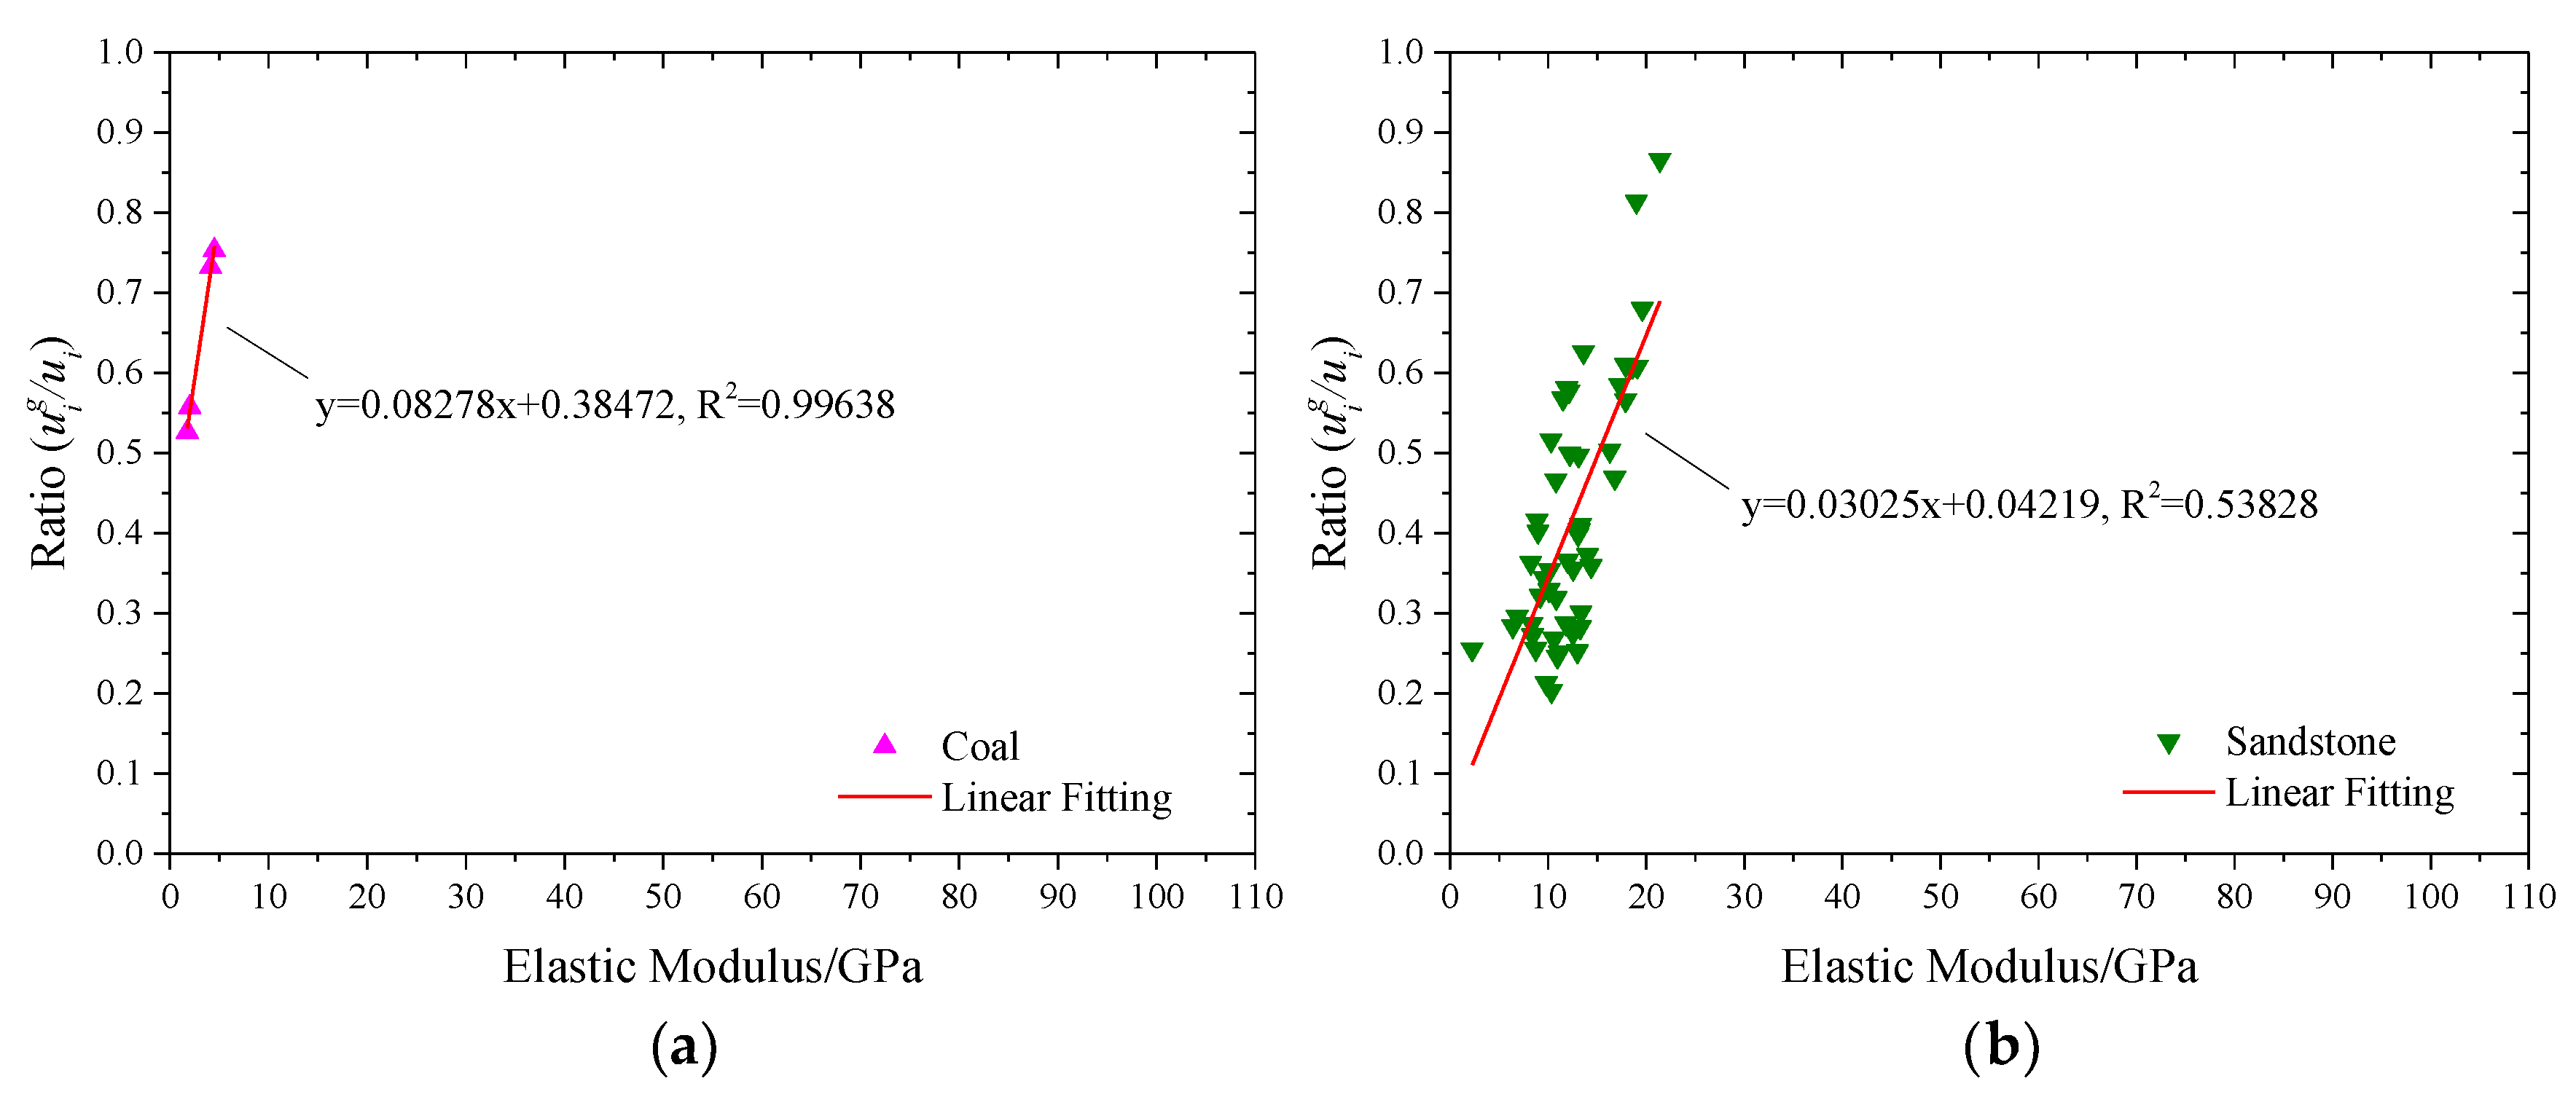
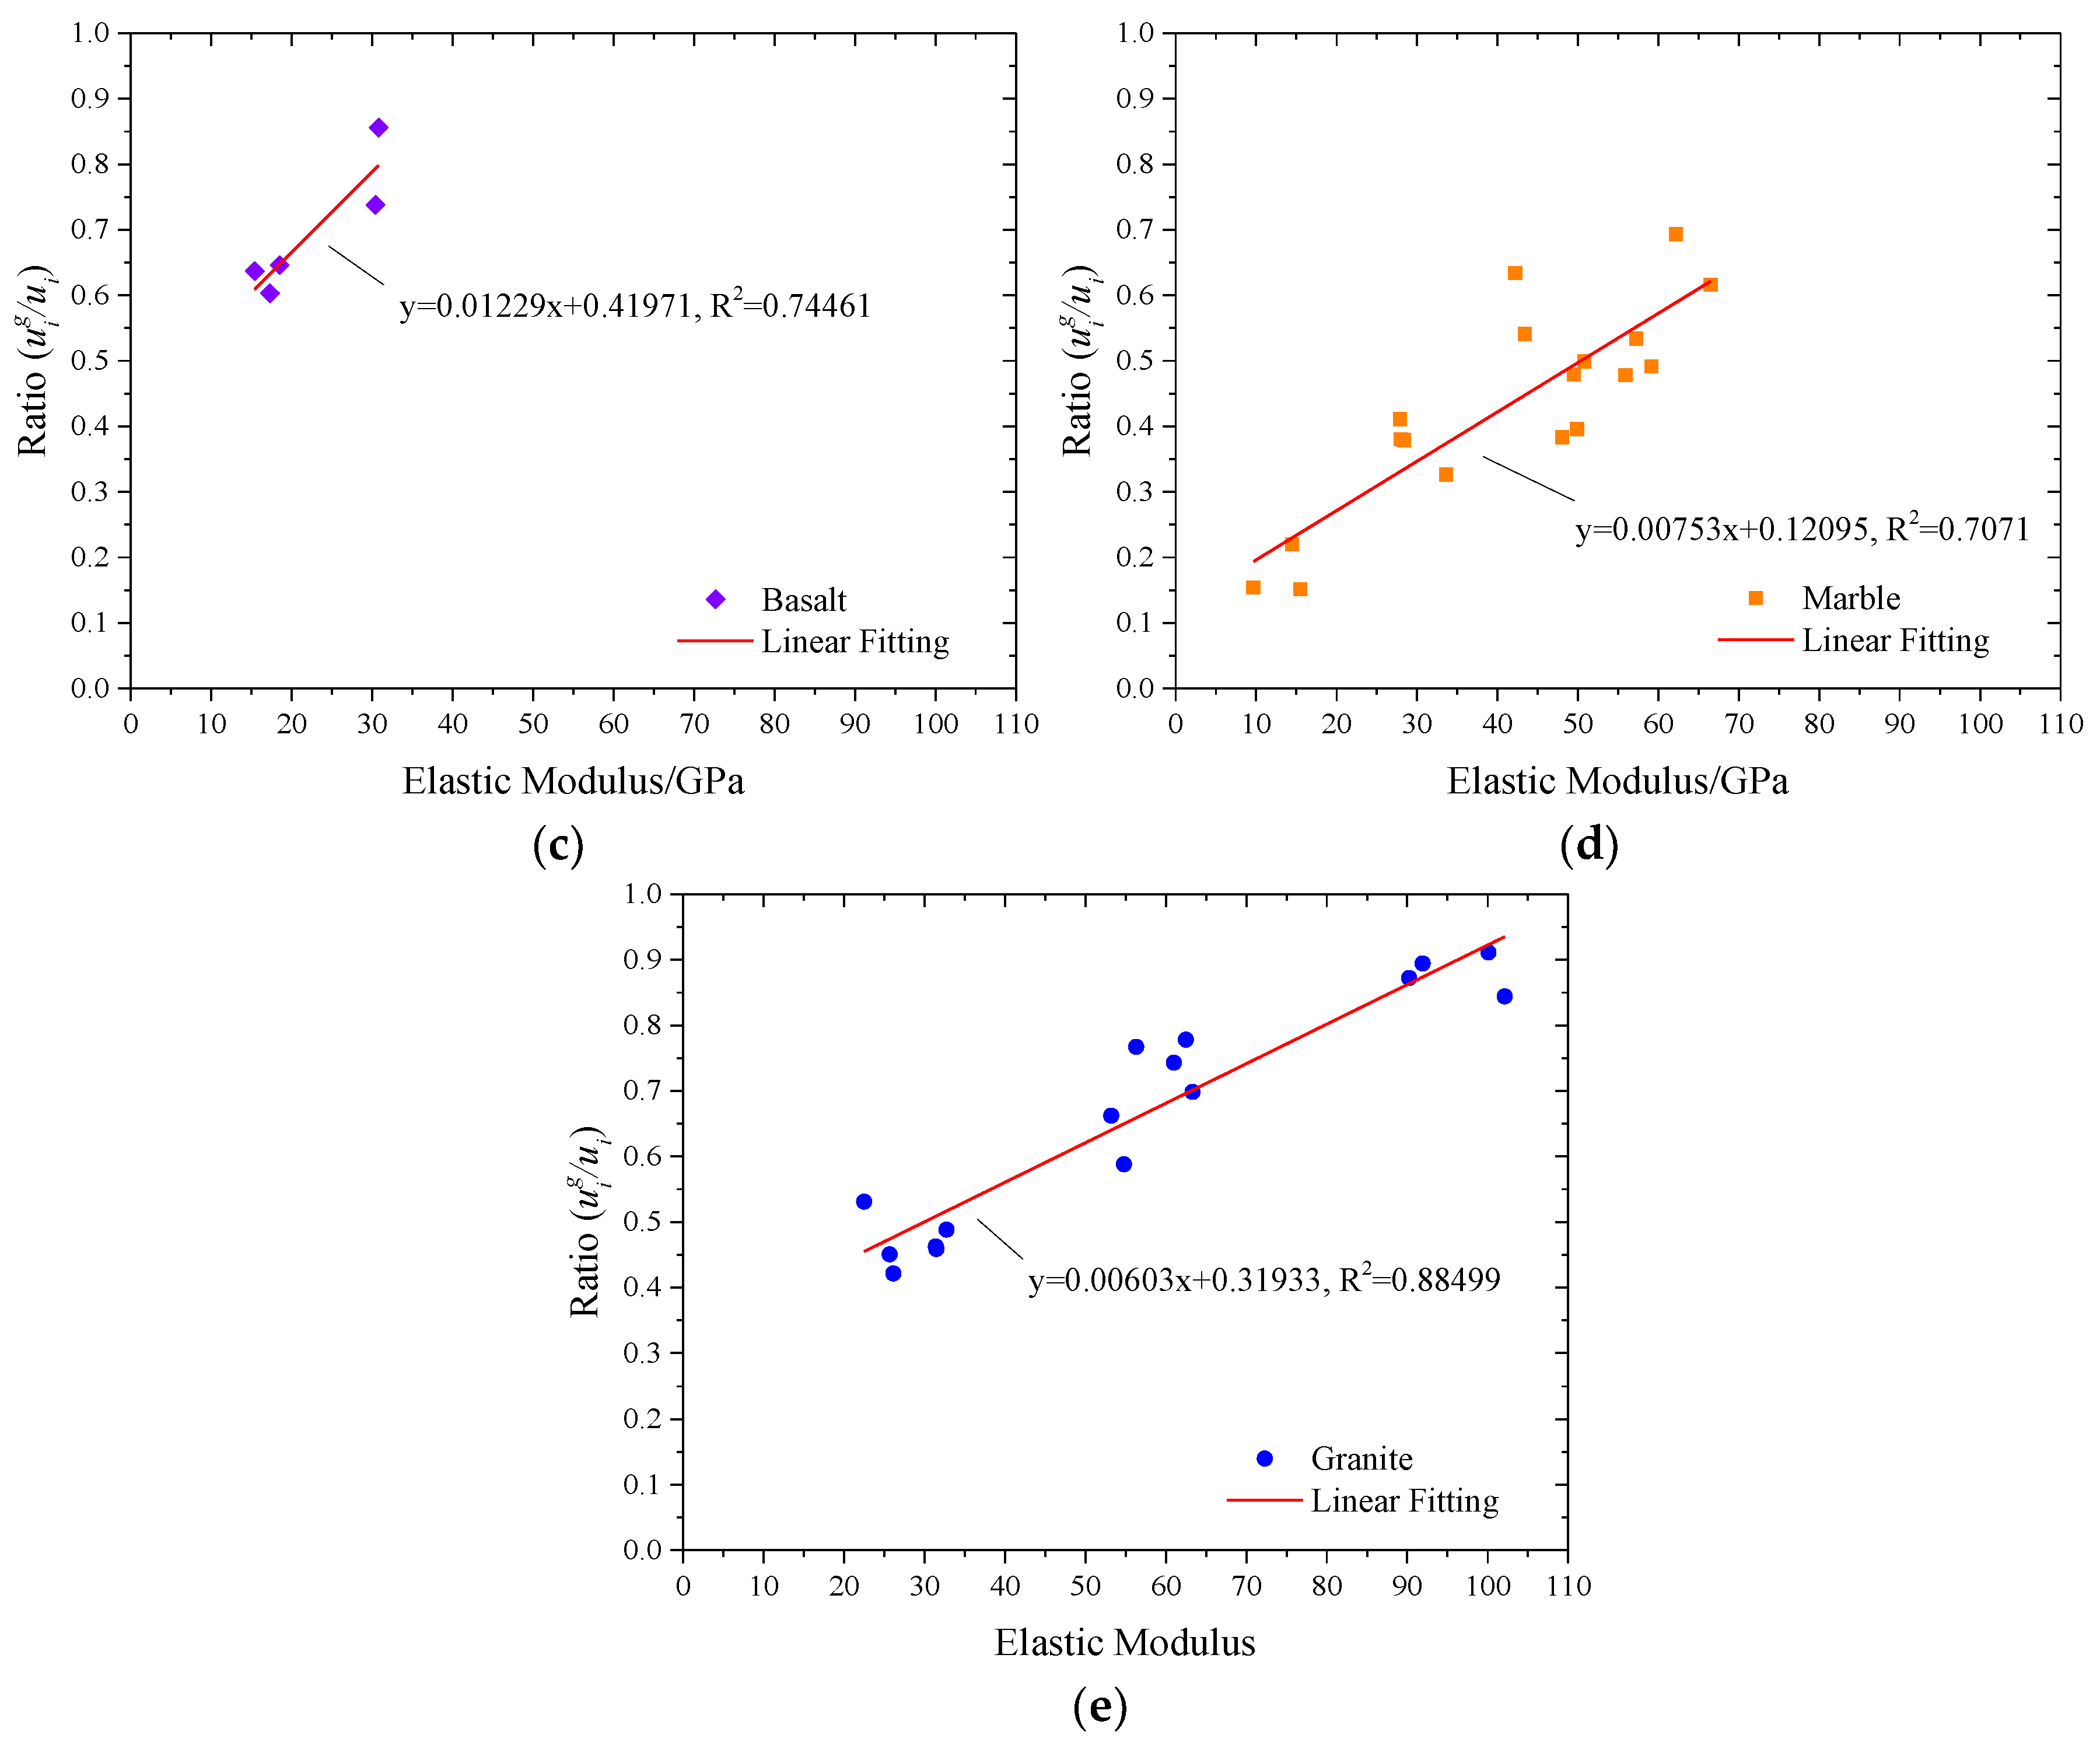
Figure 8.
The proportion of crack strain energy density to total strain energy density of different rock samples in the pre-peak stage.
Figure 8.
The proportion of crack strain energy density to total strain energy density of different rock samples in the pre-peak stage.


Table 1.
The stress and strain at each stage of red sandstone sample’s deformation under different confining pressures.
Table 1.
The stress and strain at each stage of red sandstone sample’s deformation under different confining pressures.
| σ3 (MPa) | E (GPa) | σcd (MPa) | εcd | σp (MPa) | εp |
|---|---|---|---|---|---|
| 0 | 2.79 | 18.69 | 0.0064 | 24.92 | 0.0093 |
| 5 | 4.42 | 30.95 | 0.0068 | 38.15 | 0.0109 |
| 10 | 5.27 | 38.23 | 0.0071 | 49.75 | 0.0118 |
| 20 | 8.75 | 51.84 | 0.0083 | 67.87 | 0.0161 |
Table 2.
Basic information of the samples and test conditions from literature.
| No. | Rock Type | Number of Data | σ3 (MPa) | References |
|---|---|---|---|---|
| 1 | Marble | 6 | 0 | [43] |
| 2 | Marble | 4 | 40 | [44] |
| 3 | Granite | 4 | 10 | [32] |
| 4 | Coal | 1 | 0 | [44] |
| 5 | Coal | 1 | 10 | [21] |
| 6 | Sandstone | 1 | 10 | [21] |
| 7 | Granite | 1 | 10 | [21] |
| 8 | Marble | 1 | 5 | [37] |
| 9 | Sandstone | 1 | 0 | [45] |
| 10 | Sandstone | 1 | 0 | [17] |
| 11 | Sandstone | 2 | 0 | [46] |
| 12 | Sandstone | 6 | 0 | [47] |
| 13 | Sandstone | 1 | 0 | [48] |
| 14 | Basalt | 5 | 0 | [49] |
| 15 | Granite | 1 | 0 | [2] |
| 16 | Sandstone | 37 | 0 | [23] |
| 17 | Coal | 2 | 3 | [22] |
| 18 | Marble | 1 | 20 | [50] |
| 19 | Marble | 1 | 35 | [50] |
| 20 | Marble | 1 | 50 | [50] |
| 21 | Marble | 2 | 5 | [51] |
| 22 | Marble | 1 | 20 | [51] |
| 23 | Marble | 1 | 40 | [51] |
| 24 | Granite | 3 | 2 | [52] |
| 25 | Granite | 1 | 5 | [52] |
| 26 | Granite | 1 | 7 | [52] |
| 27 | Granite | 1 | 40 | [53] |
| 28 | Granite | 1 | 1 | [54] |
| 29 | Granite | 1 | 10 | [54] |
| 30 | Granite | 1 | 20 | [54] |
| 31 | Granite | 1 | 30 | [54] |
© 2019 by the authors. Licensee MDPI, Basel, Switzerland. This article is an open access article distributed under the terms and conditions of the Creative Commons Attribution (CC BY) license (http://creativecommons.org/licenses/by/4.0/).
Share and Cite
MDPI and ACS Style
Fu, H.; Wang, S.; Pei, X.; Chen, W. Indices to Determine the Reliability of Rocks under Fatigue Load Based on Strain Energy Method. Appl. Sci. 2019, 9, 360. https://doi.org/10.3390/app9030360
AMA Style
Fu H, Wang S, Pei X, Chen W. Indices to Determine the Reliability of Rocks under Fatigue Load Based on Strain Energy Method. Applied Sciences. 2019; 9(3):360. https://doi.org/10.3390/app9030360
Chicago/Turabian StyleFu, Huanran, Sijing Wang, Xiangjun Pei, and Weichang Chen. 2019. "Indices to Determine the Reliability of Rocks under Fatigue Load Based on Strain Energy Method" Applied Sciences 9, no. 3: 360. https://doi.org/10.3390/app9030360
Note that from the first issue of 2016, this journal uses article numbers instead of page numbers. See further details here.