Article

Full-Scale Label-Free Surface-Enhanced Raman Scattering Analysis of Mouse Brain Using a Black Phosphorus-Based Two-Dimensional Nanoprobe

1
Department of Psychology and Behavioral Sciences, Zhejiang University, Hangzhou 310028, China
2
College of Humanities and Teacher Education, Zhejiang Ocean University, Zhoushan 316000, China
3
MOE Key Laboratory of Laser Life Science & SATCM Third Grade Laboratory of Chinese Medicine and Photonics Technology, College of Biophotonics, South China Normal University, Guangzhou 510631, Guangdong, China
4
Institute for Brain Research and Rehabilitation, South China Normal University, Guangzhou 510631, Guangdong, China
*
Author to whom correspondence should be addressed.
Appl. Sci. 2019, 9(3), 398; https://doi.org/10.3390/app9030398
Submission received: 29 November 2018 / Revised: 27 December 2018 / Accepted: 17 January 2019 / Published: 24 January 2019
(This article belongs to the Special Issue Surfaced Enhanced Raman Scattering (SERS) in Disease Diagnosis)

Abstract

:
The brain takes the vital role in human physiological and psychological activities. The precise understanding of the structure of the brain can supply the material basis for the psychological behavior and cognitive ability of human beings. In this study, a fast molecular fingerprint analysis of mouse brain tissue was performed using surface-enhanced Raman scattering (SERS) spectroscopy. A nanohybrid consisting of flake-like black phosphorus (BP) and Au nanoparticles (BP-AuNSs) served as the novel SERS substrate for the spectral analysis of brain tissue. BP-AuNSs exhibited outstanding SERS activity compared to the traditional citrate-stabilized Au nanoparticles, which could be largely ascribed to the plentiful hot spots formed in the BP nanosheet. Rapid, full-scale and label-free SERS imaging of mouse brain tissue was then realized with a scanning speed of 56 ms per pixel. Fine textures and clear contour were observed in the SERS images of brain tissue, which could be well in accordance with the classical histological analysis; however, it could avoid the disadvantages in the processing procedure of tissue section. Additionally, the SERS spectra illustrated plentiful biochemical fingerprint of brain tissue, which indicated the molecular composition of various encephalic regions. The SERS difference spectrum of the left versus right hemisphere revealed the biochemical difference between the two hemispheres, which helped to uncover the psychological and cognitive models of the left and right hemispheres.

Graphical Abstract

1. Introduction

Human physiological and psychological behavior is closely related to the brain. The brain has the most complex structure in human body. Different encephalic regions control the activities of human movement, consciousness, spirit, feeling, language, learning, memory and so on. The normal mental activity of a person depends on the normal work of a complete brain, while the psychological abnormal behavior or cognitive deficits are often accompanied by the brain injury. For example, cerebral atrophy is the most obvious feature of an Alzheimer disease (AD) patient. Clinically, AD subtypes can be determined by measuring the ratio of hippocampal volume to cortical volume, which helps to predict the degree of cognitive decline in patients [1]. In the patients with cognitive impairment induced by craniopharyngioma, the structure of white matter in the regions of left ventral cingulum and dorsal cingulum is changed and the hippocampus volume becomes smaller, which can lead to a decrease in patients’ general knowledge and episodic visual memory [2]. The decline of gray matter density in vermis and tonsil of cerebellum has also been measured in early schizophrenia patients accompanied with cognitive deficits [3]. Therefore, the detailed interpretation of the brain structure contributes to unravel the components and functions of various encephalic regions and further provides the physiological basis for the mental behavior and cognitive ability of human beings.
Raman spectroscopy has been widely applied as a powerful non-invasive analytical tool in physics, chemistry and biomedicine. As a molecular vibrational spectrum, Raman can not only provide the fingerprint information about the molecular component and structure, but also realize the label-free spectral imaging of the samples by combining the scanning technique [4]. In the field of neuroscience, Raman spectroscopy has been successfully applied to the component analysis of brain tissue, disease detection and bioimaging [5,6,7,8,9]. Amharref et al. used Raman spectroscopy to distinguish the normal, necrotic and tumor cells in the rat brain tissues [10]. For clinical samples, Kast et al. found that the Raman peak ratio of the 1300 to 1344 cm−1 in gray matter is significantly different from that in white matter, which could be used as the label to separates the boundary between gray matter and white matter [11]. Raman spectroscopy can also be used to assist in the diagnosis of AD. The Raman signals attributed to protein, lipid and cholesterol have been detected to arise obviously in the hippocampus of AD rats compared to that in normal rats [12]. However, the signal of normal Raman scattering is extremely low because of the inherently weak cross sections; thus, acquiring an effective scattering signal often requires a long collecting time or a high laser power, which is somewhat unrealistic for long-term bioanalysis and biomedical imaging. It often takes several hours or more to get a distinguishable Raman image of biological sample [13,14].
Surface-enhanced Raman scattering (SERS) is capable of enhancing the Raman signals of molecules by up to several orders of magnitude [15]. Liquid SERS substrates, such as Au and Ag nanoparticles (NPs), are the effective SERS-active substrates most used in bioanalysis due to their flexibility that can conform to various contours of substrates [4]. Aydin et al. have interpreted the difference between normal tissue and pathological tissue in brain tumor patients using the SERS technique, and revealed that the ratio of nucleic acid to protein was obviously increased in tumor tissue, indicating that SERS would be a rapid and simple technique for the clinical diagnosis of brain tumors [16]. However, traditional metal particles still face a dilemma in relatively low Raman enhancement effect [17]. The development of SERS substrate provides more opportunities for biological applications. Recently, two-dimensional (2D) nanomaterial-based SERS substrates have garnered considerable attention for their excellent SERS activities. 2D nanomaterials can serve as a stable “nano-island” to support the metal nanoparticles in liquid environment. Additionally, an amount of SERS “hot spots” form in the interstices among the fixed nanoparticles that provide fine electromagnetic enhancement effect [18,19]. Moreover, the 2D materials can offer extra chemical enhancement originated from the charge transfer between the nanosheet and molecule [20].
As a novel 2D nanomaterial, black phosphorus (BP) has exhibited promising potentials for theranostic applications [21,22,23,24,25,26]. BP can also serve as a neuroprotective nanomaterial to protect neuronal cells from copper ion-induced neurotoxicity [27]. Recently, we have proposed a facile strategy for the synthesis of BP-Au nanocomposites; the nanohybrids showed outstanding SERS activity, which allowed for real-time in vivo SERS monitoring of the changes in the biochemical components of tumor tissues during the photothermal therapy, indicating the potential for SERS bioanalysis [28]. For neuroscience research, it is valuable to describe the chemical composition of brain tissue in a large region which is difficult to achieve using normal Raman spectroscopy. Herein, label-free, full-scale and rapid SERS imaging of brain tissue section of mouse using the BP-based 2D SERS substrate was carried out for the first time. The Raman spectral lines were also extracted from the Raman images to elaborate the molecular information of biochemical components in various encephalic regions.

2. Materials and Methods

2.1. Materials

The bulk BP crystals were purchased from a commercial supplier (XFNANO, Nanjing, China). Chloroauric acid (HAuCl4·4H2O) and N-methyl-2-pyrrolidone (NMP) were obtained from the China National Medicine Corporation (Shanghai, China). 2-[2-[2-chloro-3-[(1,3-dihydro-3, 3-dimethyl-1-propyl-2H-indol-2-ylidene)ethylidene]-1-cyclohexen-1-yl]ethenyl]-3, 3-dimethyl-1-propylindolium (IR-780) iodide and crystal violet (CV) were purchased from Sigma-Aldrich (St. Louis, MO, USA). Other reagents were of analytical grade and were used as received without further purification. Deionized water (Milli-Q System, Bedford, MA, USA) was used in all experiments.

2.2. Preparation of 2D SERS Substrate

The 2D BP nanosheets were prepared according to the literature with some modification [29]. BP-Au nanosheets (BP-AuNSs) were then synthesized using the self-reducibility of BP nanomaterials [28]. In detail, BP (12.5 μg/mL) and HAuCl4 (75 μM) were added into the boiling ultrapure water for 2 min to allow the formation of BP-AuNSs. The as-prepared 2D SERS substrate was then purified by centrifugation (6000 rpm, 10 min). The citrate-stabilized AuNPs were prepared according to the classical procedure using sodium citrate as the reductant [30].

2.3. Characterization

The ultraviolet-visible-near infrared (UV-vis-NIR) absorbance spectra were acquired by a UV-vis-NIR spectrometer (UV-6100, MAPADA, Shanghai, China). Transmission electron microscopic (TEM) analysis was performed using a FEI Tecnai G2 Spirit T12 (Hillsboro, OR, USA) operated at 120 kV equipped with an energy-dispersive x-ray (EDX) spectrometer (Quad XFlash 5060, Bruker Corporation, Billerica, MA, USA). The Raman features of BP-based nanostructures were analyzed with a Renishaw inVia microspectrometer (Derbyshire, UK) equipped with the excitation source at wavelength of 514.5 nm (grating: 1800 l/mm).

2.4. SERS Activity of BP-AuNSs

The SERS activity of BP-AuNSs was evaluated using two traditional dye molecules as the Raman reporters, IR-780 and CV. 200 μM of BP-AuNSs was mixed with equal amounts of dye molecules (IR-780 (1 μM) and CV (10 μM)); then, the mixture was placed onto the silicon wafer for Raman analysis. Raman spectra were obtained using the Renishaw spectrometer with a NIR laser at 785 nm (grating: 1200 l/mm). A 20× objective was used to focus the laser beam and to collect the Raman signal. The Raman spectra were recorded in static mode over a wavenumber range of 620–1720 cm−1. All experiments were carried out independently at least three times.

2.5. SERS Analysis of Brain Tissue

Three female Balb/c mice (5–6 weeks old) were purchased from Laboratory Animal Center of Sun Yat-Sen University, and performed with protocols approved by South China Normal University Animal Care and Use Committee. Two weeks later, the mice were sacrificed and the brain tissues were excised for fixation with 4% buffered formalin. Then the tissue sections were prepared for routine histological examination and Raman measurement. For histological examination, the sections after fixation were processed into paraffin for hematoxylin and eosin (H&E) staining using standard technique, then examined under the microscope. For SERS analysis, the tissue slides were immersed into the BP-AuNSs solution (100 μM) for 1 h, after which the slides were rinsed with ultrapure water three times. Raman spectroscopic measurements of brain sections were performed using the Renishaw inVia confocal Raman system equipped with the 785 nm semiconductor laser and coupled to a Leica DM-2500M microscope (Leica Microsystems GmbH, Wetzlar, Germany). A 63× water immersion objective lens (NA = 0.9) was chosen for tissue detection. Raman spectral mapping was performed in the streamline mode at wavenumber center 1200 cm−1.

3. Results and Discussion

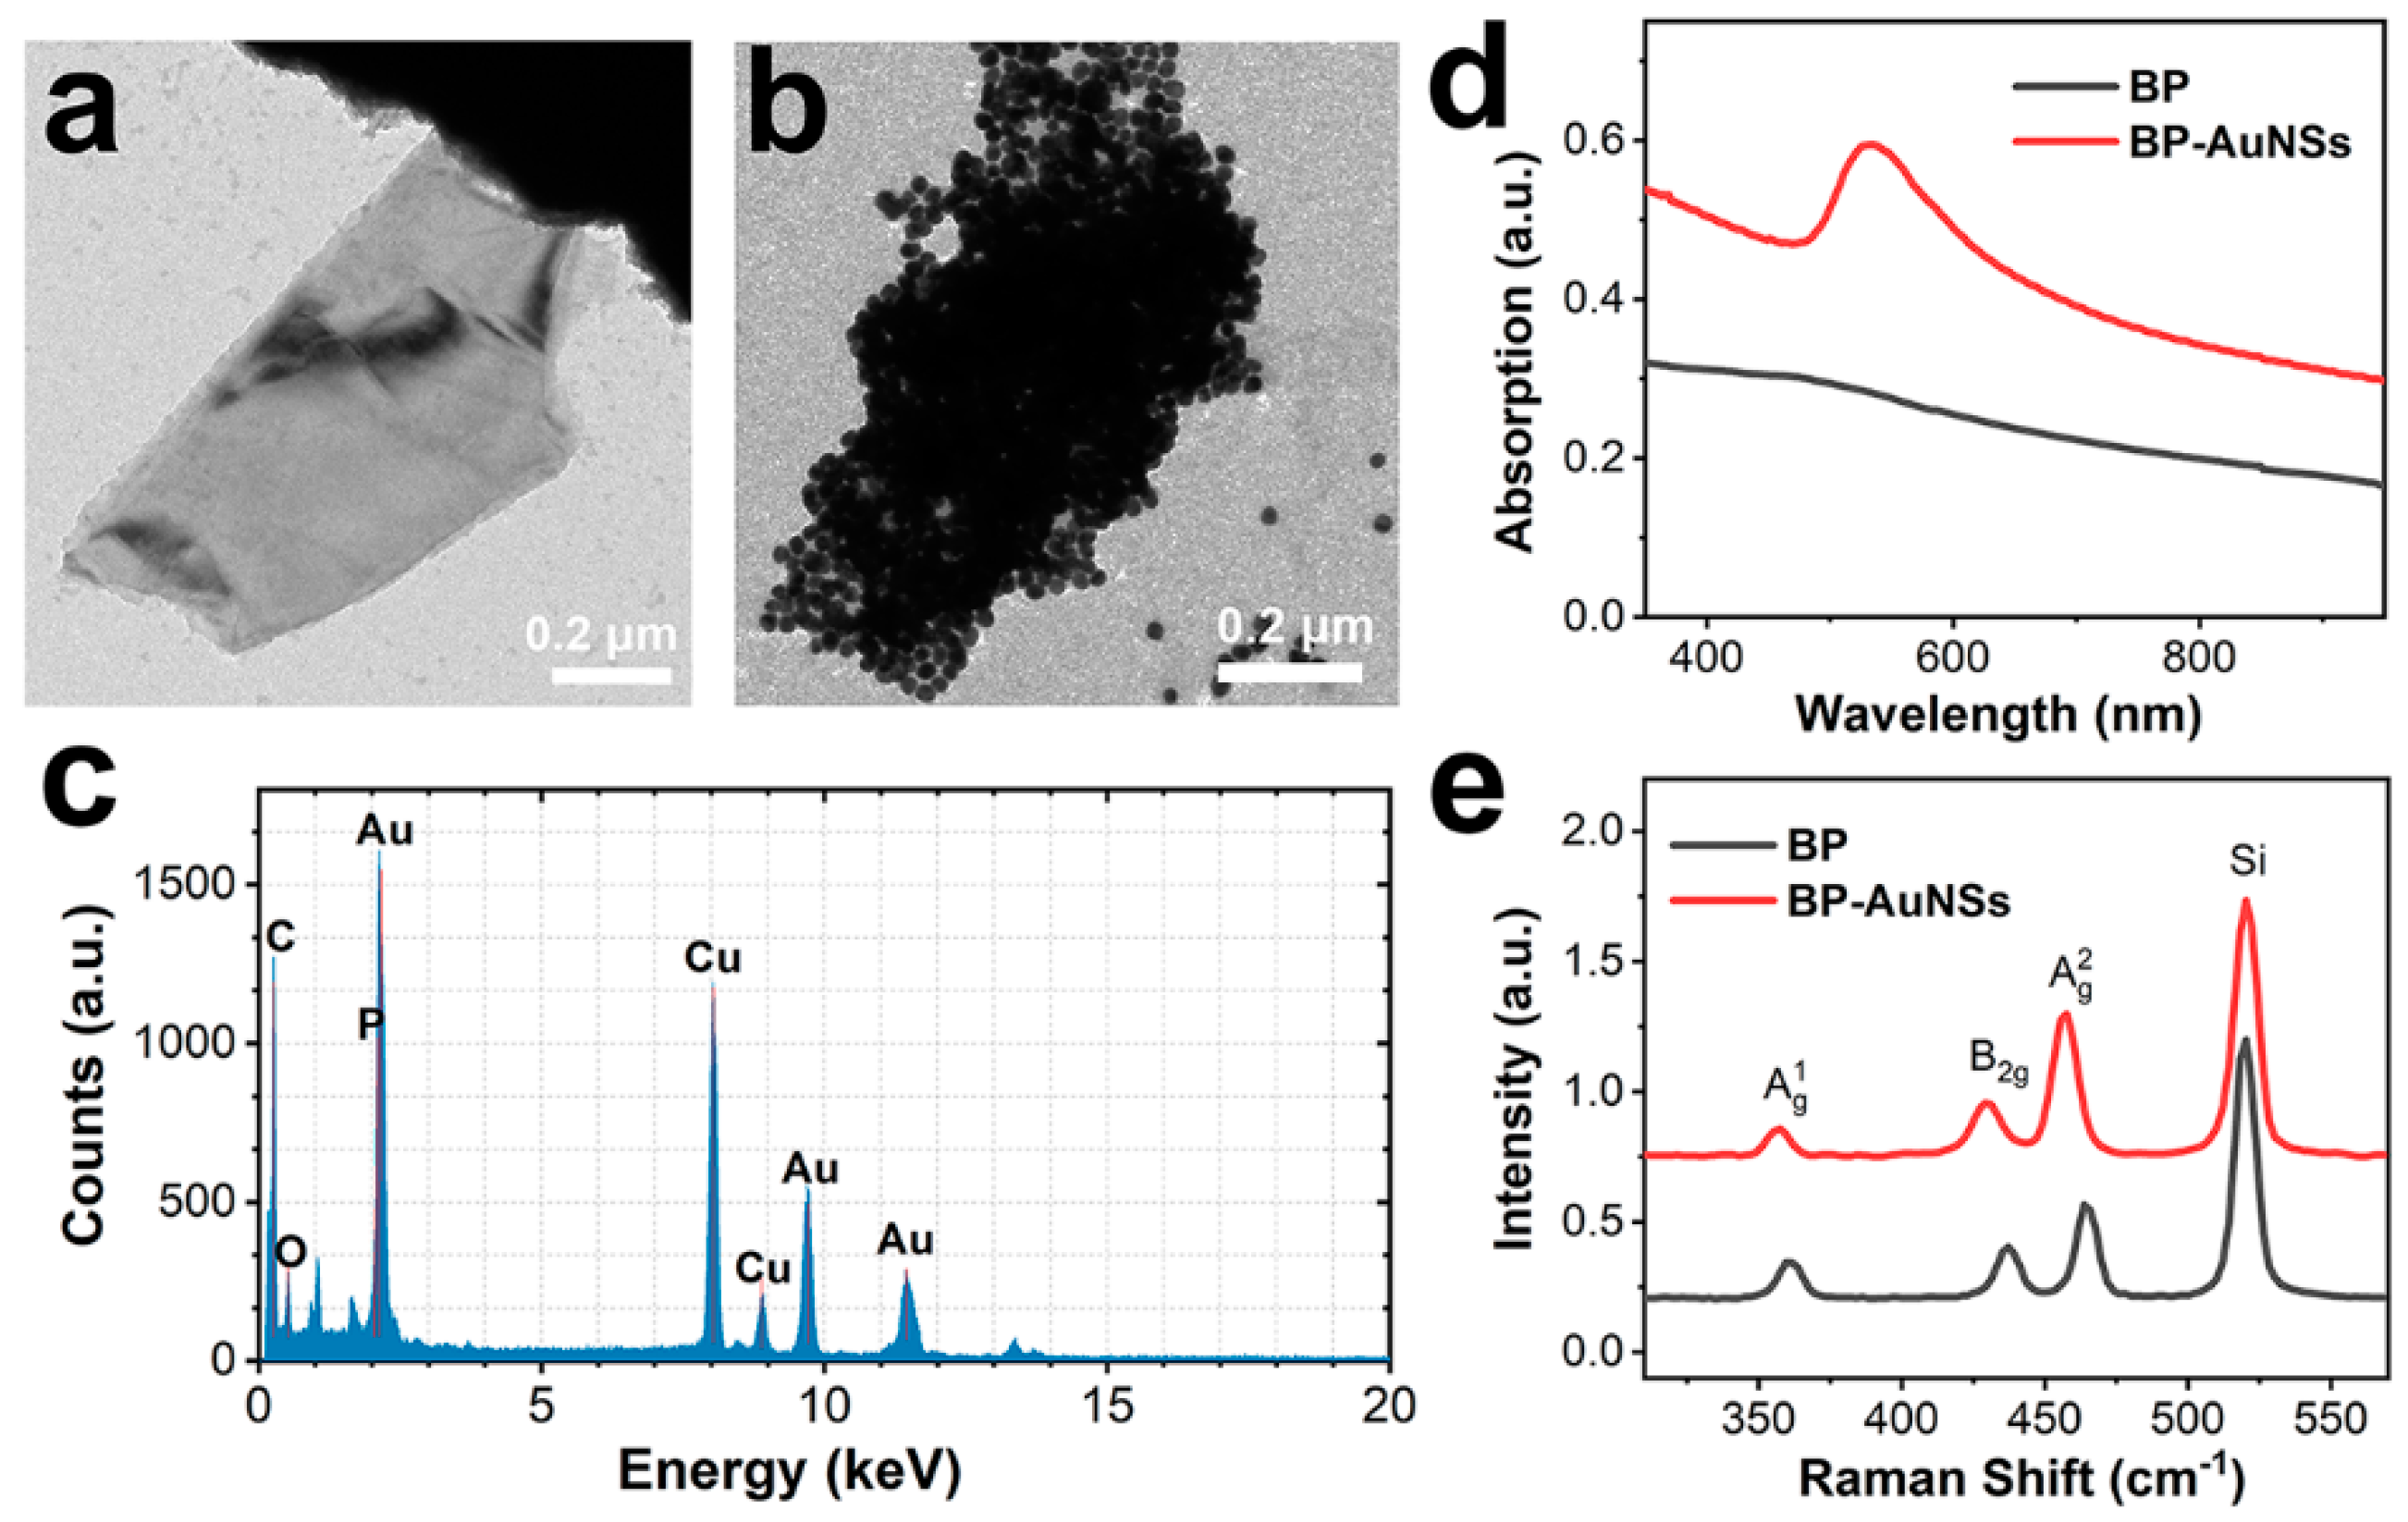
3.1. Characterization of 2D SERS Substrate

The morphologies of BP and BP-Au nanosheets (BP-AuNSs) were detected by transmission electron microscopic (TEM) analysis. As shown in Figure 1a, the BP nanomaterial showed the typical lamellar structure with several hundreds of nanometers in size. After the reaction with the gold salt, the surface of the nanosheet was attached with the spherical Au NPs with a mean size of 26 nm (Figure 1b). The existence of Au and P elements in nanohybrids could be proved by the EDX pattern of BP-AuNSs (Figure 1c). The ultraviolet-visible-near infrared (UV-vis-NIR) absorbance spectrum of BP nanosheet exhibited a decreasing light absorption from UV to NIR region (Figure 1d). A new absorption peak with the central wavelength of 535 nm was observed in the absorption spectrum of BP-AuNSs, further confirming the formation of Au nanoparticles on the BP nanosheets. Figure 1e displayed the Raman spectra of BP and BP-AuNSs, which revealed the three characteristic Raman peaks of BP nanostructure at about 360, 437 and 464 cm−1, assigned to the one out-of-plane phonon mode (A1g) and two in-plane modes (B2g and A2g), respectively [31]. These three bands in the Raman spectrum of BP-AuNSs experienced a slight blue shift, which could be ascribed to the interaction between BP and the metal nanostructures.

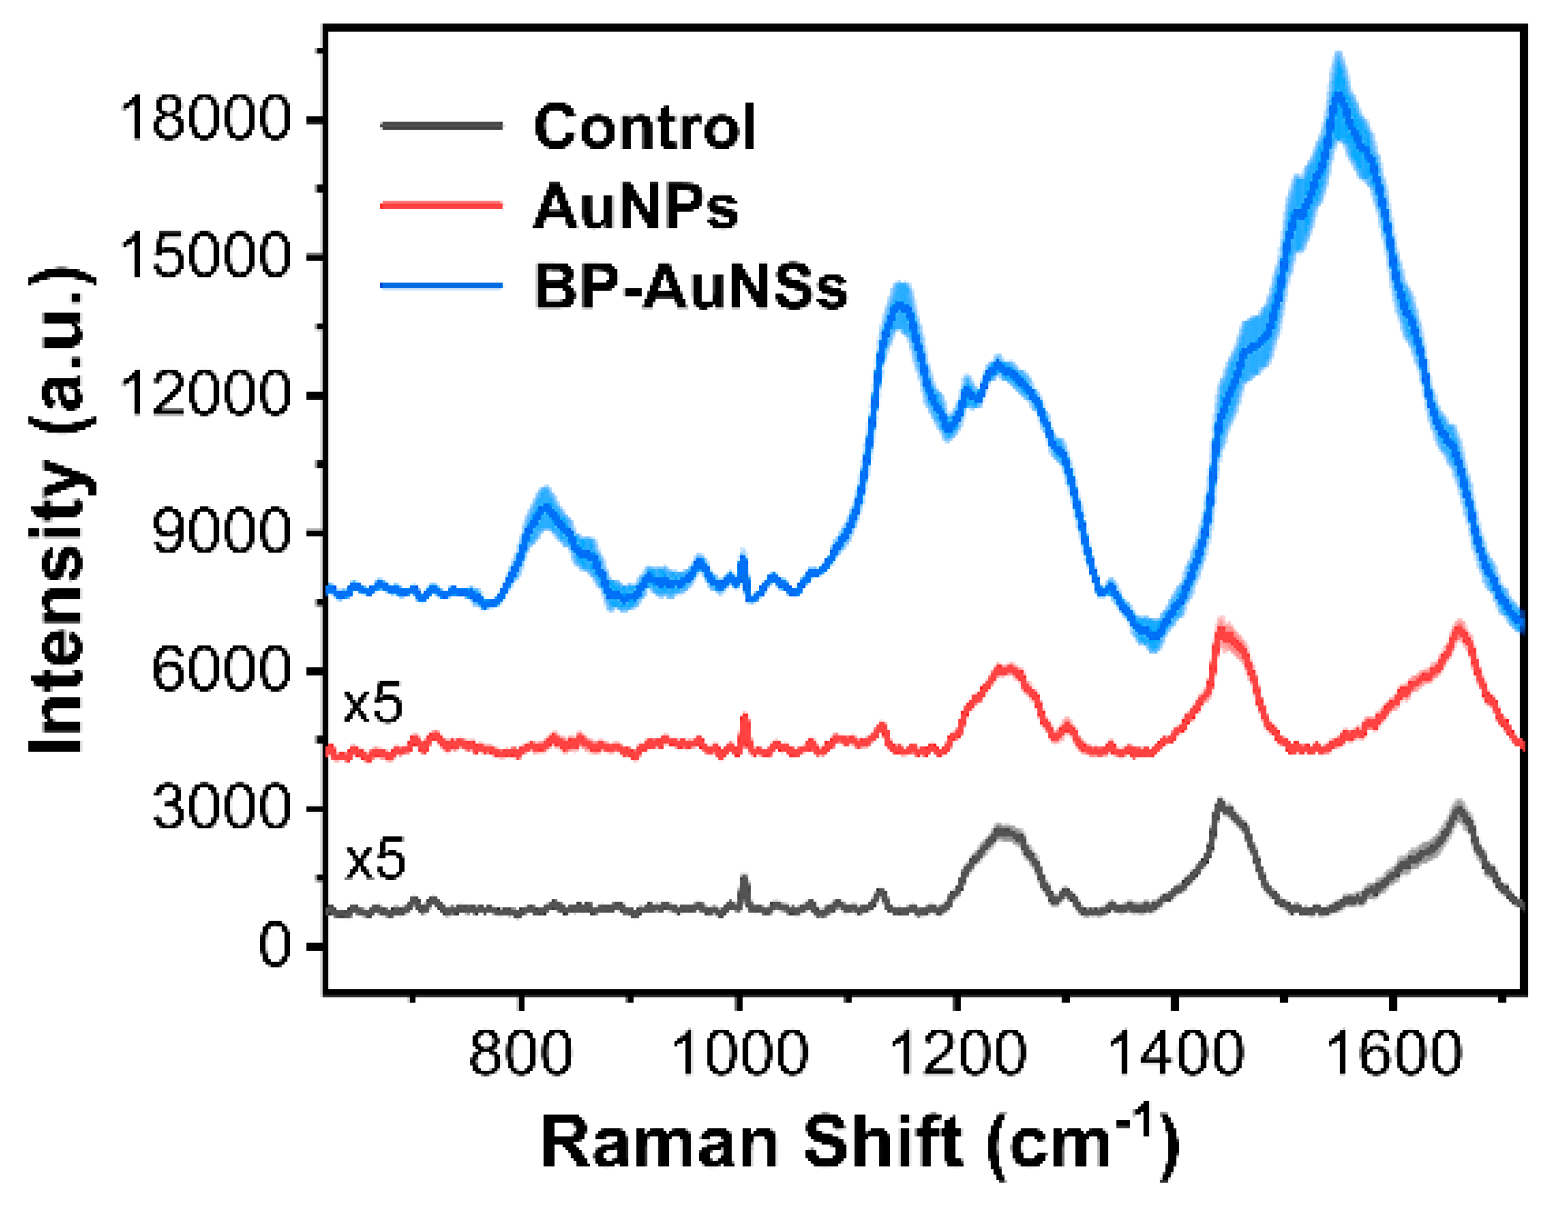
3.2. SERS Performance of BP-AuNSs

To understand the SERS activity of BP-AuNSs, Raman experiments were performed on two typical dyes using BP-AuNSs or citrate-stabilized AuNPs as the SERS substrates. As shown in Figure 2, the normal Raman signals of CV and IR-780 at the concentration of 1 mM were hardly observed under our experimental parameter (1s exposure time, four accumulations). In contrast, the molecular fingerprints of the dyes appeared in the SERS spectra using AuNPs or BP-AuNSs as the SERS substrates. In comparison with citrate-stabilized AuNPs, the traditionally used SERS substrate, the SERS signals induced by BP-AuNSs were remarkably enhanced under the NIR laser excitation. To evaluate quantitatively, the Raman intensity ratios of some characteristic peaks were calculated between the SERS spectra caused by AuNPs and BP-AuNSs. Based on the Raman bands of CV at 1174 cm−1 and IR-780 at 1207 cm−1, the Raman intensities increased about 8~13 times in the BP-AuNSs based SERS nanoplatform compared to that in AuNPs based system. It could be reasonably explained that the Au nanoparticles were almost mono-dispersed in the solution, which resulted in few SERS hot spots. However, for the BP-Au nanohybrids, the BP sheet created a nano-island where a host of gold nanoparticles with various sizes were piled up, leading to plentiful hot spots formed in the nanoscale interstices and junctions among AuNPs. In addition, the charge transfers between BP sheet and the dye molecule may also contribute to the stronger SERS signals induced by BP-AuNSs [32].

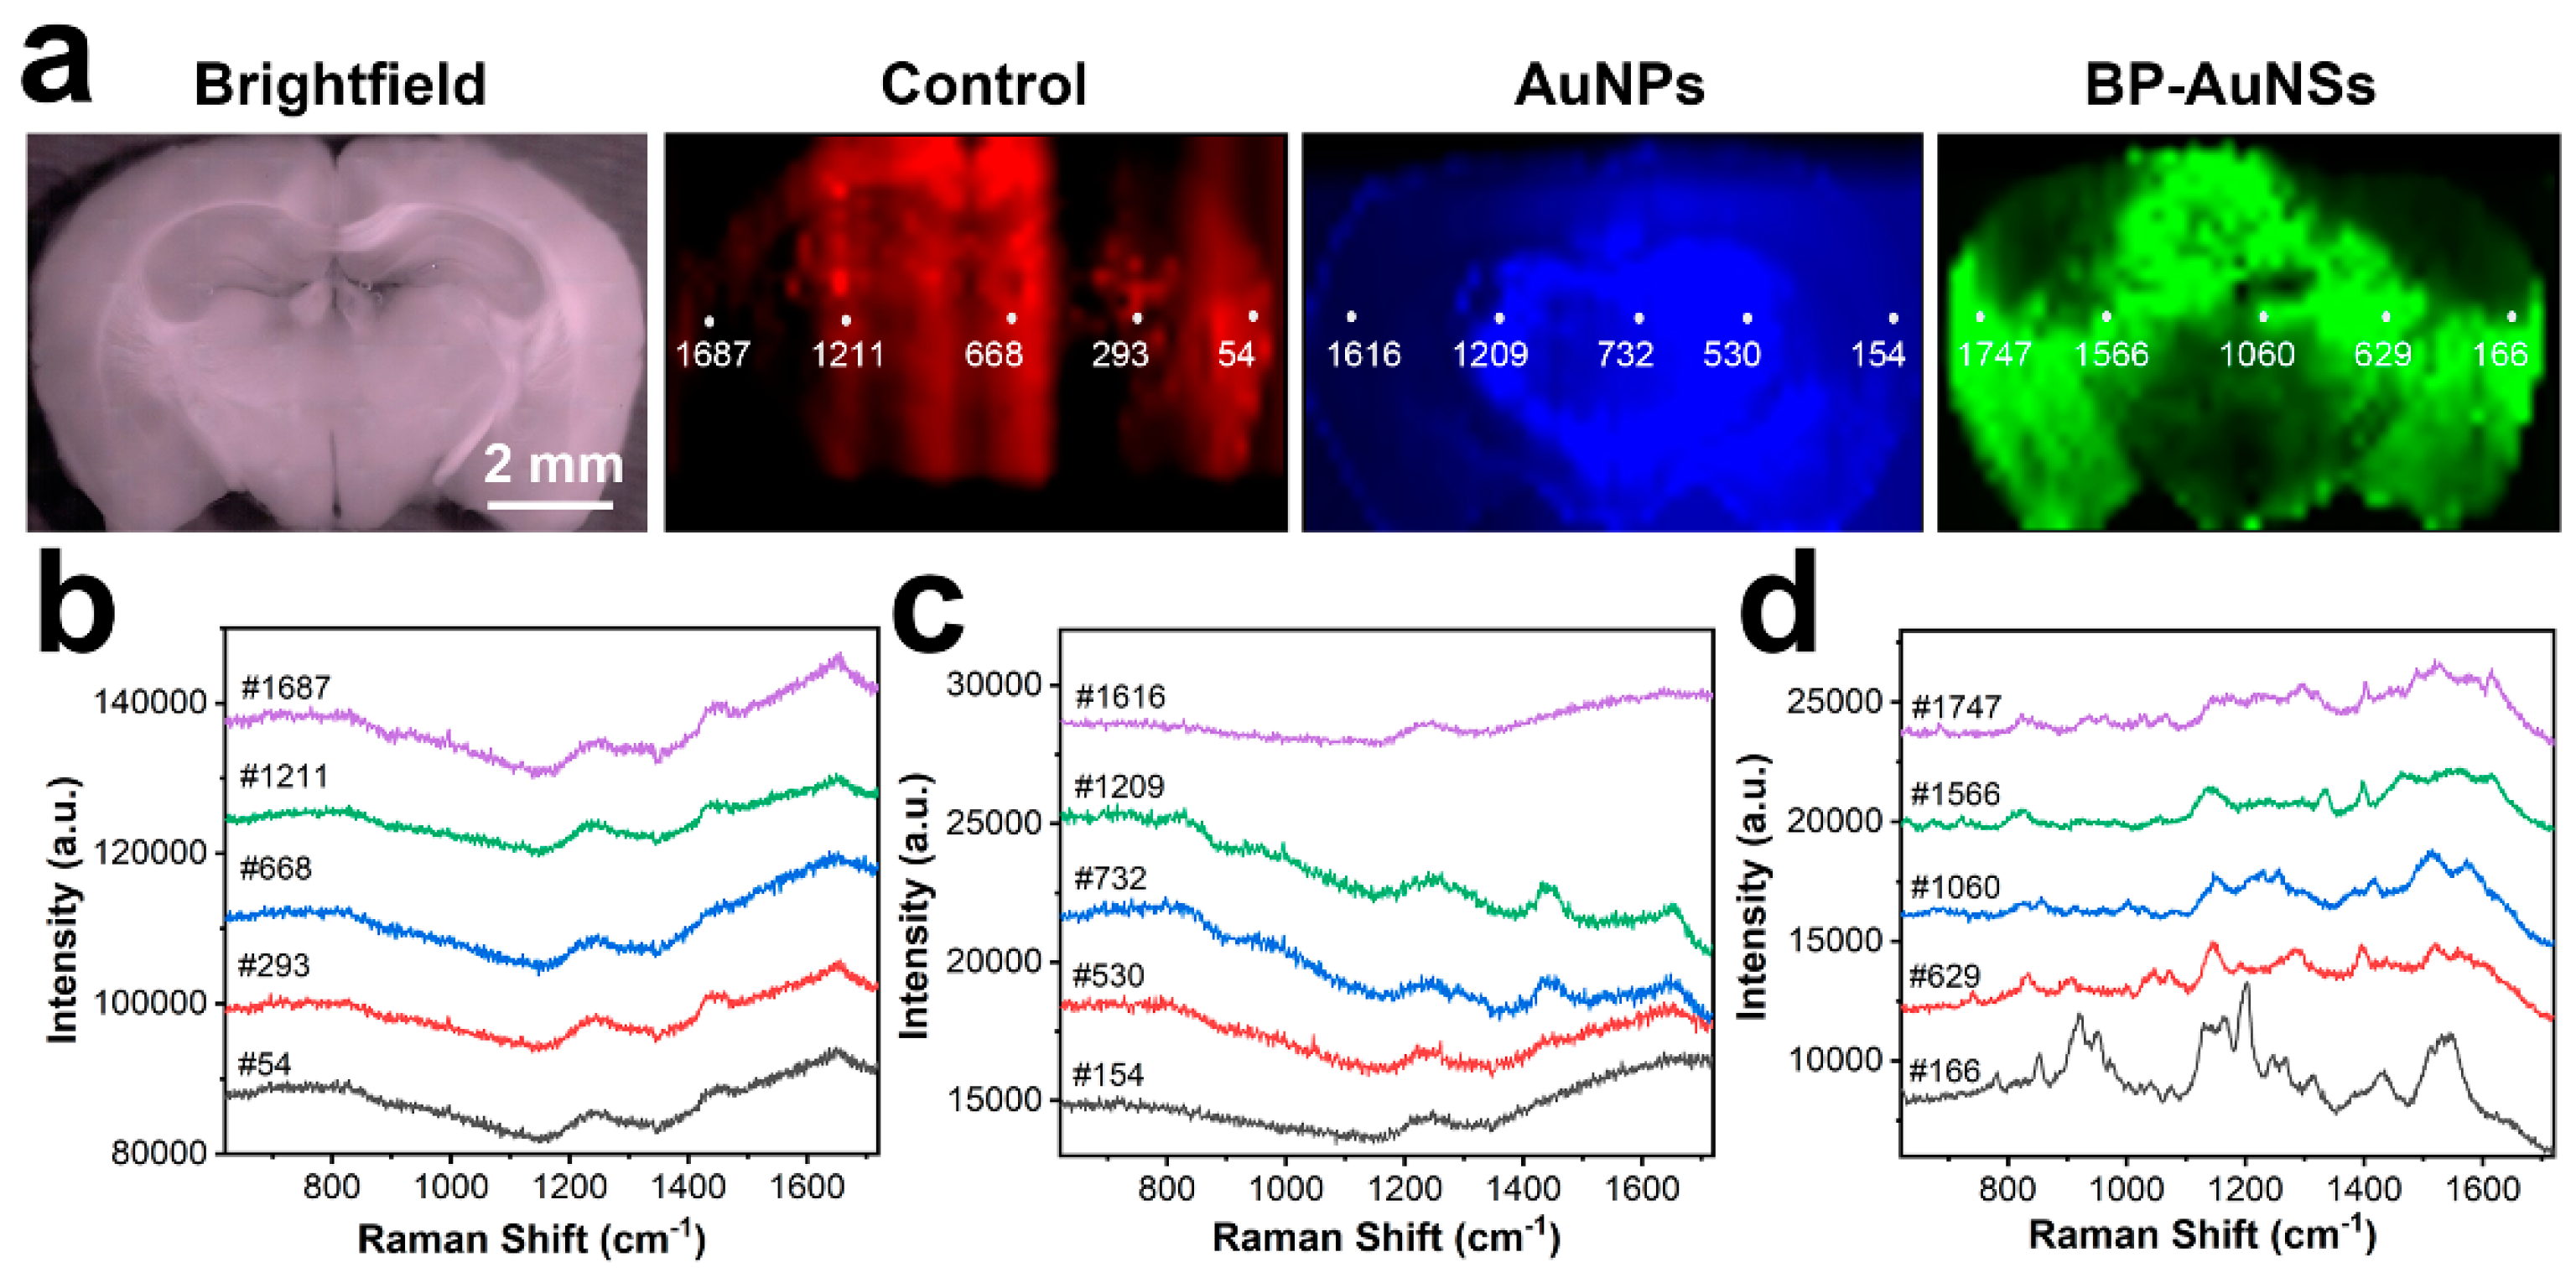
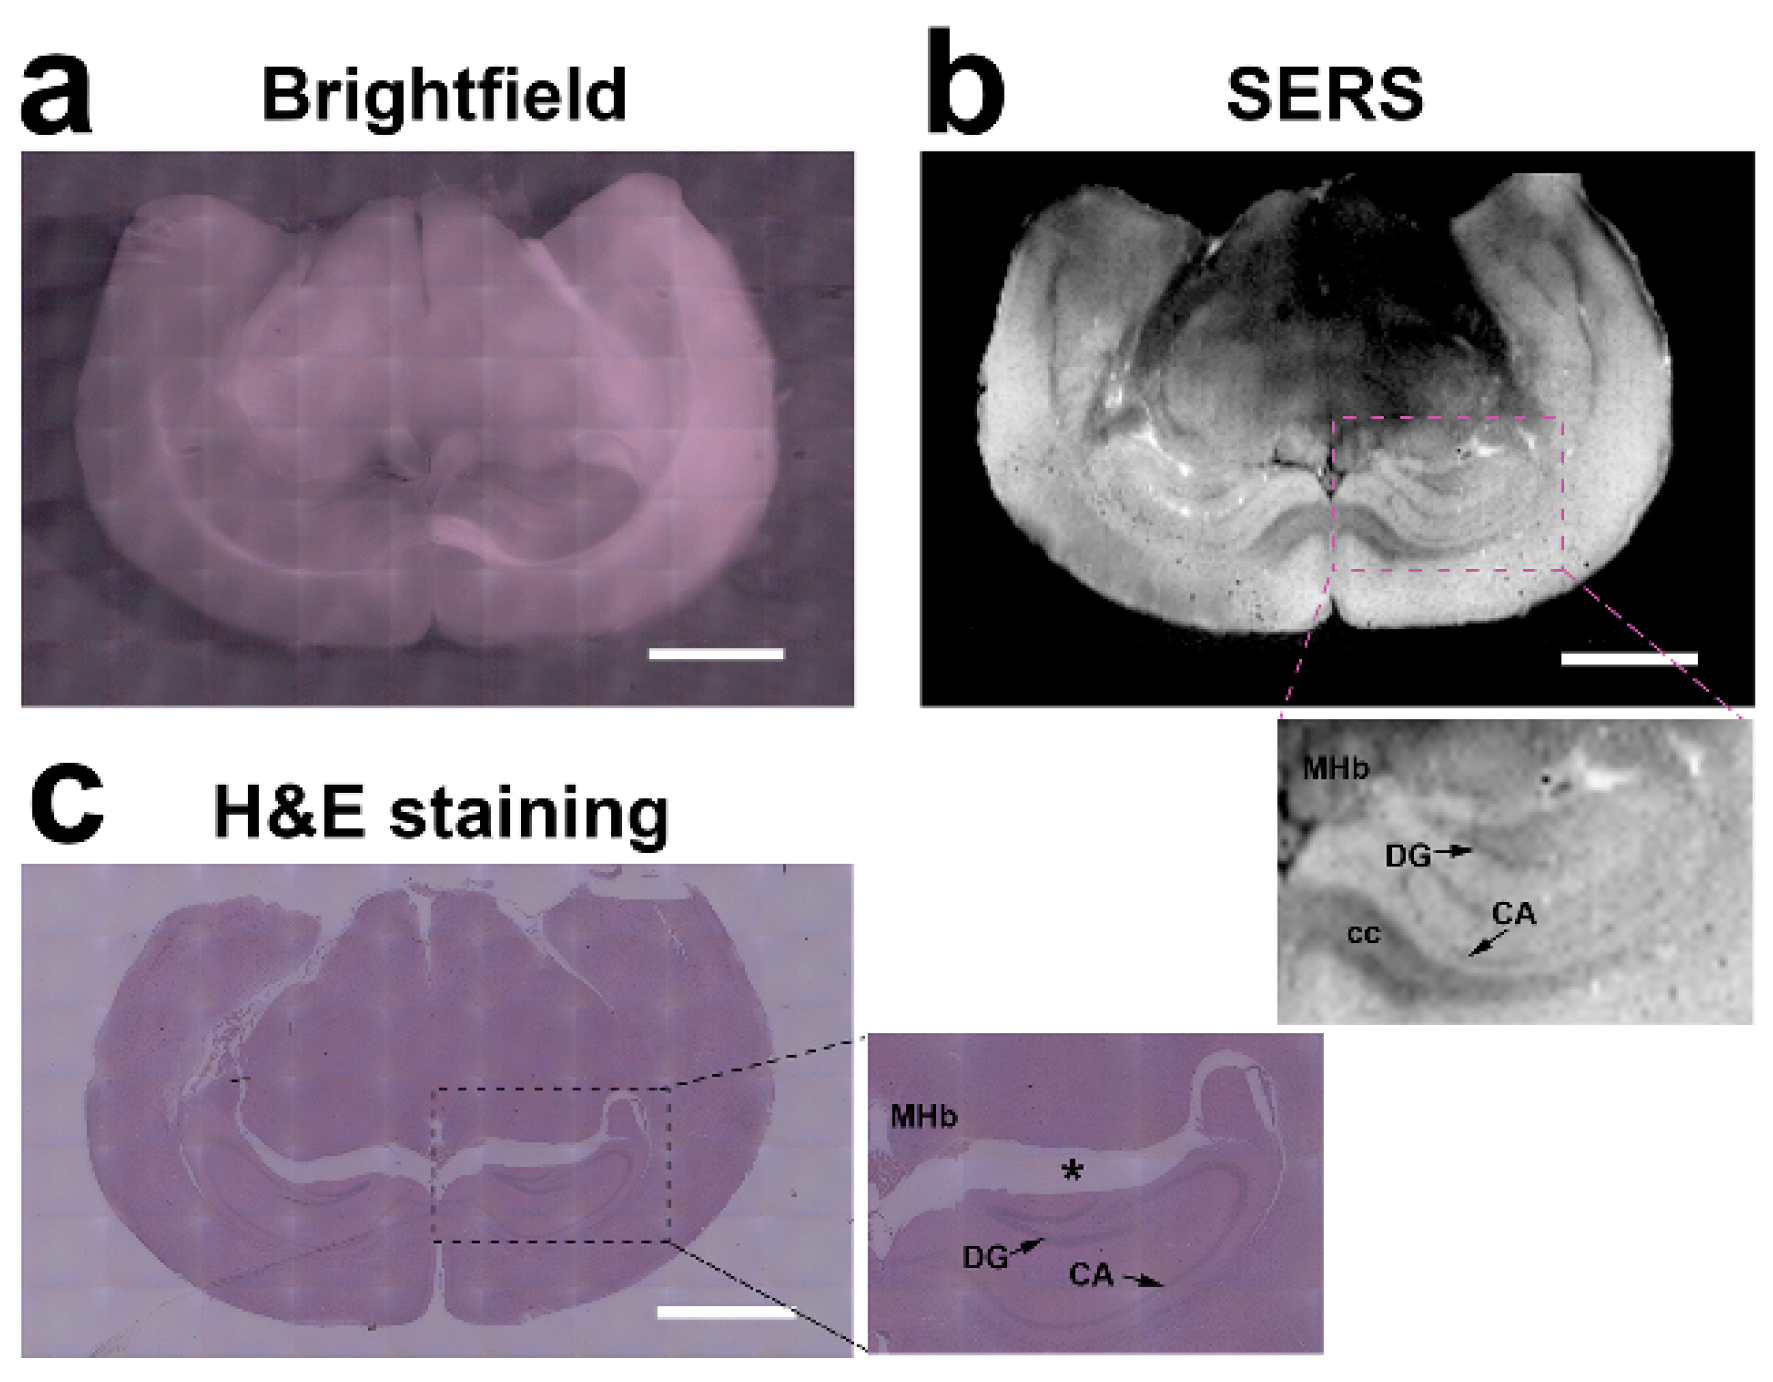
3.3. Full-scale SERS Mapping of Brain Tissues

We further investigated the capability of BP-AuNSs for label-free imaging of mouse brain tissues. The normal Raman mapping with a lateral resolution of 200 μm was performed under the Raman microscope in the Streamline mode at a 9 s exposure time. Raman image of the whole brain tissue was acquired by integrating the intensity from 620 to 1720 cm−1, which spend about 4.5 h (~9.3 s per pixel). Despite taking such a long time, the imaging quality of the normal Raman image (Figure 3a, red picture) was still very poor. The contour of the image was blurred and some regions were not displayed. The raw Raman spectral lines extracted from five different tissue regions showed only a small amount of fingerprint information of brain tissue, with high autofluorescence background (Figure 3b). The quality of Raman image became better after AuNPs were deposited onto the mouse brain tissue, which might be attributed to the weakened autofluorescence background induced by the metal nanoparticles (Figure 3c). However, weak Raman signals and fuzzy boundary were still not improved. The full-scale SERS scanning of mouse brain tissue attached with BP-AuNSs exhibited the most unambiguous image. It could be noted that a very short integration time of 1 s (about 33 min for a whole image) was enough to accomplish the mapping, which was several times faster than the Raman imaging without metal nanostructures treatment. In addition, the SERS spectra extracted from five regions demonstrated intense and plentiful chemical component information of brain tissue (Figure 3d), indicating that the promising potential of BP-AuNSs for neuroscience research.
The mean Raman spectra of brain tissues were calculated form more than 100 spectral lines (static scanning, 10 s integration time, central wavenumber: 1200 cm−1). As shown in Figure 4, the normal Raman spectrum displayed the typical molecular vibration signals of brain tissue, for example: 1004 cm−1 (symmetric ring breathing mode of phenylalanine), 1130 cm−1 (C-N stretch in proteins, C-C stretch in lipids), 1200–1310 cm−1 (phenylalanine, tryptophan, amide III, CH2/CH3 deformation), 1400–1500 cm−1 (CH2/CH3 deformation, COO- symmetrical stretching, adenine, guanine) and 1560–1700 cm−1 (amide II, amide I, adenine, guanine, phenylalanine, tyrosine) [6]. Gold nanoparticles only had a slight effect on the brain tissue, whose SERS spectrum was essentially consistent with that without nanoparticles treatment. In contrast, the SERS signals of brain tissue were significantly enhanced by BP-AuNSs, which were about 25 times (integrated intensities from 620 to 1720 cm−1) stronger than the normal Raman signals. Moreover, some new peaks appeared in the BP-AuNSs-based SERS spectrum, such as 780–880 cm−1 (DNA/RNA: backbone O-P-O stretching, tyrosine, proline, C-O-C stretching in carbohydrate), 964 cm−1 (C-C stretching in protein) and 1060–1195 cm−1 (C-N stretching in protein and lipid, C-C stretching in lipid, protein and carbohydrate, O-P-O stretching in DNA, thymine, guanine) [5,6].

3.4. SERS Texture Analysis of Brain Tissue

The excellent SERS activity of BP-AuNSs made the rapid and precise Raman mapping of brain tissue possible. In this issue, we carried out the Raman scanning (step length: 50 μm) of the mouse brain section treated with BP-AuNSs in the Streamline mode for 0.1 s laser exposure. The scanning time of the entire tissue (28842 pixels) took about 27 min, i.e., 56 ms/pixel. The Raman data set was then processed in the WIRE software (version 5.1, Renishaw) with the empty modeling approach. As displayed in Figure 5, an accurate SERS image of the mouse brain section was presented. The interior texture of brain tissue (cerebral cortex, hypothalamus, thalamus and hippocampus, etc.) could be obviously distinguished in this grayscale SERS image. More detailed texture was exhibited in the enlarged region (Figure 5b), including the medial habenular nucleus, corpus callosum and the internal structure of hippocampus (dentate gyrus and Ammon’s horns), which was well consistent with the data measured from the classical histological analysis (Figure 5c). It is well known that the H&E stained tissue section often suffers from multifarious and time-consuming sample preparation protocol. Technical and biological variation is another problem in the tissue processing procedure, leading to false-positive data. Additionally, we observed a part of tissue loss and displacement in the H&E stained section (Figure 5c). In much contrast, the Raman analysis can be directly performed without any sample pretreatment, which allows the gathering of first-hand data. Furthermore, Raman can also provide the chemical component information of biological tissue through the molecular vibrational spectrum. The bright and dark areas in the grayscale image (Figure 5b) indicated the discrepant distribution of molecular components throughout the entire brain tissue. It could be noticed that there was a certain degree of difference in chemical composition between the left and right hemisphere, though the two looked almost identical in the brightfield image (Figure 5a) and H&E stained section. This difference might be the molecular basis that resulted in various physiological and psychological functions of left and right hemispheres. However, there is still a long way from clinical practice: several issues should be considered, such as clinical sample validation, assessment criterion, the standard operation procedure of this method and so on.

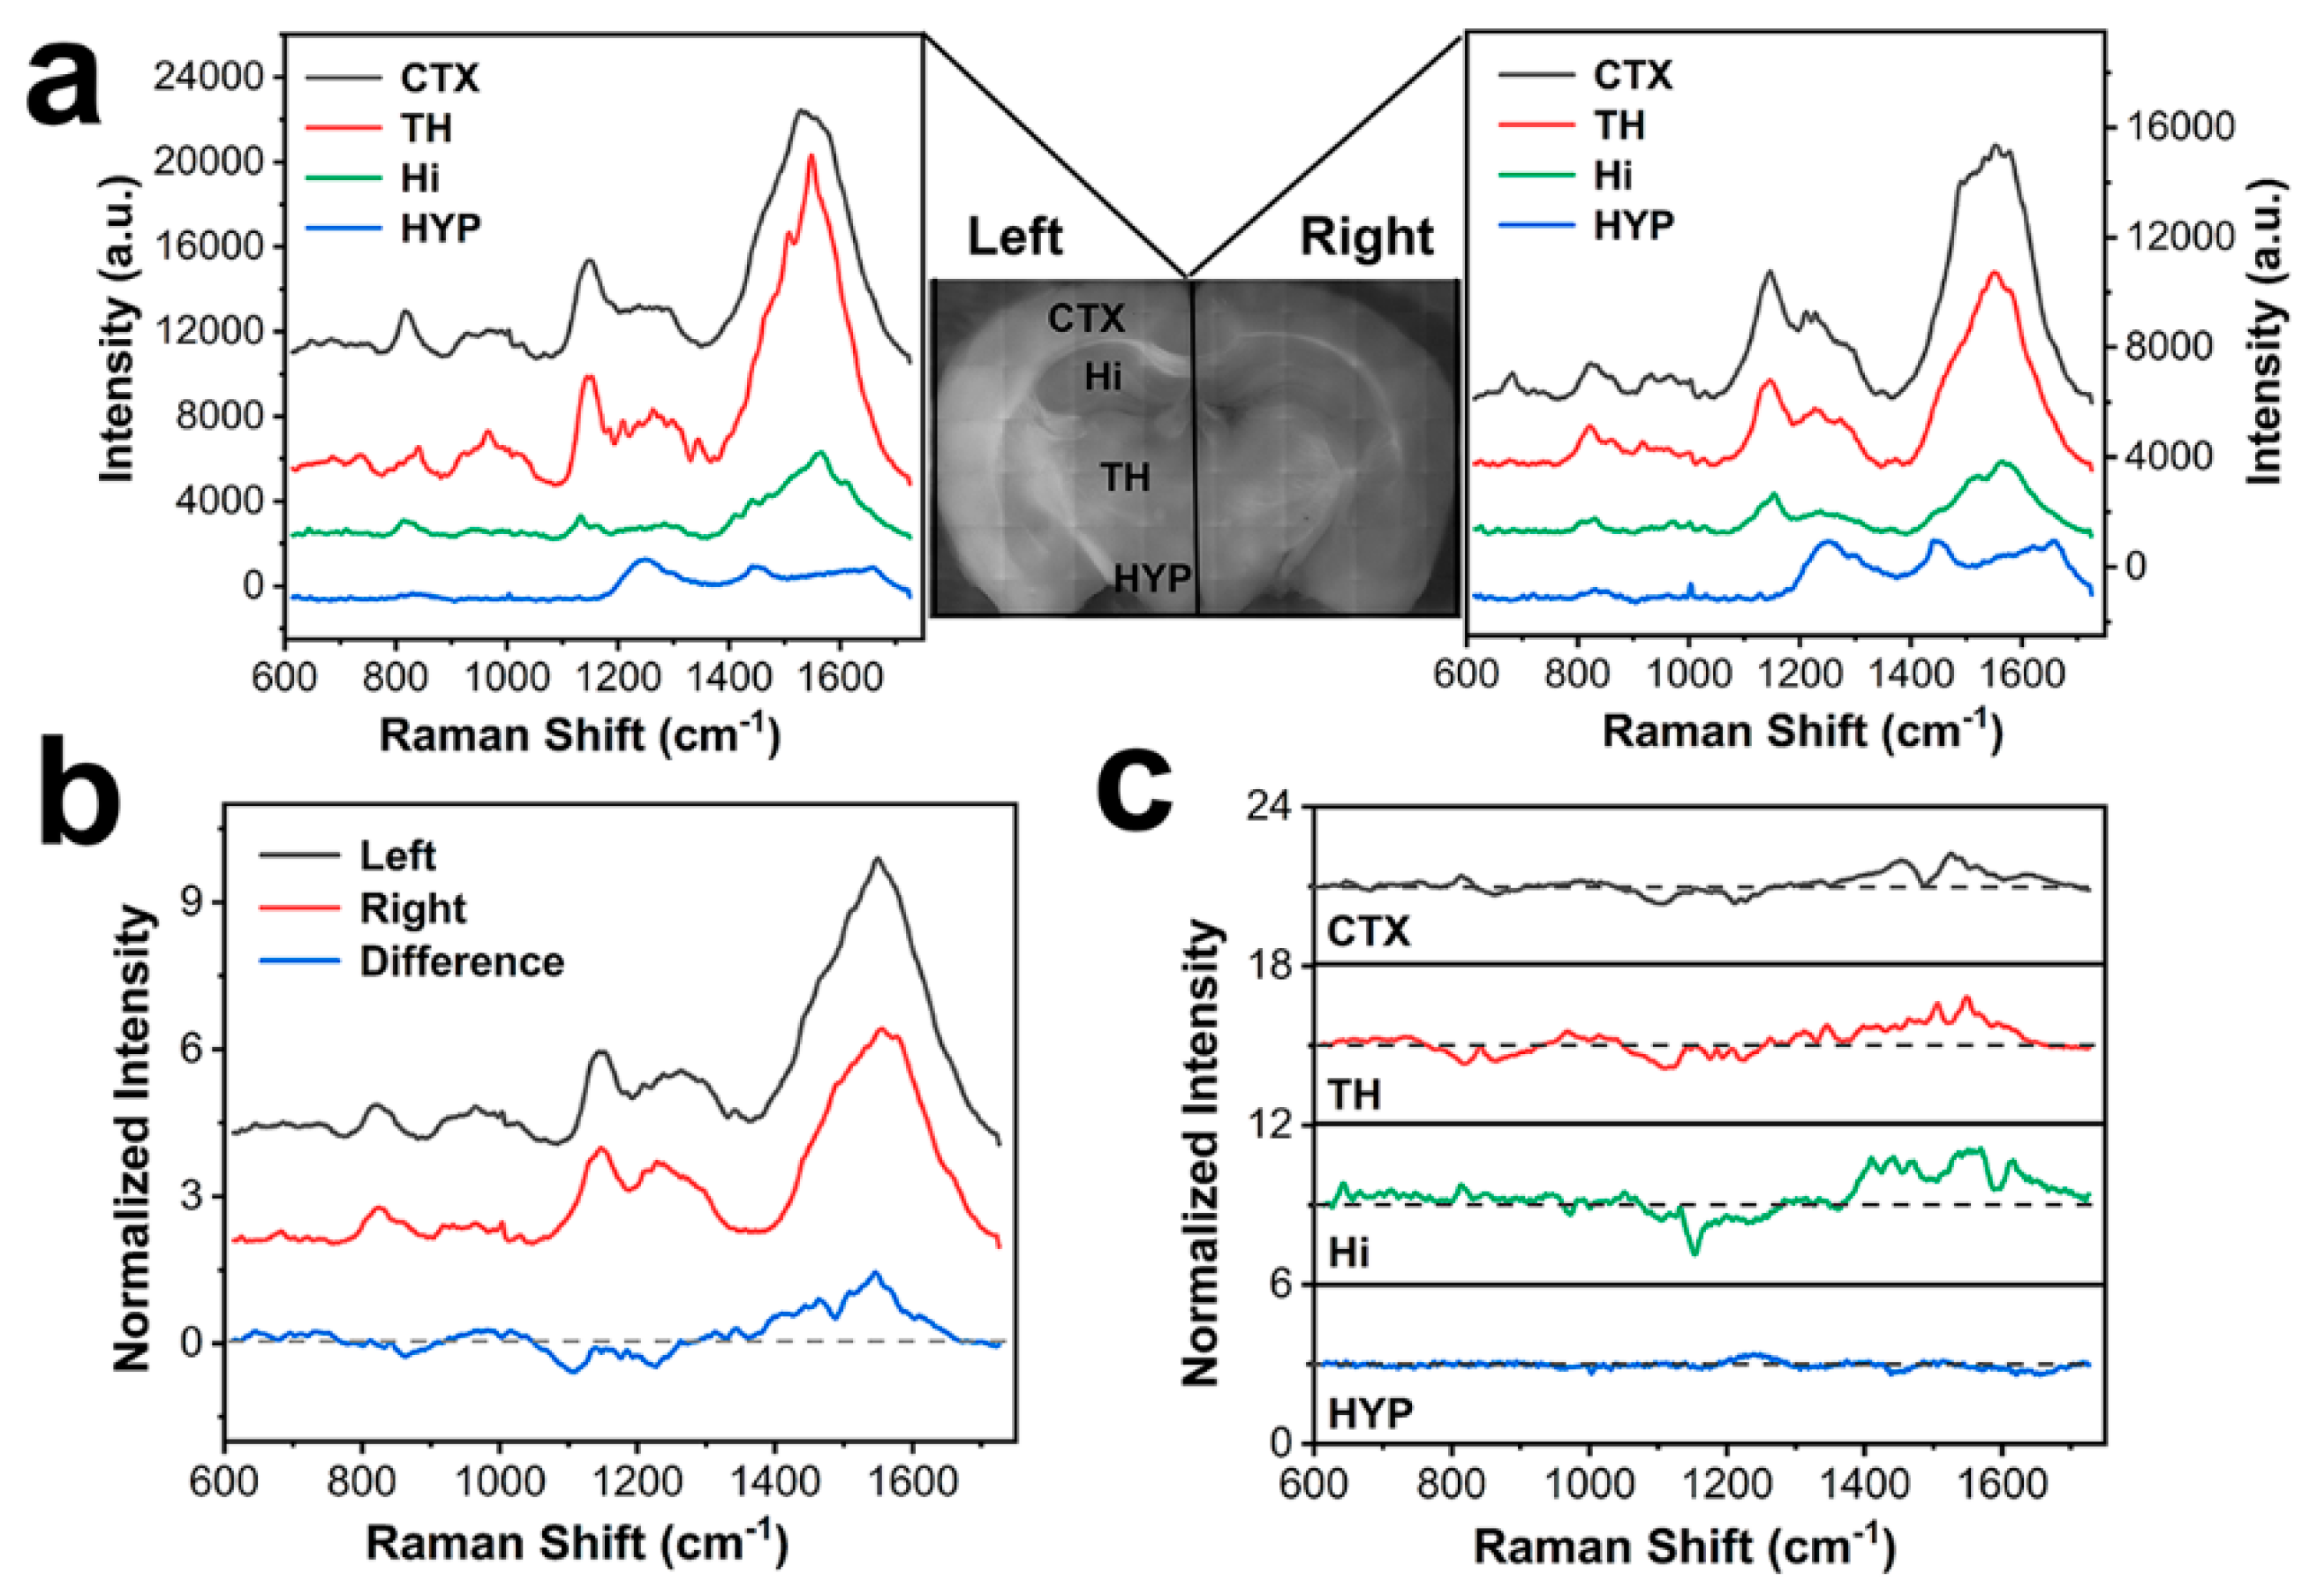
3.5. SERS Spectral Difference Among Various Encephalic Regions

To investigate the differences in chemical composition in different encephalic regions, more than 20 SERS spectral lines were acquired from each compartment. Figure 6a showed the mean SERS spectra of four different encephalic regions (cerebral cortex (CTX), hypothalamus (HYP), thalamus (TH) and hippocampus (Hi)) in the left and right hemispheres. It could be seen that the enhanced Raman signals of brain tissues were evidently varied among the major brain structures. The molecular components in CTX and TH demonstrated the most enhanced SERS signals, which might be ascribed to the higher neurocyte density in these encephalic regions, as the perineuronal nets were intensely positively charged that could closely be bonded with the negatively charged SERS substrate [33]. The Raman signals of brain tissues in HYP experienced a weak increase that could be ascribed to the fewer cells in HYP and weak affinity of the biochemical components and BP-AuNSs.
To compare the biochemical deviations between the left and right hemispheres, the normalized SERS spectra as well as the difference spectrum of left versus right hemisphere were obtained (Figure 6b). The mean SERS spectra of brain tissues in left and right hemispheres illustrated the basically consistent pattern, indicating that the distribution of biochemical components were relatively uniform in left and right hemispheres. However, a certain degree of diversity in the content of biochemical molecules existed, as a fluctuation was observed in the SERS difference spectral line. The major Raman bands in the difference spectrum and their biochemical assignments were listed in Table 1 [6,34,35,36], where a differential distribution of the main biomacromolecules (protein, nucleic acid, lipid and carbohydrates) were observed between left hemisphere and right hemisphere. The dominant bands in right hemisphere were located at 1050–1300 cm−1, which represented the amide III, C-N stretching in protein and DNA/RNA, thymine and guanine, respectively. More molecular information was excavated in the left hemisphere in comparison with that in right hemisphere, especially in the Raman shift ranged from 1300 to 1650 cm−1. The Raman signals of protein, DNA/RNA and lipid were more plentiful in left hemisphere, which might reflect the inequitable division of labor between the two hemispheres.
The detail difference spectra in various encephalic regions were displayed in Figure 6c. The SERS spectra collected from HYP showed little difference, which might be attributed to the weak enhancement of BP-AuNSs in this region. The spectral deviations in other three regions (CTX, TH and Hi) were generally similar to that in the averaged difference spectrum. In CTX region, Raman signals of 1105, 1210 and 1230 cm−1 were dominated in the right hemisphere, while the Raman peaks at 1455, 1524 and 1564 cm−1 were predominant in the SERS spectrum of CTX tissue in the left hemisphere. Besides, a new peak at 815 cm−1, assigned to O-P-O stretching in phosphate [35], appeared, mainly distributed in the right hemisphere, also observed in Hi region. However, this band mostly transferred to the left hemisphere in TH region. The SERS spectra in Hi region underwent the greatest change from the left to the right hemisphere, which mainly appeared in the Raman range 1370–1700 cm−1. Moreover, a prominent peak at 1154 cm−1 (C-C stretching in carotenoids, C-C/C-N stretching in protein [6]) was primarily situated in the spectral line of right hemisphere. Therefore, the SERS spectral analysis revealed the different biochemical components among the various encephalic regions, as well as the difference between the left hemisphere and the right hemisphere, which might supply the molecular structural basis to explain the discrepant physiological and psychological functions of these brain structures.

4. Conclusions

In summary, we have developed a rapid, full-scale and label-free SERS analysis of mouse brain based on BP-metal 2D nanoprobe. The 2D SERS substrate was composed of a flake-like BP nanosheet with a large number of Au nanoparticles attached to it. BP-AuNSs exhibited excellent SERS activity, whose Raman enhancement effects on common organic dyes and brain tissues were several times higher than that of traditional citrate-stabilized AuNPs. In view of this, a fast and full-scale SERS mapping of the mouse brain was carried out under the 0.1 s integration time (56 ms per pixel). Subsequent SERS texture analysis showed a distinct interior texture of brain tissue that was well in accordance with the data by classical H&E analysis. The SERS spectral lines also displayed the biochemical molecular information of the various encephalic regions in brain tissue. The variation analysis of the SERS signals unveiled the biochemical composition difference between the left and the right hemispheres, which might be conducive to reply the different physiological and psychological functions of the two hemispheres.

Author Contributions

Conceptualization, Z.L.; Data curation, D.L.; Funding acquisition, Z.L.; Investigation, T.G. and D.L.; Methodology, W.Z.; Resources, W.Z.; Supervision, L.C.; Validation, F.D.; Writing—original draft, T.G. and Z.L.; Writing—review & editing, L.C.

Funding

This work was supported by the National Natural Science Foundation of China (61675072, 11874021, 61335011, 21505047 and 61275187), and the Science and Technology Project of Guangdong Province of China (2017A020215059).

Conflicts of Interest

The authors declare no conflict of interest.

References

  1. Risacher, S.L.; Anderson, W.H.; Charil, A.; Castelluccio, P.F.; Shcherbinin, S.; Saykin, A.J.; Schwarz, A.J. Alzheimer disease brain atrophy subtypes are associated with cognition and rate of decline. Neurology 2017, 89, 2176–2186. [Google Scholar] [CrossRef] [PubMed]
  2. Fjalldal, S.; Follin, C.; Svard, D.; Rylander, L.; Gabery, S.; Petersen, A.; van Westen, D.; Sundgren, P.C.; Bjorkman-Burtscher, I.M.; Latt, J.; et al. Microstructural white matter alterations and hippocampal volumes are associated with cognitive deficits in craniopharyngioma. Eur. J. Endocrinol. 2018, 178, 577–587. [Google Scholar] [CrossRef] [PubMed] [Green Version]
  3. Wang, J.; Zhou, L.; Cui, C.; Liu, Z.; Lu, J. Gray matter morphological anomalies in the cerebellar vermis in first-episode schizophrenia patients with cognitive deficits. BMC Psychiatry 2017, 17, 374. [Google Scholar] [CrossRef] [PubMed]
  4. Zong, C.; Xu, M.; Xu, L.J.; Wei, T.; Ma, X.; Zheng, X.S.; Hu, R.; Ren, B. Surface-Enhanced Raman Spectroscopy for Bioanalysis: Reliability and Challenges. Chem. Rev. 2018, 118, 4946–4980. [Google Scholar] [CrossRef] [PubMed]
  5. Kalkanis, S.N.; Kast, R.E.; Rosenblum, M.L.; Mikkelsen, T.; Yurgelevic, S.M.; Nelson, K.M.; Raghunathan, A.; Poisson, L.M.; Auner, G.W. Raman spectroscopy to distinguish grey matter, necrosis, and glioblastoma multiforme in frozen tissue sections. J. Neurooncol. 2014, 116, 477–485. [Google Scholar] [CrossRef] [PubMed]
  6. Dutta, A.; Gautam, R.; Chatterjee, S.; Ariese, F.; Sikdar, S.K.; Umapathy, S. Ascorbate protects neurons against oxidative stress: A Raman microspectroscopic study. ACS Chem. Neurosci. 2015, 6, 1794–1801. [Google Scholar] [CrossRef] [PubMed]
  7. Lee, H.J.; Zhang, D.; Jiang, Y.; Wu, X.; Shih, P.Y.; Liao, C.S.; Bungart, B.; Xu, X.M.; Drenan, R.; Bartlett, E.; et al. Label-Free Vibrational Spectroscopic Imaging of Neuronal Membrane Potential. J. Phys. Chem. Lett. 2017, 8, 1932–1936. [Google Scholar] [CrossRef]
  8. Huang, R.; Harmsen, S.; Samii, J.M.; Karabeber, H.; Pitter, K.L.; Holland, E.C.; Kircher, M.F. High Precision Imaging of Microscopic Spread of Glioblastoma with a Targeted Ultrasensitive SERRS Molecular Imaging Probe. Theranostics 2016, 6, 1075–1084. [Google Scholar] [CrossRef] [Green Version]
  9. Yamazoe, S.; Naya, M.; Shiota, M.; Morikawa, T.; Kubo, A.; Tani, T.; Hishiki, T.; Horiuchi, T.; Suematsu, M.; Kajimura, M. Large-area surface-enhanced Raman spectroscopy imaging of brain ischemia by gold nanoparticles grown on random nanoarrays of transparent boehmite. ACS Nano 2014, 8, 5622–5632. [Google Scholar] [CrossRef]
  10. Amharref, N.; Beljebbar, A.; Dukic, S.; Venteo, L.; Schneider, L.; Pluot, M.; Manfait, M. Discriminating healthy from tumor and necrosis tissue in rat brain tissue samples by Raman spectral imaging. Biochim. Biophys. Acta 2007, 1768, 2605–2615. [Google Scholar] [CrossRef] [Green Version]
  11. Kast, R.; Auner, G.; Yurgelevic, S.; Broadbent, B.; Raghunathan, A.; Poisson, L.M.; Mikkelsen, T.; Rosenblum, M.L.; Kalkanis, S.N. Identification of regions of normal grey matter and white matter from pathologic glioblastoma and necrosis in frozen sections using Raman imaging. J. Neurooncol. 2015, 125, 287–295. [Google Scholar] [CrossRef] [PubMed]
  12. Chen, P.; Shen, A.; Zhao, W.; Baek, S.J.; Yuan, H.; Hu, J. Raman signature from brain hippocampus could aid Alzheimer’s disease diagnosis. Appl. Opt. 2009, 48, 4743–4748. [Google Scholar] [CrossRef] [PubMed]
  13. Wu, Y.; McEwen, G.D.; Harihar, S.; Baker, S.M.; DeWald, D.B.; Zhou, A. BRMS1 expression alters the ultrastructural, biomechanical and biochemical properties of MDA-MB-435 human breast carcinoma cells: An AFM and Raman microspectroscopy study. Cancer Lett. 2010, 293, 82–91. [Google Scholar] [CrossRef] [PubMed]
  14. Pascut, F.C.; Goh, H.T.; Welch, N.; Buttery, L.D.; Denning, C.; Notingher, I. Noninvasive detection and imaging of molecular markers in live cardiomyocytes derived from human embryonic stem cells. Biophys. J. 2011, 100, 251–259. [Google Scholar] [CrossRef] [PubMed]
  15. Cialla-May, D.; Zheng, X.S.; Weber, K.; Popp, J. Recent progress in surface-enhanced Raman spectroscopy for biological and biomedical applications: From cells to clinics. Chem. Soc. Rev. 2017, 46, 3945–3961. [Google Scholar] [CrossRef] [PubMed]
  16. Aydin, O.; Altas, M.; Kahraman, M.; Bayrak, O.F.; Culha, M. Differentiation of healthy brain tissue and tumors using surface-enhanced Raman scattering. Appl. Spectrosc. 2009, 63, 1095–1100. [Google Scholar] [CrossRef] [PubMed]
  17. Liu, Z.; Hu, C.; Li, S.; Zhang, W.; Guo, Z. Rapid intracellular growth of gold nanostructures assisted by functionalized graphene oxide and its application for surface-enhanced Raman spectroscopy. Anal. Chem. 2012, 84, 10338–10344. [Google Scholar] [CrossRef]
  18. Zhang, X.; Dai, Z.; Si, S.; Zhang, X.; Wu, W.; Deng, H.; Wang, F.; Xiao, X.; Jiang, C. Ultrasensitive SERS Substrate Integrated with Uniform Subnanometer Scale “Hot Spots” Created by a Graphene Spacer for the Detection of Mercury Ions. Small 2017, 13, 1603347. [Google Scholar] [CrossRef]
  19. Yin, P.T.; Shah, S.; Chhowalla, M.; Lee, K.-B. Design, Synthesis, and Characterization of Graphene-Nanoparticle Hybrid Materials for Bioapplications. Chem. Rev. 2015, 115, 2483–2531. [Google Scholar] [CrossRef]
  20. Ling, X.; Xie, L.M.; Fang, Y.; Xu, H.; Zhang, H.L.; Kong, J.; Dresselhaus, M.S.; Zhang, J.; Liu, Z.F. Can Graphene be used as a Substrate for Raman Enhancement? Nano Lett. 2010, 10, 553–561. [Google Scholar] [CrossRef]
  21. Qiu, M.; Ren, W.X.; Jeong, T.; Won, M.; Park, G.Y.; Sang, D.K.; Liu, L.-P.; Zhang, H.; Kim, J.S. Omnipotent phosphorene: A next-generation, two-dimensional nanoplatform for multidisciplinary biomedical applications. Chem. Soc. Rev. 2018, 47, 5588–5601. [Google Scholar] [CrossRef] [PubMed]
  22. Qiu, M.; Wang, D.; Liang, W.; Liu, L.; Zhang, Y.; Chen, X.; Sang, D.K.; Xing, C.; Li, Z.; Dong, B.; et al. Novel concept of the smart NIR-light-controlled drug release of black phosphorus nanostructure for cancer therapy. Proc. Natl. Acad. Sci. USA 2018, 115, 501–506. [Google Scholar] [CrossRef]
  23. Choi, J.R.; Yong, K.W.; Choi, J.Y.; Nilghaz, A.; Lin, Y.; Xu, J.; Lu, X. Black Phosphorus and its Biomedical Applications. Theranostics 2018, 8, 1005–1026. [Google Scholar] [CrossRef] [PubMed] [Green Version]
  24. Yang, B.; Yin, J.; Chen, Y.; Pan, S.; Yao, H.; Gao, Y.; Shi, J. 2D-Black-Phosphorus-Reinforced 3D-Printed Scaffolds:A Stepwise Countermeasure for Osteosarcoma. Adv. Mater. 2018, 30, 1705611. [Google Scholar] [CrossRef]
  25. Zhou, W.; Cui, H.; Ying, L.; Yu, X.F. Enhanced Cytosolic Delivery and Release of CRISPR/Cas9 by Black Phosphorus Nanosheets for Genome Editing. Angew. Chem. Int. Ed. 2018, 57, 10268–10272. [Google Scholar] [CrossRef] [PubMed]
  26. Sun, Z.; Zhao, Y.; Li, Z.; Cui, H.; Zhou, Y.; Li, W.; Tao, W.; Zhang, H.; Wang, H.; Chu, P.K.; et al. TiL4-Coordinated Black Phosphorus Quantum Dots as an Efficient Contrast Agent for In Vivo Photoacoustic Imaging of Cancer. Small 2017, 13, 1602896. [Google Scholar] [CrossRef] [PubMed]
  27. Chen, W.; Ouyang, J.; Yi, X.; Xu, Y.; Niu, C.; Zhang, W.; Wang, L.; Sheng, J.; Deng, L.; Liu, Y.N.; et al. Black Phosphorus Nanosheets as a Neuroprotective Nanomedicine for Neurodegenerative Disorder Therapy. Adv. Mater. 2018, 30, 1703458. [Google Scholar] [CrossRef] [PubMed]
  28. Yang, G.; Liu, Z.; Li, Y.; Hou, Y.; Fei, X.; Su, C.; Wang, S.; Zhuang, Z.; Guo, Z. Facile synthesis of black phosphorus-Au nanocomposites for enhanced photothermal cancer therapy and surface-enhanced Raman scattering analysis. Biomater. Sci. 2017, 5, 2048–2055. [Google Scholar] [CrossRef]
  29. Mo, J.; Xie, Q.; Wei, W.; Zhao, J. Revealing the immune perturbation of black phosphorus nanomaterials to macrophages by understanding the protein corona. Nat. Commun. 2018, 9, 2480. [Google Scholar] [CrossRef]
  30. Turkevich, J.; Stevenson, P.C.; Hillier, J. A study of the nucleation and growth processes in the synthesis of colloidal gold. Discuss. Faraday Soc. 1951, 11, 55–75. [Google Scholar] [CrossRef]
  31. Xie, H.; Shao, J.; Ma, Y.; Wang, J.; Huang, H.; Yang, N.; Wang, H.; Ruan, C.; Luo, Y.; Wang, Q.Q.; et al. Biodegradable near-infrared-photoresponsive shape memory implants based on black phosphorus nanofillers. Biomaterials 2018, 164, 11–21. [Google Scholar] [CrossRef] [PubMed]
  32. Lin, J.; Liang, L.; Ling, X.; Zhang, S.; Mao, N.; Zhang, N.; Sumpter, B.G.; Meunier, V.; Tong, L.; Zhang, J. Enhanced Raman Scattering on In-Plane Anisotropic Layered Materials. J. Am. Chem. Soc. 2015, 137, 15511–15517. [Google Scholar] [CrossRef] [PubMed]
  33. Murakami, T.; Ohtsuka, A.; Matsuoka, H.; Taguchi, T.; Murakami, T.; Abe, K.; Ninomiya, Y. Intensely positively charged perineuronal nets in the adult rat brain as detected by staining with anionic iron colloid. Arch. Histol. Cytol. 2001, 64, 45–50. [Google Scholar] [CrossRef] [PubMed]
  34. Thomas, G.J., Jr.; Prescott, B.; Olins, D.E. Secondary structure of histones and DNA in chromatin. Science 1977, 197, 385–388. [Google Scholar] [CrossRef] [PubMed]
  35. Kneipp, J.; Kneipp, H.; McLaughlin, M.; Brown, D.; Kneipp, K. In vivo molecular probing of cellular compartments with gold nanoparticles and nanoaggregates. Nano Lett. 2006, 6, 2225–2231. [Google Scholar] [CrossRef] [PubMed]
  36. Willets, K.A. Surface-enhanced Raman scattering (SERS) for probing internal cellular structure and dynamics. Anal. Bioanal. Chem. 2009, 394, 85–94. [Google Scholar] [CrossRef] [PubMed]
Figure 1. Transmission electron microscopic (TEM) images of black phosphorus (BP) sheet (a) and BP-AuNSs (b). (c) EDX pattern of BP-AuNSs. (d) Ultraviolet-visible-near infrared (UV-vis-NIR) absorbance spectra of the nanostructures. (e) Raman spectra of BP and BP-AuNSs.
Applsci 09 00398 g001
Figure 2. Surface-enhanced Raman scattering (SERS) spectra of crystal violet (CV) (10 μM, (a) and IR-780 (1 μM)), (b) under 785 nm excitation. The spectral lines represented the normal Raman spectra of the two dyes at the concentration of 1 mM (1), the SERS spectra induced by citrate-stabilized AuNPs (2), and the SERS spectra induced by BP-AuNSs (3), respectively.
Applsci 09 00398 g002
Figure 3. (a) Full-scale label-free SERS imaging of mouse brain section. (bd) Raw Raman spectral lines collected from five pixel points in the brain sections treated without (b) or with nanostructures (AuNPs (c) and BP-AuNSs (d)).
Applsci 09 00398 g003
Figure 4. Mean Raman spectrum and BP-AuNSs or AuNPs-excited SERS spectra of mice brain tissues, shade areas represented the standard deviations.
Applsci 09 00398 g004
Figure 5. Accurate SERS texture analysis of brain tissue. (a) Brigthfield image; (b) SERS image induced by BP-AuNSs using the empty modelling approach. (c) Hematoxylin and eosin (H&E) staining of brain tissue section. Enlarged images showed the hippocampus (DG, dentate gyrus; CA, Ammon’s horn), medial habenular nucleus (MHb) and corpus callosum (cc) regions. The asterisk (*) showed the loss and displacement of tissue during section preparation process. Scale bar: 2 mm.
Applsci 09 00398 g005
Figure 6. BP-AuNSs-based SERS analysis of the different encephalic regions. (a) The mean SERS spectra extracted from four different encephalic regions (CTX, cerebral cortex; HYP, hypothalamus; TH, thalamus; Hi, hippocampus) in left or right hemisphere. (b) The mean SERS spectra of brain tissues in left and right hemispheres, as well as the SERS difference spectrum of left versus right hemisphere. (c) SERS difference spectra of left versus right hemisphere in four encephalic regions.
Applsci 09 00398 g006
Table 1. The assignments of the Raman bands in SERS difference spectrum of left versus right hemisphere.
Raman Shift (cm−1)Tentative Assignment
645 LTyr, COO- bend or C-S str (p)
730 LA (d)
747 LT (d); Trp ring breath (p)
860 RRibose: C-C str, ring breath, C-O-C str (c)
964 LC-C bk str (p)
1025 LC-H in-plane Phe (p); glycogen
1109 RC-N str (p)
1176 RT, G, C-N str (d)
1230 RAmide III (p)
1343 LCH2 def (p); A,G (d)
1410 LCOO- sym str (p)
1445–1470 LCH2/CH3 def (p, l)
1508–1530 LA, C, G (d)
1546 LAmide II, Trp (p)
1590 LAmide II, Phe, Tyr (p); G, A (d)
1611 LTyr, Phe C=C bend (p)
Abbreviations: L, left hemisphere; R, right hemisphere; p, protein; l, lipid; d, DNA/RNA; c, carbohydrates; Tyr, tyrosine; Trp, Tryptophan; Phe, phenylalanine; A, adenine; T, thymine; C, cytosine; G, guanine; bend, bending; str, stretching; def, deformation; breath, breathing; sym, symmetrical; bk, backbone.

