Article

Experimental Investigation of the Adsorption Characteristics of Mixed Coal and Variations of Specific Surface Areas before and after CH4 Adsorption

1
College of Safety Science and Engineering, Xi’an University of Science & Technology, Xi’an 710054, China
2
Key Laboratory of Western Mine Exploitation and Hazard Prevention Ministry of Education, Xi’an University of Science and Technology, Xi’an 710054, China
3
Xinjiang Coal Science Research Institute, Urumqi 830091, China
4
School of Civil School of Civil, Mining and Environmental Engineering, University of Wollongong, Wollongong, NSW 2500, Australia
*
Author to whom correspondence should be addressed.
Appl. Sci. 2019, 9(3), 524; https://doi.org/10.3390/app9030524
Submission received: 7 January 2019 / Revised: 29 January 2019 / Accepted: 30 January 2019 / Published: 4 February 2019
(This article belongs to the Section Chemical and Molecular Sciences)

Abstract

:
Tectonic coal is a kind of soft coal that is generated during tectonic movement. Gas outbursts usually occur in seams containing both virgin coal and tectonic coal. To reveal the adsorption characteristics of this type of coal seam (containing both virgin coal and tectonic coal), both tectonic coal and virgin coal were collected from the same longwall face and a series of laboratory tests were conducted, including coal sorption tests and pore specific surface measurements. Both the tectonic coal and virgin coal were crushed into coal powder (0.18–0.25 mm) for the coal sorption tests. In these laboratory tests, different mass ratios between tectonic coal and virgin coal were tested. We found that with the increase of the percentage of tectonic coal, the adsorption volume showed a rising trend, reached its maximum value, and then decreased. The specific surface areas of the mixed coal samples had the same evolution trends as those of the adsorption volume. From the laboratory tests, we found that when the mass ratio of virgin coal to tectonic coal was 1:1, both the adsorption volume and the specific surface areas reached their maximum values. Due to the percentage variation of the tectonic coal in the panel with the advancement of the longwall face, when the tectonic coal accounted for 50% of the total coal, the gas content would rise. Thus, proper measures should be adopted for outburst hazards control. The mathematical model between the change of specific surface area and the stress and strain of pore expansion before and after gas adsorption was established, and the relationship between the change of pore structure and gas emission before and after gas adsorption was obtained. It provides a theoretical basis for further research on coal and gas outburst mechanisms.

1. Introduction

As a country with large abundant coal resources, China is also a major country for coal production and consumption. In recent years, with the increase of mechanization in the coal mining industry, the mining depth has sharply increased. As a result, more and more mines are entering the stage of deep mining, which means that the mining process will be under high ground stress, and possess large gas content and considerable gas pressure conditions, leading to the increase of gas emissions and outbursts of coal and gas [1,2,3,4,5]. This represents a serious threat to the production of coal mines. Therefore, there is an urgent need to obtain effective strategies for gas disaster prevention and control by studying the adsorption-desorption rules of coal under different conditions and revealing the gas emission mechanisms under mining conditions. The adsorption capacity is influenced not only by internal characteristics (particle size, deterioration level, pore structure), but also by external conditions (temperature, pressure, moisture). Many scholars have carried out a large number of studies on the adsorption rules of coal under different conditions and made many important achievements in the field.
Based on the research conducted by the former Soviet Union, the gas production in the process of coal formation varies with the different deterioration level. There is a certain variation between gas contents at different deterioration levels and high hydrocarbon contents in coal. The number of alkane hydrocarbons will increase with the changes from meagre coal to fat coal. The number of alkane hydrocarbons will reduce with the changes from caking coal to anthracite. The maximum adsorption of coal improves with the increase of the total pore volume and total specific surface area, and the gas adsorption capacity of coal also increases gradually. Laxminarayana’s research [6] showed that the higher the contents of vitrines are, the larger the adsorption capacity will be. Pan [7] investigated the relationship between the adsorption capacity, coalification degree, and coal rock composition. Their research showed that there is a correlation between carbon content and adsorption. Levy [8], a scientist from Australia, investigated the adsorption characteristics of coal from the Bowen Basin, Australia under different pressures. Their research showed that the higher the carbon content in the coal, the greater the adsorption capacity will be when the equilibrium pressure reaches 5 MPa. Bustin [9] found that there is no obvious correlation between adsorption and coal rank. Su [10] conducted an experiment studying the adsorption process on different ranks of coal. The rank was found to be positively correlated with adsorption capacity, but this rule is the same as for the transition process of coalification. Coalification is correlated with the porosity, as well as the physical and chemical properties of the material surface, and it has an influence on the occurrence space of coal bed methane and coal’s affinity for methane. Peng [11] found that the adsorption amounts of CH4, N2, and CO2 increased with the rank of coal under the same conditions.
Coal, a complex porous media with a strong adsorption capacity, is a natural adsorbent. The size of the pores in coal can vary. Qi [12] found that the gas around coal forms a solid solution by the means of infiltration, replacement, and filling, using ray diffraction and electron microscopy techniques. The gas enters the micro pores of coal rock by adsorption [13]. Buss [14], Talu [15], Cowlard [16], and Jin [17] investigated the distribution of pore structures of coal and obtained the same results as those presented in Reference [12] by gas isothermal adsorption. Manasi [18] and Qi [19] studied the pore characterization of different types of coal from coal. They found the main factor determined by the methane adsorption capacity is the micro pore structure. Through experiments, Pan [7] proved that pore structure in coal determines the adsorption capacity of coal for CH4. The more complex the pore structure, the larger the pore volume and specific surface area, and the stronger the adsorption capacity will be. Further studies in 2004 showed that the gas adsorption of coal is positively correlated with its pore surface area and micro pore surface area.
The micro structure of coal includes the physical structure and chemical structure. The physical structure refers to the interrelationship and mode of action in the molecular structure of organic matter, including the crystal structure and the pore structure between molecules [20]. Common methods used to investigate the physical structure include the mercury injection method [21,22], the gas adsorption-desorption method [23,24], XRD (X-ray diffraction) [25], SEM (scanning electron microscopy) [26], HRTEM (high-resolution transmission electron microscopy) [27], SAXS (small-angle X-ray scattering) [28], X-CT (X-ray computed tomography) [29], and NMR (nuclear magnetic resonance) [30]. Among them, the mercury injection method, the gas adsorption-desorption method, SEM, and SAXS can obtain information about pore structure, so the gas adsorption-desorption method was selected to measure the specific surface area of coal in this study.
The coal adsorption capacity is determined by its pore specific surface area, and it also affects the gas emission during mining. Dean [31] held that a coal reservoir is a double porosity structure composed of pore and fracture elements. Gamson [32] thought that there are transitional types of pore and fracture that occur between the regular pores and fractures. Pohl [33] developed a pore volume experiment for rich hydrocarbon coal and poor hydrocarbon coal by the mercury injection method. They found that seriously damaged coal has a large pore volume and that there are many pore types with diameters measuring over 100 nm. Li [34] used a micro pore analyzer to test the coal and record the pressure, pore diameter, average diameter, cumulative volume, volume increase, and differential volume. They found no trends concerning big pore and medium pore distribution when investigating the pore size distribution. However, almost all of the coal samples showed a sudden increase at the 0.3-μm peak, indicating an increase in pore diameter, according to the mercury curve. Fishman [35] studied the pore development in an uplifted Jurassic reservoir in the southeast part of the Songliao Basin using SEM. Vanherendael [36] analyzed and observed many specimens of coal using SEM. They found that micro pores can be categorized into three types, including plant cell residual porosity, matrix porosity, and secondary porosity. Ortiz [37] studied the effect of pressure on pore structure. Park [38] deduced the porosities for different gas-containing coal samples, but no measured data were reported. Clarkson and Bustin [39] studied the pore diameter distribution characteristics for bituminous coal in a sedimentary basin in western Canada via a CO2 adsorption experiment. Lin [40,41,42] researched the mechanism of N2 flushing for coal seam gas and developed a binary gas migration model to illustrate gas migration in a coal seam. At present, most research works focus on a single coal sample.
Through a review of the literature, it was found that almost all researchers focused on the adsorption characteristics of virgin coal or tectonic coal. The adsorption characteristics of stratified-mixed coal are less studied. Fieldwork has shown that it is useful to investigate mixed coal samples of virgin coal and tectonic coal because they are more common in actual coal seams. Therefore, in this study, the investigation focuses on the characteristics of a mixed coal sample, not a single coal sample. Firstly, both virgin coal and tectonic coal were collected from Shanxi Tianchi coal mine. From the isothermal adsorption tests of the samples, we know the isothermal adsorption quantity and the adsorption constant values of a and b. Then, the mathematical models based on the experimental results of the gas adsorption of mixed coal were set up. This study provides a theoretical basis for further research on coal seam gas emissions under mining conditions.

2. Materials and Methods

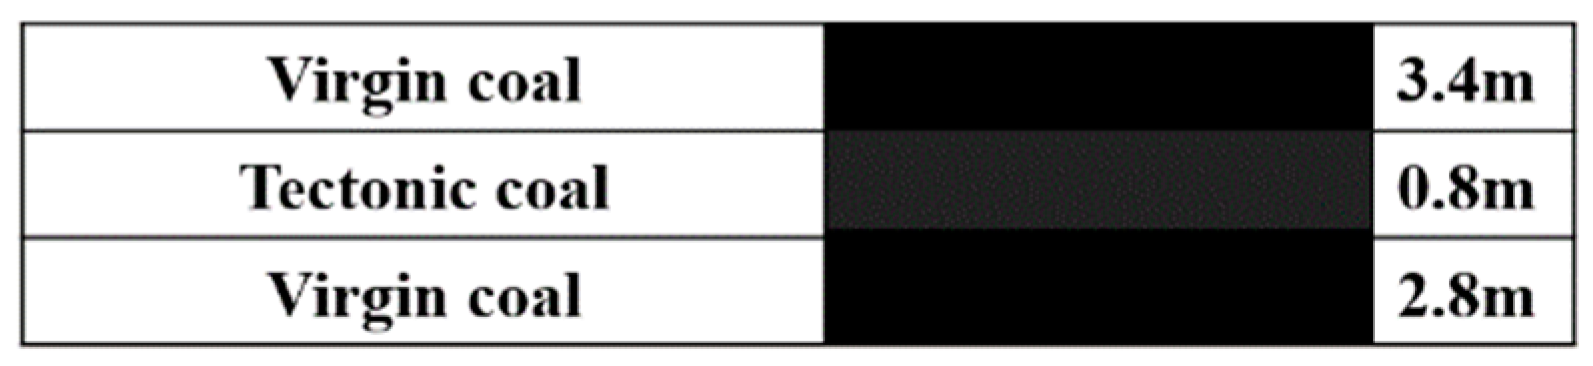
2.1. Materials Preparation

Virgin coal samples and tectonic coal samples were collected from the #401 longwall working face of the #15 coal seam, Tianchi coal mine, Shanxi province. This seam is an outburst-prone coal seam with an average thickness of 7 m. The tectonic coal layers can be easily observed and the average thickness of the tectonic coal is 0.8 m, as is shown in Figure 1. During the mining process, outburst events have occurred several times and most of these events have happened in the area with a large tectonic coal seam thickness.
Coal samples are processed by a grading vibration crusher, following which different particle sizes of coal samples are obtained. The coal samples with particle sizes of 20~30 mm were used to test the strength coefficient. The strength coefficients of virgin coal and tectonic coal were 0.565 and 0.266, respectively. Coal samples with the particle sizes of 0.180~0.250 mm (GB-T19560-2004) were selected for the adsorption tests. The selected virgin coal samples and tectonic coal samples were layered in coal sample tanks according to their different mass ratios. Coal samples with different mass ratios (virgin coal:tectonic coal in ratios of 5:1, 4:2, 3:3, 2:4, and 1:5) were prepared to study the adsorption characteristics and the pore specific surface area expansion effect. The mass of coal samples was set to 36 g and 3.5 g, respectively, according to the requirements of the experimental device and the experimental plan.
The Langmuir adsorption model is a monolayer adsorption model. Since the isotherms of coal-adsorbed methane conform to the first type of isotherms classified by IUPAC (the International Union of Pure and Applied Chemistry), Langmuir adsorption models were used to calculate the amount of gas adsorbed by coal:
Q = a b p 1 + b p
where Q is the gas adsorption capacity, mL·g−1; p is the gas pressure, MPa; a is the adsorption constant, m3/t; and b is the adsorption constant, MPa−1.

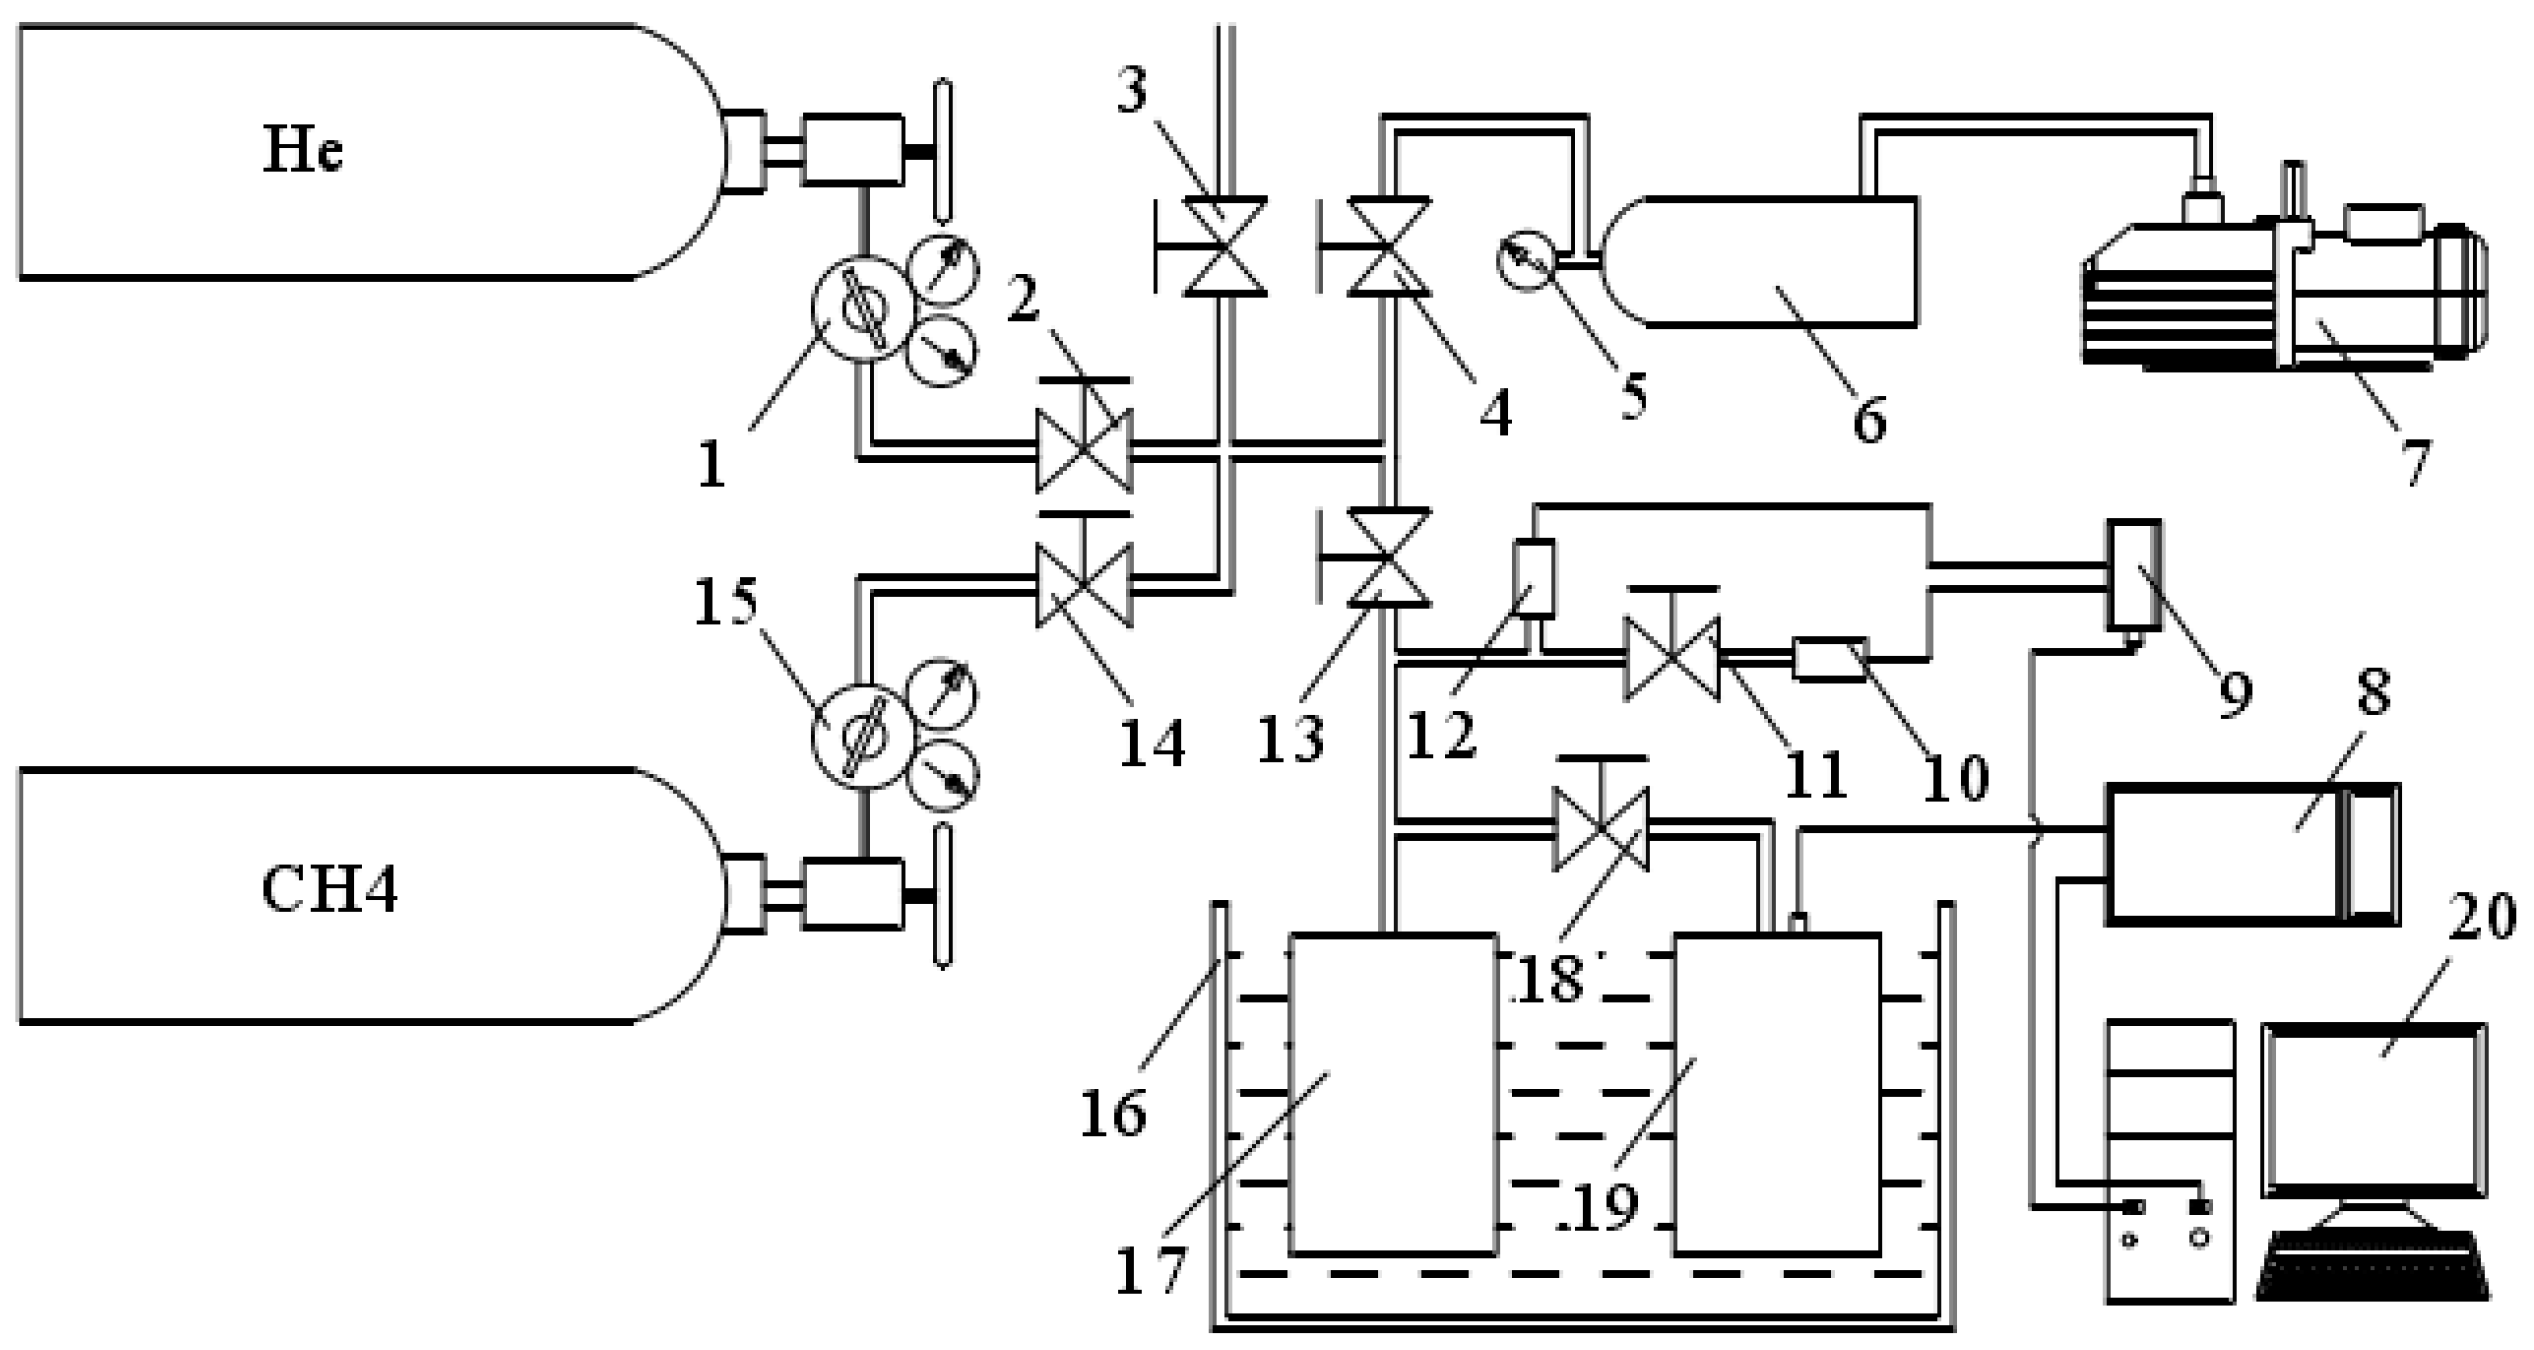
2.2. WY-98A Gas Adsorption Constant Analyzer

The WY-98A gas adsorption constant analyzer made by the China Coal Science and Industry Group of Shenyang Institute was used to perform the adsorption isotherm tests. The high-pressure isothermal adsorption capacity method was used in this experiment. Firstly, de-gas work was carried out by a vacuum pump after the coal sample was stored in the coal sample tank. To test different ratios, the tectonic coal was first loaded into the coal sample tank and then the virgin coal powders were loaded. A certain amount of methane gas was injected into the coal sample tank, and then the void volume of the coal sample tank was measured. The filling valve was closed after filling the tank when the gas pressure sensor detected that the coal sample tank had reached the indicated pressure. During this process, the gas pressure sensor and temperature sensor were used to monitor the gas pressure variation and the applied force in this experiment. The schematic diagram of the testing equipment is shown in Figure 2.

2.3. ASAP-2020 Specific Surface Area Analyzer

According to the requirement of GB/T57512009, liquid nitrogen was used for the adsorption and desorption test. By using the BET (Brunauer–Emmett–Teller) theory of multi-molecular layer adsorption and the BJH method (a commonly used computational model for aperture distribution described by Barrett, Joyner, and Halenda) [43], the specific surface area and pore volume of mixed coal was determined. This technology is widely used to study the distribution of pore specific surface area [44]. In our study, the coal sample was prepared and tested before and after the adsorption isotherm test.

3. Experimental Results

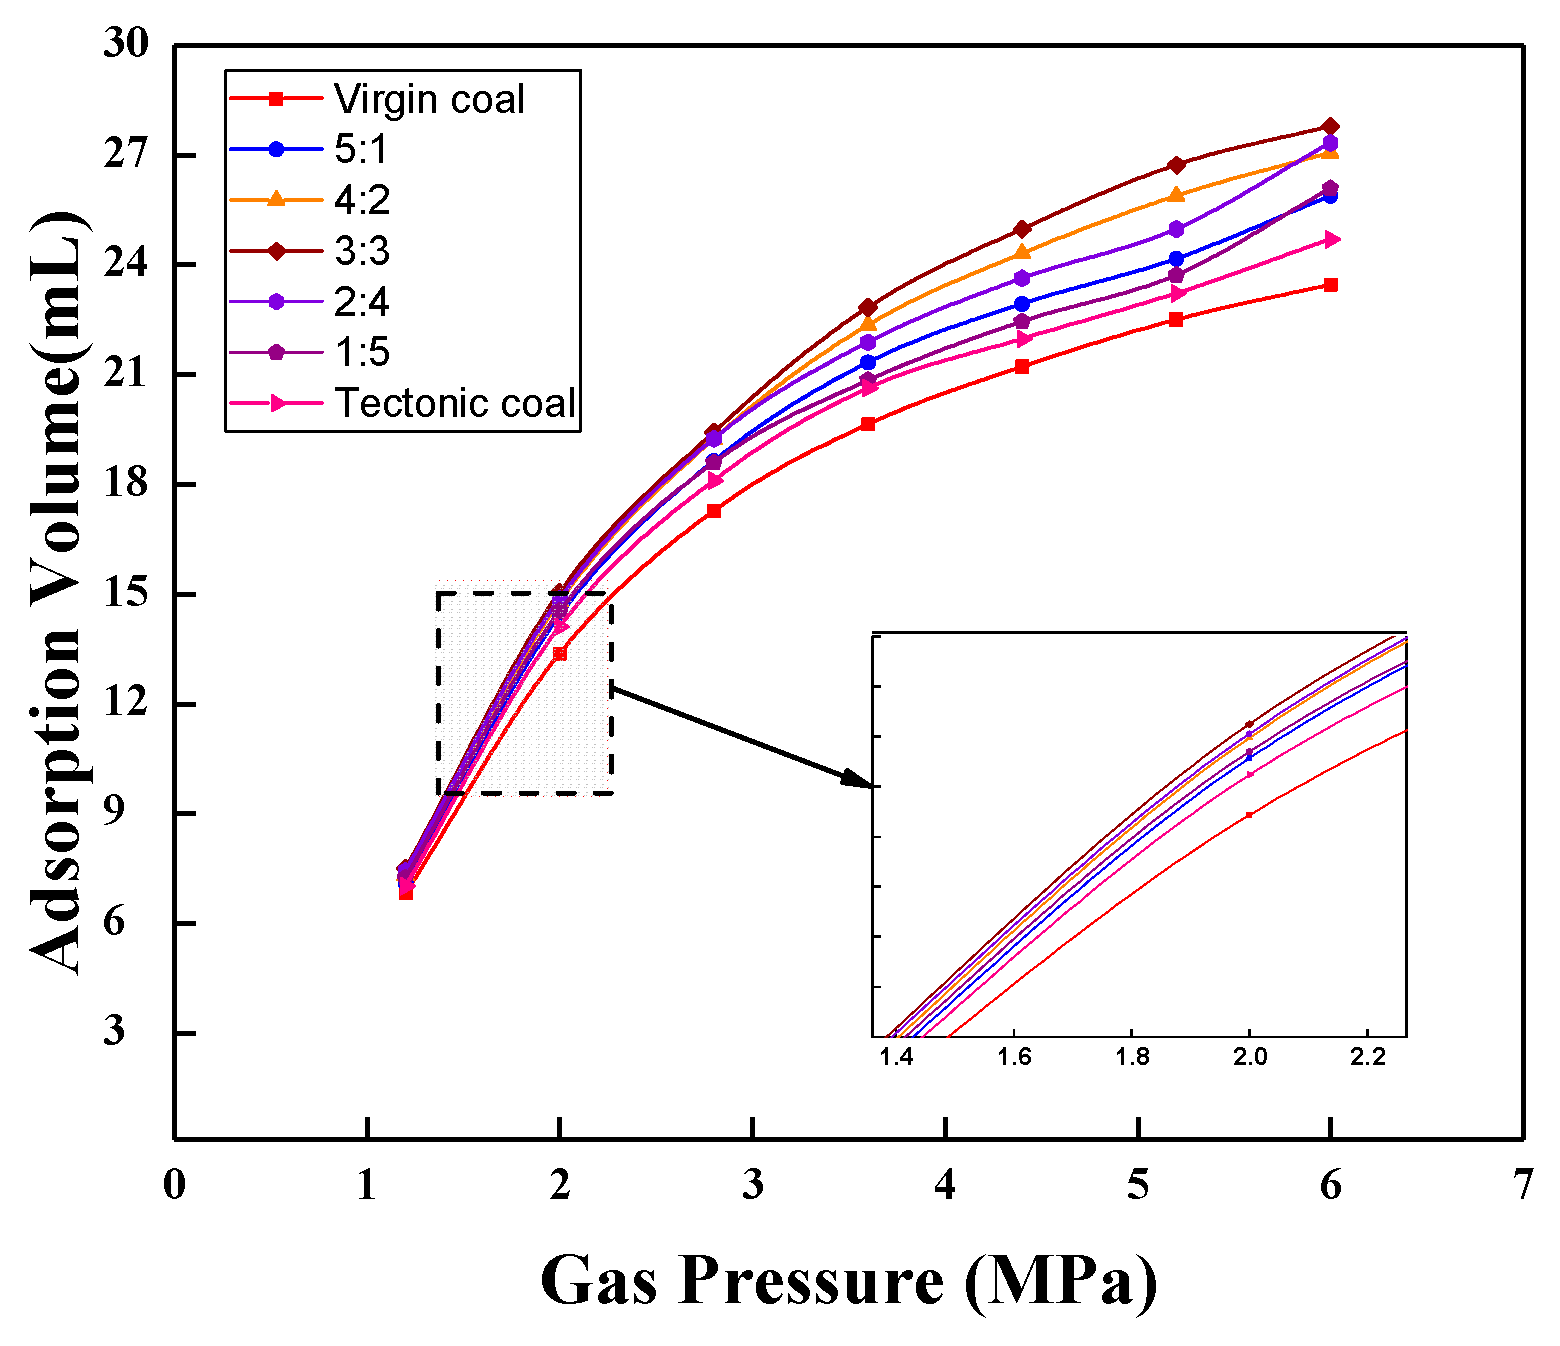
3.1. Isothermal Adsorption Results of Mixed Coal

The coal sample tank was submerged into a water bath at 303 K to measure the coal adsorption isotherm. Different coal samples were tested, including the virgin coal and mixed coal. Methane was selected as the adsorption gas. The gas adsorption isotherms of mixed coal under different mass ratios were obtained by a large number of experiments, as shown in Figure 3. The adsorption capacity was proportional to the pressure because this adsorption of coal sample is physical adsorption. It can be clearly seen from Figure 3 that the adsorption amount gradually increases with the rise in pressure. Limited by pore volume, the adsorption capacity tends to decrease after a certain period of time. This is adsorption equilibrium.
Meanwhile, some variations were observed for the isotherm as the ratio of virgin coal/tectonic coal changed. For example, coal sample reached the minimum adsorption volume at different mass ratios. When the ratio of virgin coal/tectonic coal was 1:1, the sample had the largest adsorption capacity.

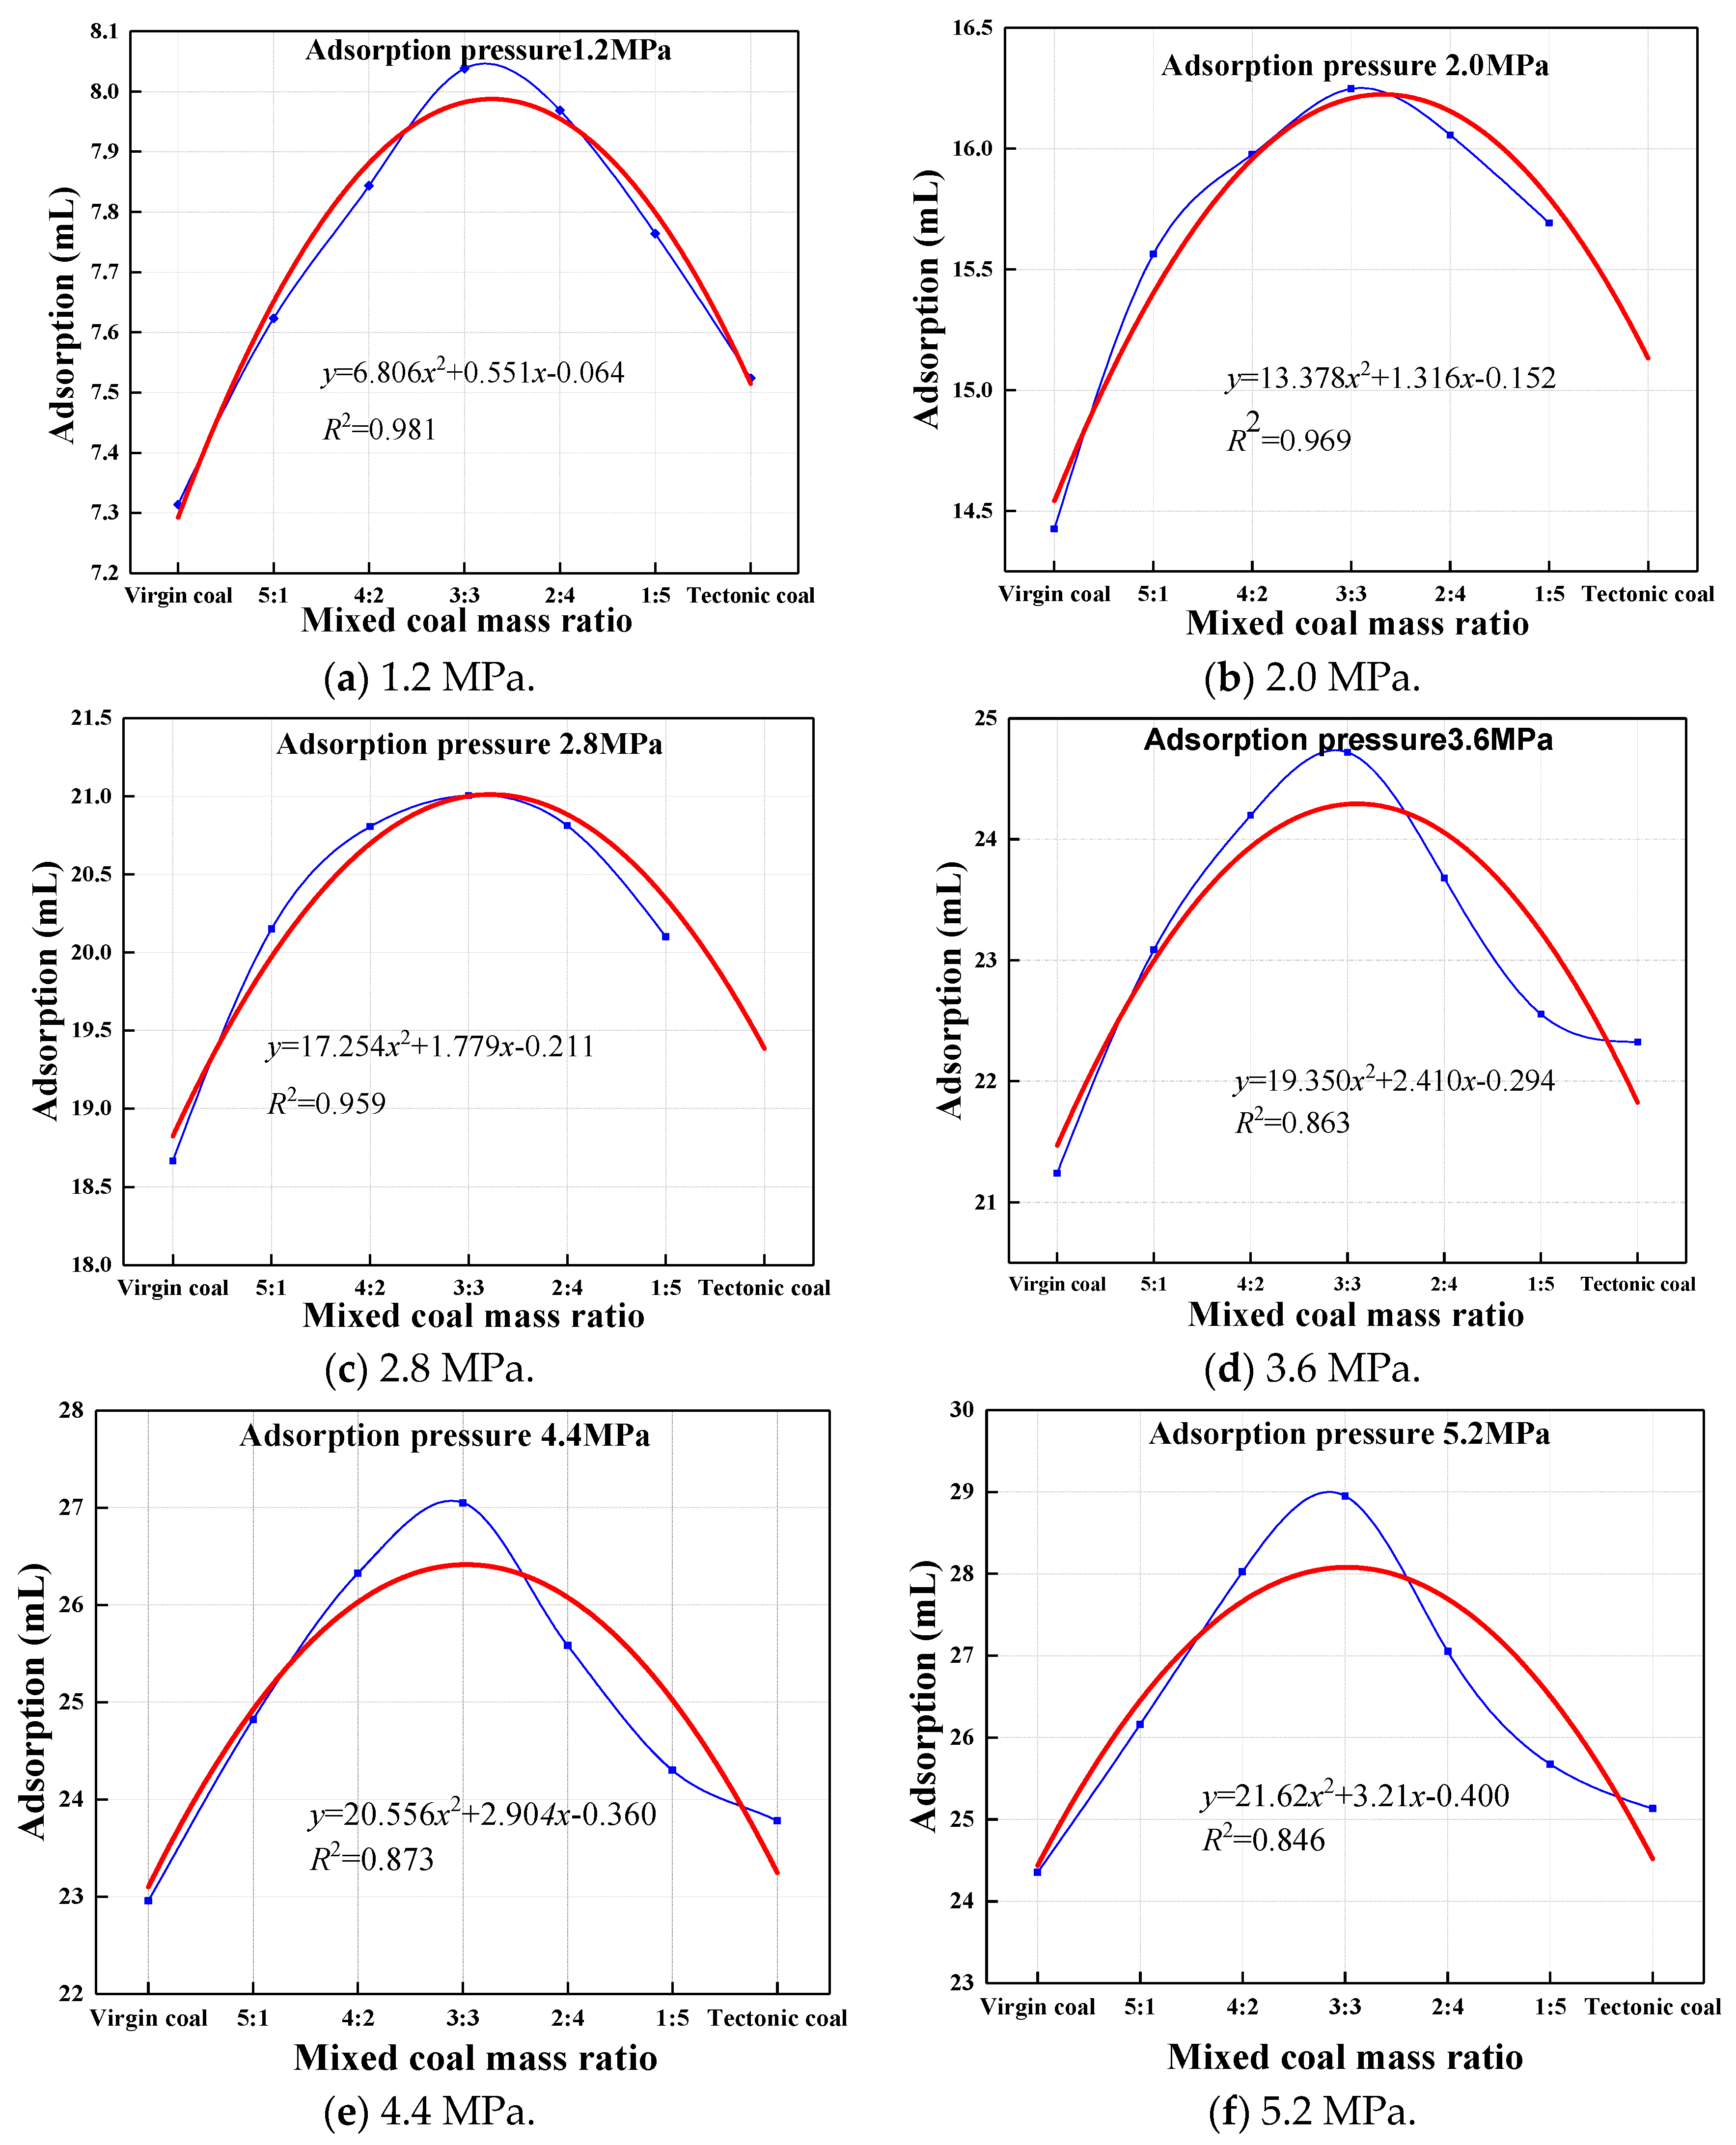
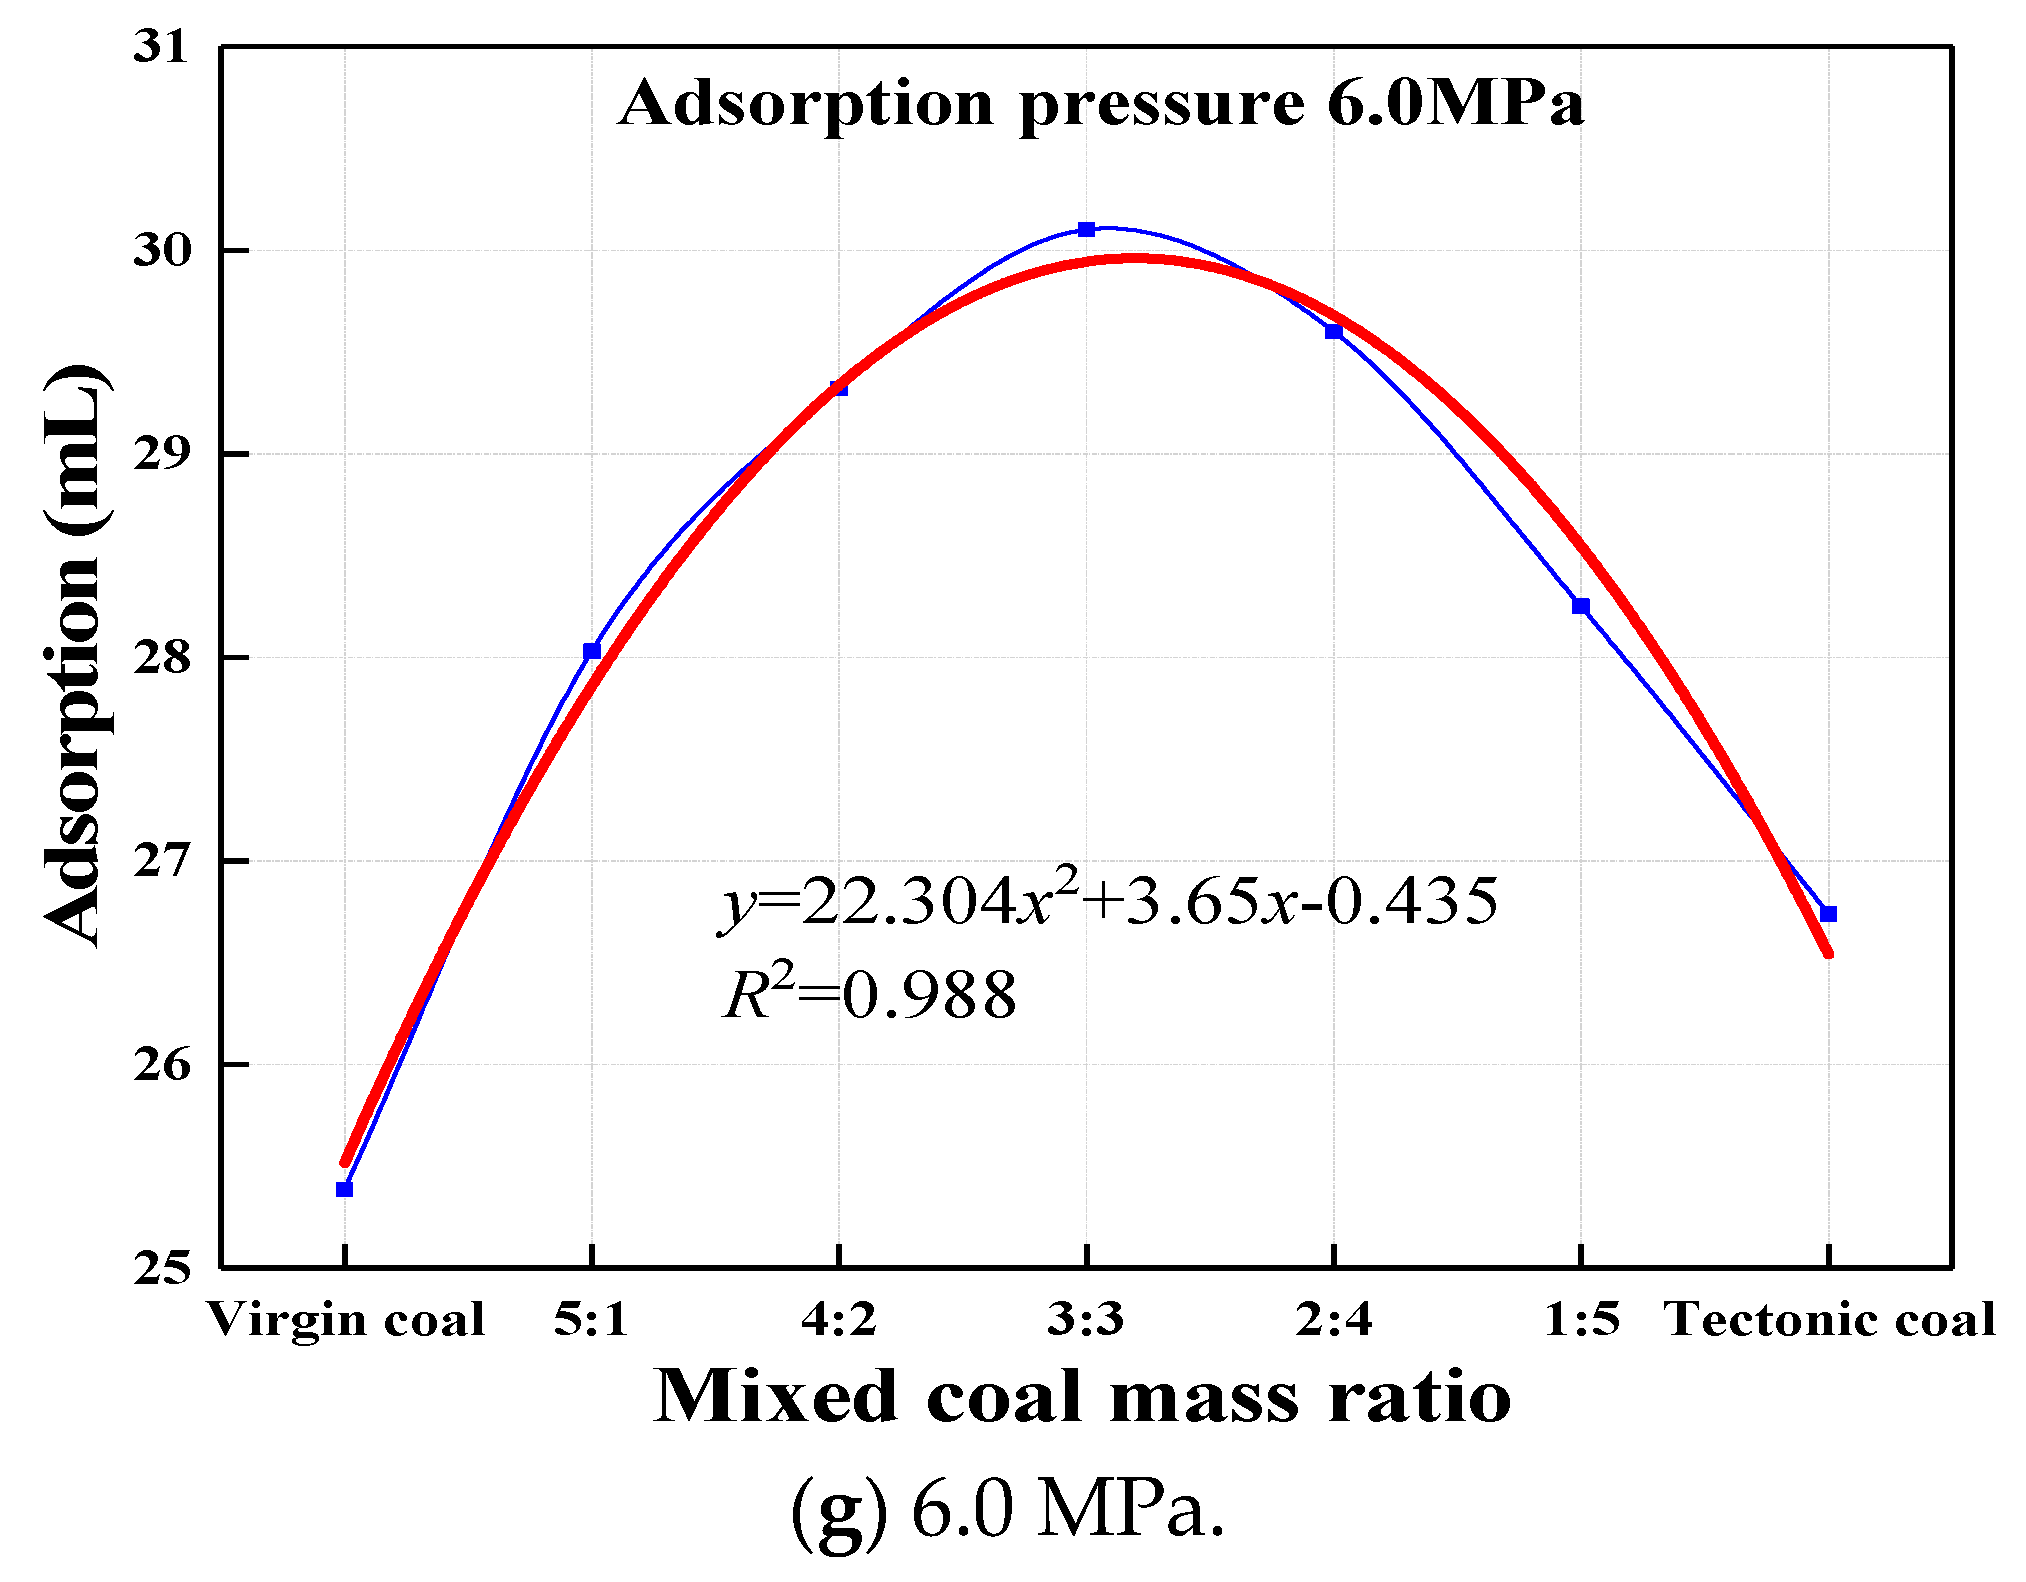
3.2. Adsorption Results of Coal Samples with Different Mass Ratios at Each Pressure Step

Most tectonic coals are dominated by vitrinite and vitrinite is characterized by the vitrinite matrix. Those samples contain more developed macroscopic pores, providing an excellent physical condition for gas adsorption. As seen in Figure 4, similar volume trends were observed with different mass ratios. With the increase of the soft layer (tectonic coal), the gas adsorption volume exhibited a rising trend. After it reached its peak adsorption volume, the adsorption volume dropped. When the thicknesses of virgin coal and tectonic coal were approximately equal, the maximum adsorption volume was observed. As the thickness of tectonic coal gradually increased, the adsorption amount started to exhibit a gently decreasing trend.
The regression fitting of the test data is plotted in Figure 4, and the relationship between the adsorption capacity and the mass ratio was obtained using the following equation:
Q = A 0 x 2 + A 1 x + A 2
where Q is the adsorption amount, mL·g−1; x is the mass ratio of tectonic coal to the total coal sample; and A0, A1, A2 are the fitting constants.

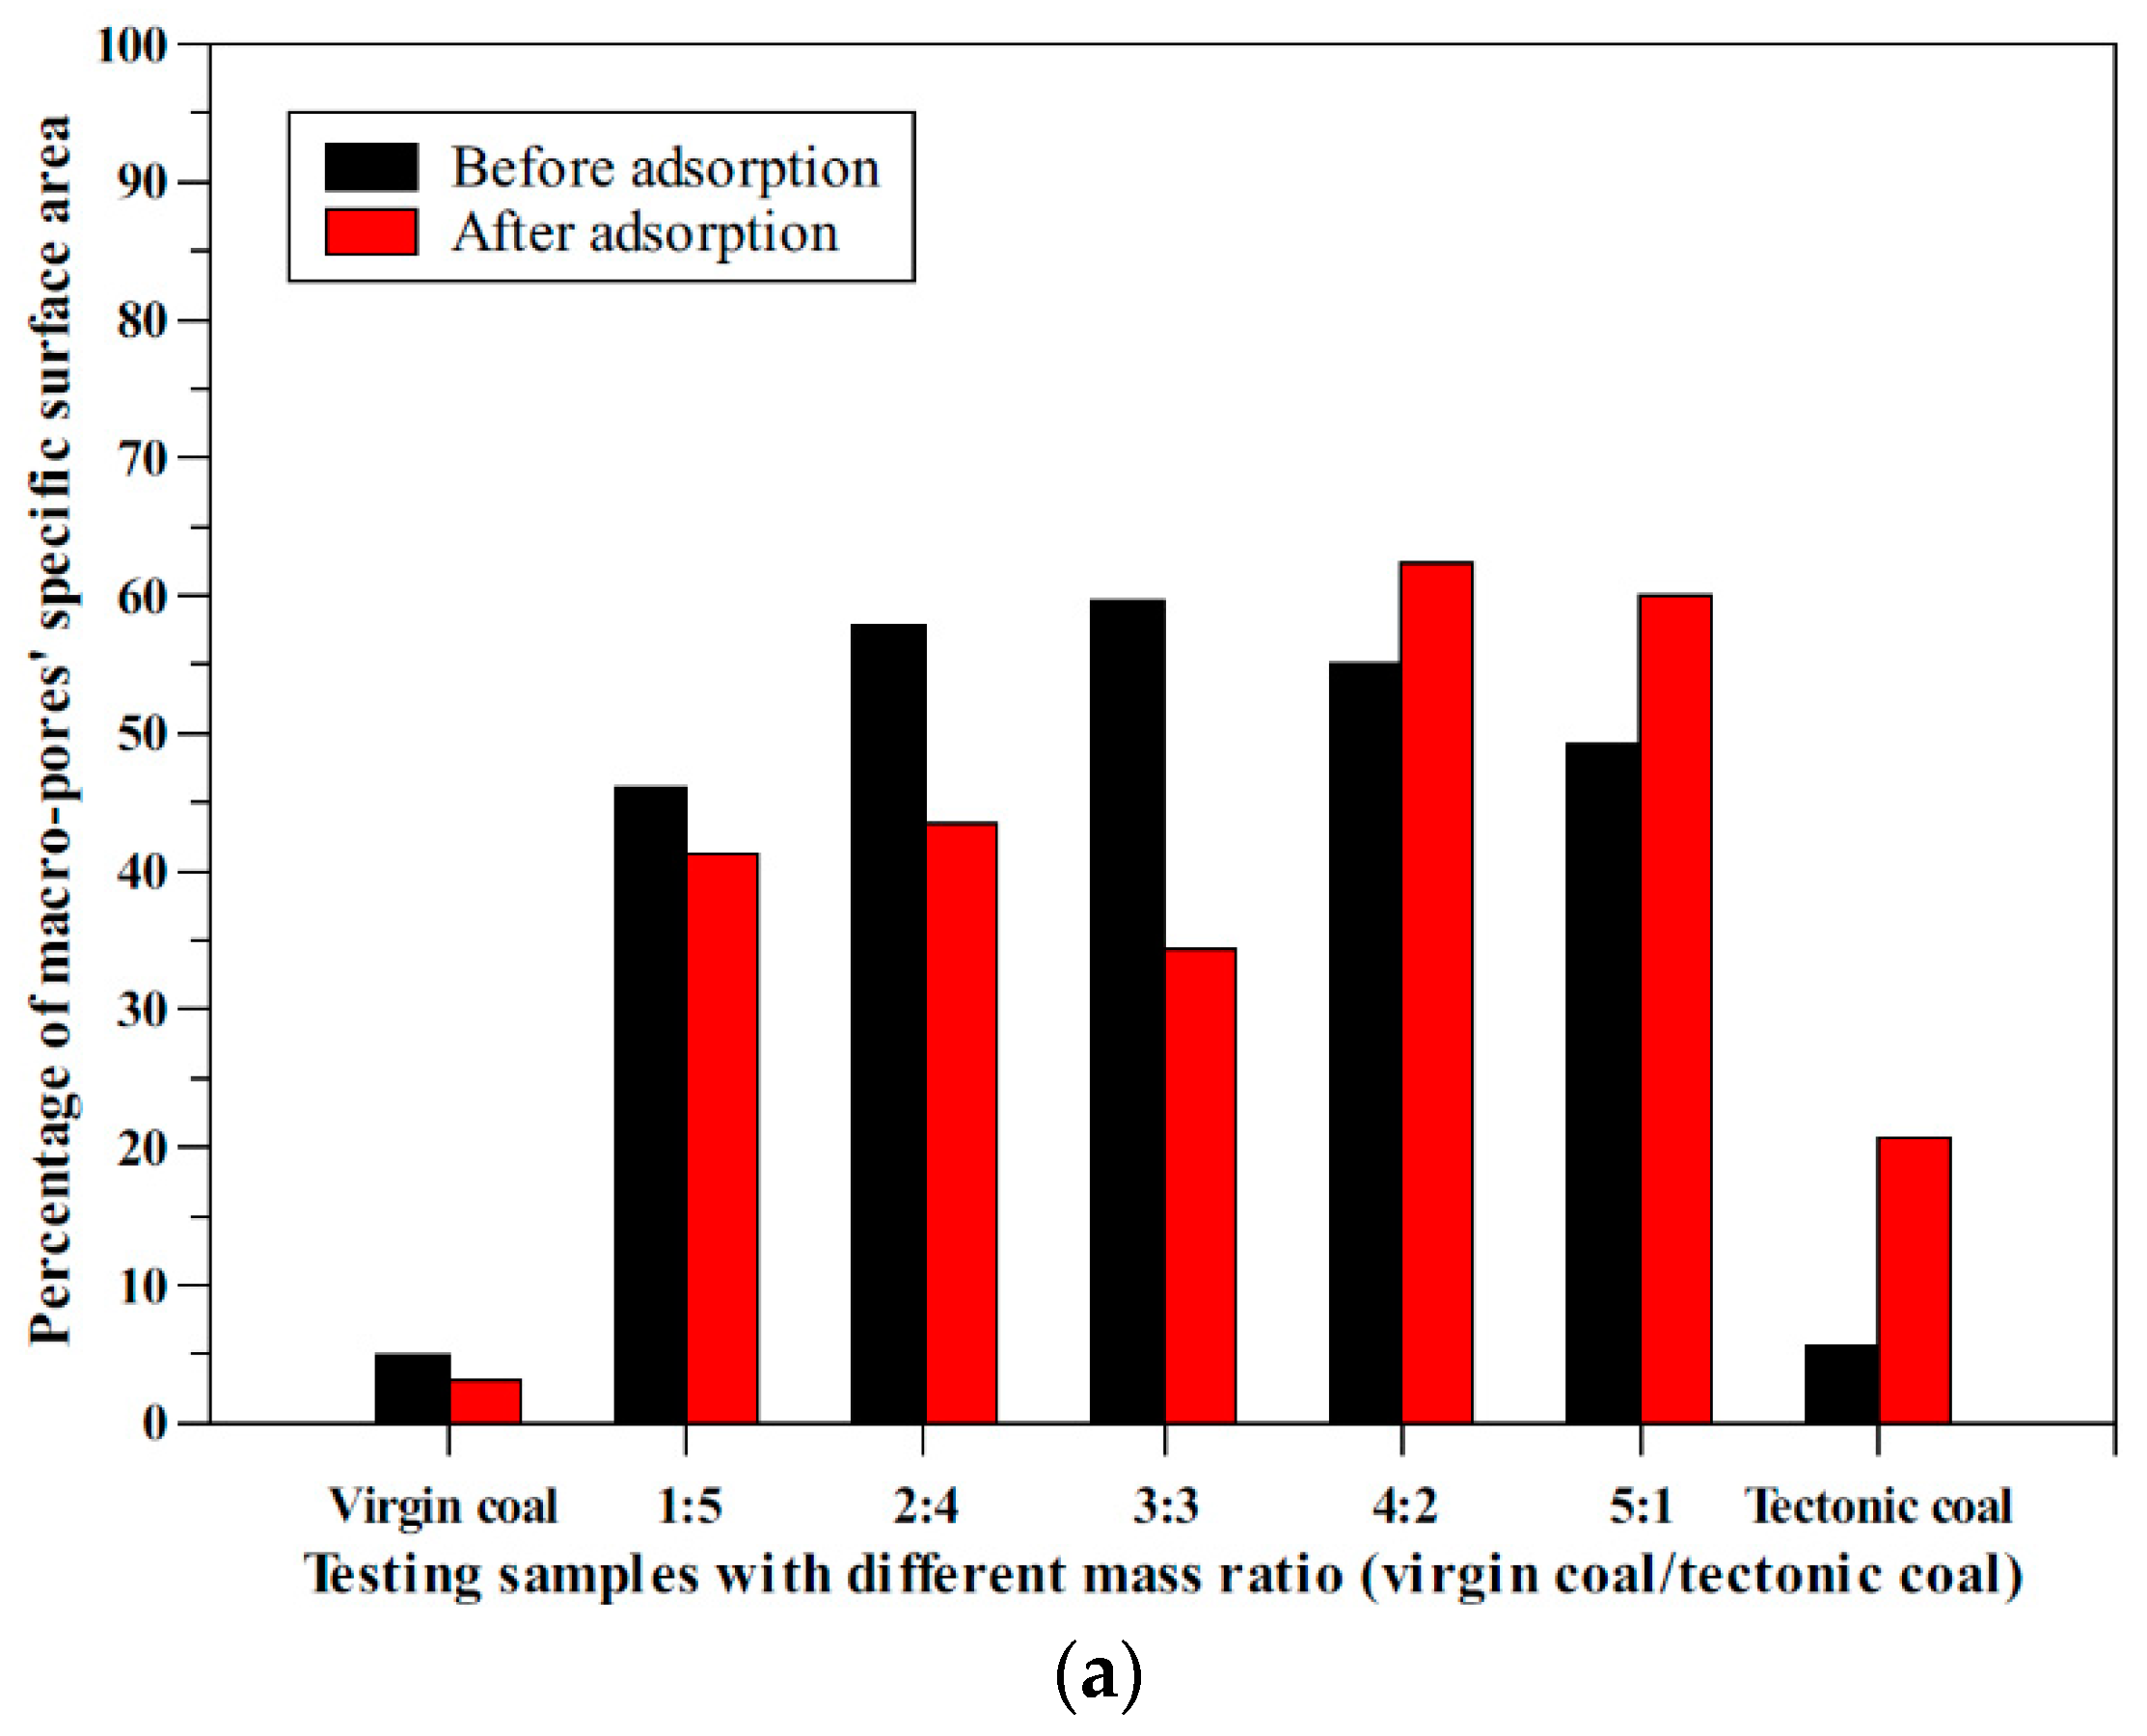
3.3. Specific Surface Area Results of Mixed Coal before and after Adsorption

By testing the specific surface area of a mixed coal sample before and after adsorption, the proportion of micro and macro pores’ surface area of the mixed coal sample before and after adsorption was obtained. Figure 5 shows the macro and micro pores’ specific surface area variations before/after the adsorption test. From Figure 5, it can be seen that the macro pores in both virgin coal and tectonic coal accounted for a small percentage of the total specific surface area. The micro pores accounted for a much higher percentage in these samples. In our study, different samples with different ratios of virgin coal/tectonic coal were used. The pores may have had differences among these samples. It is more helpful to study the specific surface area variation before and after adsorption for the same coal sample.

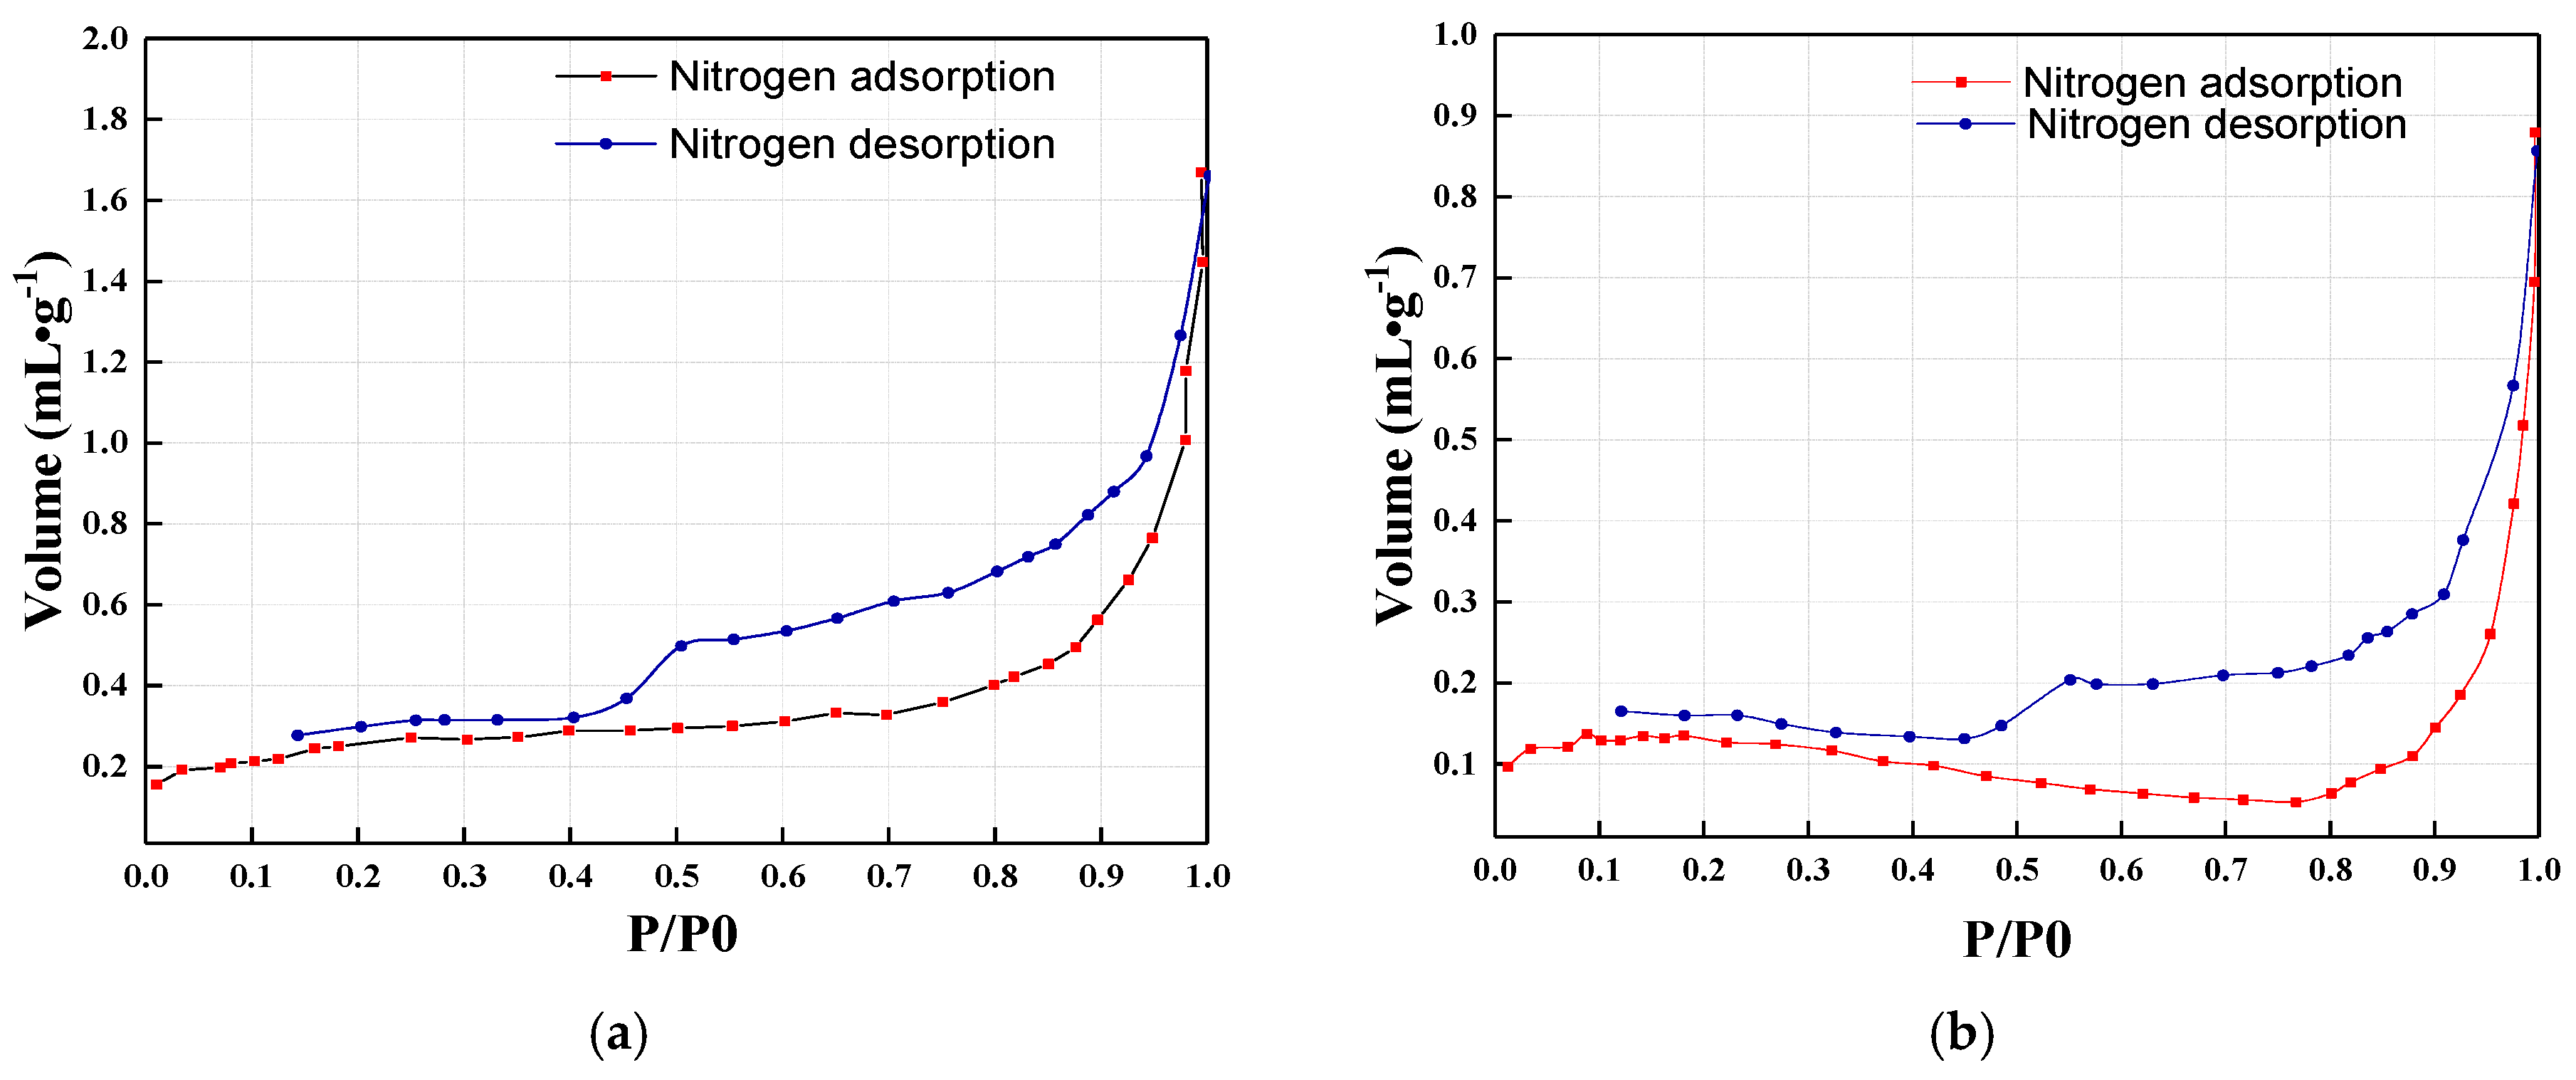
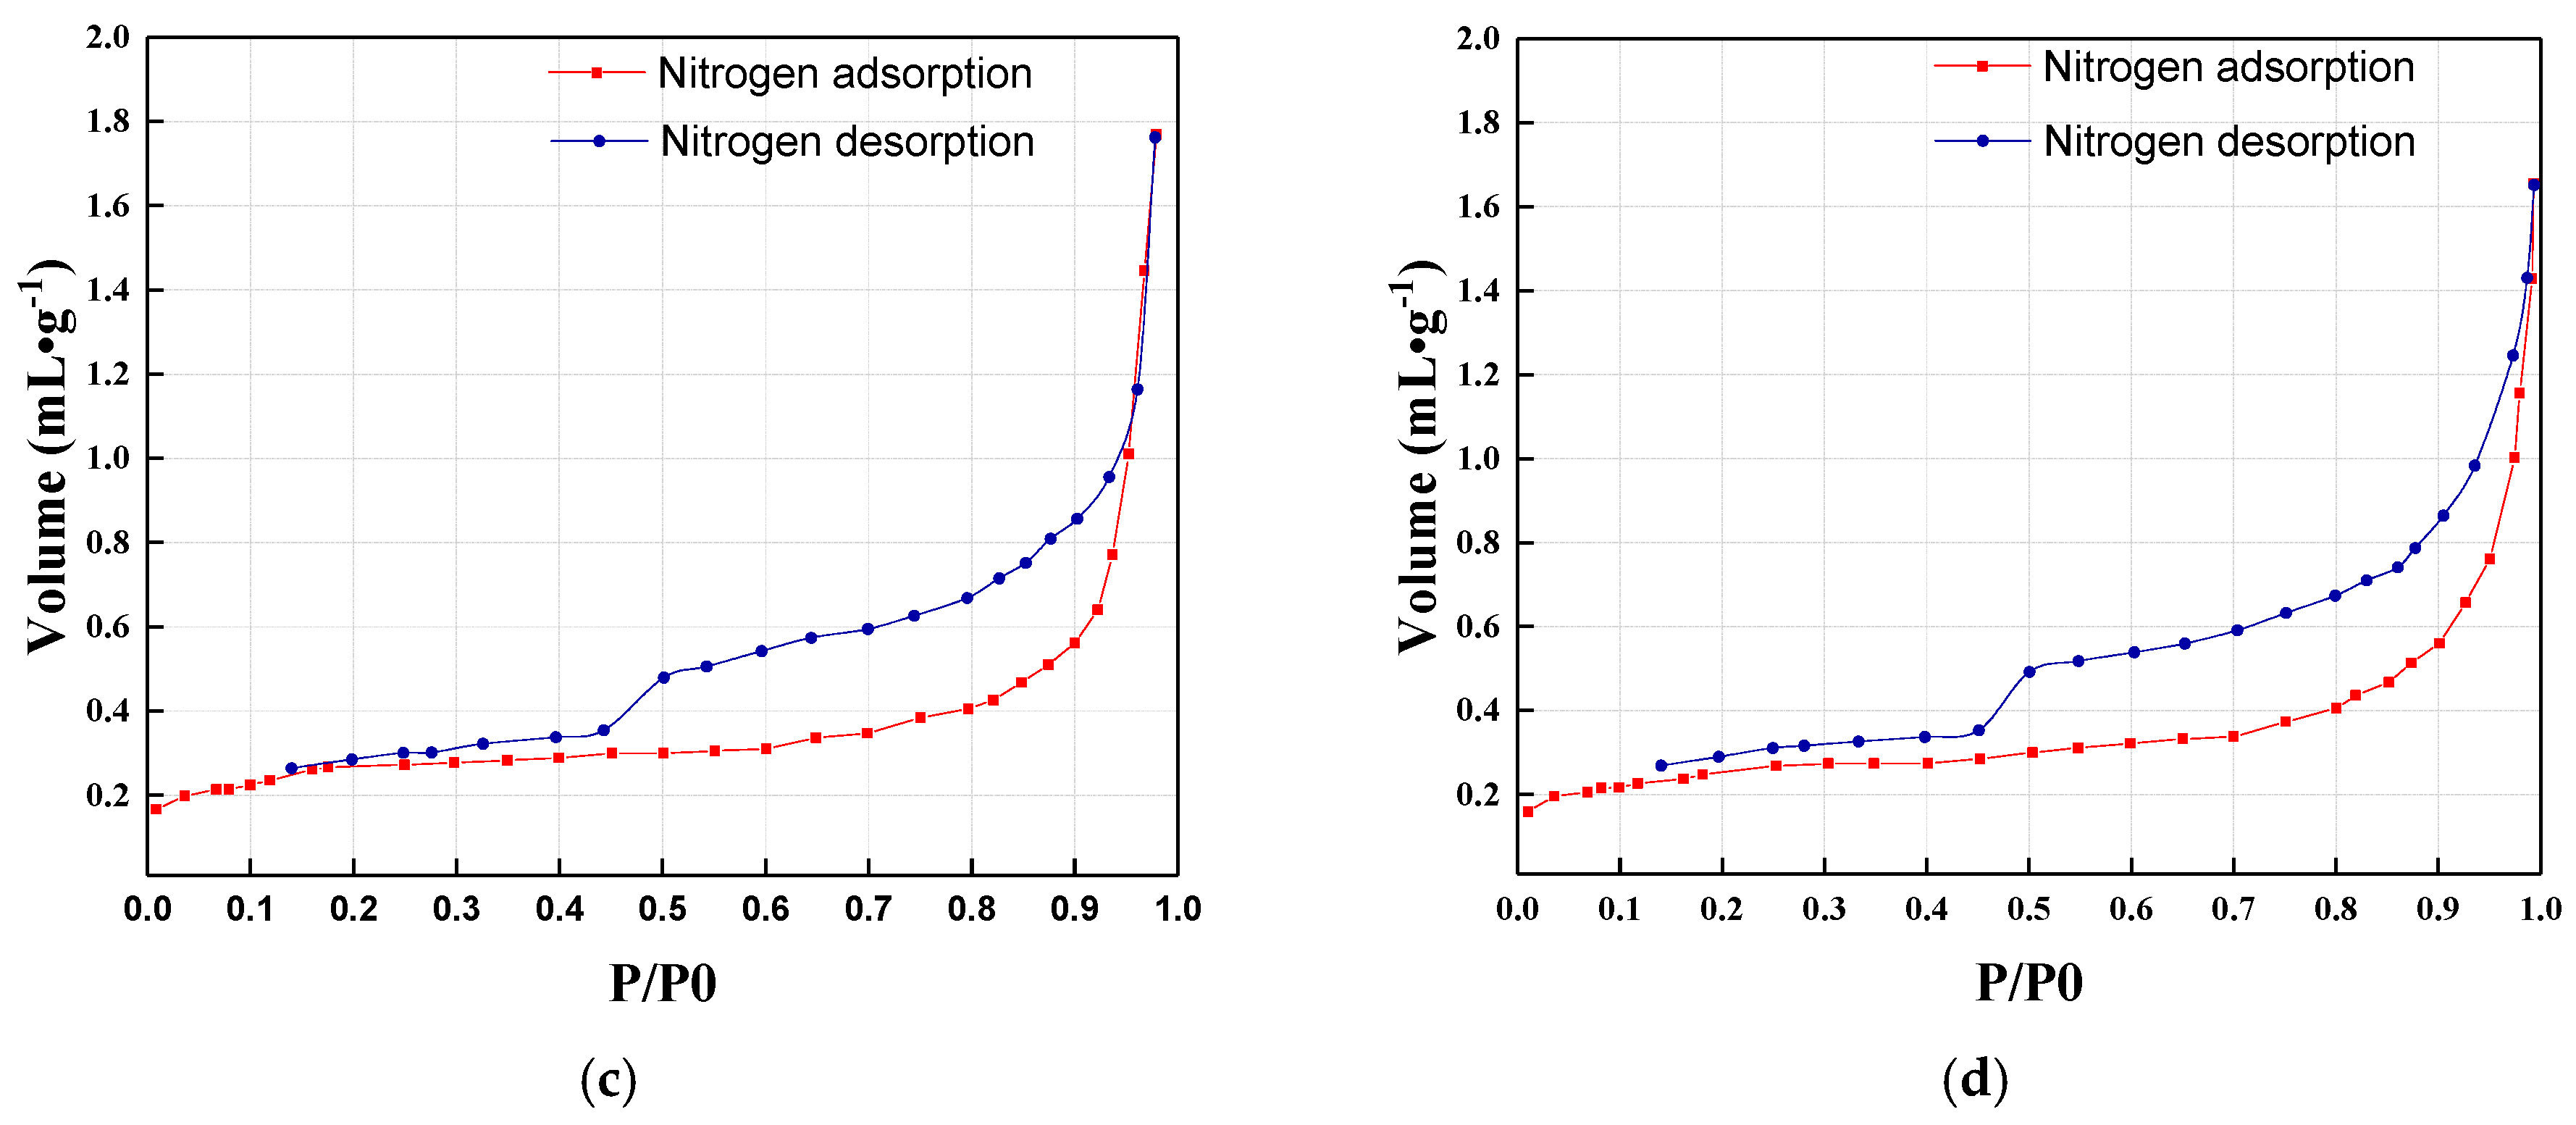
3.4. Nitrogen Adsorption Results of Mixed Coal

Figure 6 shows the curves of nitrogen adsorption and desorption of different coal samples (tectonic coal, virgin coal, and mixed coal with the mass ratios of 2:4, 3:3) with respect to the relative pressure (p/p0). The nitrogen adsorption curve is not completely coincident with the desorption curve and forms a hysteresis loop of adsorption. The nitrogen adsorption curve was observed to rise steeply at the saturated vapor pressure, but the nitrogen desorption curve was observed to decline steeply at medium p/p0 pores with parallel siding slit-shaped openings, which are typical pore structures described by those curves. Pores with a large volume and small diameter also exhibited the same curves. It was shown that the studied coal samples had parallel plate slit-type pore structures.

4. Discussion

4.1. Effect of Mixed Coal Mass Ratio on Gas Adsorption Constant

4.1.1. Effect of Mixed Coal Mass Ratio on Gas Adsorption Constant a Value

The Langmuir constants a and b were obtained from the adsorption test, and the Langmuir model was used to fit the test results. According to the experimental results, the relationship between the adsorption constant a and the mass ratio of tectonic coal to virgin coal was fitted and plotted, as shown in Figure 7. The curve has a good fit (0.9805). For mixed samples of hard tectonic coal in this mine, the adsorption constant a meets the fitting formula [45,46]:
a = 1.5369 x 2 + 12.847 x + 17.658
where x is the mass ratio of tectonic coal to virgin coal.
With the increase of the quality of tectonic coal, the Langmuir adsorption constant a increased gradually. When the qualities of tectonic coal and the quality of virgin coal were approximately equal, the adsorption constant a value reached its maximum; then, with the continued increase of the quality of tectonic coal, the value dropped.
From the Langmuir model, we know that the Langmuir constant a represents the maximum adsorption volume. From our laboratory test, we found that in the mixed coal, when the quality of tectonic coal was equal to that of virgin coal, the maximum adsorption capacity was reached. From the adsorption isotherm, we found that tectonic coal has a higher adsorption capacity than virgin coal. As a result, as the percentage of tectonic coal in the mixed coal sample increased, the total adsorption volume exhibited an increasing trend. For the mixed coal adsorption, the applied force onto the mixed coal sample also had impact on the adsorption capacity. As a result, when the mixed coal sample was placed into the coal sample tank, the applied force would compact the mixed coal sample. If the sample was entirely tectonic coal, the coal sample would be easily compressed and the total pore volume would decrease. Therefore, when the tectonic coal exceeded a certain percentage, the total adsorption capacity would decrease. When the qualities of tectonic coal and the overlying virgin coal were approximately equal, the adsorption volume reached a maximum. Then the value of the adsorption constant a gradually decreased as the quality of the tectonic coal increased. It could be seen that the change tendency gradually declined after exceeding the maximum value. Moreover, by calculating the slope of the tangent line at a certain experimental point before and after the maximum value, it could be seen that the change trend slowly declined after passing the maximum value.

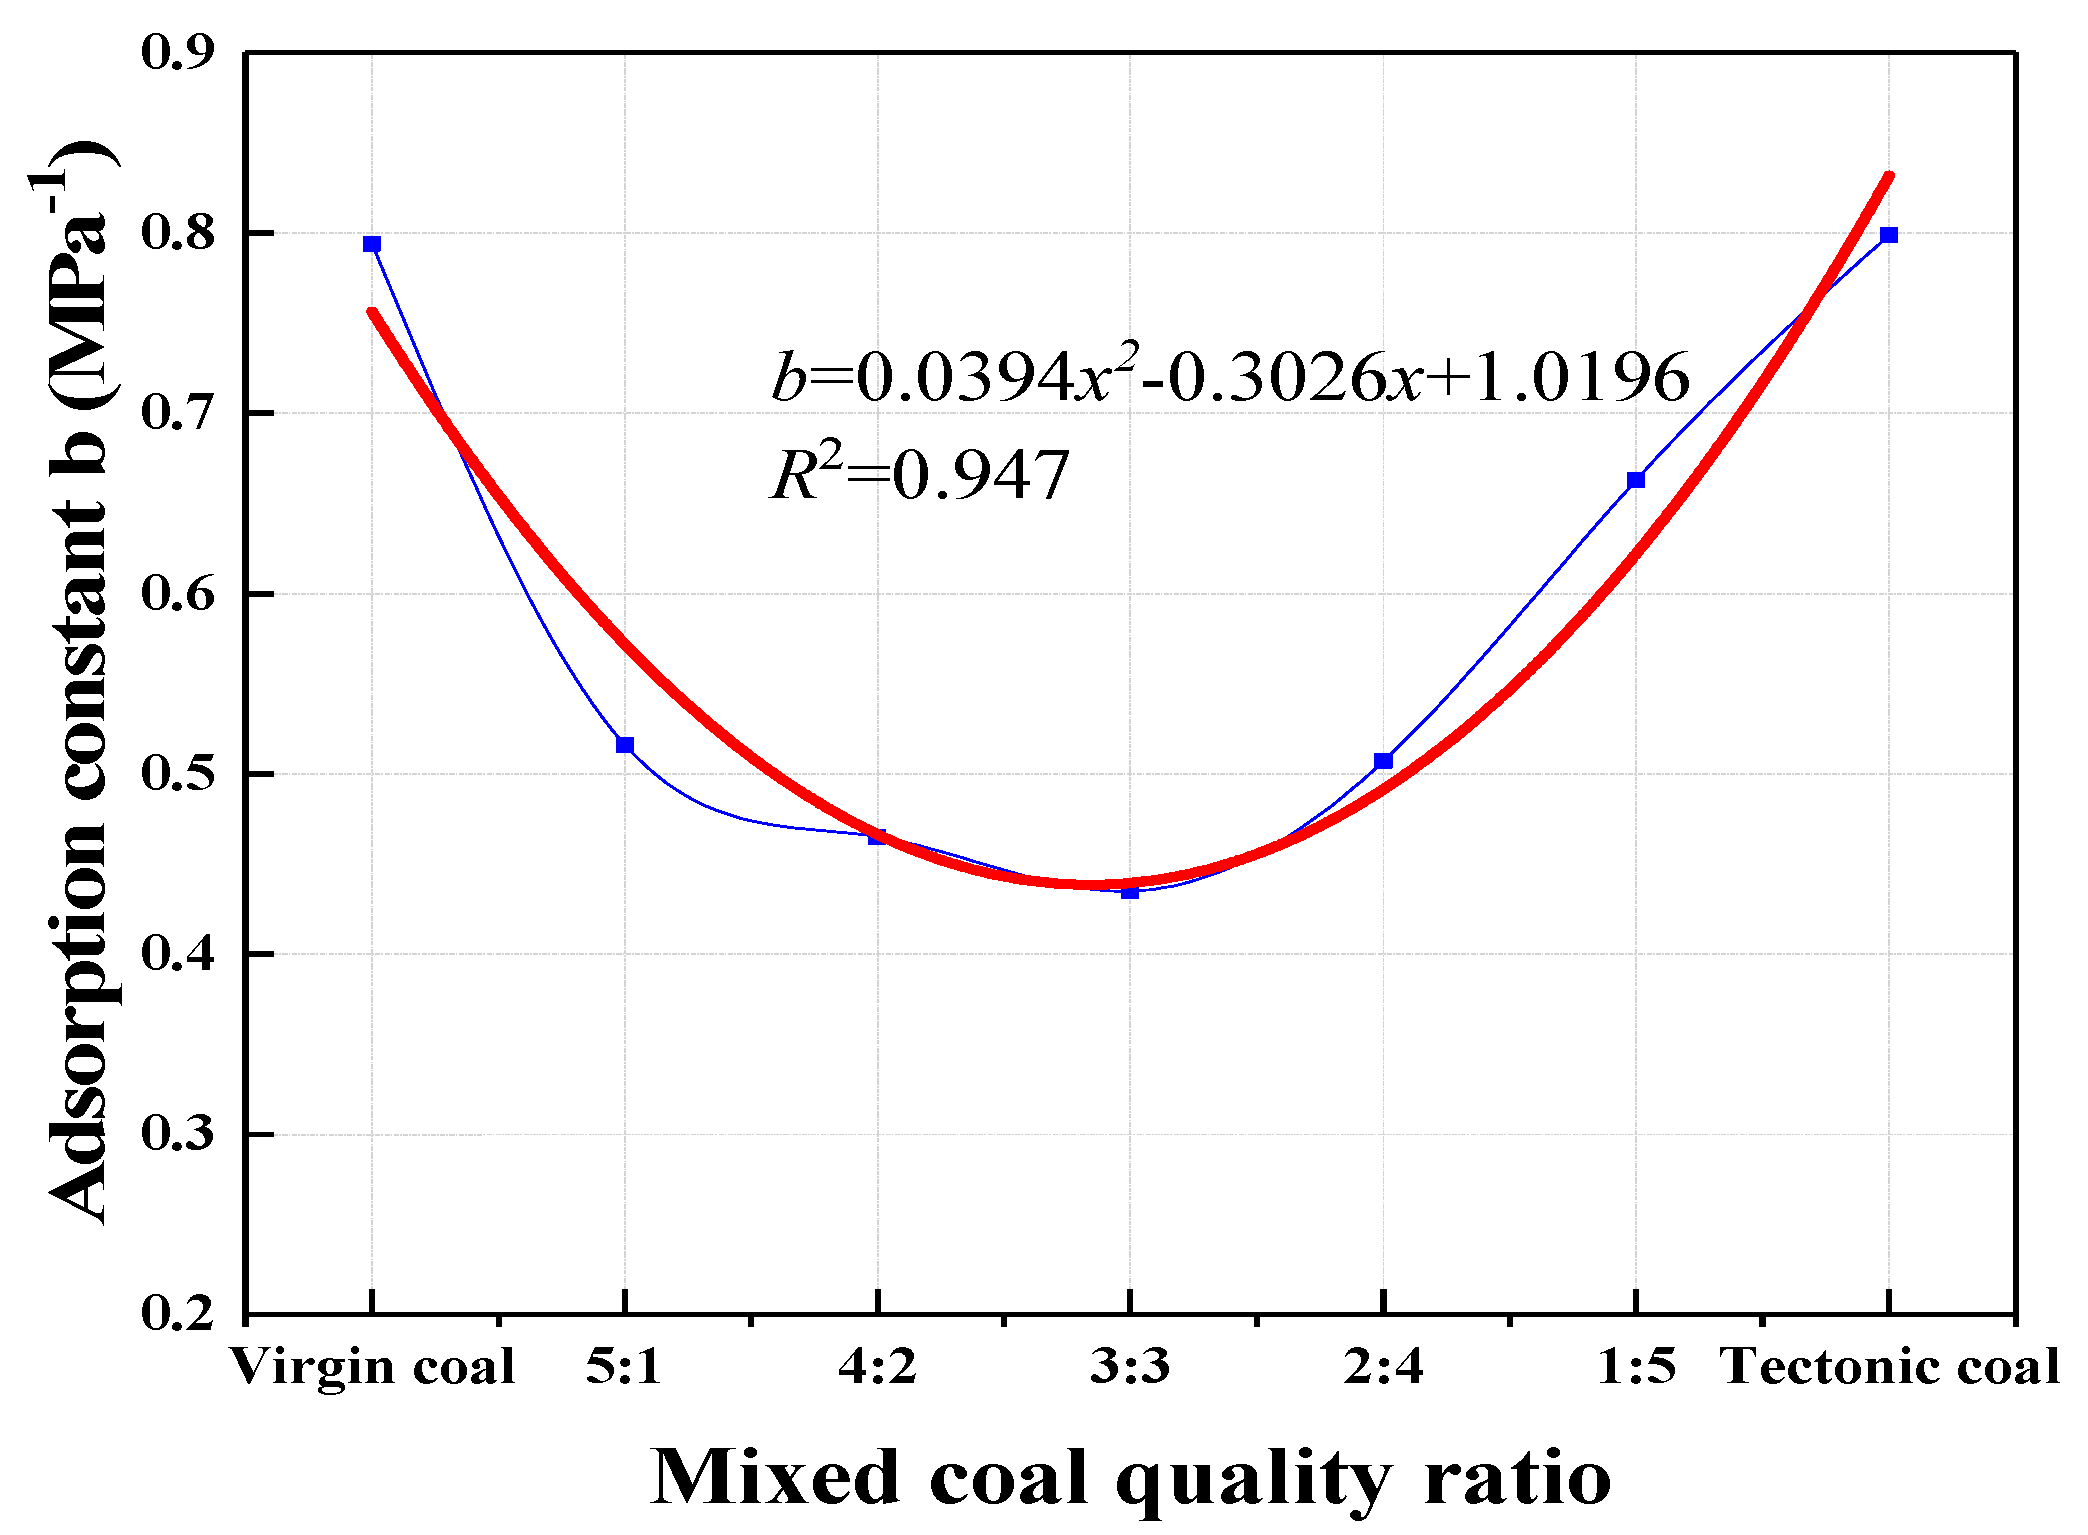
4.1.2. Effect of Mixed Coal Mass Ratio on Gas Adsorption Constant b Value

According to the experimental results, the data describing the relationship between the adsorption constant b and the mass ratio of tectonic coal to virgin coal were fitted and plotted on a graph, as shown in Figure 7. The curve has a high fit degree (0.974). For mixed samples of hard tectonic coal in this mine, the adsorption constant a meets the fitting formula. For mixed samples of tectonic coal and virgin coal, adsorption constant b also meets the fitting formula.
b = 0.0394 x 2 0.3026 x + 1.0196
where x is the mass ratio of tectonic coal to virgin coal.
In the formula for Langmuir monomolecular layer adsorption, the adsorption constant b is a pressure coefficient, and it is inversely proportional to the gas pressure in the pores of the coal. The change tendency of the value of adsorption constant b with the change of the mass ratio of tectonic coal to virgin coal is shown in Figure 8. The change trend of the Langmuir adsorption constant b is a parabola opening upward with the mass ratio change of tectonic coal to virgin coal.
The formation of tectonic coal in the early stage, the quality of virgin coal is relatively high, so it puts a lot of pressure on the tectonic coal. Although the adsorption capacity of mixed coal is not dominated by virgin coal, virgin coal has a large mass and more heat, which increases the dynamic viscosity coefficient of the pore gas in mixed coal. Furthermore, it greatly increases the amount of gas retention in the pores, resulting in increased pressure. Meanwhile, overlying virgin coal puts pressure on tectonic coal and increases its pore resistance, causing the adsorption constant b value to show a decreasing trend. When the qualities of tectonic coal and virgin coal were approximately equal, the adsorption constant b reached its minimum. After that, with the further increase in the quality of tectonic coal, the methane adsorption was dominated by tectonic coal. Due to the high adsorption capacity of tectonic coal, the heat generated by the adsorption process also increased. When the temperature reached the equilibrium point, the coal began to exchange heat with the outside world, which caused the temperature of the coal to be drastically reduce. The viscosity coefficient of the gas in the pores of the coal became smaller due to the temperature’s influence, so that the gas pressure in the pores of the coal decreased and the adsorption constant b gradually increased. The change tendency of the adsorption constant b revealed that the rising rate after the maximum was reached was lower than the declining rate before the maximum was achieved. This was determined by finding the slope of the tangent of a certain experimental point before and after the maximum value.
From previous studies [47,48,49,50], we know that coal seam porosity is sensitive to the effects of stress, as well as to the strength coefficient. The results obtained in this study give new insight into the mechanisms of coal seams containing different layers.

4.2. Analysis of Specific Surface Area Changes of Mixed Coal before and after Adsorption

Figure 9 shows the percentage difference of macro and micro pores’ specific surface area (after adsorption/before adsorption). From the test results, it was found that the macro pore specific surface area ratio showed a decreasing trend before reaching the mass ratio of 3:3. With the increase of the mass proportion of tectonic coal, the specific surface areas of medium and macro pores before and after adsorption showed a decreasing trend first, followed by an increasing trend. When the qualities of tectonic coal and virgin coal were approximately equal, the trend reached its minimum. Because the mixed coal was dominated by virgin coal, the adsorption capacity of the mixture was dominated by that of the virgin coal. The swelling induced by gas adsorption in the pores of coal was not obvious. When the gas could not be completely desorbed from the coal, the resistance of desorbed gas was measured using a physical adsorption instrument to test the pore specific surface area. The specific surface area of macro pores showed a declining trend. When the qualities of tectonic coal and virgin coal were approximately equal, the proportion of the specific surface area of macro pores reached its minimum. With the increase in quality of the tectonic coal, the pore structure became more developed. Micro pores connected to each other to form small holes by the adsorption of gas, which caused the specific surface area of macro pores in the mixed coal to continuously increase. With the increase in quality of the tectonic coal, the pore volume gradually reached equilibrium, which also caused the specific surface area to increase slowly.
It can be seen from Figure 9 that the specific surface area changing trend is contrary to that of Figure 3 with the increase in quality of the tectonic coal. When the qualities of tectonic coal and virgin coal were approximately equal, the trend reached a minimum and then declined. By fitting the experimental data, the variation of the pore specific surface area and micro pore specific surface area in the total coal sample before and after adsorption was obtained according to the following relationship:
θ = i = i 2 θ i = i = 1 2 B o i 1 + B 1 i e B 2 i x i
where θ is the difference between the proportions of specific surface area of coal before and after adsorption; θi (i = 1, 2) is the difference between the proportions of specific surface area of micro pores or macro pores before and after adsorption; and xi (i = 1, 2) is the proportion of structural coal to total coal sample. B0i, B1i, B2i are fitting constants.

4.3. The Relationship between the Specific Surface Area before and after Adsorption and Swelling Deformation and Strain

The adsorption amount of mixed coal varied under different pressures and different contents of tectonic coal. The swelling also varied. Therefore, there must be some connection between the gas adsorption capacity and the coal swelling deformation. The strain of coal after adsorption can be expressed as follows according to the results of previous studies [51].
ε m = K m × W m
where εm is the volume strain after adsorption. Wm is the amount of gas adsorbed by a unit mass coal under a certain temperature, pressure, and mass ratio of tectonic coal to the mixed coal, mL·g−1. Km is the expansion strain coefficient, g·mL−1. m is the abbreviation of mixture, denoting the mixed coal sample.
The relationship between the gas adsorption and the amount of tectonic coal shown in Figure 9 is expressed by Equation (1). The function for macro pore and micro pore surface areas are expressed by Equations (7) and (8):
x 1 = I n ( B 10 B 11 θ 1 1 B 11 ) 1 B 12
x 2 = I n ( B 20 B 21 θ 1 1 B 21 ) 1 B 22
By substituting Equations (7) and (8) into Equation (2), we obtain:
W 1 = A 10 [ I n ( B 10 B 11 θ 1 1 B 11 ) 1 B 12 ] 2 + A 11 I n ( B 10 B 11 θ 1 1 B 11 ) 1 B 12 + A 12
W 2 = A 20 [ I n ( B 20 B 21 θ 2 1 B 21 ) 1 B 22 ] 2 + A 21 I n ( B 20 B 21 θ 2 1 B 21 ) 1 B 22 + A 22
Let B 10 B 11 θ 1 1 B 11 = D 10 θ 1 D 11 θ 1 , B 20 B 21 θ 2 1 B 21 = D 20 θ 2 D 21 θ 2 . Therefore, the total adsorption amount can be expressed as: W m = W 1 + W 2 . Merging Equations (9) and (10), we obtain:
W m = F i i , j = 0 2 [ I n ( D i j θ j D i j + 1 θ j ) 1 D i j + 1 ] 2 + F i + 1 i , j = 0 2 I n ( D i j θ j D i j + 1 θ j ) 1 D i j + 1 + F i + 2
where W1, W2 are the adsorption amount of macro pores and micro pores, mL·g−1. Bij, Dij, Fi+n (i = 1, 2; j = i − 1) are fitting constants, which are affected by the characteristics of the coal sample.
The relationship between the strain after the adsorption of mixed coal and the change of specific surface area before and after adsorption can be obtained by substituting Equation (11) into Equation (6).
ε m = K m [ F i i , j = 0 2 [ I n ( D i j θ j D i j + 1 θ j ) 1 D i j + 1 ] 2 + F i + 1 i , j = 0 2 I n ( D i j θ j D i j + 1 θ j ) 1 D i j + 1 + F i + 2 ]
Under a certain depth, the rock will put pressure on coal. Thus, the swelling strain of the coal after gas adsorption is limited. Therefore, additional stress will be generated, called adsorption swelling strain. Because of the increase of the swelling stress, the stress of coal will increase and the strength of coal will decrease, which will promote the occurrence of gas outbursts. Zhang [52] studied the adsorption swelling when adsorbing CO2 using a rigid dynamometer. It was found that there is a good linear relationship between the adsorption deformation stress and the desorption deformation stress. Because the adsorption of CO2 and CH4 on coal are physical adsorption processes, the linear relationship between the adsorption deformation stress and the desorption deformation stress can be used to express the relationship between the swelling deformation and the expansion stress of coal following the adsorption of gas. Combining the experimental data, the relationship between swelling stress and the change of pore specific surface area before and after adsorption can be obtained using the following equation:
σ m = E m K m [ F i i , j = 0 2 [ I n ( D i j θ j D i j + 1 θ j ) 1 D i j + 1 ] 2 + F i + 1 i , j = 0 2 I n ( D i j θ j D i j + 1 θ j ) 1 D i j + 1 + F i + 2 ]
where σ m is the swelling stress of mixed coal after adsorption, MPa. Em is the proportionality coefficient corresponding to σ m , which is equivalent to the elastic modulus of coal, MPa.

4.4. Mechanism Analysis of the Effect of Swelling of Mixed Coal on the Amount of Gas Emissions

After a coal seam is disturbed by mining, the original pressure balance in the coal seam will be broken and a pressure gradient as well as content change will occur. This is the main factor concerning gas emissions and threatening the safety of coal mines. Particularly in coal seams containing tectonic coal, they are affected by the vitrinite content, which has a good adsorption performance causing the amount of gas in the coal to increase. Moreover, the strength of coal is low under the influence of geological tectonic force. When the gas content is large, the gas molecules in the adsorbed state enter into the coal, resulting in a large expansion deformation of the coal. This causes the amount of pores, the specific surface area, and the gas adsorption capacity to increase.
At the same time, gas adsorption changes the specific surface area of coal, and this change is manifested in the form of swelling energy. Meanwhile, the changes of gas adsorption will lead to the increase of gas adsorption and swelling stress, in addition to the decrease of the strength of the coal. When a coal seam is disturbed by mining, the adsorption energy between coal and gas is only 1.16 kJ/mol [53], so it takes very little energy to go from the adsorption state to the free state. From our experiments, we found that when the qualities of tectonic coal and the overlying virgin coal are approximately equal, the content of micro pores reached its maximum, and the adsorption amount also reached its maximum. A pressure gradient will occur when the pressure balance is disrupted. This leads to a high amount of gas emissions, and may even cause coal and gas outburst disasters.

5. Conclusions

In this paper, the adsorption characteristics of mixed coal (virgin coal and tectonic coal) and variations of specific surface areas before and after CH4 adsorption were researched. The effect of different mass ratios of coal samples on the adsorption constants a and b and the change of the specific surface area before and after adsorption were studied. A mathematical model of the relationship between the strain after gas adsorption and the specific surface area change before and after adsorption was created. In addition, a mathematical model of the relationship between swelling stress and the specific surface area change before and after adsorption was deduced. The main conclusions are summarized below.
(1)
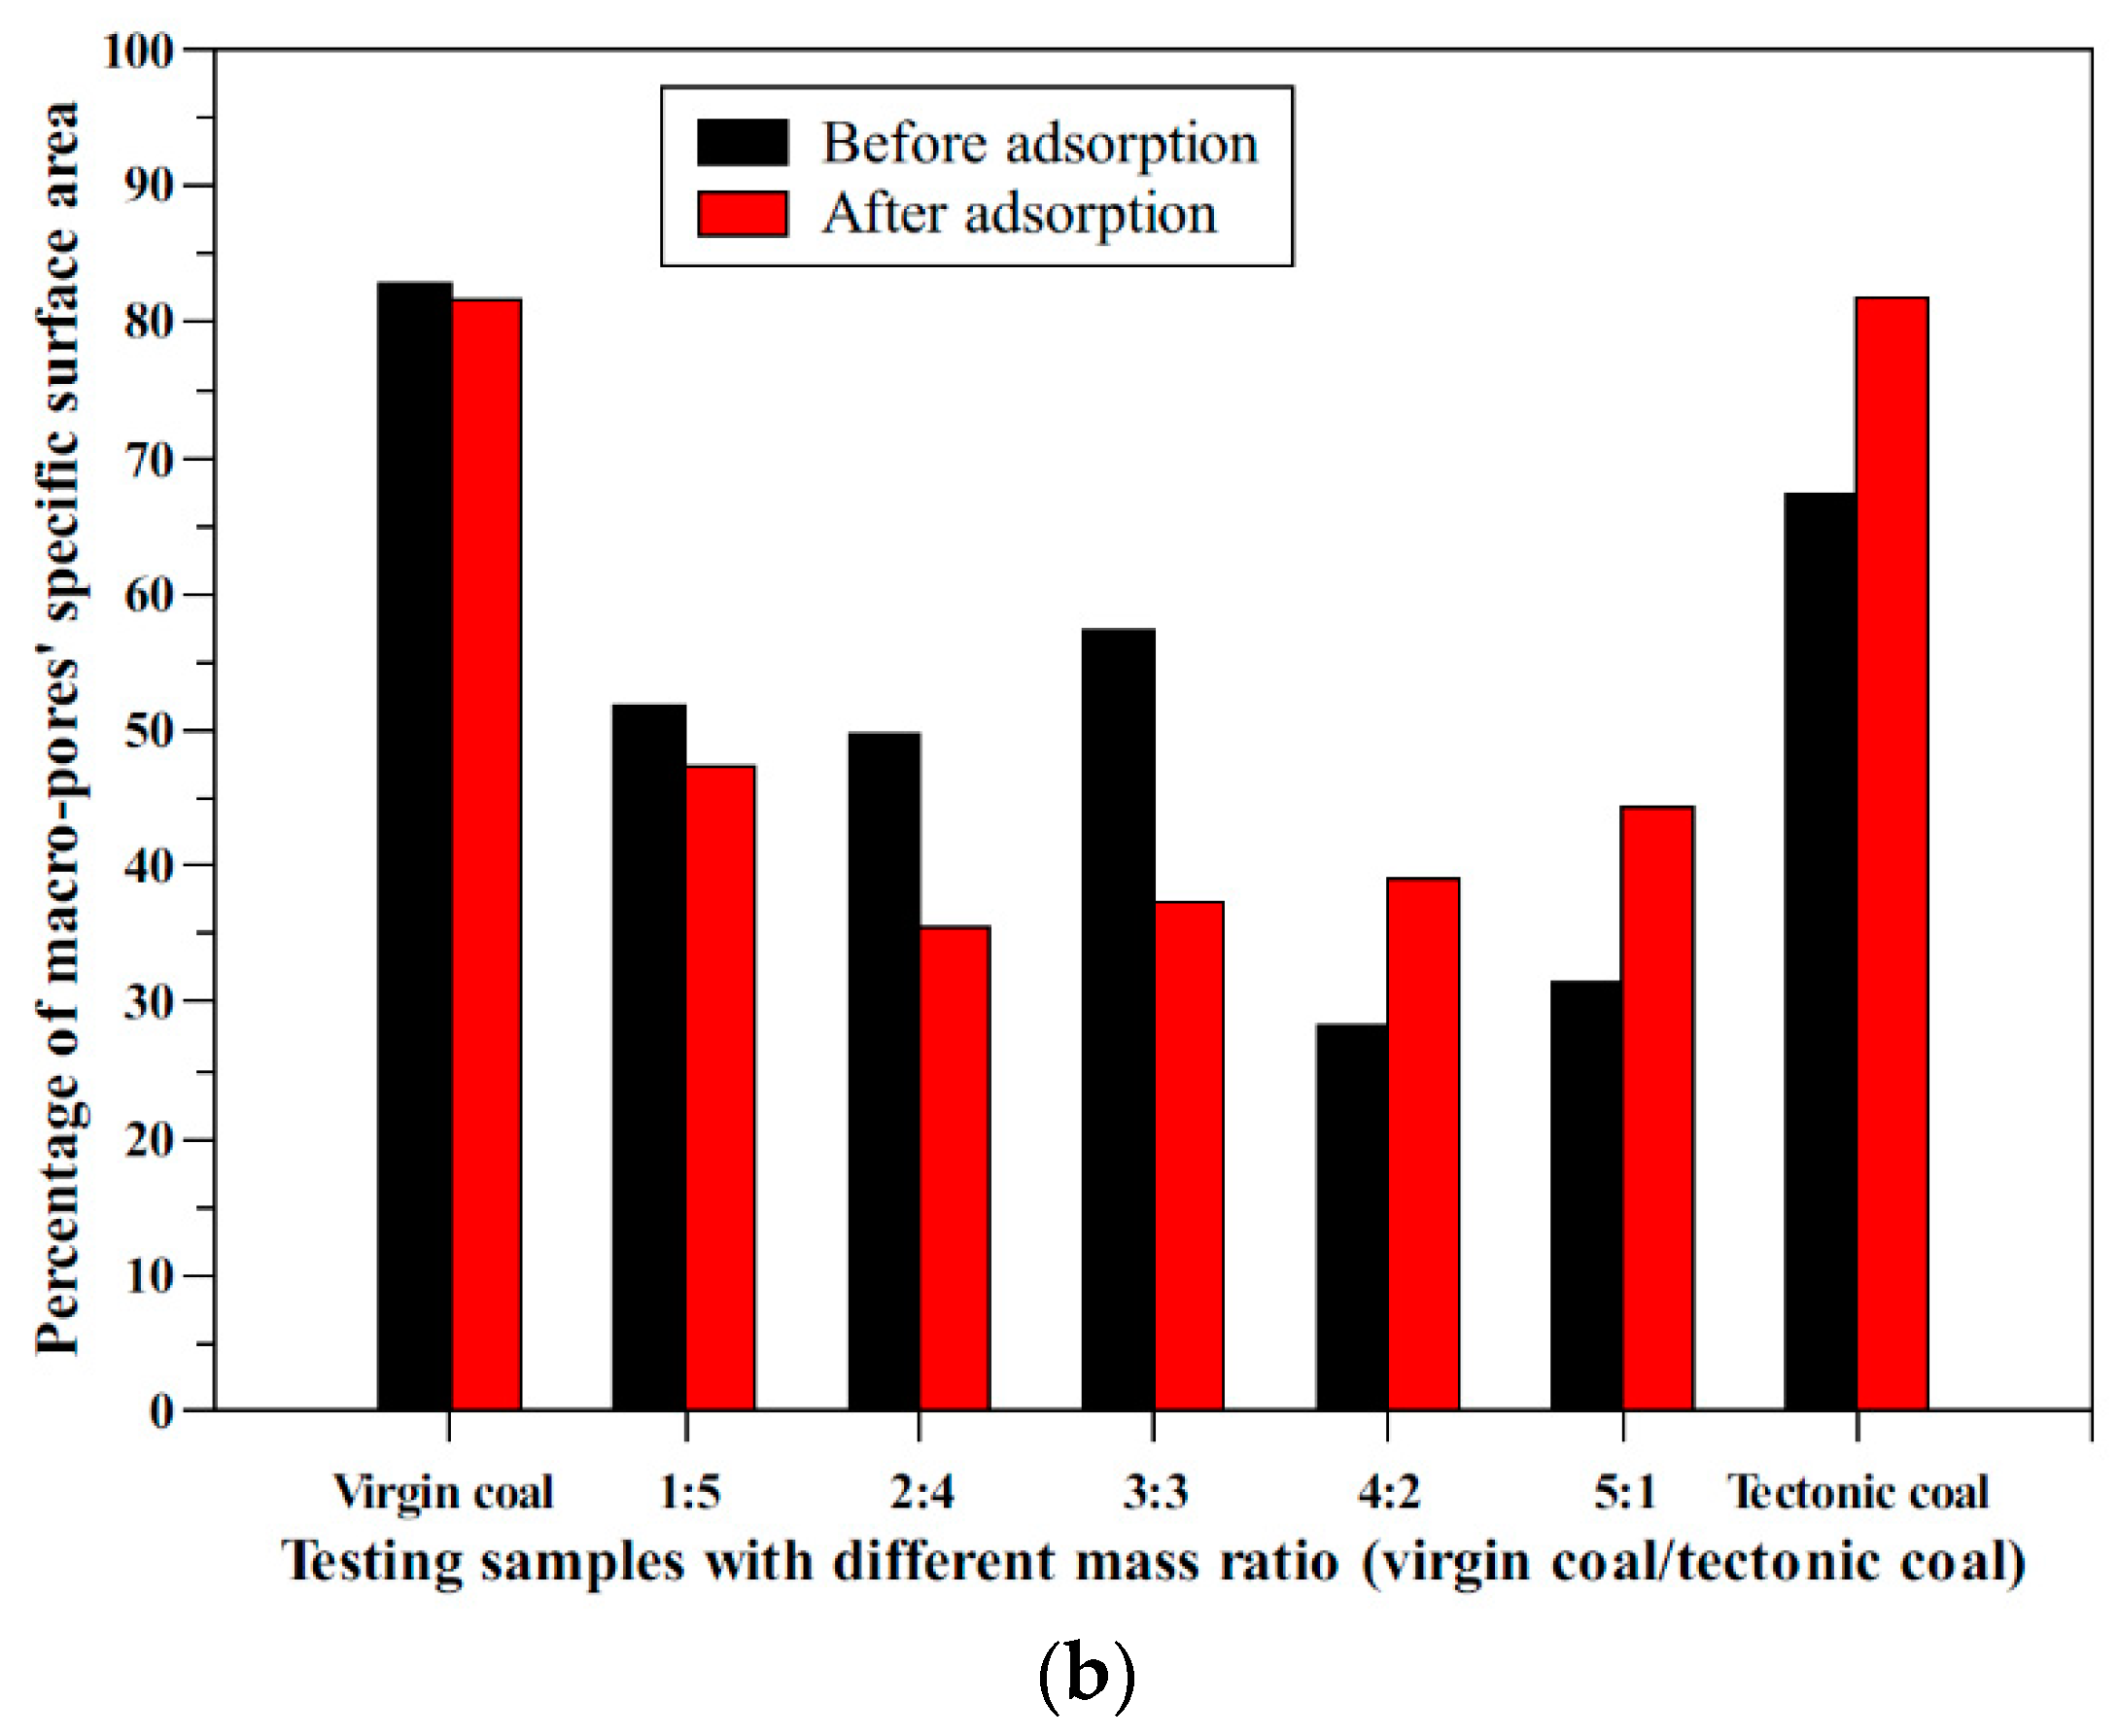
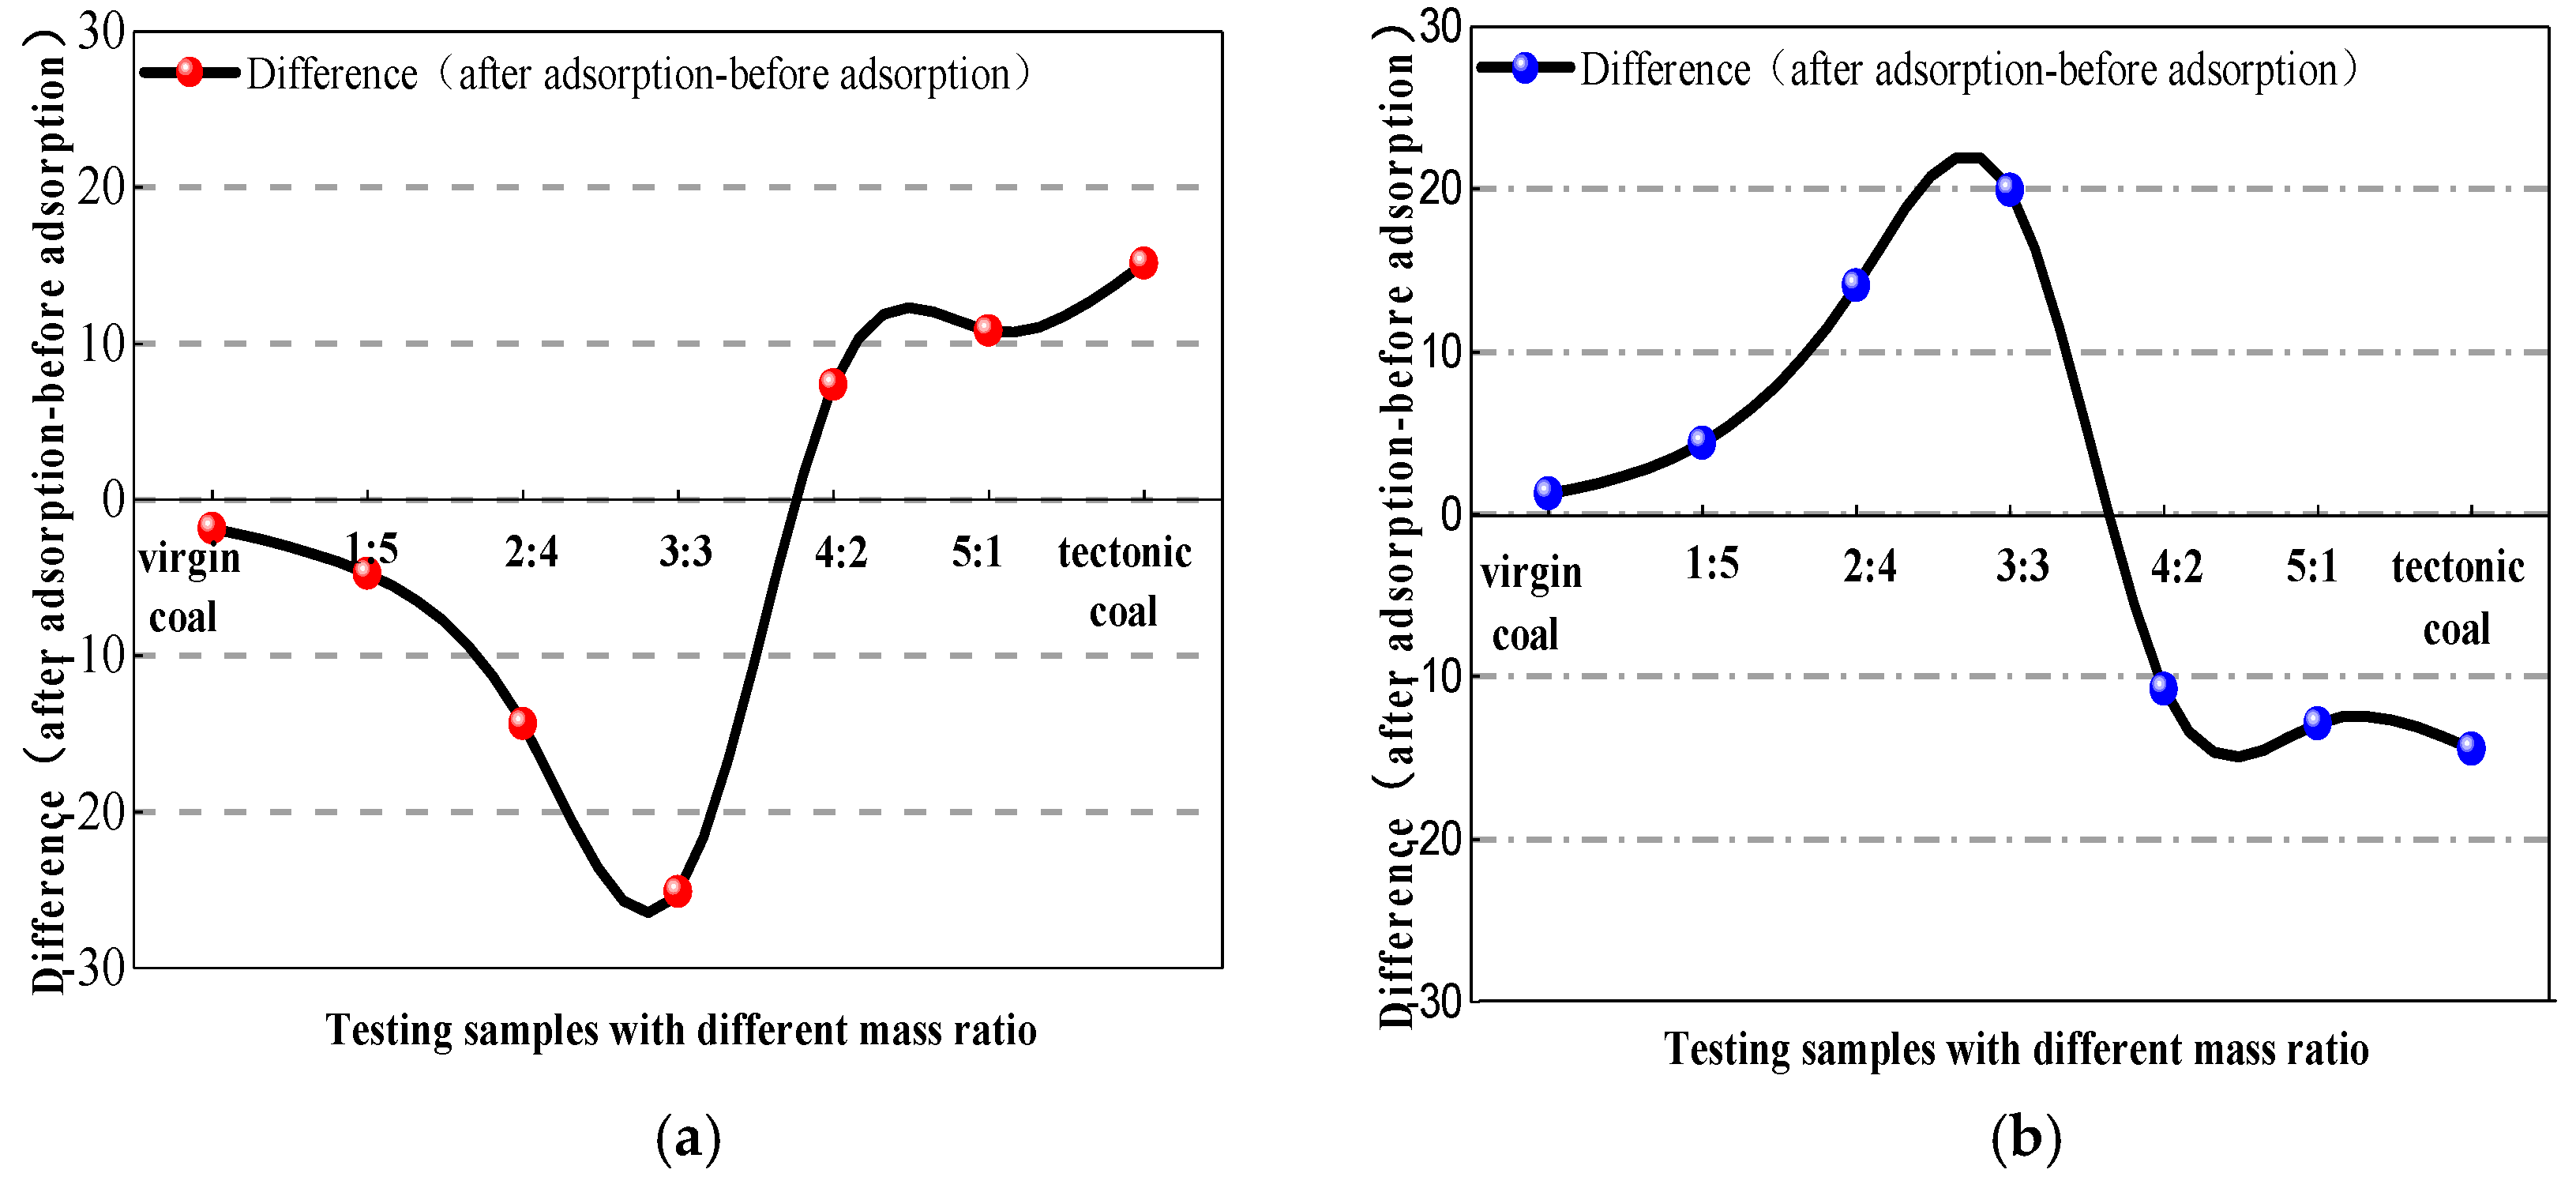
Through the analysis of the test results of the specific surface area of the mixed coal sample, it was concluded that with the increasing proportion of the mass of the tectonic coal in the mixed coal sample, the difference of the proportion of the pore specific surface area before and after the adsorption of the coal sample showed a decreasing trend first and then increased and reached the minimum when the masses of tectonic coal and virgin coal were approximately equal. The change trend of the specific surface area of macro pores was opposite that of the specific surface area of micro pores.
(2)
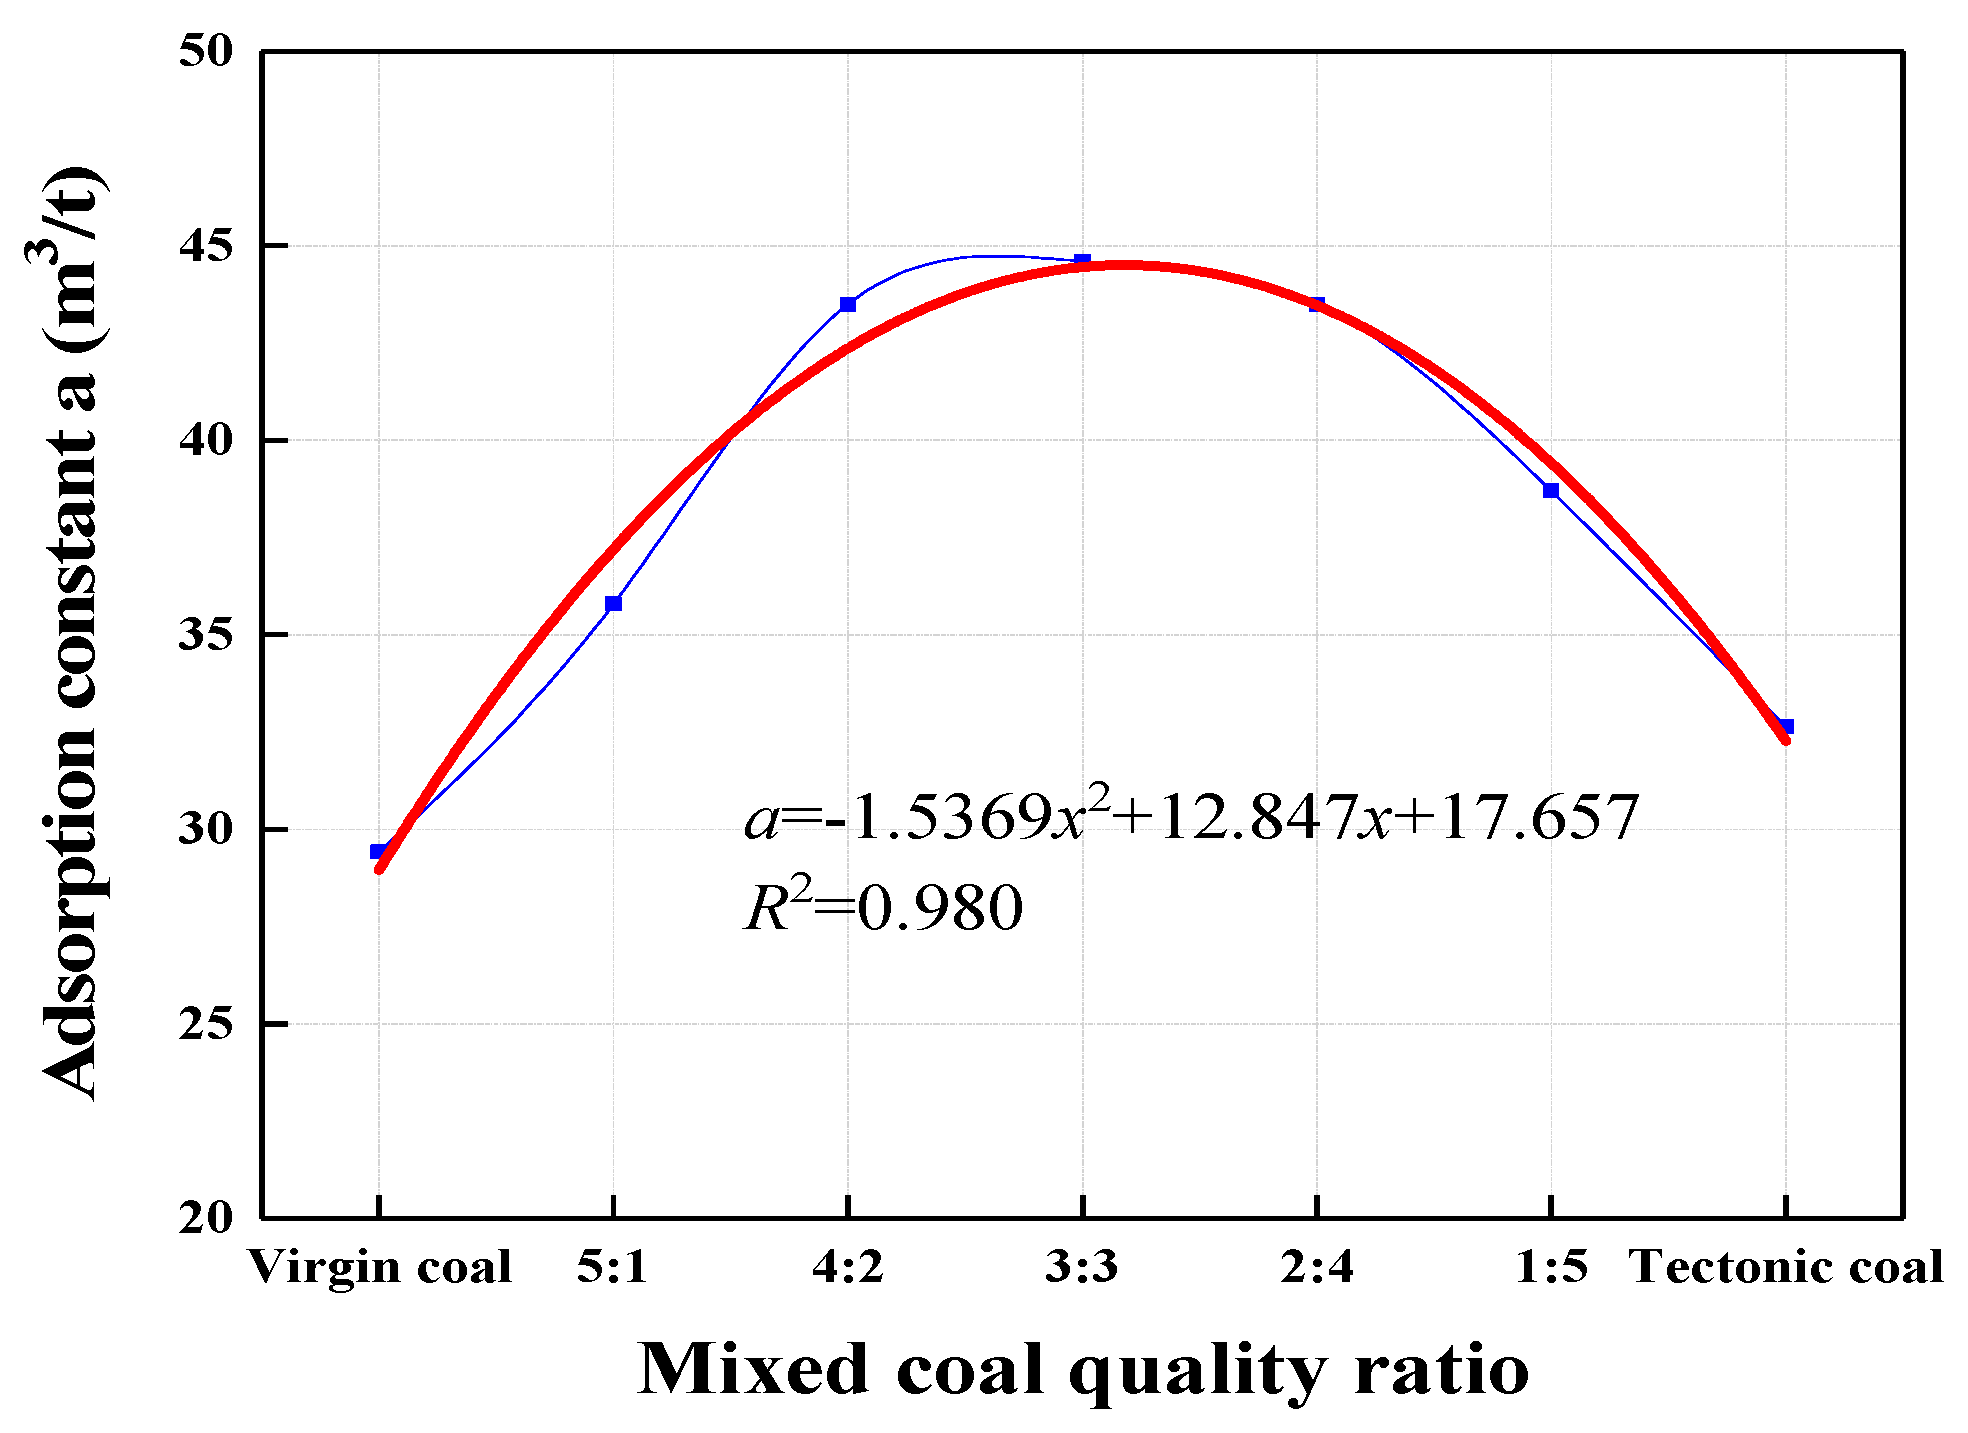
By analyzing the experimental results, it was concluded that with an increase in the quality of the tectonic coal, the adsorption capacity of the mixed coal gradually increased. Under constant pressure, the amount of adsorbed gas changed with the mass ratio of the mixed coal, showing a downward parabola change characteristic. When the qualities of tectonic coal and virgin coal were approximately equal, the amount of gas adsorption, adsorption constant a value, and gas initial velocity of diffusion reached their maximums, but the adsorption constant b value reached its minimum.
(3)
On the basis of the gas adsorption test results of the mixed coal sample, the mathematical model of gas adsorption strain and pore specific surface area changes before and after adsorption in the mixed coal sample and the mathematical model of swelling stress and the variation of pore specific surface area before and after adsorption in the mixed coal sample were created. These models reflect the variation of the expansion strain and stress of the mixed coal sample after gas adsorption, and describe that when the mass ratio of virgin coal to tectonic coal was approximately equal, a large amount of gas is likely to gush out after coal disturbance, providing a theoretical basis for the further study of coal and gas outburst mechanisms.
In conclusion, the experimental study of the adsorption process in mixed coal in this paper provides a certain experimental scientific theory and lays a technical foundation for the further study of the gas adsorption characteristics near coal seams of mine structures. This information can help in effectively controlling the difficulties of coal dynamic disasters and studying the corresponding disaster prevention and control technology.

Author Contributions

Conceptualization, P.Z. and H.L. (Hui Liu); methodology, S.L.; validation, H.L. (Haifei Lin); Y.J. and H.L. (Hui Liu); formal analysis, M.Y.; data curation, M.Y.; writing—original draft preparation, P.Z. and J.L.

Funding

This research was funded by National Natural Science Foundation grants of China (51604219, 51674192, 51604220), the Basic Research on National Natural Science Foundation key project of China (51734007), and the Project of the Tian Shan Innovation Team (2018D14003). The authors wish to acknowledge the Tian Chi Coal Mine for providing the coal samples used in this study.

Conflicts of Interest

The authors declare no conflict of interest.

References

  1. Liu, C. Distribution Laws of in-Situ Stress in Deep Underground Coal Mines. Procedia Eng. 2011, 26, 909–917. [Google Scholar] [CrossRef]
  2. Liang, Y. Strategic thinking of simultaneous exploitation of coal and gas in deep mining. J. Chin. Coal Soc. 2016, 41, 1–6. [Google Scholar]
  3. Jin, K.; Cheng, Y.; Ren, T.; Zhao, W.; Tu, Q.; Dong, J. Experimental investigation on the formation and transport mechanism of outburst coal-gas flow: Implications for the role of gas desorption in the development stage of outburst. Int. J. Coal Geol. 2018, 194, 45–58. [Google Scholar] [CrossRef]
  4. Si, G.; Sevket, D.; Sergej, J.; Jerneja, L.; Kerstin, A.; Anna, K.; Shi, J.; Simon, Z.; Grzegorz, M.; Adam, L. Seismic monitoring and analysis of excessive gas emissions in heterogeneous coal seams. Int. J. Coal Geol. 2015, 149, 41–54. [Google Scholar] [CrossRef]
  5. Si, G.; Sergej, J.; Jerneja, L.; Shi, J.; Sevket, D.; Anna, K.; Simon, Z. Monitoring and modelling of gas dynamics in multi-level longwall top coal caving of ultra-thick coal seams, part I: Borehole measurements and a conceptual model for gas emission zones. Int. J. Coal Geol. 2015, 144/145, 98–110. [Google Scholar] [CrossRef]
  6. Laxminarayana, C.; Crosdale, P.J. Role of coal type and rank on methane sorption characteristics of Bowen Basin, Australia coals. Int. J. Coal Geol. 1999, 40, 309–325. [Google Scholar] [CrossRef]
  7. Pan, J.; Hou, Q.; Ju, Y.; Bai, H.; Zhao, Y. Coalbed methane sorption related to coal deformation structures at different temperatures and pressures. Fuel 2012, 102, 760–765. [Google Scholar] [CrossRef]
  8. Levy, J.H.; Day, S.J.; Killingley, J.S. Methane capacities of Bowen Basin coals related to coal properties. Fuel 1997, 76, 713–819. [Google Scholar] [CrossRef]
  9. Bustin, R.M.; Clarkson, C.R. Geological controls on coalbed methane reservoir capacity and gas content. Int. J. Coal Geol. 1998, 38, 3–26. [Google Scholar] [CrossRef]
  10. Su, X. Influence of coal rank on coal adsorption capacity. Natl. Gas Ind. 2005, 25, 19–21. [Google Scholar]
  11. Peng, X.; Cheng, X.; Cao, D. Computer simulations for the adsorption and separation of CO2/CH4/H2/N2 gases by UMCM-1 and UMCM-2 metal organic frameworks. J. Mater. Chem. 2011, 21, 11259–11270. [Google Scholar] [CrossRef]
  12. Qi, L.; Lin, B.; Zhi, X. Study on the Mechanism of Coal and Gas Dynamic Phenomenon in Majiagou Mine. Chin. Saf. Sci. J. 2006, 12, 30–34. [Google Scholar]
  13. Weishauptová, Z.; Medek, J.; Kovář, L. Bond forms of methane in porous system of coal II. Fuel 2004, 83, 1759–1764. [Google Scholar] [CrossRef]
  14. Buss, E. Gravimetric measurement of binary gas adsorption equilibria of methane—Carbon dioxide mixtures on activated carbon. Gas Sep. Purif. 1995, 9, 189–197. [Google Scholar] [CrossRef]
  15. Talu, O. Needs, status, techniques and problems with binary gas adsorption experiments. Adv. Colloid Interface Sci. 1998, 76, 227–269. [Google Scholar] [CrossRef]
  16. Cowlard, F.C.; Lewis, J.C. Vitreous carbon—A new form of carbon. J. Mater. Sci. 1967, 2, 507–512. [Google Scholar] [CrossRef]
  17. Jin, K.; Cheng, Y.; Liu, Q.; Zhao, W.; Wang, L.; Wang, F. Experimental Investigation of Pore Structure Damage in Pulverized Coal: Implications for Methane Adsorption and Diffusion Characteristics. Energy Fuels 2016, 30, 10383–10395. [Google Scholar] [CrossRef]
  18. Qi, L.; Tang, X.; Wang, Z.; Peng, X. Pore characterization of different types of coal from coal and gas outburst disaster sites using low temperature nitrogen adsorption approach. Int. J. Min. Sci. Technol. 2017, 27, 371–377. [Google Scholar] [CrossRef]
  19. Manasi, M.M.; Bhatu, K.P. Sorption behavior of coal for implication in coal bed methane an overview. Int. J. Min. Sci. Technol. 2017, 27, 307–314. [Google Scholar]
  20. Gao, K.; Liu, J.; Deng, D. Physical and Mechanical Characteristics of Tectonic Soft Coal and Their Effects on Coal and Gas Outburst. Chin. Saf. Sci. J. 2013, 23, 129–133. [Google Scholar]
  21. Okolo, G.N.; Everson, R.C.; Neomagus, H.W.J.P.; Roberts, M.J.; Sakurovs, R. Comparing the porosity and surface areas of coal as measured by gas adsorption, mercury intrusion and SAXS techniques. Fuel 2015, 141, 293–304. [Google Scholar] [CrossRef]
  22. Akbarzadeh, H.; Chalaturnyk, R.J. Structural changes in coal at elevated temperature pertinent to underground coal gasification: A review. Int. J. Coal Geol. 2014, 131, 126–146. [Google Scholar] [CrossRef]
  23. Clarkson, C.R.; Bustin, R.M. Variation in micropore capacity and size distribution with composition in bituminous coal of the Western Canadian Sedimentary Basin. Fuel 1996, 75, 1483–1498. [Google Scholar] [CrossRef]
  24. Budaeva, A.D.; Zoltoev, E.V. Porous structure and sorption properties of nitrogen-containing activated carbon. Fuel 2010, 89, 2623–2627. [Google Scholar] [CrossRef]
  25. Takagi, H.; Maruyama, K.; Yoshizawa, N.; Yamada, Y.; Sato, Y. XRD analysis of carbon stacking structure in coal during heat treatment. Fuel 2004, 83, 2427–2433. [Google Scholar] [CrossRef]
  26. Teng, L.; Tang, T. IR study on surface chemical properties of catalytic grown carbon nanotubes and nanofibers. J. Zhejiang Univ. Sci. A (Appl. Phys. Eng.) 2008, 9, 720–726. [Google Scholar] [CrossRef]
  27. Muirhead, D.K.; Parnell, J.; Taylor, C.; Bowden, S.A. A kinetic model for the thermal evolution of sedimentary and meteoritic organic carbon using Raman spectroscopy. J. Anal. Appl. Pyrolysis 2012, 96, 153–161. [Google Scholar] [CrossRef]
  28. Zhou, B.; Zhou, H.; Wang, J.; Cen, K. Effect of temperature on the sintering behavior of Zhundong coal ash in oxy-fuel combustion atmosphere. Fuel 2015, 150, 526–537. [Google Scholar] [CrossRef]
  29. Lee, G.-J.; Pyun, S.-I.; Rhee, C.-K. Characterisation of geometric and structural properties of pore surfaces of reactivated microporous carbons based upon image analysis and gas adsorption. Microporous Mesoporous Mater. 2006, 93, 217–225. [Google Scholar] [CrossRef]
  30. Zhao, Y.; Liu, S.; Elsworth, D.; Jiang, Y.; Jie, Z. Pore Structure Characterization of Coal by Synchrotron Small-Angle X-ray Scattering and Transmission Electron Microscopy. Energy Fuels 2014, 28, 3704–3711. [Google Scholar] [CrossRef]
  31. Dean, C.; Horn, E. A hard, high-carbon, lignomor with conchoidal fracture: Cunnite, from mature myrtle beech (Nothofagus cunninghamii (Hook. f.) Oerst.). Geoderma 2019, 333, 178–187. [Google Scholar] [CrossRef]
  32. Gamson, P.; Beamish, B.; Johnson, D. Coal microstructure and secondary mineralization: Their effect on methane recovery. Geol. Soc. Lond. Spec. Publ. 1996, 109, 165–179. [Google Scholar] [CrossRef]
  33. Pohl, W.L. Economic Geology Principles and Practice: Metals, Minerals, Coal and Hydrocarbons—Introduction to Formation and Sustainable Exploitation of Mineral Deposits. Econ. Geol. 2013, 108, 1517–1518. [Google Scholar]
  34. Li, Y.; Lu, G.; Rudolph, V. Compressibility and fractal dimension of fine coal particles in relation to pore structure characterisation using mercury porosimetry. Part. Part. Syst. Charact. 1999, 16, 25–31. [Google Scholar] [CrossRef]
  35. Fishman, N.S.; Hackley, P.C.; Lowers, H.A.; Hill, R.J.; Egenhoff, S.O.; Eberl, D.D.; Blum, A.E. The nature of porosity in organic-rich mudstones of the Upper Jurassic Kimmeridge Clay Formation, North Sea, offshore United Kingdom. Int. J. Coal Geol. 2012, 103, 32–50. [Google Scholar] [CrossRef]
  36. Vanherendael, B.; Oberti, C.; Brosens, I. Microanatomy of human amniotic membranes—Light microscopic, transmission, and scanning electron-microscopic study. Aust. Plant Pathol. Soc. Newsl. 1978, 3, 62. [Google Scholar]
  37. Ortiz, M. A constitutive theory for the inelastic behavior of concrete. Mech. Mater. 1985, 4, 67–93. [Google Scholar] [CrossRef]
  38. Park, S.; Heo, H.A.; Lee, K.B.; Kim, H.G.; Pyo, S.W. Improved Bone Regeneration with Multiporous PLGA Scaffold and BMP-2-Transduced Human Adipose-Derived Stem Cells by Cell-Permeable Peptide. Implant Dent. 2017, 26, 4. [Google Scholar] [CrossRef]
  39. Clarkson, C.R.; Bustin, R.M. Binary gas adsorption/desorption isotherms: Effect of moisture and coal composition upon carbon dioxide selectivity over methane. Int. J. Coal Geol. 2000, 42, 241–271. [Google Scholar] [CrossRef]
  40. Lin, J.; Ren, T.; Wang, G.; Booth, P.; Nemcik, J. Experimental investigation of N2 injection to enhance gas drainage in CO2-rich low permeable seam. Fuel 2018, 215, 665–674. [Google Scholar] [CrossRef]
  41. Lin, J.; Ren, T.; Wang, G.; Booth, P.; Nemcik, J. Experimental study of the adsorption-induced coal matrix swelling and its impact on ECBM. J. Earth Sci. 2017, 28, 917–925. [Google Scholar] [CrossRef]
  42. Lin, J.; Ren, T.; Wang, G.; Nemcik, J. Simulation investigation of N2-injection enhanced gas drainage: Model development and identification of critical parameters. J. Natl. Gas Sci. Eng. 2018, 55, 30–41. [Google Scholar] [CrossRef]
  43. Scherdel, C.; Reichenauer, G.; Wiener, M. Relationship between pore volumes and surface areas derived from the evaluation of N2 -sorption data by DR-, BET- and t-plot. Microporous Mesoporous Mater. 2010, 132, 572–575. [Google Scholar] [CrossRef]
  44. Ju, W.; Shen, L.; Guo, D. Nitrogen Adsorption Method and Mercury Injection Method Determination the Pore Structure of Alumina Carrier. Guangdong Chem. Ind. 2009, 36, 213–228. [Google Scholar]
  45. Perera, M.; Ranjith, P.G.; Choi, S.; Airey, D.; Weniger, P. Estimation of gas adsorption capacity in coal: A review and an analytical study. Int. J. Coal Prep. Util. 2012, 32, 25–55. [Google Scholar] [CrossRef]
  46. Ma, D.; Zhang, S.; Lin, Y. Isothermal adsorption and desorption experiment of coal and experimental results accuracy fitting. J. Chin. Coal Soc. 2011, 36, 477–480. [Google Scholar]
  47. Schpfer, M.; Abe, S.; Childs, C.; Walsh, J. The impact of porosity and crack density on the elasticity, strength and friction of cohesive granular materials: Insights from dem modelling. Int. J. Rock Mech. Min. Sci. 2009, 46, 250–261. [Google Scholar] [CrossRef]
  48. Yang, Y.; Aplin, A.C. Definition and practical application of mudstone porosity-effective stress relationships. Pet. Geosci. 2004, 10, 153–162. [Google Scholar] [CrossRef]
  49. Zhang, J. Effective stress, porosity, velocity and abnormal pore pressure prediction accounting for compaction disequilibrium and unloading. Mar. Pet. Geol. 2013, 45, 2–11. [Google Scholar] [CrossRef]
  50. Huang, J.; Xu, G.; Hu, G.; Kizil, M.; Chen, Z. A coupled electromagnetic irradiation, heat and mass transfer model for microwave heating and its numerical simulation on coal. Fuel Process. Technol. 2018, 177, 237–245. [Google Scholar] [CrossRef]
  51. Yang, K.; Lu, X.; Lin, Y.; Neimark, A.V. Deformation of Coal Induced by Methane Adsorption at Geological Conditions. Energy Fuels 2016, 24, 5955–5964. [Google Scholar] [CrossRef]
  52. Zhang, Z. Adsorption characteristics of coal and distribution of pores in coal. Saf. Coal Mines 2006, 37, 1–3. [Google Scholar]
  53. Wang, J.R.; Deng, C.B.; Deng, H.Z. Study on the microcosmic mechanism for coal-gas outburst. J. Chin. Coal Soc. 2008, 33, 131–135. [Google Scholar]
Figure 1. Schematic diagram of coal layers on the longwall face.
Applsci 09 00524 g001
Figure 2. Schematic diagram of the mixed coal sample isotherm test. 1—He pressure reducing valve; 2—He inlet valve; 3—exhaust valve; 4—vacuum pumping valve; 5—vacuum gauge; 6—dryer; 7—vacuum pump; 8—strain data acquisition instrument; 9—acquisition card; 10—low pressure sensor; 11—low pressure control valve; 12—high pressure sensor; 13—pressure control valve; 14—CH4 inlet valve; 15—CH4 pressure reducing valve; 16—constant temperature water bath heating tank (includes the temperature sensor); 17—coal sample tank; 18—pressure control valve of coal sample tank; 19—coal sample tank; 20—computer.
Applsci 09 00524 g002
Figure 3. Isothermal adsorption quantity with different mass ratios of mixed coal.
Applsci 09 00524 g003
Figure 4. Adsorption quantity with different mass ratios of mixed coal at the same pressure: (a) adsorption pressure 1.2 MPa, y = 6.806x2 + 0.551x − 0.064; (b) adsorption pressure 2 MPa, y = 13.378x2 + 1.316x − 0.152; (c) adsorption pressure 2.8 MPa, y = 17.254x2 + 1.779x − 0.211; (d) adsorption pressure 3.6 MPa, y = 19.350x2 + 2.410x − 0.294; (e) adsorption pressure 4.4 MPa, y = 20.556x2 + 2.904x − 0.360; (f) adsorption pressure 5.2 MPa, y = 21.62x2 + 3.21x − 0.400; (g) adsorption pressure 6 MPa, y = 22.304x2 + 3.65x − 0.435.
Applsci 09 00524 g004aApplsci 09 00524 g004b
Figure 5. Percentage of macro (a) and micro (b) pores’ specific surface area before/after the adsorption test.
Applsci 09 00524 g005aApplsci 09 00524 g005b
Figure 6. N2 adsorption-desorption of different coal samples. (a) Tectonic coal; (b) virgin coal; (c) virgin coal and mixed coal with the mass ratio of 2:4; (d) virgin coal and mixed coal with the mass ratio of 3:3.
Applsci 09 00524 g006aApplsci 09 00524 g006b
Figure 7. Relationship between the adsorption constant a and the mass ratio of hard to soft coal.
Applsci 09 00524 g007
Figure 8. Curve of the relationship between the adsorption constant b and the mass ratio of hard to soft coal.
Applsci 09 00524 g008
Figure 9. Variation in the difference of mass ratios of coal samples before and after adsorption. (a) Difference of macro pores’ specific surface area; (b) Difference of micro pores’ specific surface area.
Applsci 09 00524 g009

