Article

A Form Stable Composite Phase Change Material for Thermal Energy Storage Applications over 700 °C

1
BCES Birmingham Centre of Energy Storage, University of Birmingham, Birmingham B15 2TT, UK
2
University of Science and Technology Beijing, Beijing 100083, China
3
Henan Energy Storage Technology co., Ltd., Hebi 458030, China
4
Global Energy Interconnection Research Institute co., Ltd., Beijing 102209, China
*
Author to whom correspondence should be addressed.
Appl. Sci. 2019, 9(5), 814; https://doi.org/10.3390/app9050814
Submission received: 31 December 2018 / Revised: 19 February 2019 / Accepted: 20 February 2019 / Published: 26 February 2019
(This article belongs to the Special Issue Materials for Thermal Energy Storage)

Abstract

:
Thermal energy storage (TES) is a highly effective approach for mitigating the intermittency and fluctuation of renewable energy sources and reducing industrial waste heat. We report here recent research on the use of composite phase change materials (PCM) for applications over 700 °C. For such a category of material, chemical incompatibility and low thermal conductivity are often among the main challenges. Our aims are to address these challenges through the formulation of form-stable composite PCMs and to understand their thermophysical properties. The eutectic K2CO3-Na2CO3 salt was used as a PCM with MgO as a form stabilizer. We found that such a formulation could maintain shape stability with up to 60 wt.% PCM. With a melting point of ~710.1 °C and an energy density as high as 431.2 J/g over a temperature range between 550 °C and 750 °C, the composite PCM was shown to be thermally stable up to 885 °C. An addition of 10 wt.% SiC enhanced the overall thermal conductivity from 1.94 W·m−1 K−1 to 2.28 W·m−1 K−1, giving an enhancement of 17.53%. Analyses of thermal cycling data also showed a high extent of chemical compatibility among the ingredients of the composite PCM.

Graphical Abstract

1. Introduction

Energy demand is projected to increase due to global economic growth and rising middle class populations. For example, the global energy demand rose by 2.1% according to the International Energy Agency (IEA) [1] in 2017, which is more than twice the previous year’s rate. Meanwhile, fossil fuels still account for more than 70% of total consumption, leading to carbon emissions at a historical high of 32.5 gigatons in 2017. Therefore, the control of carbon emissions without reducing economic growth has been one of the world’s greatest challenges [2]. Large scale utilization of renewable energy sources and enhancement of energy efficiency of current processes are regarded as two of the most promising approaches to addressing these challenges [3,4]. One of the key issues that restricts the large scale deployment of renewable energy technologies is associated with intermittency and fluctuation which leads to a mismatch between energy supply and demand [5]. Energy storage offers an effective solution to the issue [6]. Energy storage could also enhance overall efficiency of energy networks [7]. There are many different energy storage technologies. This work is concerned with thermal energy storage (TES). Such a technology has a vital role to play in our current energy systems as heat is at the heart of the energy supply chain, linking primary energy and secondary energy sources [8]. In addition, TES has a relatively high technical maturity as well as the lowest costs [9]. It currently accounts for over 50% of the world’s storage installations excluding pumped hydro [10].
Based on methods used to store heat, TES technologies can be broadly classified as either sensible heat storage, latent heat storage, and thermochemical energy storage. Our focus here is on latent heat storage, i.e., the use of phase change materials (PCM), particularly for high temperature applications (~700 °C). The work is motivated by industrial requirements, including concentrated solar power generation (e.g., tower technologies) and high temperature industrial waste heat recovery (e.g., glass, ironmaking, and steelmaking, etc.) [11,12]. For applications over ~700 °C, as will be briefly reviewed below, there are a limited number of PCM choices. Inorganic salts are among the most popular candidates due to their high stability at high temperatures, high energy storage density, and low costs [13]. However, these PCMs often face the two issues of chemical incompatibility with constructive materials at high temperatures and relatively low thermal conductivity [8]. An effective way to minimize this incompatibility is through form-stabilization of PCM, namely the formation of a composite PCM. Such a composite PCM could confine the molten salt in the matrix structure and maintain shape stabilization during the phase transition process, thus reducing the direct contact and corrosion between the molten salt and containers. Additionally, this composite PCM could be further enhanced in terms of thermal conductivity through the addition of highly thermally conductive and chemically compatible additives.
There have been lots of studies on inorganic salt-based form-stable composite PCMs with different phase change temperatures. Table 1 gives a summary of the recent literature published in this area.
From Table 1, one can observe the following:
  • Most studies are on PCM use in low to medium temperature applications and eutectic nitrate salts are the most studied;
  • Very few studies have been done on PCM use in high temperature applications (>500 °C);
  • Carbon materials, particularly graphite, have been the main materials used to enhance PCM thermal conductivities, which are less likely to be applicable at high temperatures due to oxidation [5];
  • Little work has been done on the thermal conductivity enhancement of salt-based composite PCMs for applications above ~500 °C;
  • Different materials have been used as skeleton materials but many of them cannot be used at high temperatures;
The above brief summary suggests clear gaps in the literature with regard to composite PCM research. The specific objective of this work was therefore to develop formulations of composite PCMs for high temperature applications. The work involved the syntheses of form-stable composite PCMs with a eutectic salt (K2CO3-Na2CO3), MgO and SiC. The eutectic salt (K2CO3-Na2CO3) is used as a phase change material to store latent heat. MgO and SiC have high melting points of up to 3000 °C [31] and 2250 °C [32]. In addition, SiC is highly thermally conductive [33,34]. Therefore, MgO and SiC have been used as structural supporting materials and thermal conductivity enhancers, respectively. Various methods (XRD, SEM, STA, etc.) were used to characterize the thermophysical properties and the thermal stability of the composite PCM.

2. Materials and Methodology

2.1. Preparation of Composite PCM

K2CO3 (99%), Na2CO3 (99%), MgO (99%) and SiC (99%) were purchased from Sigma-Aldrich (St. Louis, MO, USA) and used as received. The salts were dried first in an oven at 150 °C for an hour to remove moisture. The Na2CO3 and K2CO3 salts were then mixed at a mass ratio of 52.2% to 47.8% to give a eutectic mixture, which was then mixed with MgO and SiC in appropriate proportions as shown in Table 2. In this work, Sample S3 with an optimal mass ratio of K2CO3-Na2CO3 to MgO (60:40, see detail in Section 3.1) was selected as a base formulation to ensure the shape would be stabilized when adding different amounts of SiC. With the selected base formulation, different amounts of SiC were added to study the thermal conductivity enhancement of the composites. Formulations shown in Table 2 are given in ratios.
All the ingredients were mixed in the ball mill for 10 min at a rotating speed of 100 rpm. The mixed powders were then ready for composite PCM preparation following the so-called mix-sintering method:
  • The mixed powders were first compressed at 40 MPa to give tablets with a diameter of 15 mm;
  • The raw tablets were heated up to 750 °C at a heating rate of 5 °C/min and maintained at 750 °C for 30 min;
  • The composite PCM tablets were then allowed to cool to room temperature naturally.

2.2. Sample Characterization

A simultaneous thermal analyzer (STA 449F3 Jupiter®, Netzsch, Germany) was used to characterize the thermophysical properties (enthalpy, phase change temperature and heat capacity) of the composite PCM samples. In a typical measurement, around 10 mg samples were placed in a platinum crucible and heated from 50 °C to 750 °C with a heating rate of 10 °C/min under a purge gas of 50 mL/min N2. The specific heat capacity was obtained according to the standards DIN51007 and following the sapphire method. The evaluation of specific heat is obtained by comparison of the measured sample with the known standard material (sapphire). Therefore, a blank curve, a sapphire standard curve, and a sample curve should be obtained continuously under the same testing conditions, i.e., using the same crucible, the same heating conditions, and the same purge gas. A thermogravimetric analysis (TG) test was also performed on an STA instrument but was assembled with a TG sample holder. In the TG test, around 50 mg of sample was placed in the Al2O3 crucible and heated from 50 °C to 750 °C with a heating rate of 10 °C/min under a purge gas of 50 mL/min N2. X-ray diffraction (XRD, Bruker D8) was applied to characterize the chemical compatibility between the ingredients with a scanning angle of 5–90° using CuKα1 radiation and a step size of 0.02°. Scanning electron microscopy (SEM TM-3030, Hitachi, Tokyo, Japan) was used to study the microstructure of the material at 15 KV. Additionally, a coupled energy-dispersive X-ray spectroscopy (EDS) detector with SEM was used to obtain element distributions. A mercury intrusion porosimeter (Autopore IV 9500, Micromeritics Instrument Corporation, Norcross, GA, USA) was applied to measure the porosity and pore size distribution of the samples. Around 800 mg of sample was sealed in the sample holder for measurement. A laser flash analyzer (LFA427, Netzsch, Germany) was applied to measure the thermal conductivity of the sample at room temperature with a purge gas of 100 mL/min N2. A dilatometer (DIL 08, TA Instruments, New Castle, IN, USA) was used to cycle the material 100 times between 700 °C and 750 °C with a heating/cooling rate of 5 °C/min under a purge gas of 100 mL/min N2. In each thermal cycling, isothermal processes were set at 700 °C and 750 °C for 10 min to ensure the sample reached the desired temperature.

3. Results and Discussion

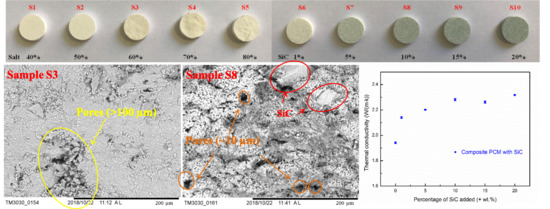
3.1. Visual Observation of the Composite PCM

Figure 1 shows photos of the sintered composite PCM samples with different formulations (Table 2). Samples S1 to S3 (with less than 60 wt.% salt) present good shape stability after sintering with no observable defects. No PCM leakage was observed from these samples during the solid-liquid phase transition. Some cracks can be observed on Sample S5, which has the highest percentage of salt (80 wt.%). Deformation may be observed on Sample S4 after sintering, which contains 70 wt.% salt. Therefore, Sample S3, with 60 wt.% of salt, was taken as the optimal formulation, having the highest amount of PCM without any deformation or leakage after sintering.
To enhance the charging and discharging rates, SiC particles were added to the formulation to increase the overall thermal conductivity of the PCM composites. Such an additive is chemically stable at high temperatures (up to ~2000 °C [35]) and has a thermal conductivity as high as 270 Wm−1K−1 [33,34]. Carbon materials such as graphite have been used as a thermal conductivity enhancer in the past but they are chemically unstable at high temperatures [5]. Samples with different percentages of SiC were prepared using 60% salt as the base formulation; see Sample S6 to Sample S10 in Figure 1. Little effect on the shape stability of the samples can be seen due to the addition of SiC.

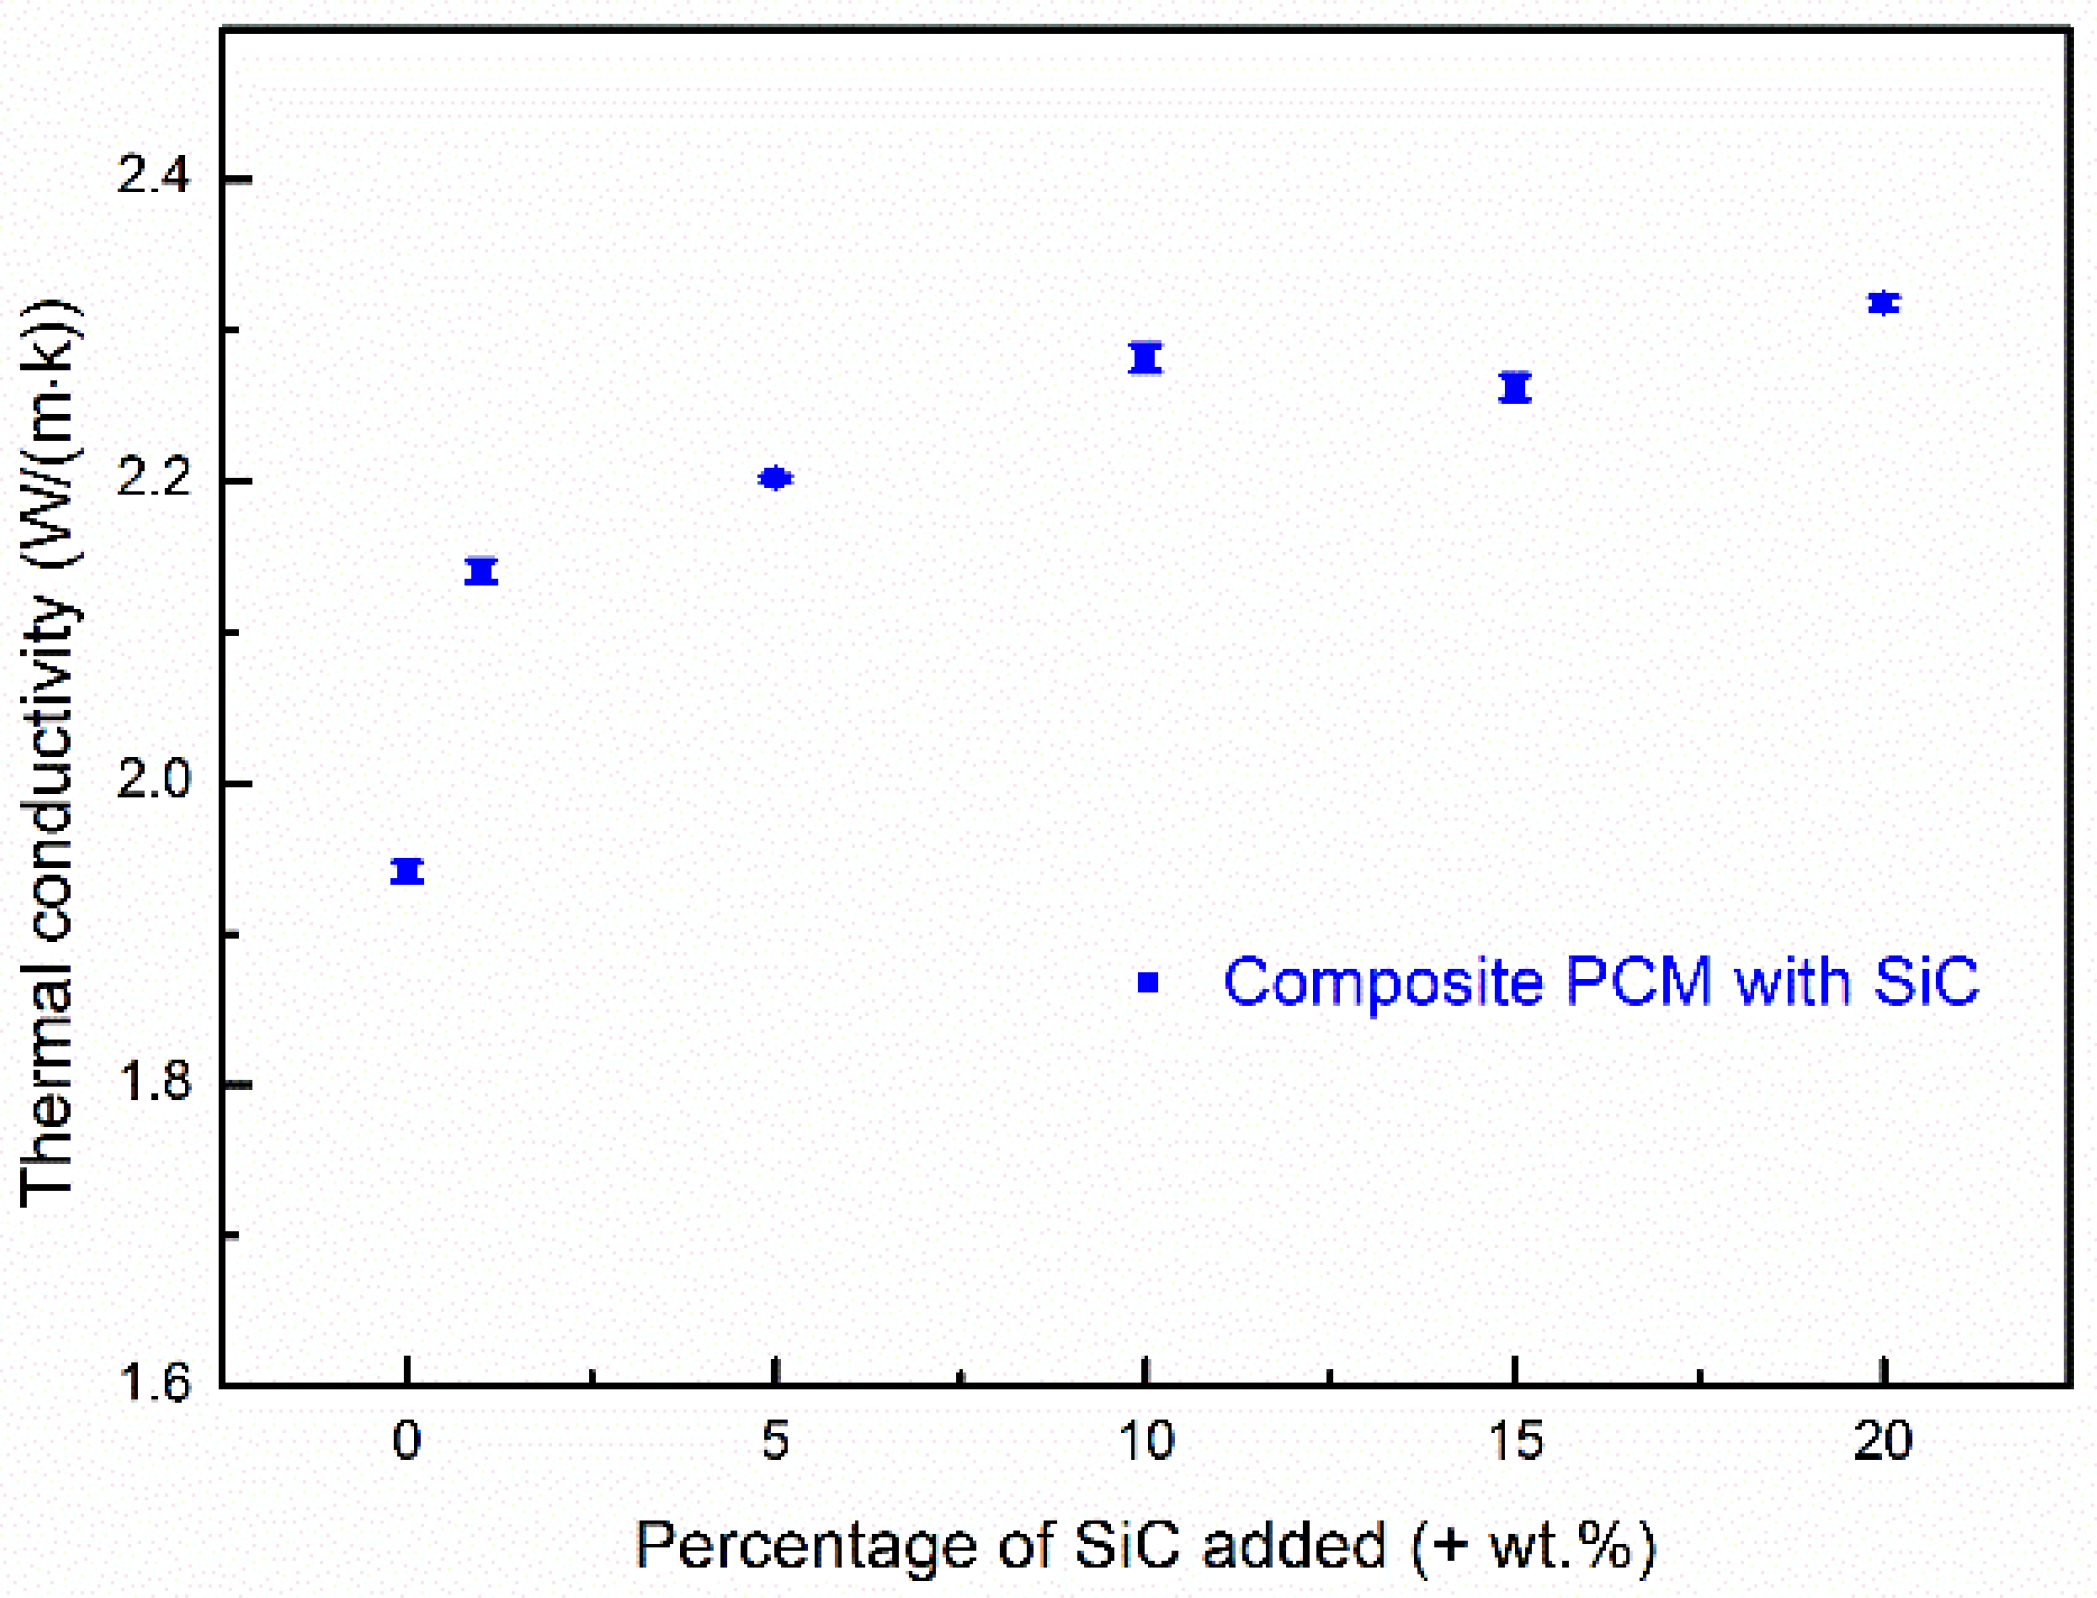
3.2. Thermal Conductivity

Thermal conductivity is a parameter that indicates the rate of heat transfer through materials. Slifka et al. [36] found that the thermal conductivity of MgO at room temperature is 29.4 W·m−1 K−1. Due to difficulties in accurately measuring the thermal conductivities of carbonates, the thermal conductivity of eutectic Na2CO3-K2CO3 has not been experimentally studied. Roest et al. [37] have simulated the thermal conductivities of Na2CO3 and K2CO3 by molecular dynamics. The authors reported that the computed thermal conductivities of Na2CO3 and K2CO3 at ~920 °C are 0.94 W·m−1 K−1 and 0.98 W·m−1 K−1, respectively. The samples studied in this work are composites physically synthetized using several components. Structural features like porosity may also significantly affect the overall thermal conductivity. For this reason, it would be difficult to estimate the theoretical thermal conductivity of the composites. This work reports the overall thermal conductivities of the composite PCMs with different concentrations of SiC at room temperature. Figure 2 shows the measured thermal conductivities of Sample S3 and Sample S6 to Sample S10. The experimental uncertainties are shown as error bars. The thermal conductivity of Sample S3 (without addition of SiC) measured at room temperature reaches 1.94 W·m−1 K−1. One can see that the overall thermal conductivity of the composite PCM is enhanced when silicon carbide is added. One can also see that the thermal conductivity of the composite PCMs increases with increasing SiC content at first, but levels off at an SiC content level above ~10%, where an enhancement of 17.53% is observed (Sample S8 gives a thermal conductivity of 2.28W·m−1 K−1). A further increase in SiC content gives no or a very small further increase in the thermal conductivity. The enhancements are 16.54% and 19.41% with an addition of 15 wt.% and 20 wt.% SiC, respectively. The effective thermal conductivity leveling off when the SiC addition is above 10 wt.% is attributed to an increasingly looser structure (more pores) of the composite with greater addition of SiC. This was observed in the SEM images and the porosity measurement, which is discussed in detail in Section 3.3. The increment in the porosity had a negative effect on the effective thermal conductivity of the composite due to very low thermal conductivity of air in the pores. When the amount of SiC addition reached a certain amount (~10% in this study), the negative effect of porosity increment was able to outweigh the benefits due to the high thermal conductivity of SiC. In addition, the energy density of the composite PCM decreased with an increasing amount of SiC addition. There would be, therefore, a compromise involving the maximum thermal conductivity enhancement with a minimal energy density decrease. As a result, Sample S8 with 10 wt.% SiC is considered as an optimal (or close to optimal) formulation in terms of the thermal conductivity enhancement and energy density reduction. In this section, thermal conductivities of the composites with different amount of SiC are discussed at room temperature. As thermal conductivity is temperature dependent and differs with different phases (e.g., liquid and solid phases), thermal conductivity of the composites at various temperatures is different. Navarro et al. [38] have reported that thermal conductivity of a NaNO3/MgO/C composite PCM decreased with increasing temperature within the solid phase. Aktay et al. [39] found a significant decrease in thermal conductivity when the PCM changed from the solid phase to the liquid phase. Therefore, it would be difficult to study the thermal conductivity around the working temperature, which is the phase change temperature. However, the effects of adding the thermal conductivity enhancer (SiC) and the effects of structural features on the overall thermal conductivity at room temperature may be found, which is important for determining the optimal percentage used to add the thermal conductivity enhancer. In the following sections, Sample S8 is regarded as the optimal sample and studied further in terms of its microstructure, chemical/thermal stability, and thermal properties.

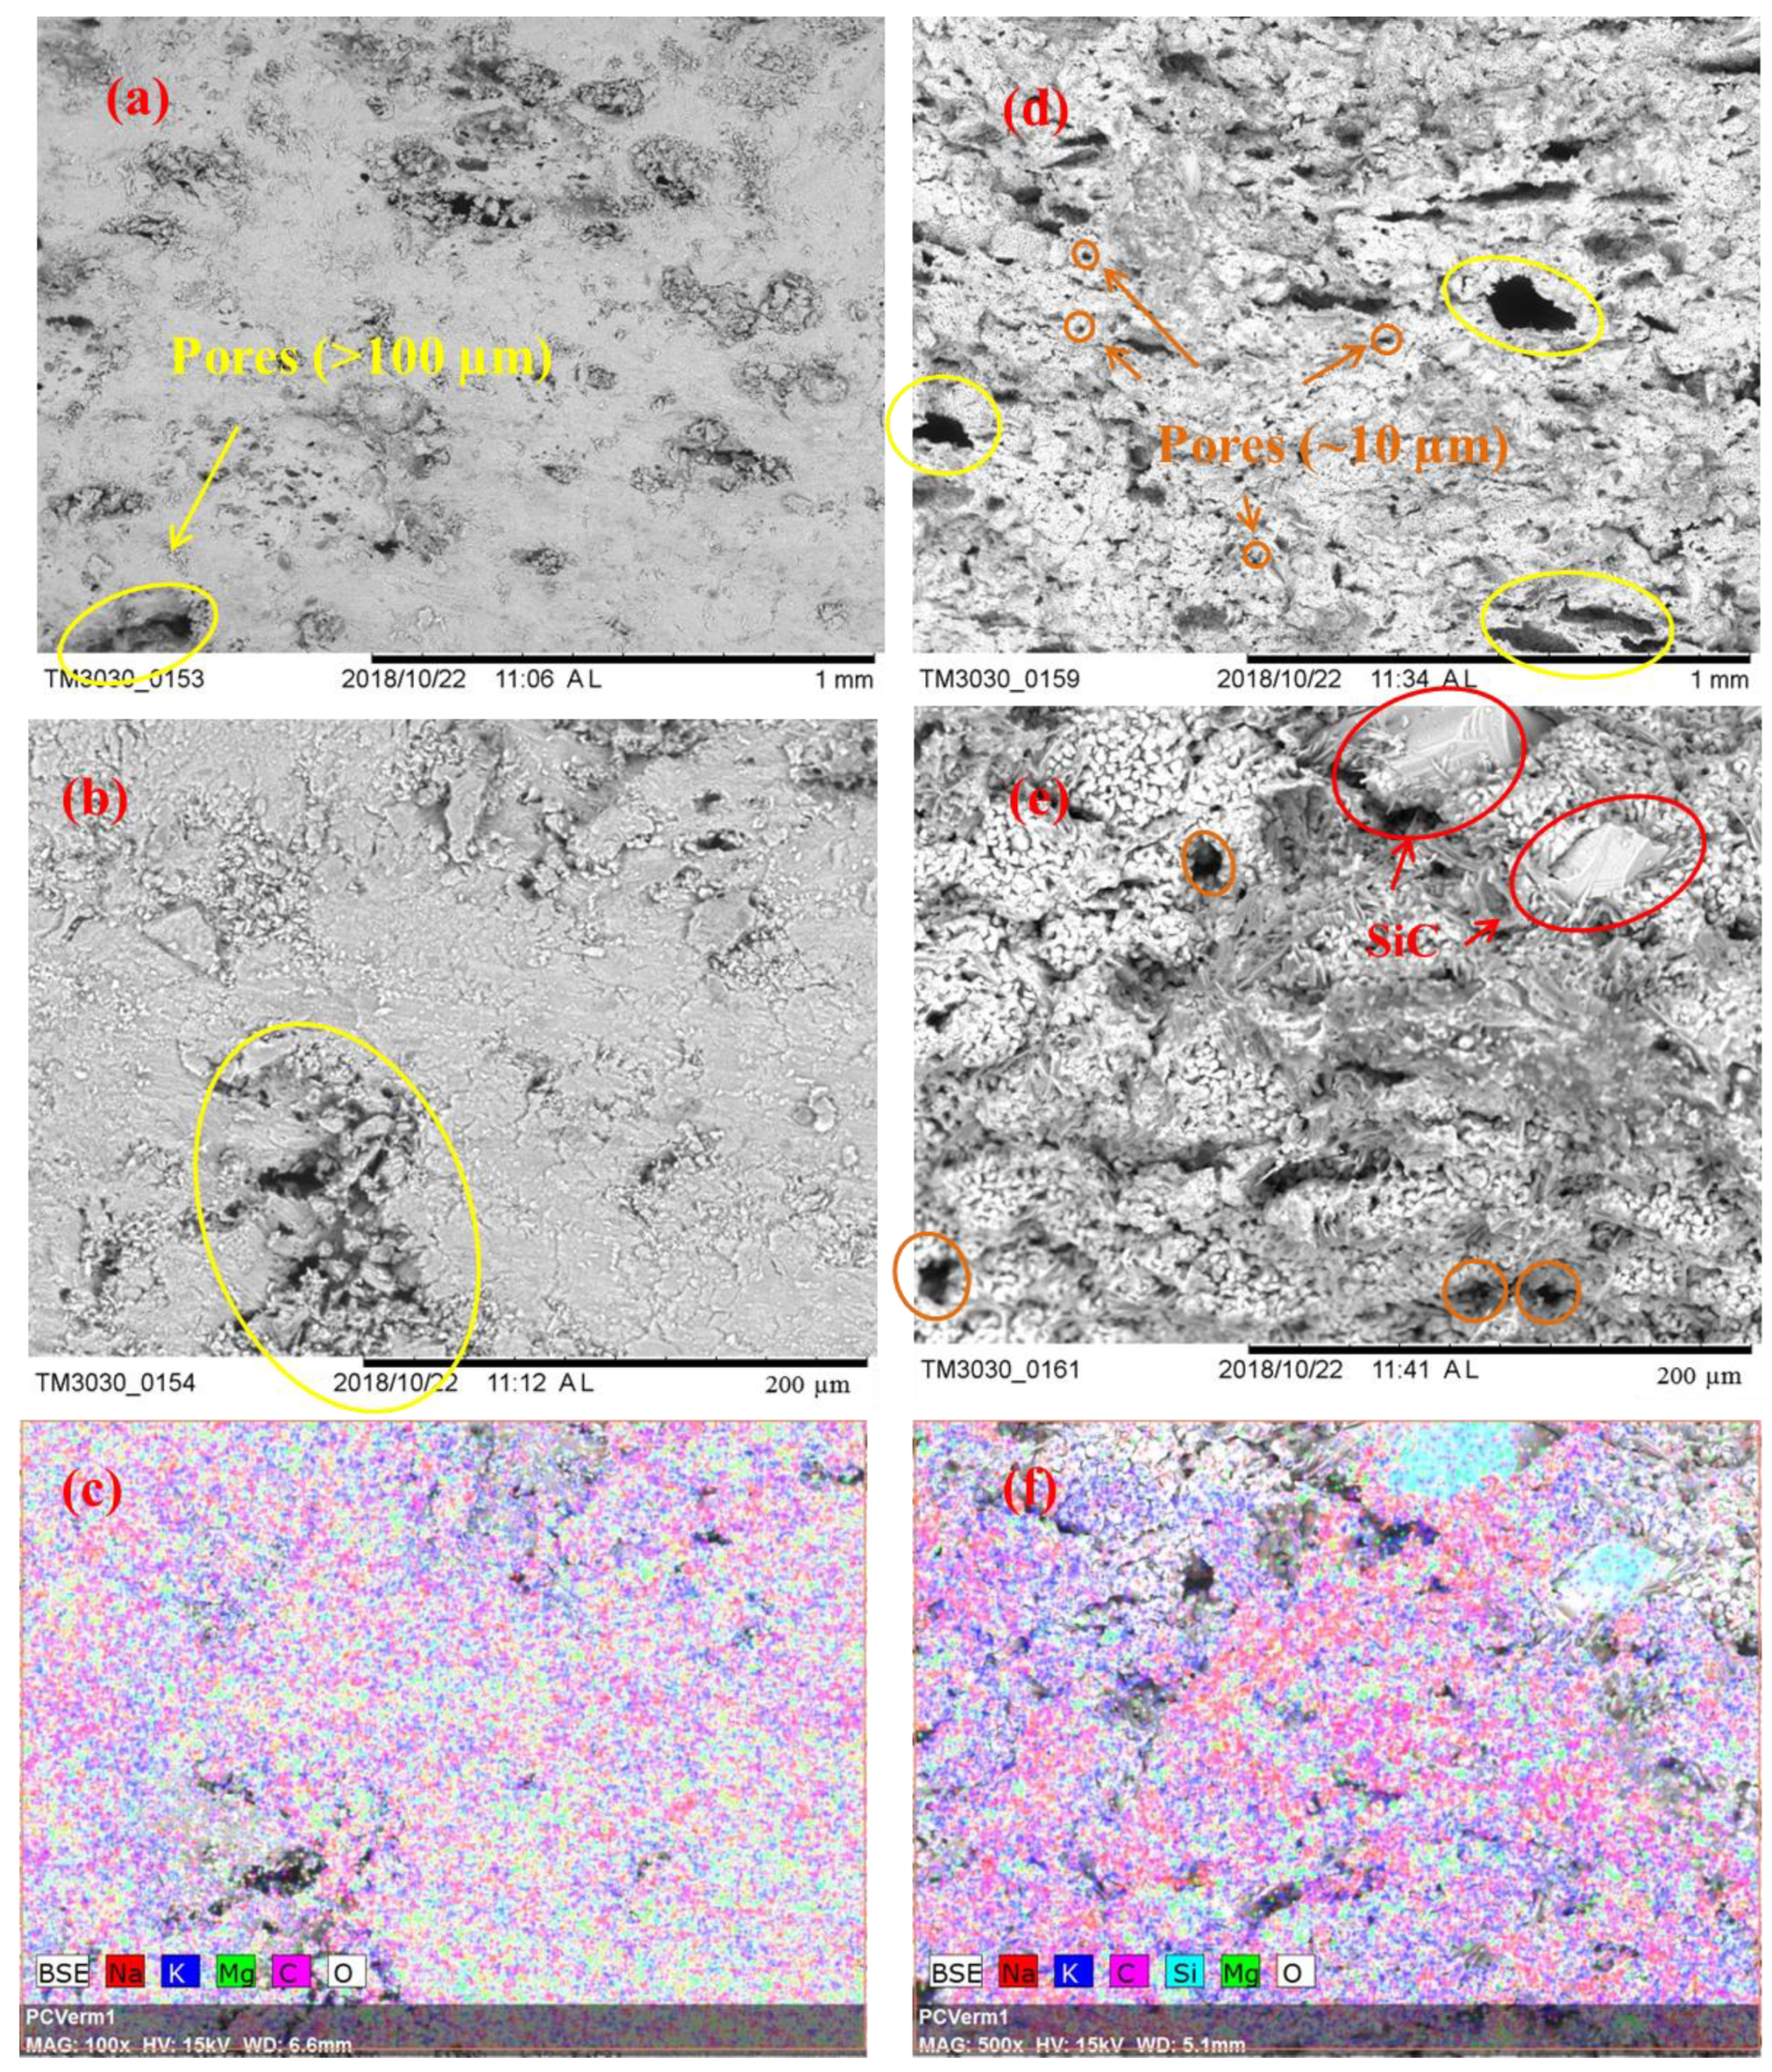
3.3. Microstructural Observations

Figure 3 displays the microstructural images of the sintered samples Sample S3 and Sample S8 and the associated EDS maps. Figure 3a,b show a cross section of Sample S3 at two different magnifications (100× and 500×) while Figure 3d,e show the same for the Sample S8. SEM images at a magnification of 100× give overall views of the surface morphology of different samples, and using these we can find that the microstructure shown in Figure 3d is more porous than the microstructure shown in Figure 3a. Pores are marked using circles in the SEM images: circles in orange are of smaller size; circles in yellow are of larger size. It can be seen in Figure 3d that Sample S8 has a large number of small pores and also some large pores with a diameter larger than 100 µm. Conversely, Sample S3 has fewer observable small pores but some larger pores and cracks, as seen in Figure 3a. SEM images at a magnification of 500× show more detailed information of the microstructure; SiC particles are observable in Figure 3e with sizes of ~40 µm to ~80 µm, which could be identified by the EDS image shown in Figure 3f. In addition, when comparing Figure 3b,e, Sample S8 can be seen to display a looser structure, with more small pores observed (~10 µm). Figure 3c,f are the EDS mappings corresponding to Figure 3b,e, which give the element distributions on the sample surface. One can see a uniform distribution of the K2CO3-Na2CO3 salt, MgO, and SiC, as reflected by the Na, K, Mg, O, and C elements. To compare the porosity of Sample S3 and S8 quantitatively, a mercury intrusion porosimeter was used to measure the porosity and pore size distribution of these samples. In Figure 4a, one can see that Sample S8 has a higher porosity (30.42%) with an average pore diameter of 66.0 nm. Meanwhile, Sample S3 has a lower porosity (22.44%) with an average pore diameter of 62.8 nm. As a result, Sample S8 has a lower bulk density than Sample S3. In Figure 4b, it can be found that Sample S8 has a large number of pores with a diameter of 16 µm, which is consistent with the observations shown in Figure 3d,e. By contrast, Sample S3 has a smaller quantity of pores with a diameter of 16 µm but some large pores and cracks.
Ge et al. [27] have indicated that the microstructure and the porosity of composite PCMs are related to the wettability between the liquid molten salt and solid particle surfaces. They concluded that a good wettability could densify the final composite, whereas a poor wettability would lead to a loose structure [26]. They also found that a eutectic molten salt (Na2CO3-Li2CO3) has a good wettability with a skeleton material (MgO) and hence a dense structure [27]. In this work, Sample S3, which does not consist of SiC, shows a denser or less porous structure than Sample S8. This was observed via SEM images and was also measured using the mercury porsimeter. Therefore, our work is consistent with the findings of Ge et al. [27]. The loose structure due to the addition of SiC is very likely due to the molten salt not wetting silicon carbide well. However, since no report has been made on the wetting behavior of the carbonate salts on SiC surfaces, the validation of this explanation needs further high temperature wetting experiments.
Figure 5 shows the SEM images and EDS maps of Sample S8 after 100 thermal cycles. It can be seen that the components of the composite remain uniformly distributed; see Figure 5c. Comparing the microstructure of Sample S8 before and after thermal cycling, some changes to the pore structure in the cycled sample are noticeable, which are likely due to swelling of the structure, leading to an enlargement of pores in the composite. Such a microstructural change does not seem to affect the integrity of the Sample as discussed in Section 3.1, but it does affect the effective thermal conductivity of the composites; see Section 3.3 for details.

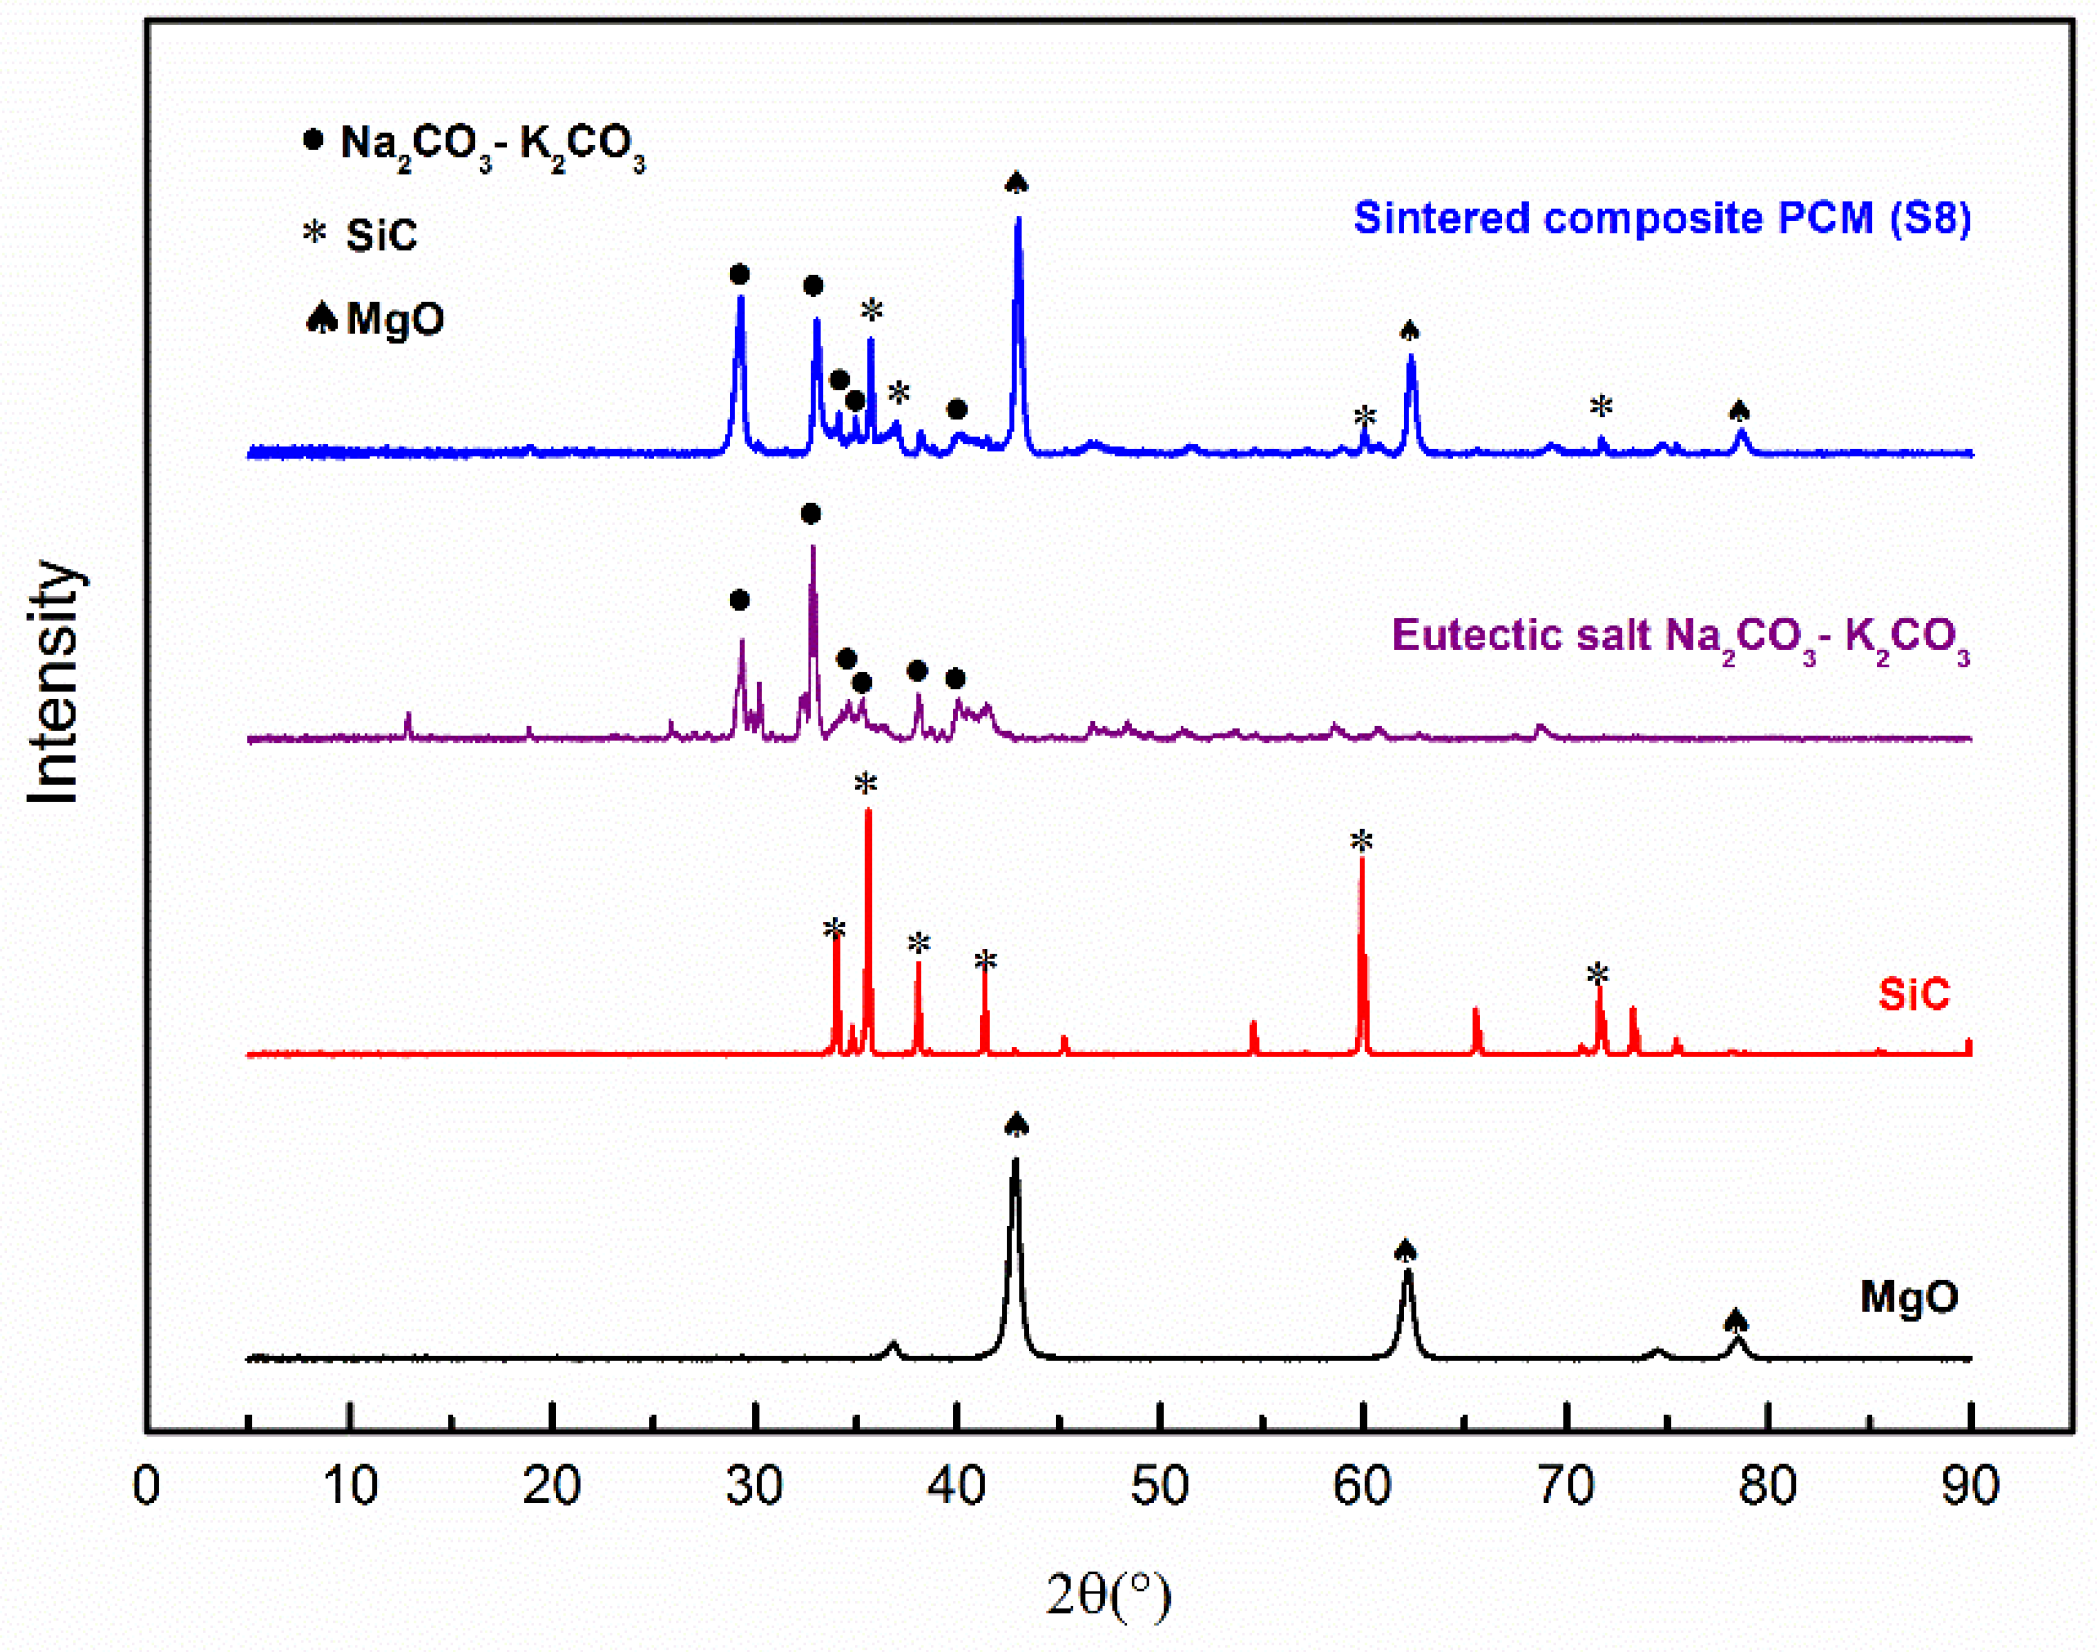
3.4. Chemical Compatibility

3.4.1. Chemical Compatibility between Different Components

The chemical compatibility of different components was studied by XRD. Figure 6 shows the XRD patterns of the eutectic salt (K2CO3-Na2CO3), MgO, SiC, and the sintered composite PCM (Sample S8). It can be found that all the peaks of the composite PCM correspond exactly to the peaks of the components. No new peaks were observed after sintering, indicating no chemical reactions among these components, meaning they are chemically compatible.

3.4.2. Chemical Compatibility after 100 Thermal Cycles

Figure 7 displays the XRD patterns of Sample S8 before and after 100 thermal cycles. The peaks of the thermally cycled sample show one-to-one correspondence to the peaks of the sample before thermal cycling, which verifies the chemical compatibility conclusion drawn above. This also suggests the thermal stability of the composite material under the conditions of this set of experiments; see Section 3.6 for more discussion.

3.5. Thermal Properties of the Composite PCM and Energy Density

Figure 8 shows a DSC curve of the Sample S8 composite PCM tested over a temperature range of 50 °C to 750 °C. The fluctuation at ~50 °C shown in the DSC curve is due to the unsteady status of the instrument at the beginning. With increasing temperature, a peak occurs at 483 °C with an enthalpy of 22.27 J/g. This is probably due to the partial crystal transition of SiC from 6H-SiC to 15R-SiC reported by Pezoldt et al. [40], who studied the sputtering effects in hexagonal silicon carbide and found such a transition at ~400 °C. With a further increase in the temperature, a second peak occurs at 710.1 °C. This is the solid-liquid phase transition of the eutectic carbonate PCM, which has an enthalpy of 110.2 J/g. The DSC cure of the pure eutectic K2CO3-Na2CO3 salt is also displayed in Figure 8. One can see that the pure eutectic K2CO3-Na2CO3 salt has a phase change enthalpy of 250.4 J/g at 709.7 °C. It can be found that the measured enthalpy of the composite (Sample S8) is lower than the theoretical enthalpy (136.47 kJ) which could be calculated by the weight percentage of the salt. Guo et al. [41] and Li [42] have both studied the experimental latent heat of the composite PCM compared to the theoretical values. They found that the structure of the additives could affect the crystal properties or the phase change process of the PCM.
The heat capacity of the composite PCM at different temperatures was measured and is shown in the inset of Figure 8. Robie et al. [43] have reported that the heat capacity of MgO at 1000 K is 1.27 J·g−1K−1 (51.23 J·mol−1K−1). Munro et al. [44] have measured a variety of sintered SiC materials and noted a heat capacity of 1.2 J·g−1 K−1 at 1000 °C. However, studies about the heat capacity of the eutectic salt K2CO3-Na2CO3 are limited. Huayi et al. [45] have estimated that the heat capacity of the eutectic salt K2CO3-Na2CO3 is ~1.65 J·g−1K−1 given the heat capacities of the pure salts (those of Na2CO3 and K2CO3 are 1.79 and 1.51 J·g−1K−1 [46]). The heat capacity of the composite PCM could be estimated by the values of the components. However, the realistic heat capacity of the material is temperature dependent. Therefore, the measured results at various temperatures might be different from the estimated values. With the measured heat capacity and the phase change enthalpy, the energy density of the composite PCM can be calculated by using the equation
Q = T o T m C s d T + Δ H m + T m T 1 C 1 d T
where Q is the total thermal energy stored in a unit mass of the composite PCM; Cs and Cl are heat capacities of the composite PCM before and after the phase change, respectively; T1, T0 and Tm denote, respectively, the upper bound temperature, lower bound temperature, and the phase change temperature of the composite PCM; and ΔHm represents the latent heat of the phase change process.
As discussed above, the composite PCM under study has a phase change temperature of 710.1 °C. We take a temperature range between 550 °C and 750 °C for the energy density calculation. The reasons for this are: first, the composite PCM is intended for high temperature applications, e.g., for the next generation of concentrated solar power generation; second, we intend to give a conservative estimation of the energy density. For an easy use of the measured specific heat capacity in Equation (1), the measured heat capacity values are fitted into two polynomial functions respectively for the solid and liquid phases of the PCM as follows:
  • Temperature range between 550 °C and 710 °C (where Cp is in J·g−1 °C −1 and T is in °C):
    C p = 10.35018 0.0311 T + 2.72 e 5 T 2 ,   R 2 = 0.92695
  • Temperature range between 710 °C and 750 °C:
    C p = 19.74328 0.05132 T + 3.63 e 5 T 2 ,   R 2 = 0.87096
Inserting Equations (2) and (3) and other parameters into Equation (1), it may be found that the total thermal energy storage per unit mass of the composite PCM between 550 °C and 750 °C is 431.2 J/g, which contains both the sensible heat in the desired temperature range (550 °C to 750 °C) and the latent heat of the phase change process. As thermal energy contained in the composite below 550 °C and above 750 °C can also be used, the actual energy density can be a lot higher than this.

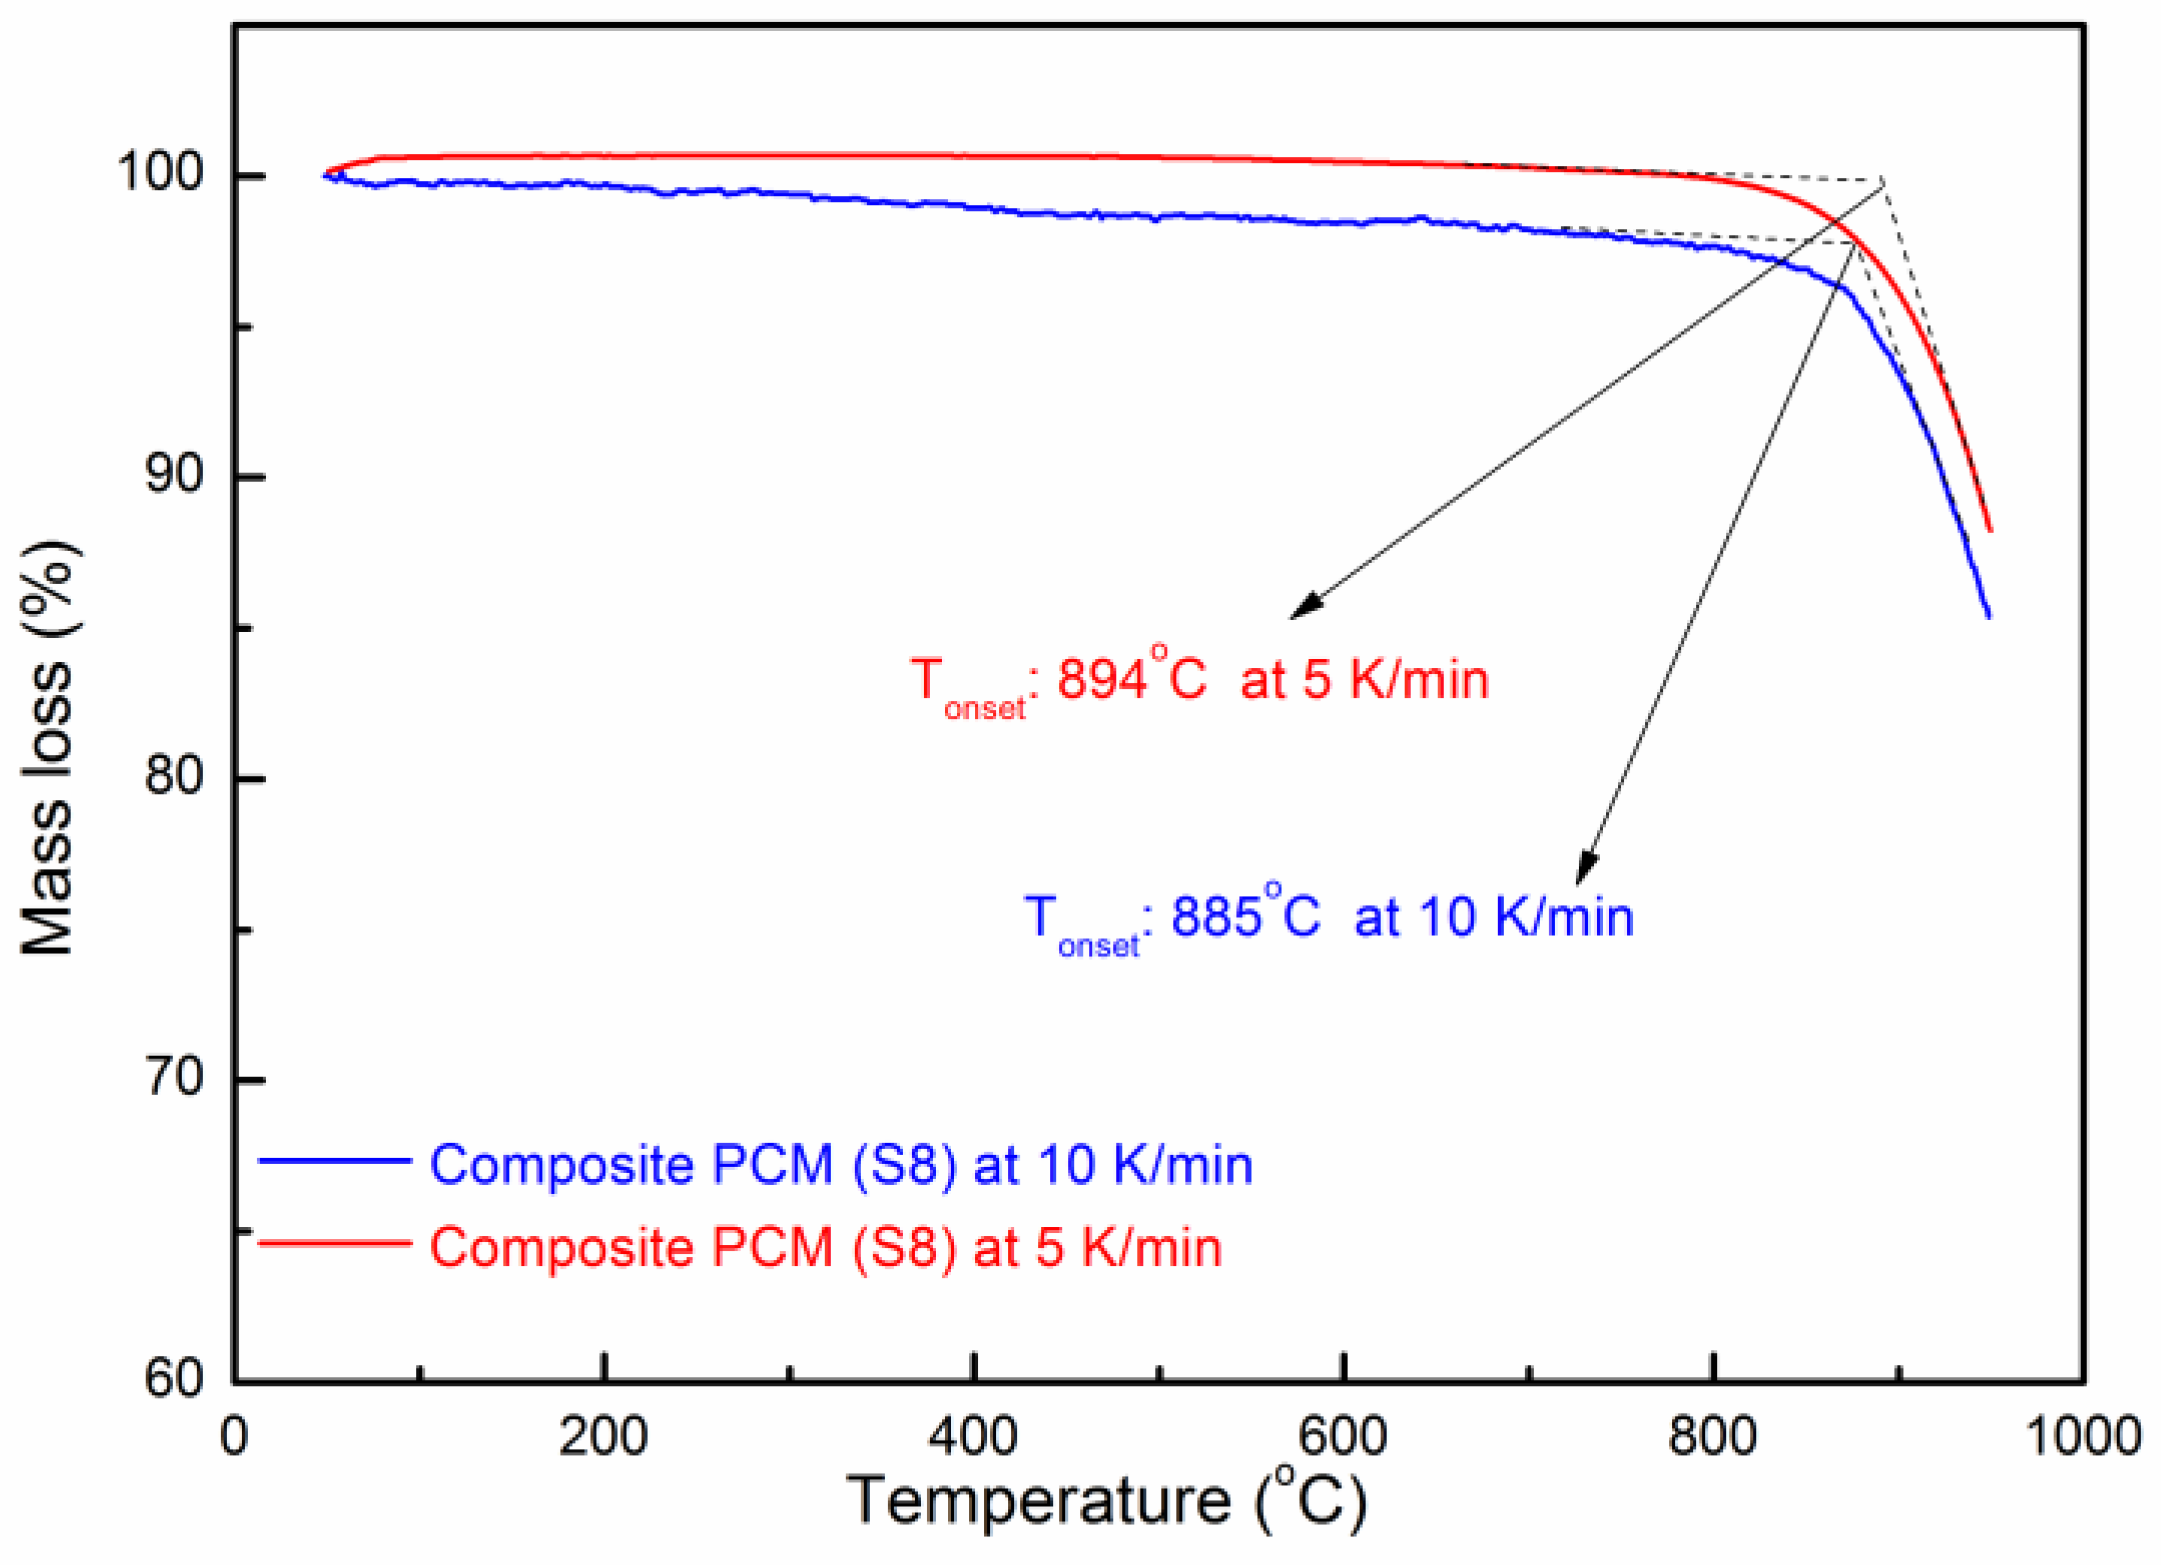
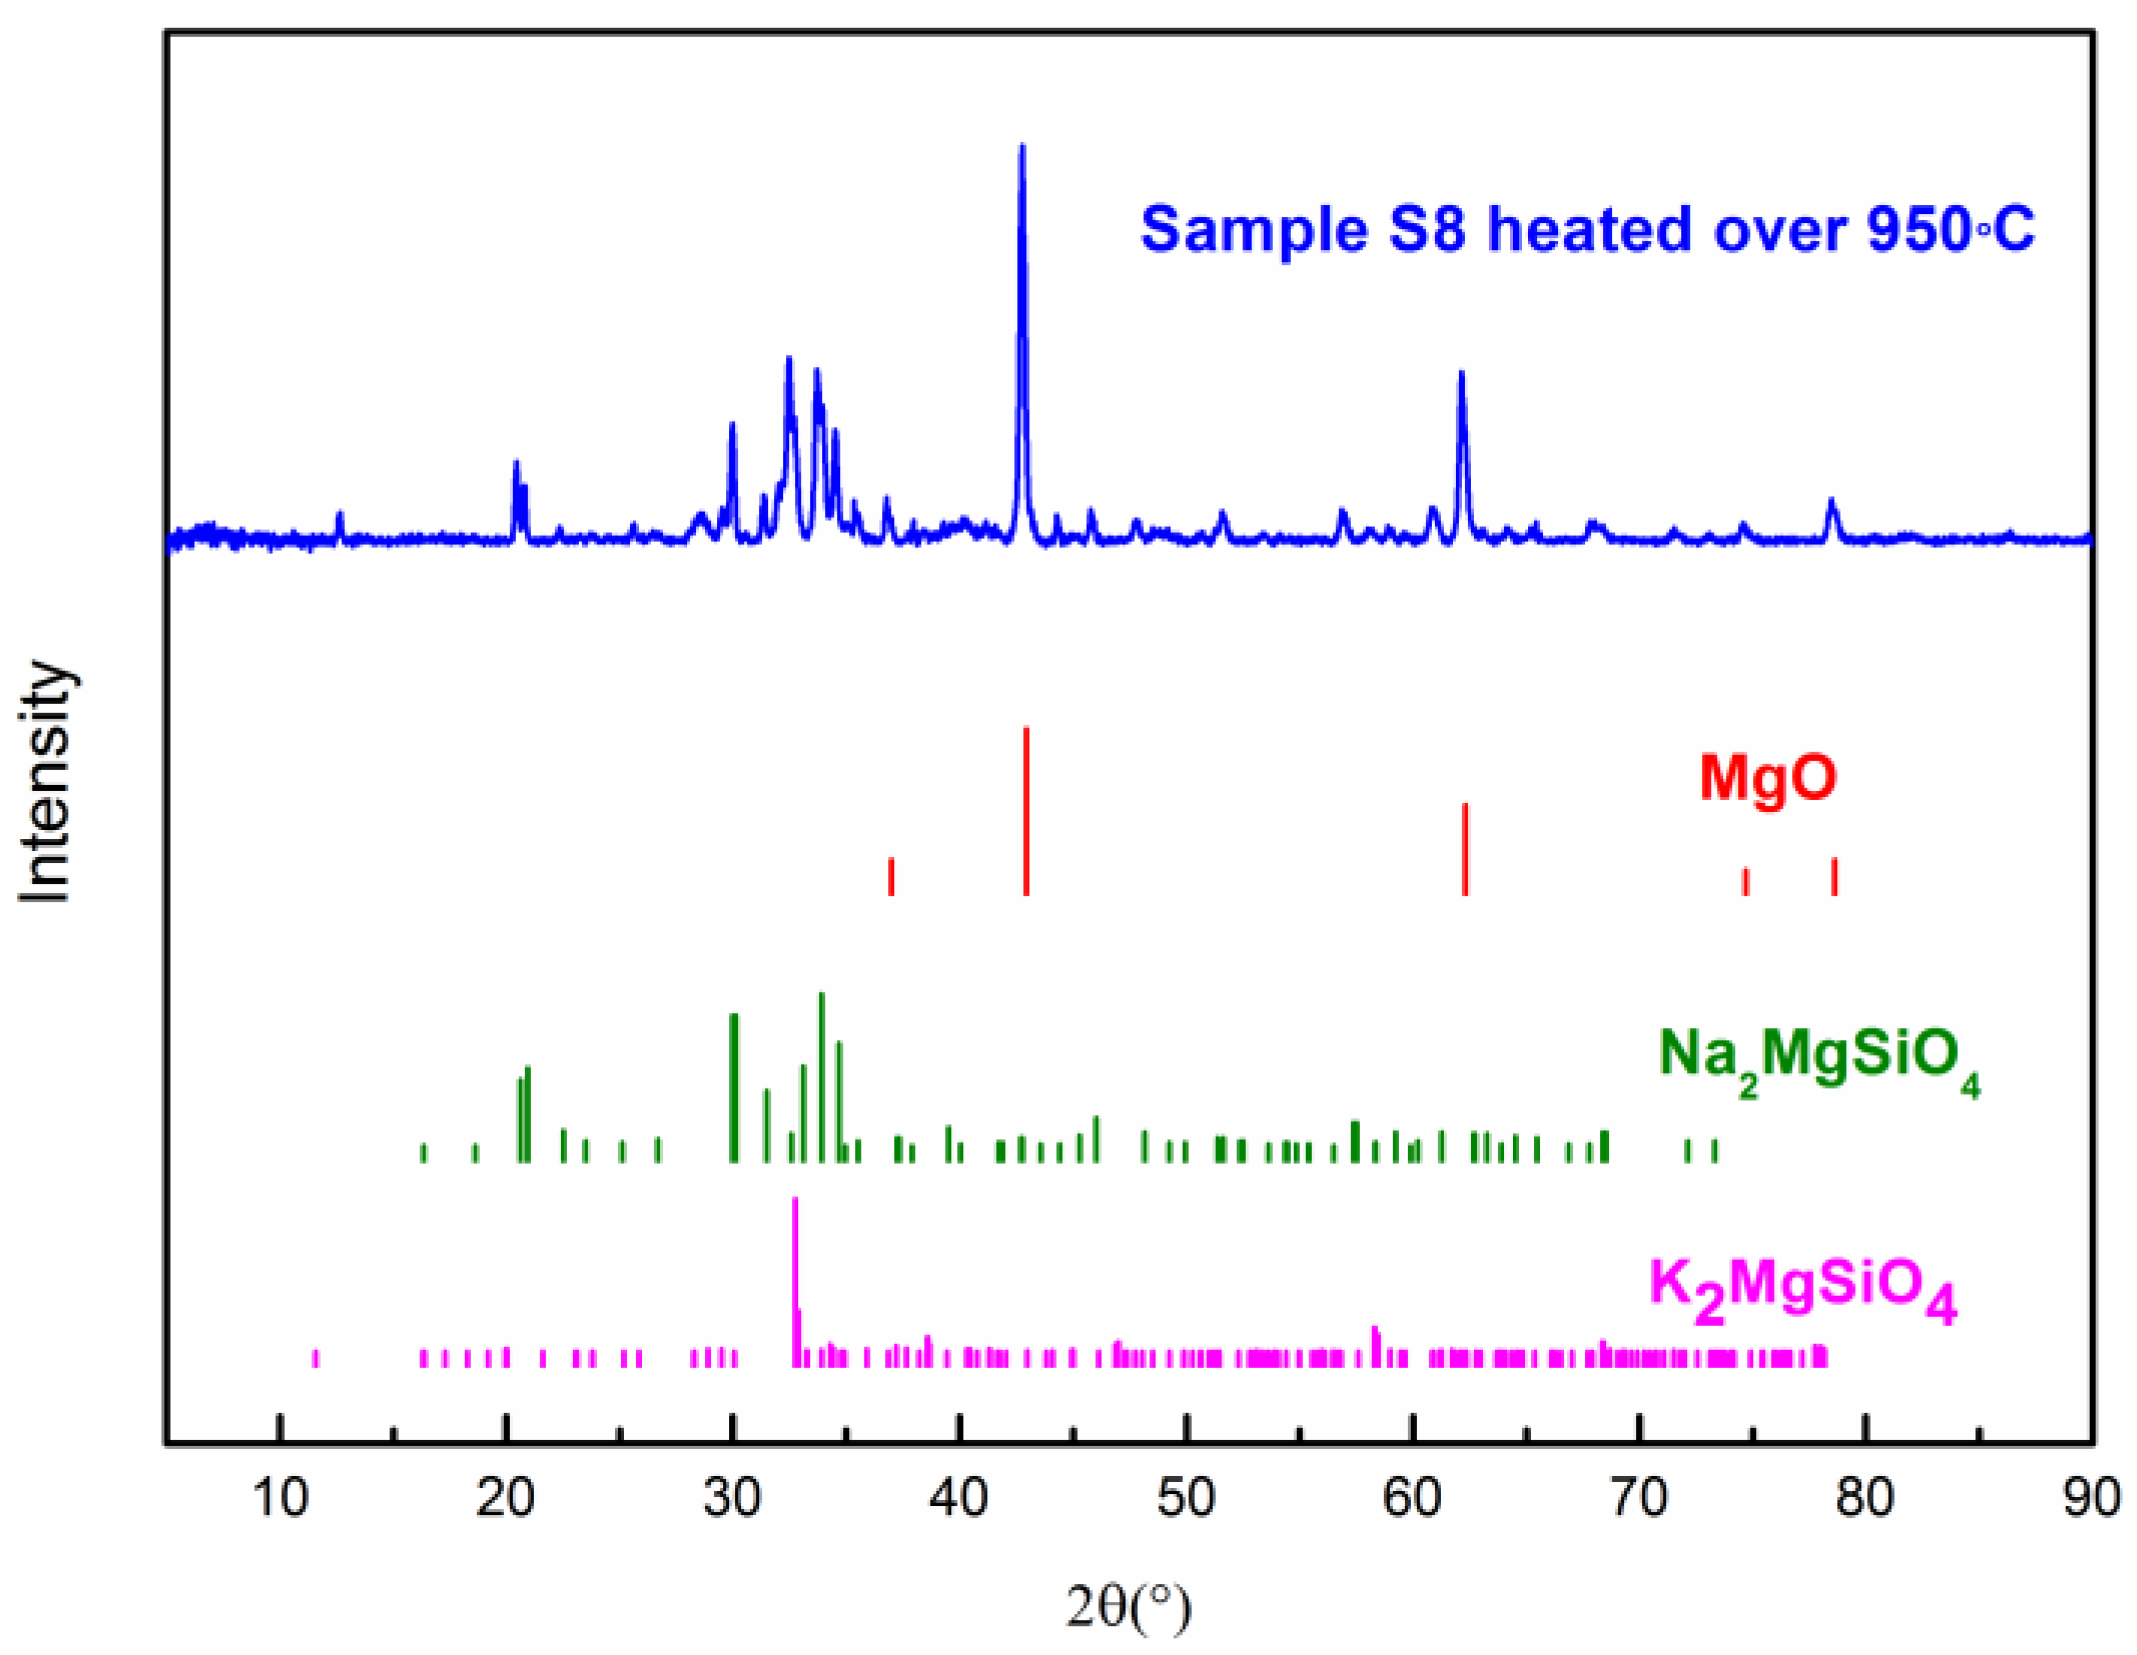
3.6. Thermal Stability of the Composite PCM

The thermal stability of the composite PCM was measured by TGA. Figure 9 shows the TG curve of the composite PCM (Sample S8). One can see that the onset decomposition temperatures of the composite PCM at a heating rate of 5 and 10 K/min are ~894 °C and ~885 °C, respectively [47]. When the temperature is over 900 °C, it starts to decompose rapidly. The residual substance of the composite PCM (S8) after the TG test (heated over 950 °C) was analyzed by XRD to understand the decomposition products. In Figure 10, one can see that the three substances are the main decomposition products which have remained, which are MgO, Na2MgSiO4, and K2MgSiO4. Kim et al. [48] have studied the decomposition of Na2CO3 and found that it starts to decompose slowly after 850 °C. Lehman et al. [49] have found that K2CO3 starts to decompose slowly after 900 °C. In addition, the decomposition of Na2CO3 and K2CO3 occurs in two consecutive steps: (1) A2CO3 (l) = A2O (s) + CO2 (g); (2) A2O (l) = 2A (g) + ½ O2 (g); where A stands for Na2CO3 or K2CO3. Therefore, it can be deduced that decomposition products like Na2O and K2O could react with SiC and MgO at high temperatures. As a result, the reaction has produced Na2MgSiO4 and K2MgSiO4. However, the chemical reaction during decomposition still needs to be further studied. From the preliminary study of the thermal stability given above, this composite could stand at a relatively high temperature (~850 °C). Long-term stability of this material and the degradation kinetics during decomposition can be a meaningful subject for future study [50].

4. Conclusions

A high-temperature form-stable composite PCM was prepared and investigated in this work, which used the eutectic K2CO3-Na2CO3 as the phase change material, MgO as the shape stabilization material, and SiC as the thermal conductivity enhancer. The composite PCM was shown to be able to shape-stabilize up to ~60% of the PCM with no leakage nor deformation after sintering. An addition of 10% SiC enhanced the overall thermal conductivity from 1.94 W·m−1K−1 to 2.28 W·m−1K−1, which gave an enhancement of 17.53%. Additionally, a 10% addition of SiC was found to be optimal since a higher content of SiC than 10% did not give much further enhancement. Microscopic studies showed uniform distributions of the components within the composite PCM structure after 100 thermal cycles. XRD studies indicated high chemical compatibility between different components after repeated thermal cycling. Thermal analysis showed that the composite PCM had a melting point of ~710.1 °C and an onset decomposition temperature of ~885 °C at a heating rate of 10 °C/min. The energy density of the composite PCM was found to be 431.2 J/g for a temperature range of 550 °C–750 °C, which combined both the sensible heat and the latent heat.

Symbols

DSCDifferential scanning calorimetry
SEMScanning electron microscopy
LFALaser flash analysis
TEMTransmission electron microscopy
TGThermogravimetric analysis
EDSEnergy-dispersive X-ray spectroscopy
FTIRFourier-transform infrared spectroscopy
XRDX-ray diffraction
PCMPhase change material
TESThermal energy storage
EGExpanded graphite
STASimultaneous thermal analysis
XRFX-ray fluorescence spectrometer
BETBET surface area analyzer
DTADifferential thermal analysis

Author Contributions

Conceptualization, Z.J. and Y.D.; methodology, Z.J. and G.L; validation, Z.J., F.J., C.L., X.Z., Y.L. and T.Z.; formal analysis, Z.J., F.J. and C.L.; investigation, G.L.; resources, G.L. and C.L.; data curation, Z.J., F.J.; writing—original draft preparation, Z.J., C.L.; writing—review and editing, Y.D.; visualization, C.L.; supervision, Y.D.; project administration, X.X.; funding acquisition, G.X., Y.J. and C.Y.

Funding

The authors gratefully acknowledge the financial support given by the State Grid Corporation of China under No. SGRI-DL-71-15-001 and UK EPSRC under EP/P003435/1 and EP/P004709/1.

Acknowledgments

The authors are grateful for the support from the University of Science and Technology Beijing.

Conflicts of Interest

The authors declare no conflict of interest.

References

  1. Global Energy and CO2 Status Report; International Energy Agency: Paris, France, 2017.
  2. Gielen, D. Tracking Industrial Energy Efficiency and CO2 Emissions. Int. Energy Agency 2007, 34, 1–2. [Google Scholar]
  3. Balcilar, M.; Ozdemir, Z.A.; Ozdemir, H.; Shahbaz, M. The renewable energy consumption and growth in the G-7 countries: Evidence from historical decomposition method. Renew. Energy 2018, 126, 594–604. [Google Scholar] [CrossRef] [Green Version]
  4. Hasan, R.; Mekhilef, S.; Seyedmahmoudian, M.; Horan, B. Grid-connected isolated PV microinverters: A review. Renew. Sustain. Energy Rev. 2017, 67, 1065–1080. [Google Scholar] [CrossRef]
  5. Farid, M.M.; Khudhair, A.M.; Razack, S.A.K.; Al-Hallaj, S. A review on phase change energy storage: Materials and applications. Energy Convers. Manag. 2004, 45, 1597–1615. [Google Scholar] [CrossRef]
  6. Lefebvre, D.; Tezel, F.H. A review of energy storage technologies with a focus on adsorption thermal energy storage processes for heating applications. Renew. Sustain. Energy Rev. 2017, 67, 116–125. [Google Scholar] [CrossRef]
  7. Mahlia, T.M.I.; Saktisahdan, T.J.; Jannifar, A.; Hasan, M.H.; Matseelar, H.S.C. A review of available methods and development on energy storage: Technology update. Renew. Sustain. Energy Rev. 2014, 33, 532–545. [Google Scholar] [CrossRef]
  8. Ge, Z.; Li, Y.; Li, D.; Sun, Z.; Jin, Y.; Liu, C.; Li, C.; Leng, G. Thermal energy storage: Challenges and the role of particle technology. Particuology 2014, 15, 2–8. [Google Scholar] [CrossRef]
  9. Chen, H.; Cong, T.N.; Yang, W.; Tan, C.; Li, Y.; Ding, Y. Progress in electrical energy storage system: A critical review. Prog. Nat. Sci. 2009, 19, 291–312. [Google Scholar] [CrossRef]
  10. Li, Y.; Jin, Y.; Huang, Y.; Ye, F.; Wang, X.; Li, D.; Wang, C.; Ding, Y. Principles and new development of thermal storage technology. Energy Storage Sci. Technol. 2013, 2, 69–72. [Google Scholar]
  11. Nomura, T.; Okinaka, N.; Akiyama, T. Technology of latent heat storage for high temperature application: A review. ISIJ Int. 2010, 50, 1229–1239. [Google Scholar] [CrossRef]
  12. Michels, H.; Pitz-Paal, R. Cascaded latent heat storage for parabolic trough solar power plants. Sol. Energy 2007, 81, 829–837. [Google Scholar] [CrossRef]
  13. Kenisarin, M.M. High-temperature phase change materials for thermal energy storage. Renew. Sustain. Energy Rev. 2010, 14, 955–970. [Google Scholar] [CrossRef]
  14. Jiang, Z.; Leng, G.; Ye, F.; Ge, Z.; Liu, C.; Wang, L.; Huang, Y.; Ding, Y. Form-stable LiNO3–NaNO3–KNO3–Ca(NO3)2/calcium silicate composite phase change material (PCM) for mid-low temperature thermal energy storage. Energy Convers. Manag. 2015, 106, 165–172. [Google Scholar] [CrossRef]
  15. Zhong, L.; Zhang, X.; Luan, Y.; Wang, G.; Feng, Y.; Feng, D. Preparation and thermal properties of porous heterogeneous composite phase change materials based on molten salts/expanded graphite. Solar Energy 2014, 107, 63–73. [Google Scholar] [CrossRef]
  16. Huang, Z.; Gao, X.; Xu, T.; Fang, Y.; Zhang, Z. Thermal property measurement and heat storage analysis of LiNO3/KCl—Expanded graphite composite phase change material. Appl. Energy 2014, 115, 265–271. [Google Scholar] [CrossRef]
  17. Qian, T.; Li, J.; Min, X.; Deng, Y.; Guan, W.; Ning, L. Diatomite: A promising natural candidate as carrier material for low, middle and high temperature phase change material. Energy Convers. Manag. 2015, 98, 34–45. [Google Scholar] [CrossRef]
  18. Pincemin, S.; Olives, R.; Py, X.; Christ, M. Highly conductive composites made of phase change materials and graphite for thermal storage. Sol. Energy Mater. Sol. Cells 2008, 92, 603–613. [Google Scholar] [CrossRef]
  19. Xu, B.; Li, Z. Paraffin/diatomite composite phase change material incorporated cement-based composite for thermal energy storage. Appl. Energy 2013, 105, 229–237. [Google Scholar] [CrossRef]
  20. Xiao, J.; Huang, J.; Zhu, P.; Wang, C.; Li, X. Preparation, characterization and thermal properties of binary nitrate salts/expanded graphite as composite phase change material. Thermochim. Acta 2014, 587, 52–58. [Google Scholar] [CrossRef]
  21. Li, Y.; Guo, B.; Huang, G.; Kubo, S.; Shu, P. Characterization and thermal performance of nitrate mixture/SiC ceramic honeycomb composite phase change materials for thermal energy storage. Appl. Therm. Eng. 2015, 81, 193–197. [Google Scholar] [CrossRef]
  22. Acem, Z.; Lopez, J.; Palomo Del Barrio, E. KNO3/NaNO3–Graphite materials for thermal energy storage at high temperature: Part I.—Elaboration methods and thermal properties. Appl. Therm. Eng. 2010, 30, 1580–1585. [Google Scholar] [CrossRef]
  23. Xu, G.; Leng, G.; Yang, C.; Qin, Y.; Wu, Y.; Chen, H.; Cong, L.; Ding, Y. Sodium nitrate—Diatomite composite materials for thermal energy storage. Sol. Energy 2017, 146, 494–502. [Google Scholar] [CrossRef]
  24. Li, R.; Zhu, J.; Zhou, W.; Cheng, X.; Li, Y. Thermal properties of sodium nitrate-expanded vermiculite form-stable composite phase change materials. Mater. Des. 2016, 104, 190–196. [Google Scholar] [CrossRef]
  25. Tao, Y.B.; Lin, C.H.; He, Y.L. Preparation and thermal properties characterization of carbonate salt/carbon nanomaterial composite phase change material. Energy Convers. Manag. 2015, 97, 103–110. [Google Scholar] [CrossRef]
  26. Ge, Z.; Ye, F.; Cao, H.; Leng, G.; Qin, Y. Carbonate-salt-based composite materials for medium- and high-temperature thermal energy storage. Particuology 2014, 15, 77–81. [Google Scholar] [CrossRef] [Green Version]
  27. Ge, Z.; Ye, F.; Ding, Y. Composite Materials for Thermal Energy Storage: Enhancing Performance through Microstructures. ChemSusChem 2014, 7, 1318–1325. [Google Scholar] [CrossRef] [PubMed] [Green Version]
  28. Tian, H.; Wang, W.; Ding, J.; Wei, X.; Huang, C. Preparation of binary eutectic chloride/expanded graphite as high-temperature thermal energy storage materials. Sol. Energy Mater. Sol. Cells 2016, 149, 187–194. [Google Scholar] [CrossRef]
  29. Qin, Y.; Leng, G.; Yu, X.; Cao, H.; Qiao, G.; Dai, Y.; Zhang, Y.; Ding, Y. Sodium sulfate–diatomite composite materials for high temperature thermal energy storage. Powder Technol. 2015, 282, 37–42. [Google Scholar] [CrossRef]
  30. Wu, J.; Li, J.; Xu, X.; Yang, L.; Wu, J.; Zhao, F.; Li, C. Molten salts/ceramic-foam matrix composites by melt infiltration method as energy storage material. J. Wuhan Univ. Technol. Sci. Ed. 2009, 24, 651–653. [Google Scholar] [CrossRef]
  31. Ronchi, C.; Sheindlin, M. Melting point of MgO. J. Appl. Phys. 2001, 90, 3325–3331. [Google Scholar] [CrossRef]
  32. Prochazka, S. Dense Silicon Carbide Ceramic and Method of Making Same. U.S. Patent 3,852,099, 1972. [Google Scholar]
  33. Slack, G.A. Nonmetallic crystals with high thermal conductivity. J. Phys. Chem. Solids 1973, 34, 321–335. [Google Scholar] [CrossRef]
  34. Watari, K.; Nakano, H.; Sato, K.; Urabe, K.; Ishizaki, K.; Cao, S.; Mori, K. Effect of Grain Boundaries on Thermal Conductivity of Silicon Carbide Ceramic at 5 to 1300 K. J. Am. Ceram. Soc. 2003, 86, 1812–1814. [Google Scholar] [CrossRef]
  35. Gubernat, A.; Pichór, W.; Lach, R.; Zientara, D.; Sitarz, M.; Springwald, M. Low-temperature synthesis of silicon carbide powder using shungite. Boletín la Soc. Española Cerámica y Vidr. 2017, 56, 39–46. [Google Scholar] [CrossRef] [Green Version]
  36. Slifka, A.J.; Filla, B.J.; Phelps, J.M. Thermal conductivity of magnesium oxide from absolute, steady-state measurements. J. Res. Natl. Inst. Stand. Technol. 1998, 103, 357. [Google Scholar] [CrossRef] [PubMed]
  37. Roest, D.L.; Ballone, P.; Bedeaux, D.; Kjelstrup, S. High-Temperature Metal/Molten Alkali Carbonate Interfaces: A Molecular Dynamics Study. 2017. [Google Scholar]
  38. Navarro, M.E.; Andreu, P.; Qiao, G.; Ding, Y. Thermal properties of a novel medium temperature thermal energy storage composite based on sodium nitrate as phase change material. In Proceedings of the 12th International Conference on Heat Transfer, Fluid Mechanics and Thermodynamics, Costa de Sol, Spain, 11–13 July 2016. [Google Scholar]
  39. Do, K.S.; Aktay, C.; Tamme, R.; Müller-Steinhagen, H. Thermal Conductivity of High-Temperature Multicomponent Materials with Phase Change. Int. J. Thermophys. 2008, 29, 678–692. [Google Scholar]
  40. Pezoldt, J.; Stottko, B.; Kupris, G.; Ecke, G. Sputtering effects in hexagonal silicon carbide. Mater. Sci. Eng. 1995, 29, 94–98. [Google Scholar] [CrossRef]
  41. Guo, Q.; Wang, T. Influence of SiO2 pore structure on phase change enthalpy of shape-stabilized polyethylene glycol/silica composites. J. Mater. Sci. 2013, 48, 3716–3721. [Google Scholar] [CrossRef]
  42. Li, C.; Yu, H.; Song, Y.; Zhao, M. Synthesis and characterization of PEG/ZSM-5 composite phase change materials for latent heat storage. Renew. Energy 2018, 121, 45–52. [Google Scholar] [CrossRef]
  43. Robie, R.A.; Hemingway, S.; James, R. Thermodynamic Properties of Minerals and Related Substances at 298.15 K and 1 Bar (105 Pascals) Pressure and at Higher Temperatures; US Government Printing Office: Washington, WA, USA, 1995.
  44. Munro, R.G. Material Properties of a Sintered α-SiC. J. Phys. Chem. Ref. Data 1997, 26, 1195–1203. [Google Scholar] [CrossRef]
  45. Yin, H.; Lu, B.; Xu, Y.; Tang, D.; Mao, X.; Xiao, W.; Wang, D.; Alshawabkeh, A.N. Harvesting Capacitive Carbon by Carbonization of Waste Biomass in Molten Salts. Environ. Sci. Technol. 2014, 48, 8101–8108. [Google Scholar] [CrossRef] [PubMed]
  46. Yoshida, S.; Matsunami, J.; Hosokawa, Y.; Yokota, O.; Tamaura, Y.; Kitamura, M. Coal/CO2 Gasification System Using Molten Carbonate Salt for Solar/Fossil Energy Hybridization. Energy Fuels 1999, 13, 961–964. [Google Scholar] [CrossRef]
  47. Ren, N.; Wu, Y.; Ma, C.; Sang, L. Preparation and thermal properties of quaternary mixed nitrate with low melting point. Sol. Energy Mater. Sol. Cells 2014, 127, 6–13. [Google Scholar] [CrossRef]
  48. Kim, J.-W.; Lee, H.-G. Thermal and Carbothermic Decomposition of Na2 CO3 and Li2 CO3. Metall. Mater. Trans. B 2001, 32, 17–24. [Google Scholar] [CrossRef]
  49. Lehman, R.L.; Gentry, J.S.; Glumac, N.G. Thermal stability of potassium carbonate near its melting point. Thermochim. Acta 1998, 316, 1–9. [Google Scholar] [CrossRef]
  50. Wang, T.; Mantha, D.; Reddy, R.G. Thermal stability of the eutectic composition in LiNO3–NaNO3–KNO3 ternary system used for thermal energy storage. Sol. Energy Mater. Sol. Cells 2012, 100, 162–168. [Google Scholar] [CrossRef]
Figure 1. Visual observations of composite PCMs after sintering.
Applsci 09 00814 g001
Figure 2. The thermal conductivity of composite PCMs with different SiC contents using a mass ratio of salt to MgO of 60:40.
Applsci 09 00814 g002
Figure 3. SEM images for Sample S3: (a) 100×; (b) 500×; (c) EDS mapping, 500×; SEM images for Sample S8: (d) 100×; (e) 500×; (f) EDS mapping, 500×.
Applsci 09 00814 g003
Figure 4. Pore size, porosity, and density of Sample S3 and Sample S8.
Applsci 09 00814 g004
Figure 5. SEM images of Sample S8 after 100 thermal cycles: (a) 100×; (b) 500×; (c) EDS mapping, 500×.
Applsci 09 00814 g005
Figure 6. XRD Patterns of the composite PCM and individual components.
Applsci 09 00814 g006
Figure 7. XRD patterns of Sample S8 with and without 100 thermal cycles.
Applsci 09 00814 g007
Figure 8. DSC and Cp curves of the composite PCM (Sample S8).
Applsci 09 00814 g008
Figure 9. TG curve of the composite PCM.
Applsci 09 00814 g009
Figure 10. XRD Patterns of composite PCM (S8) heated over 950 °C.
Applsci 09 00814 g010
Table 1. Overview of salt-based form-stable composite phase change materials (PCMs).
No.Melting Temperature (°C)PCMSkeleton MaterialsThermal Conductivity EnhancerCharacterizationRef.
1103.5LiNO3-NaNO3-KNO3-Ca(NO3)2Calcium silicateGraphiteSEM, XRD, STA, Hot Plate, 1000 thermal cycles[14]
2168.5–229.7LiNO3-KCl, LiNO3-NaNO3, LiNO3-NaClEGaEGSEM, XRD, STA, Hot Disc[15]
3200LiNO3-KClEGEGDSC, Hot Disc[16]
4240-255LiNO3Diatomite-SEM, XRD, DSC, XRF, BET, FTIR, TEM[17]
5220NaNO3-KNO3GraphiteGraphiteDTA, Hot Plate[18]
6220-350NaNO3-KNO3, NaNO3, KNO3EGEGDSC, Hotwire[19]
7220NaNO3-KNO3EGEGSEM, XRD, DSC, EDS, TEM[20]
8220NaNO3-KNO3SiC SEM, DSC[21]
9220NaNO3-KNO3GraphiteGraphiteHot Plate[22]
10300NaNO3DiatomiteGraphiteSEM, XRD, STA, XRF, BET, 300 thermal cycles[23]
11300NaNO3Expanded vermiculiteSiCSEM, XRD, DSC, FTIR, Hot Disc[24]
12486Li2CO3-K2CO3GraphiteGraphiteDSC, LFA[25]
13500Li2CO3-Na2CO3MgOGraphiteSEM, XMT, LFA, TG-DSC[26,27]
14506NaCl-CaCl2EGEGSEM, XRD, DSC, Hot Disc[28]
15880Na2SO4Diatomite-SEM, XRD, STA, XRF, BET[29]
16880Na2SO4SiC-XRD, SEM, TG-DSC[30]
a EG is short for expanded graphite.
Table 2. Formulations of the K2CO3-Na2CO3/MgO/SiC composite PCMs (ratio in mass).
SampleK2CO3-Na2CO3MgOSiC
S14060-
S25050-
S36040-
S47030-
S58020-
S660401
S760405
S8604010
S9604015
S10604020

