Article

Experimental Investigation of Freezing and Melting Characteristics of Graphene-Based Phase Change Nanocomposite for Cold Thermal Energy Storage Applications

1
Department of Mechanical Engineering, Anna University, College of Engineering Campus, Chennai 600 025, India
2
Department of Mechanical Engineering, SRM Institute of Science and Technology, Kattankulathur, Chennai 603 203, India
3
International Institute for Carbon-Neutral Energy Research, Kyushu University, Nishi-ku, Fukuoka 819-0395, Japan
*
Author to whom correspondence should be addressed.
Appl. Sci. 2019, 9(6), 1099; https://doi.org/10.3390/app9061099
Submission received: 15 January 2019 / Revised: 28 February 2019 / Accepted: 28 February 2019 / Published: 15 March 2019
(This article belongs to the Special Issue Graphene Nanoplatelets)

Abstract

:
In the present work, the freezing and melting characteristics of water seeded with chemically functionalized graphene nanoplatelets in a vertical cylindrical capsule were experimentally studied. The volume percentage of functionalized graphene nanoplatelets varied from 0.1% to 0.5% with an interval of 0.1%. The stability of the synthesized samples was measured using zeta potential analyzer. The thermal conductivity of the nanocomposite samples was experimentally measured using the transient hot wire method. A ~24% (maximum) increase in the thermal conductivity was observed for the 0.5% volume percentage in the liquid state, while a ~53% enhancement was observed in the solid state. The freezing and melting behavior of water dispersed with graphene nanoplatelets was assessed using a cylindrical stainless steel capsule in a constant temperature bath. The bath temperatures considered for studying the freezing characteristics were −6 °C and −10 °C, while to study the melting characteristics the bath temperature was set as 31 °C and 36 °C. The freezing and melting time decreased for all the test conditions when the volume percentage of GnP increased. The freezing rate was enhanced by ~43% and ~32% for the bath temperatures of −6 °C and −10 °C, respectively, at 0.5 vol % of graphene loading. The melting rate was enhanced by ~42% and ~63% for the bath temperatures of 31 °C and 36 °C, respectively, at 0.5 vol % of graphene loading.

1. Introduction

The world is facing a lot of challenges related to storing and retrieving energy and fulfilling the pressing energy demands. Heat is the main form of energy which can be stored, and this is achieved in the form of latent heat using phase change materials (PCM). The oldest form of thermal energy storage (TES) probably involves harvesting ice from lakes and rivers and storing it in well-insulated warehouses throughout the year for use in almost all tasks that mechanical refrigeration satisfies today, including food preservation, cooling of drinks, and air-conditioning. A variety of TES techniques have been developed over the past decades. Today compressed-air storage and batteries are mostly used to meet many of the thermal energy storage requirements.
Instead of storing electrical energy in a battery or as compressed air, thermal energy storage using water-based ice is one of the most ancient modes of energy storage and is considered to be the most efficient and economic mode of energy storage, as it eliminates the recurring expenses incurred for the replacement of batteries. Water can be used as an effective thermal energy storage material due to its higher thermal conductivity and excellent freezing/melting characteristics. Cold energy stored in ice can be effectively used to remove heat from another fluid in a secondary circuit. Water acts as a good thermal energy storage material in various industries such as the dairy industry for chilling milk [1,2], and the pharmaceutical [3] and chemical industries for transportation and storage without having to depend on batteries.
The refrigeration sector has now evolved the use of DC powered compressors that directly utilize the use of solar energy eliminating inverters. Likewise, few researches have started using DC powered compressors without batteries autonomously depending on ice-based thermal storage [1,2,3,4]. Pedersen and Katic (2016) confirmed that the energy content in ice produced by the DC compressor was higher than the energy content in a lead-acid battery, in terms of both volume and weight.
However, further research has been going on as regards replacing water with other fluids or choosing the best additives so as to improve the freezing and melting characteristics enabling one to store more thermal energy and to have smaller thermal storage devices. One of the most suitable methods is to add highly thermal conductive material to the water. Among the materials used, metal and metal oxides in nano-metric sizes exhibit excellent thermal transport properties. Owing to the higher density of metal and metal oxide powders, carbon-based nanomaterials are widely used because of their high aspect ratio. Hence, adding carbon-based nanomaterials is an effective way of increasing the thermal energy storage of water. Thus, this study is focused on the experimental investigation into the freezing and melting characteristics of graphene-based water for thermal energy storage applications such as in milk chilling and the chemical industries.
Guruprasad et al. (2017) [5] suggested that for medium and low temperature systems, the use of phase change materials (PCM) can be cost effective and will improve the thermal conductivity of thermal energy storage materials and play a major role in increasing the charging and discharging rate. They inferred that the thermal enhancement achieved with carbon-based nanostructures is better than those with metallic and metal oxide. The maximum enhancement in thermal conductivity obtained by Sathish Kumar et al. (2016) [6] was 9.5% for 0.6 wt. % of graphene nanoplatelets dispersed in water with the use of surfactants. A 24% reduction in the solidification time was observed for the nanocomposite with 0.6 wt. % of GnP. The experiments conducted by Ahammed et al. (2016) [7] showed an increase of 5.23% in thermal conductivity of graphene–water nanocomposite, prepared using surfactant, when the volume concentration of nanoparticles is changed from 0.05% to 0.1%, and a 14.56% enhancement was observed when the volume concentration increased by three times. Harikrishnan et al. (2014) [8] inferred that the latent heat of composite PCMs is lower than that of base material for both melting and freezing and the maximum changes are 3.56% and 3.82%, respectively. The thermal conductivity of graphene–water nanocomposite is found to be higher when compared with that of the metal oxide nanoparticles and is lower when compared with that of pure metallic nanoparticles. However, the use of pure metallic nanoparticles in fluids causes stability problems. Hence, Ahammed et al. (2016) [9] suggested that instead of using a high-volume concentration of metal oxide and pure metal nanoparticles, a low-volume concentration of graphene can be used as the heat transfer fluid to enhance thermal conductivity. Harish et al. (2015) [10] treated graphene nanoparticles with concentrated nitric acid to avoid the use of surfactants. A maximum thermal conductivity enhancement of ~230% was measured in lauric acid treated with the acid graphene nanoinclusions for 1 vol %.
As a result of the ever-growing demand for energy, there is a need for energy storage in PCMs. The PCMs are usually encapsulated in containers/capsules. Different researches have used different geometrical shapes for the capsules such as cylinders, spheres, pyramids, cones, rectangles, and cuboids with different materials like stainless steel, aluminum, copper, polypropylene, and polyolefin for numerical and experimental studies. The material selection was based on the property of the PCM used and the potential applications [11,12,13,14,15,16]. Yoon et al. (2001) [17] studied the freezing properties of water in a circular cylinder kept horizontally. During the initial phase of freezing, an annular ice layer started growing on the surface of the cylinder at a higher rate. This was followed by the asymmetric ice layer at a medium cooling rate and finally an instantaneous ice layer growing over the whole region at a low cooling rate. Kalaiselvam et al. (2008) [18] performed an analytical analysis in the freezing and melting process of different PCMs encapsulated in a cylindrical capsule. The presence of heat generation enhanced the freezing time whilst also hastening the melting time. Total freezing time was subject to Stefan’s Number and heat generation parameters, whereas complete melting time depended on equivalent thermal conductivity.
Nanotechnology is being used in many applications to provide more efficient energy transfer. The application of nanocomposites in heat exchanging devices appears promising with these characteristics. In this context, the use of nanoparticles in water provides a scope for performance improvement in thermal storage for an ice bank tank. The main objective of this work is to study the freezing and melting characteristics of graphene–water nanocomposite in a vertical cylindrical capsule and compare it with base fluid. Graphene has been widely used in many applications since its discovery by Novoselov et al. [19] because of its structure i.e., a single-atom-thick sheet of hexagonally arrayed sp2-bonded carbon atoms. Graphene possesses remarkable thermophysical properties due to its large specific surface area (50–750 m2/g) and extremely high thermal conductivity (3000–5000 W/m K) [20,21,22,23,24,25,26,27,28]. The thermophysical properties of graphene nanocomposite, such as thermal conductivity, are also stable for the temperatures ranging from −10 °C to 40 °C, the zeta potential being a reason for this.

2. Materials and Methods

The thermal conductivity of the functionalized graphene–water nanocomposites were measured experimentally. The study was carried out using chemically treated graphene nanoplatelets to avoid the use of surfactants which were used to improve stability of the nanocomposites.

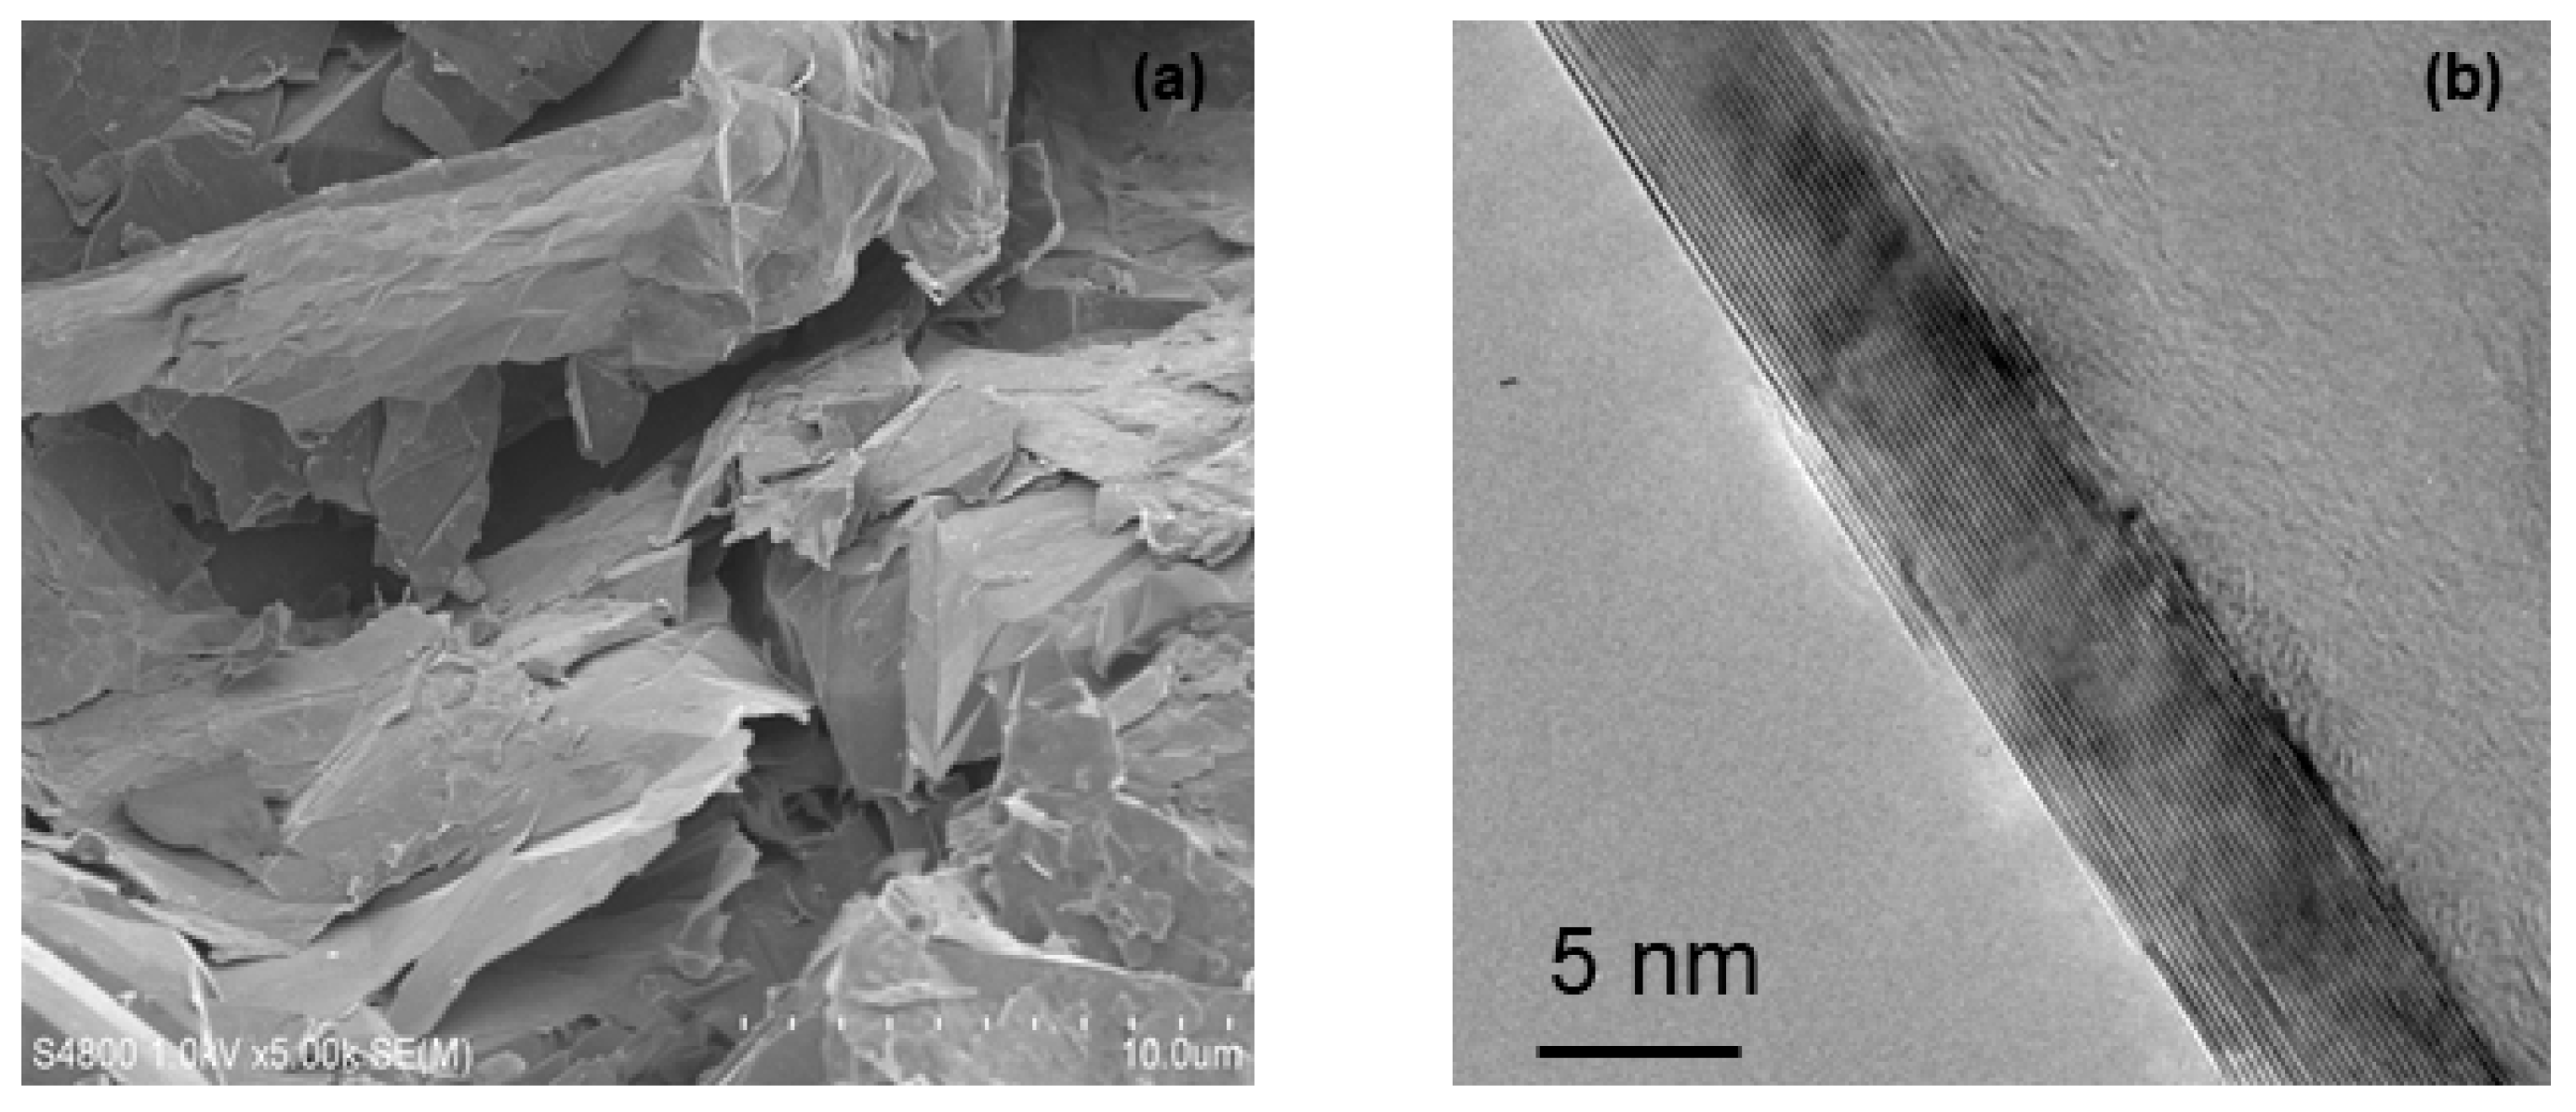
2.1. Preparation of Graphene Nanocomposite

The nanocomposite was prepared prior to the experimental work using the two-step method. The essential requirements for nanocomposites are: a stable suspension, adequate durability, negligible agglomeration of particulates, no chemical change in the particulates or fluid, etc. The required quantity of graphene nanoplatelets was purchased from XG Sciences (Lansing, MI, USA). The scanning electron microscopy (SEM) (FEI 3D Versa Dual Beam, Hillsboro, Oregon, USA) and transmission electron microscopy (TEM) (JEOL JEM-2000EX, Akishima, Tokyo, Japan) visualization of the GnP used is shown in Figure 1. The GnP–H2O was prepared using the covalent functionalization method. The GnPs were chemically functionalized with concentrated nitric acid (68 wt. %) to improve the dispersion of the particles and to avoid the use of surfactants. Five grams of graphene nanoplatelets were dispersed in 250 mL of concentrated nitric acid taken in a conical flask and then refluxed at a temperature of 100 °C for 2 h. For uniform dispersion, the fluid was stirred using a magnetic stirrer. To maintain a constant temperature during the process, the conical flask was placed in a constant temperature bath, which was maintained at 100 °C. After 2 h, the conical flask was taken out from the oil bath and allowed to cool down slowly to room temperature. The nanoplatelets were filtered then washed with DI water and dried in a furnace at 160 °C [10]. Nitric acid treatment was used to chemically modify the surface of graphene platelets in order to increase the surface-active sites for electrochemical reactions because of the hydrophobic nature of GnP. The nitric acid treatment introduced more oxygen/nitrogen-containing functional groups onto the graphene surface, and clearly enhanced the hydrophilicity of the graphene. This was to promote the wettability of graphene when it was dispersed in DI water, which was the base fluid. For the experimental work, the volume percentages of GnP were 0.1%, 0.2%, 0.3%, 0.4%, and 0.5%. Depending on the volume percentage, the required quantity of chemically functionalized GnP was added to the DI water and was stirred for 30 min using a magnetic stirrer. After stirring, the fluid was ultra-sonicated using a digital sonicator (Qsonica, Newtown, CT, USA) for 2 h to enhance the stability. The graphene nanocomposites, thus prepared, were kept for observation and no particle sedimentation was observed at the bottom of the bottle even after two weeks.

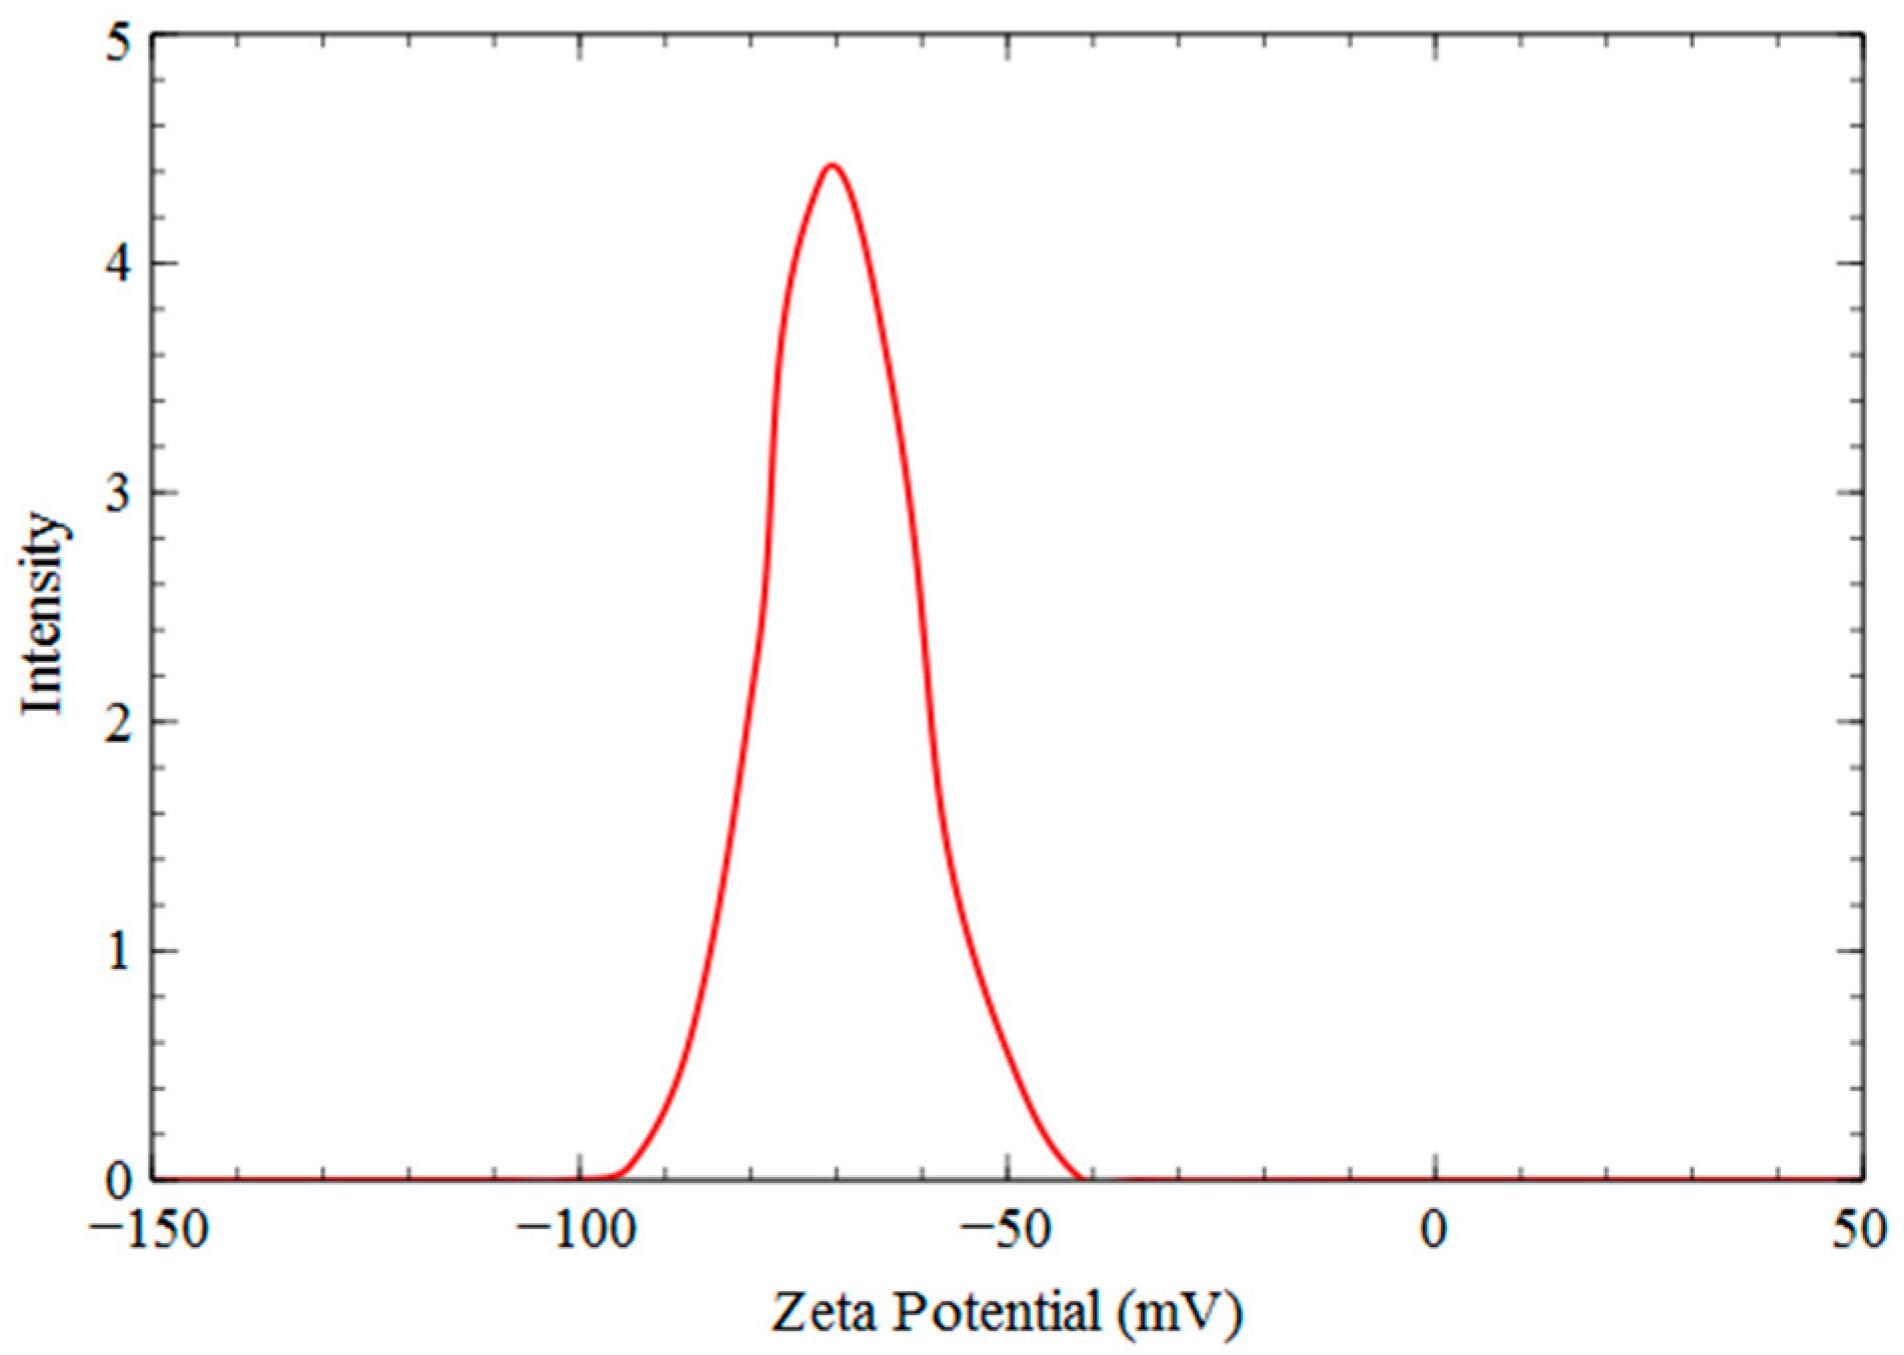
2.2. Stability Analysis

A zeta potential measurement was carried out in order to ensure the stability of the prepared nanocomposite. The general reference for average zeta potential values are considered to be more negative than −30 mV or more positive than +30 mV in order to predict the stability of dispersion, while poor stability will show a value below 20 mV [28,29]. Figure 2 shows that the stability of nanocomposite (0.5 vol. %) lies in the excellent stability region with a zeta potential peak of −69.4 mV. The nanoparticles are highly electronegative, and this indicates the excellent stability of the nanocomposite after acid treatment of GnP. The stability of the nanocomposite (0.5 vol. %) was measured after several cycles (>10) after freezing and melting experimentations.

2.3. Thermal Conductivity Measurement

The thermal conductivity of the nanocomposite was measured in the temperature range of −10 °C to 40 °C using the KD2 Pro thermal analyzer (Decagon devices, Pullman, WA, USA), which works on the principle of the transient hot wire method. The nanocomposite sample was poured in a small container and the KS1 sensor probe was inserted at the center of the container. The desired test temperatures of the samples were achieved by immersing the container in a refrigerated/heating circulator bath system, which maintains the temperature of the surrounding fluid with an accuracy of ±0.03 °C. The sensor used to measure the thermal conductivity in the KD2 Pro apparatus was the KS-1 sensor (60 mm long, 1.3 mm diameter) with an accuracy of ±10%. The sensor is integrated with a heating element and a thermo-resistor in the core and is connected to a microprocessor to control and conduct the measurements. The precise results were obtained by keeping the probe in the fluid sample continuously for 20 min, after attaining the desired equilibrium temperature. Five measurements were taken for each sample, to ensure the repeatability and accuracy of the result. While measuring the thermal conductivity in the solid phase of the nanocomposite, a thermal grease was applied on the surface of the KS-1 sensor as per the instructions by the KD2 Pro thermal analyzer manual. Holes were drilled in the solid nanocomposite then the KS-1 sensor with thermal grease was inserted to measure the thermal conductivity.

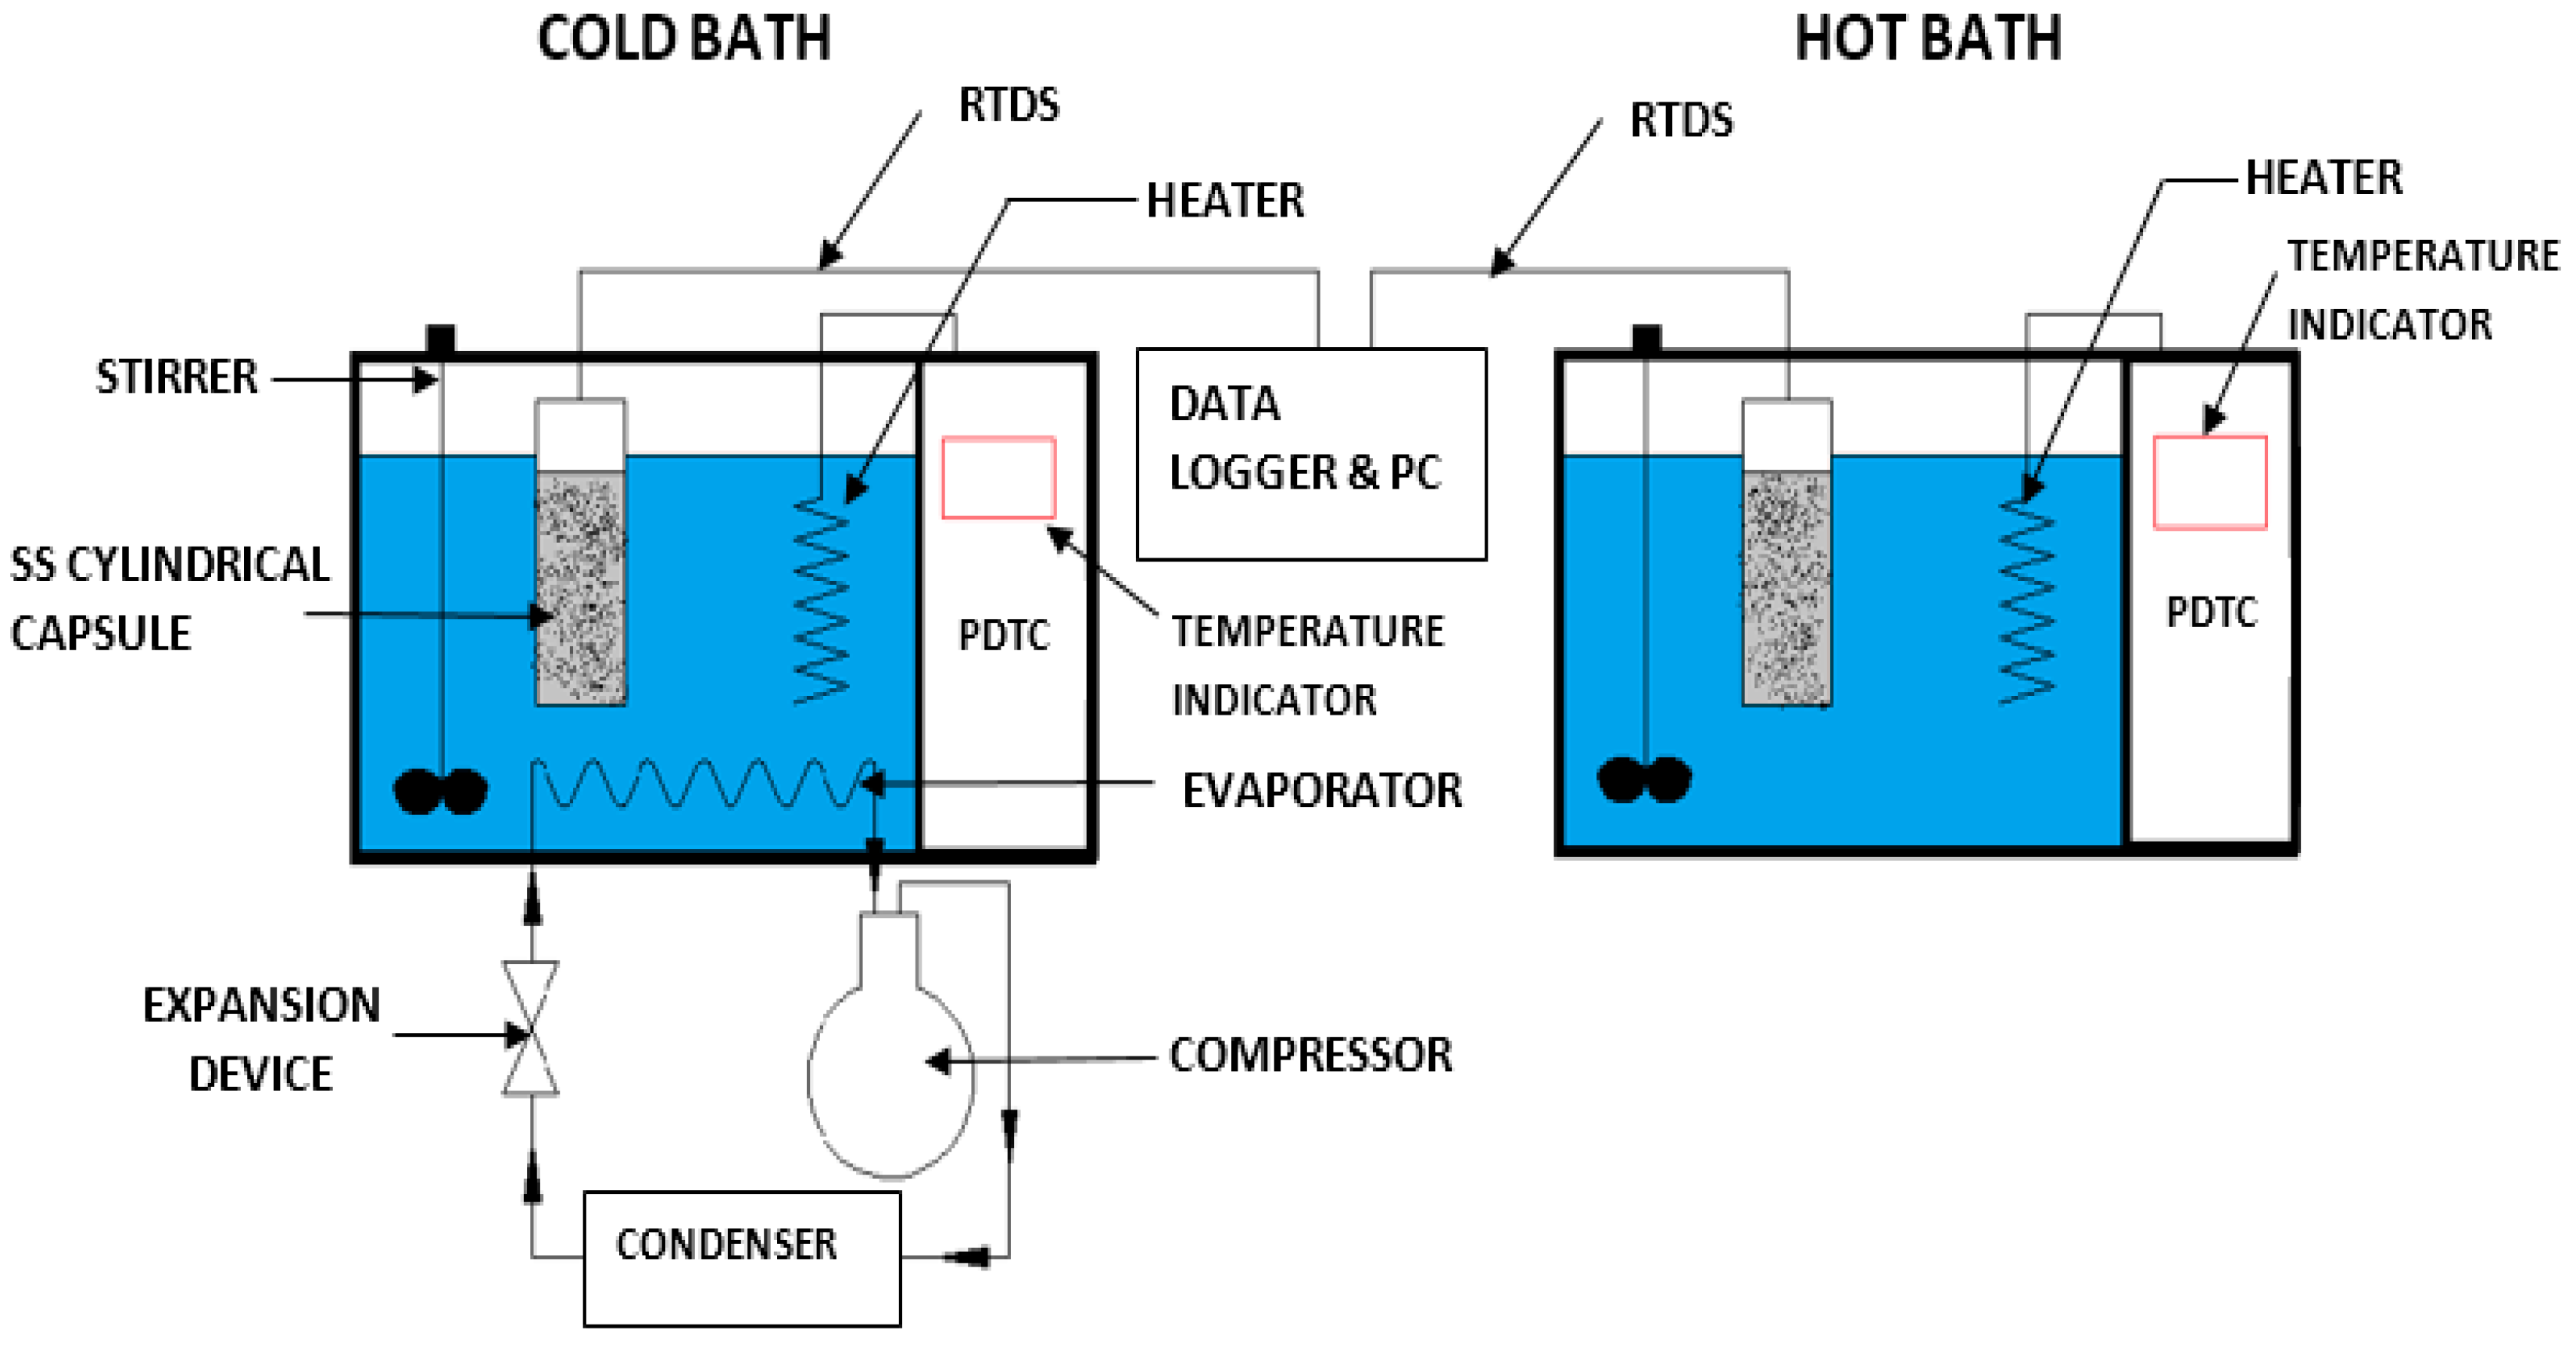
2.4. Experimental Test Facility for Freezing and Melting Characteristics

Figure 3 shows a schematic representation of the experimental test facility which was used to study the freezing/melting characteristics of the nanocomposite. The experiments consisted of charging and discharging of nanocomposite in a stainless steel (SS) cylindrical capsule. A cold bath was used for the freezing/charging experiments and a hot bath was used for the melting/discharging experiment. Experiments were carried out based on the test matrix as given in Section 2.5.
A stainless steel cylindrical capsule was used to carry out the freezing and melting experiments as in most thermal storage systems. The capsule was made of SS because most food storage appliances are made of SS [1]. The vertical cylindrical capsule had an inner diameter of 46 mm and height of 120 mm of a total capacity of 200 mL with a wall thickness of 1.5 mm. The temperature sensor in the middle of the cylinder was considered for the freezing and melting study. The nanocomposite was poured inside the capsule and then it was placed in the freezing bath. The capsule was filled to only 80% of its full capacity i.e., 160 mL, to account for the volume of RTDs (PT100 type) and the expansion of water when it becomes ice. The experimental setup for freezing (charging) consisted of a freezing unit with an evaporator tank, a condensing unit, a proportional differential temperature controller (PDTC), a cylindrical capsule, a computer, and a data logger. The cold bath was filled with a mixture of water and ethylene glycol so that negative temperatures could be achieved without freezing the cold bath. The transient temperature variations of the nanocomposites were measured and recorded continuously every 30 s using a data logger. The experimental setup for melting (discharging) consisted of a hot bath with a storage tank, a heating coil, a PDTC, a cylindrical capsule, a computer, and a data logger.

2.5. Test Matrix and Working Procedure

Freezing and melting experiments were carried out by placing a cylindrical SS capsule filled with nanocomposite in a constant temperature bath. The bath temperatures used were −6 °C and −10 °C for freezing the nanocomposite to −3 °C, while 31 °C and 36 °C were considered for the melting experimentations until the nanocomposites reached 30 °C. Table 1 shows the test matrix for the freezing and melting experiments.
During the charging process, the test sample was placed inside the cold bath tank where the temperature was maintained below the freezing temperature of the nanocomposite. In the beginning of the charging process, the nanocomposite was sensibly cooled until it reached the freezing temperature. At the freezing temperature, the latent heat was absorbed by the nanocomposite and it underwent phase change from liquid to solid. After freezing, the nanocomposite was again sensibly cooled until the bath temperature was achieved.
During the discharging process, the cylindrical capsule with the fully solidified nanocomposite was placed inside the storage tank where the temperature was maintained above the melting temperature of the nanocomposite. In the beginning of the discharging process, the nanocomposite was sensibly heated until it reached the melting temperature. At the melting temperature, the latent heat was released by the nanocomposite and it underwent phase change from solid to liquid. After melting, the nanocomposite was again sensibly heated until the bath temperature was achieved.

3. Results and Discussion

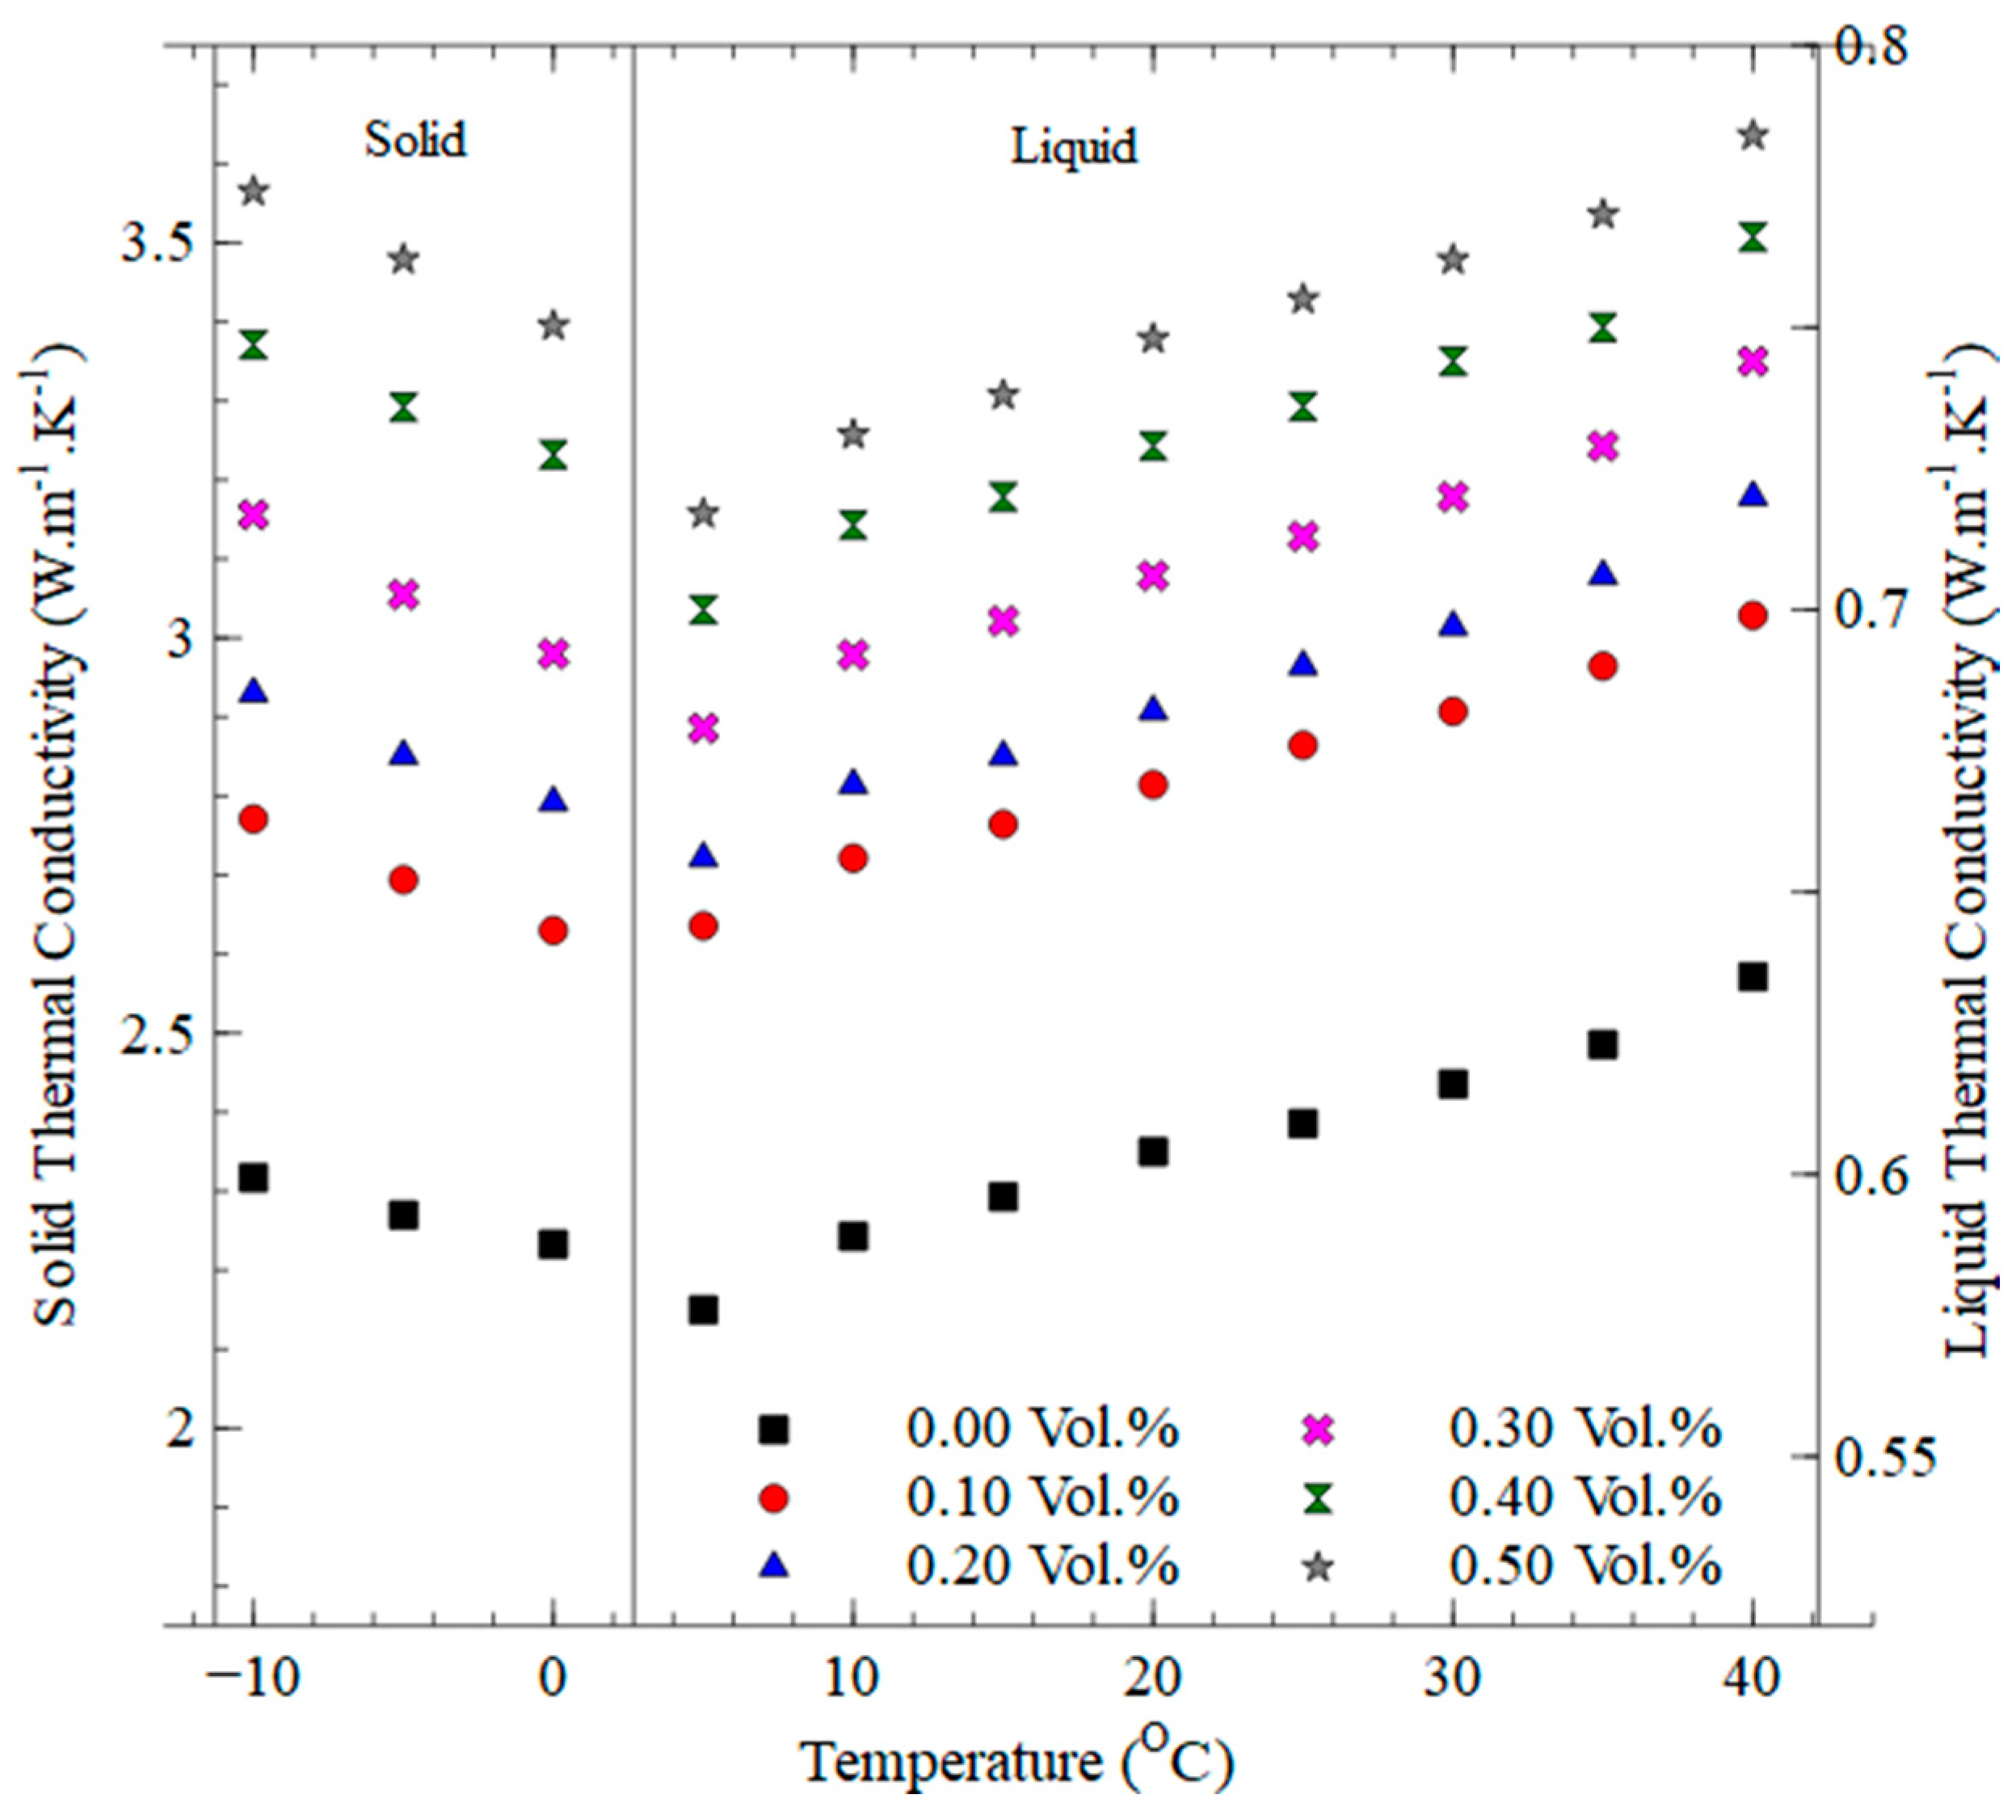
3.1. Thermal Conductivity

Initially, the thermal conductivity of pure DI water was experimentally measured at temperatures ranging from −10 to 40 °C. Then, the experimental data were compared with the standard data to validate the measurement practice [30,31,32]. It was found that the measured values matched-up with the standard values. The average percentage deviation of measured values from the standard values of the base fluid was ±2%.
Figure 4 shows the variation in thermal conductivity of the nanocomposite in a liquid state, and it is observed that the graphene nanocomposite has higher thermal conductivity when compared to the base fluid. The dispersion of GnP significantly improved the thermal conductivity of the nanocomposite. The reason behind this enhancement of thermal conductivity is the nano-size of the GnP and the two-dimensional geometry of the GnP that increases the exposure to the base fluid.
By increasing the volume percentage of the GnP, the thermal conductivity was found to increase. The average increase in thermal conductivity compared to base fluid were found to be 11.01%, 13.38%, 17.23%, 20.96%, and 23.95% respectively, for the considered volume percentages of the GnP in the liquid state. The thermal conductivity for the 0.5% volume percentage was 23.95% higher compared to that of the base fluid; whereas Selvam et al. (2016) obtained a thermal conductivity 16% higher than the base fluid at the same concentration. The superior thermal conductivity is due to the use of chemically functionalized GnP instead of dispersing surfactants in the base fluid for better stability. Whereas, in the solid state, as shown in Figure 3, the average surge in thermal conductivity compared to base fluid are 18.67%, 25.7%, 34.75%, 45.08%, and 53.05%, respectively, for the considered volume percentages of GnP.
Thermal conductivity in the solid state was higher than in the liquid state. The reason for this sudden increase in thermal conductivity when the fluid changes to a solid state is due to the orderly solid structure that causes accelerated molecular vibrations. The sudden fall in thermal conductivity when the solid state changes to liquid state might be caused by the orderly stable microstructure in the solid turning into a disorderly structure in the liquid state. Table 2 shows the tabulated comparison of thermal conductivity of the nanocomposite with respect to temperature and % volume fraction. The reason for thermal conductivity enhancement is attributed to the high aspect ratio, 2-D geometry, and stiffness of graphene.
The acid treatment of GnP plays a significant role in the enhancement of thermal conductivity in the nanocomposites. Instead of adding surfactant, nitric acid treatment was used to chemically modify the surface of GnP in order to increase the surface-active sites for electrochemical reactions and also to improve the stability. As surfactants not used, the effects of degradation in thermal conductivity while adding surfactant completely avoided in this nanocomposite.
Figure 4 shows the variation in thermal conductivity of the nanocomposite in liquid state and it is observed that the graphene nanocomposite has higher thermal conductivity when compared to the base fluid. The dispersion of GnP significantly improved the thermal conductivity of the nanocomposite. The reason behind this enhancement of thermal conductivity is the nano-size of the GnP and the two-dimensional geometry of GnP that increases the exposure to the base fluid.
By increasing the volume percentage of GnP, the thermal conductivity is found to increase. The average increase in thermal conductivity compared to base fluid are found to be 11.01%, 13.38%, 17.23%, 20.96% and 23.95% respectively for the considered volume percentage of GnP in the liquid state. The thermal conductivity for the 0.5% volume percentage is 23.95% higher compared to that of the base fluid, whereas Selvam et al. (2016) obtained a thermal conductivity 16% higher than the base fluid at the same concentration. The superior thermal conductivity is due to the use of chemically functionalized GnP instead of dispersing surfactants in the base fluid for better stability. Whereas, in the solid state as shown in Figure 4, the average surge in thermal conductivity compared to base fluid are 18.67%, 25.7%, 34.75%, 45.08% and 53.05% respectively for the considered volume percentage of GnP.
Thermal conductivity in solid state was higher than in the liquid state. The reason for this sudden increase in thermal conductivity when fluid turns to solid state is due to the orderly solid structure that causes better accelerated molecular vibrations. The sudden fall in thermal conductivity when solid state changes to liquid state might be caused by the orderly stable microstructure in solid turning into a disorderly structure in liquid state. Table 2 shows the tabulated comparison of thermal conductivity of nanocomposite with respect to temperature and % volume fraction. The background for the thermal conductivity enhancement is an attribute to the high aspect ratio, 2-D geometry and stiffness of graphene.
The acid treatment of GnP plays a significant role in the enhancement of thermal conductivity in the nanocomposites. Instead of adding surfactant, Nitric acid treatment was used to chemically modify the surface of GnP in order to increase the surface-active sites for electrochemical reactions and also to improve the stability. As surfactants are not used, the effects of degradation in thermal conductivity while adding surfactant are completely avoided in this nanocomposite.

3.2. Freezing and Melting Characteristics

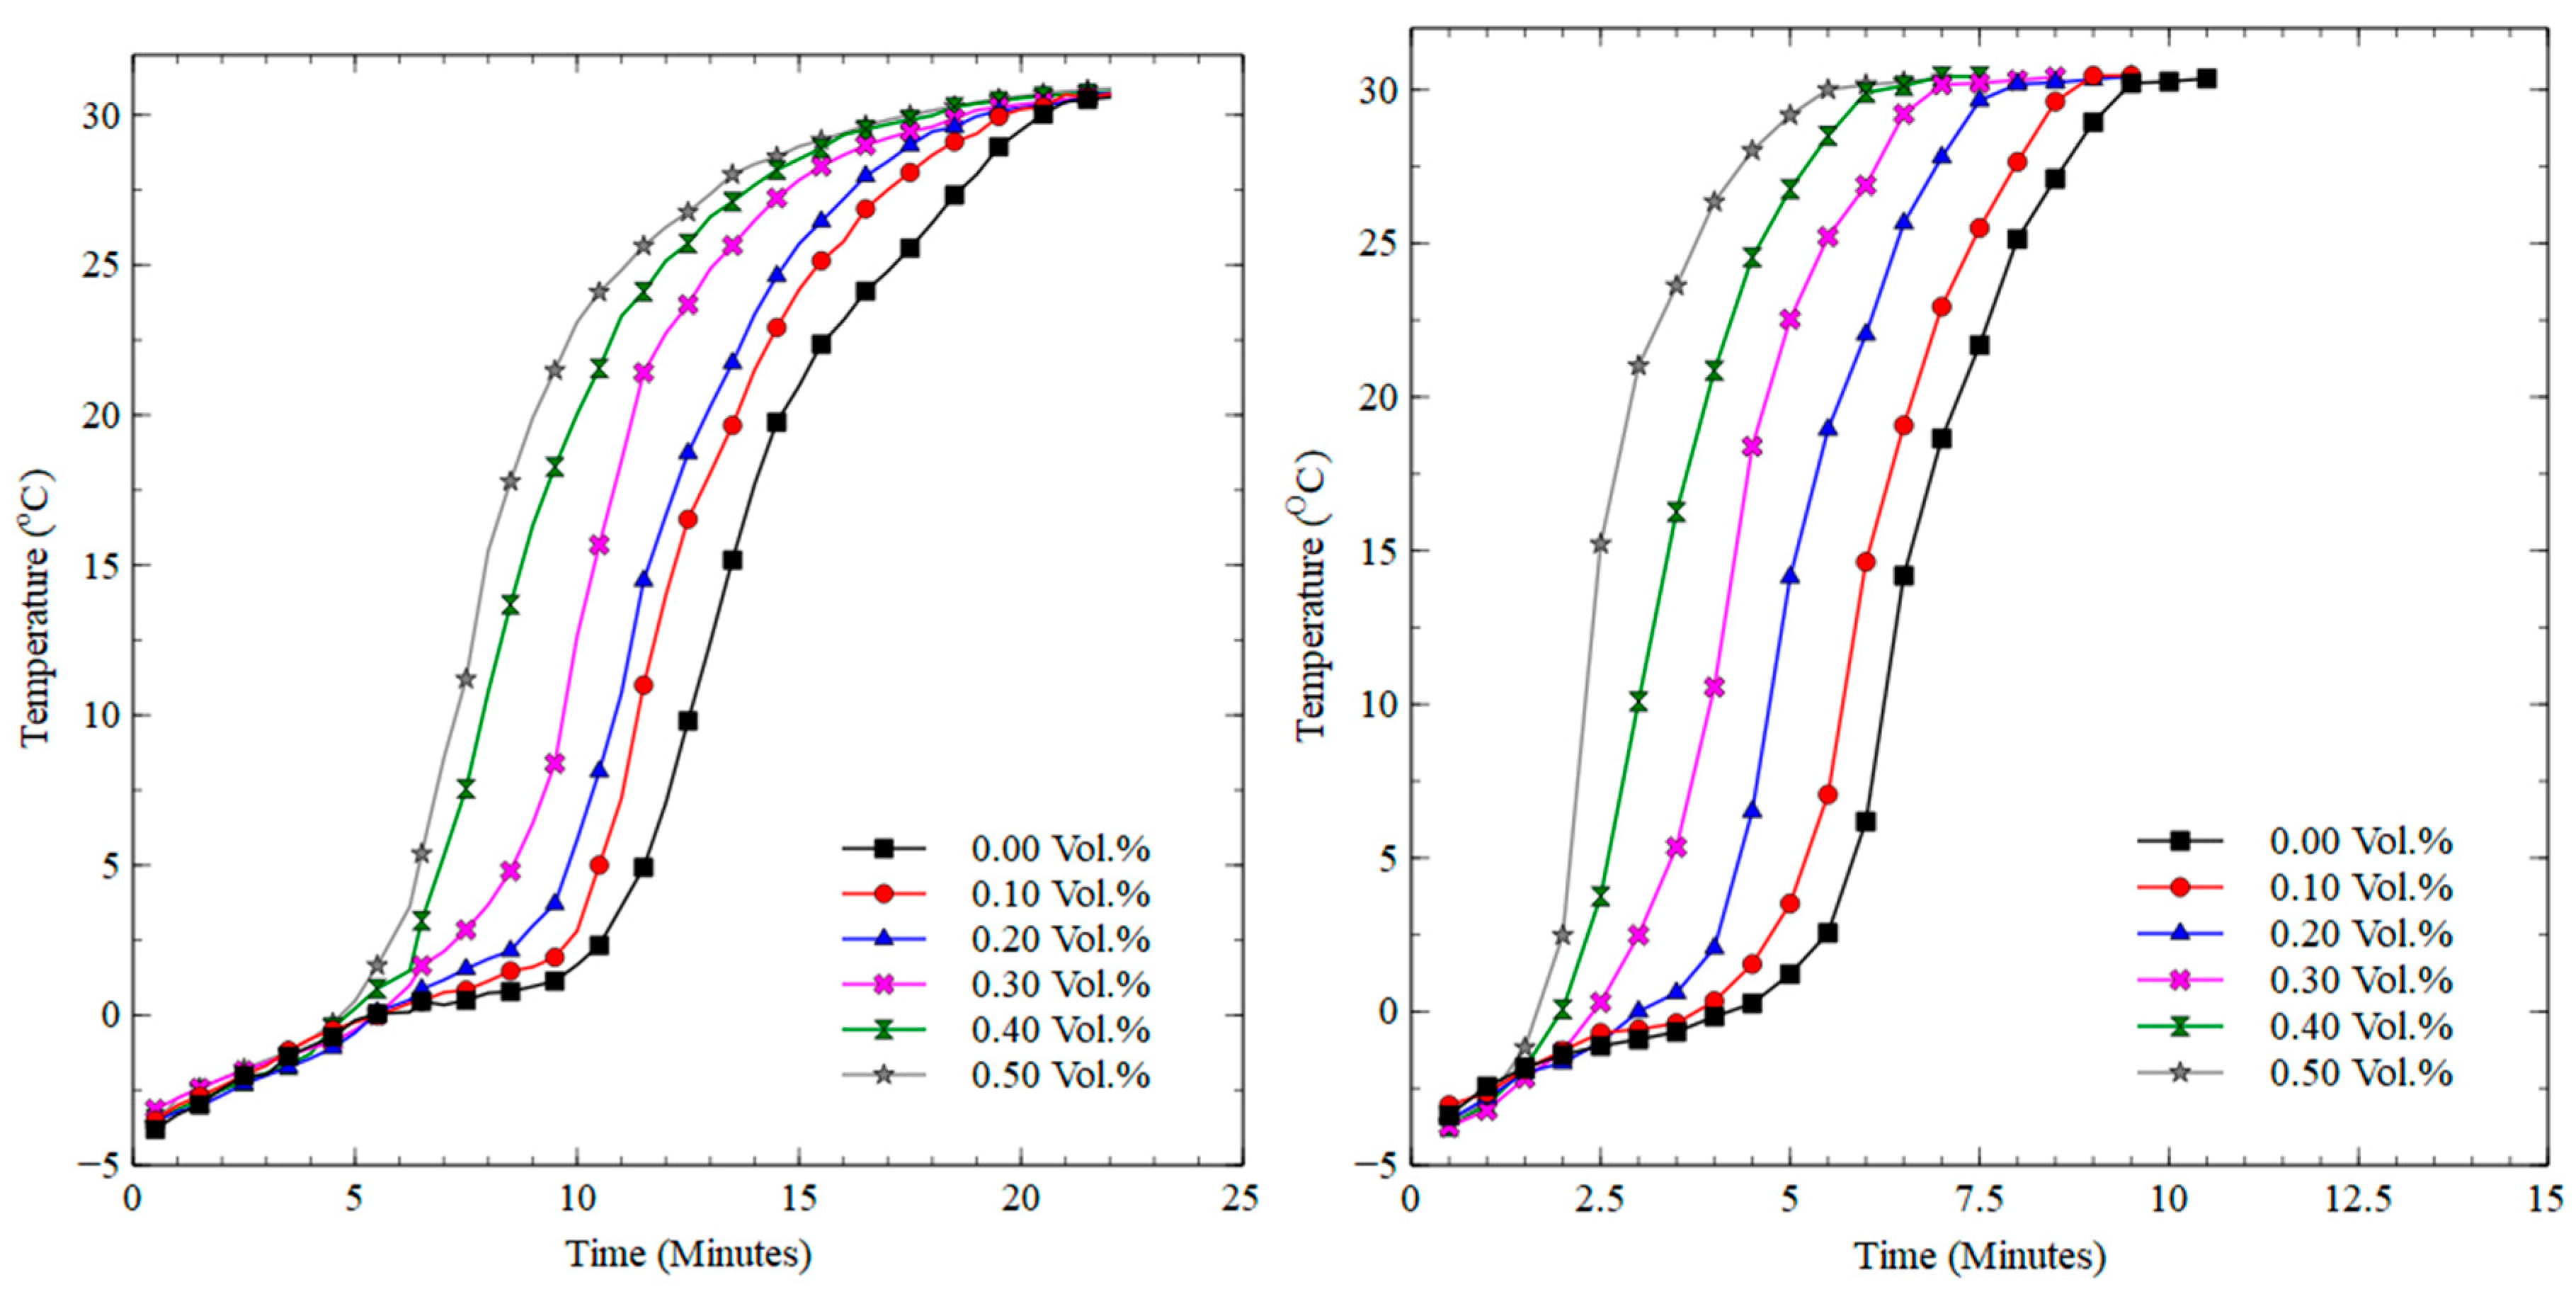
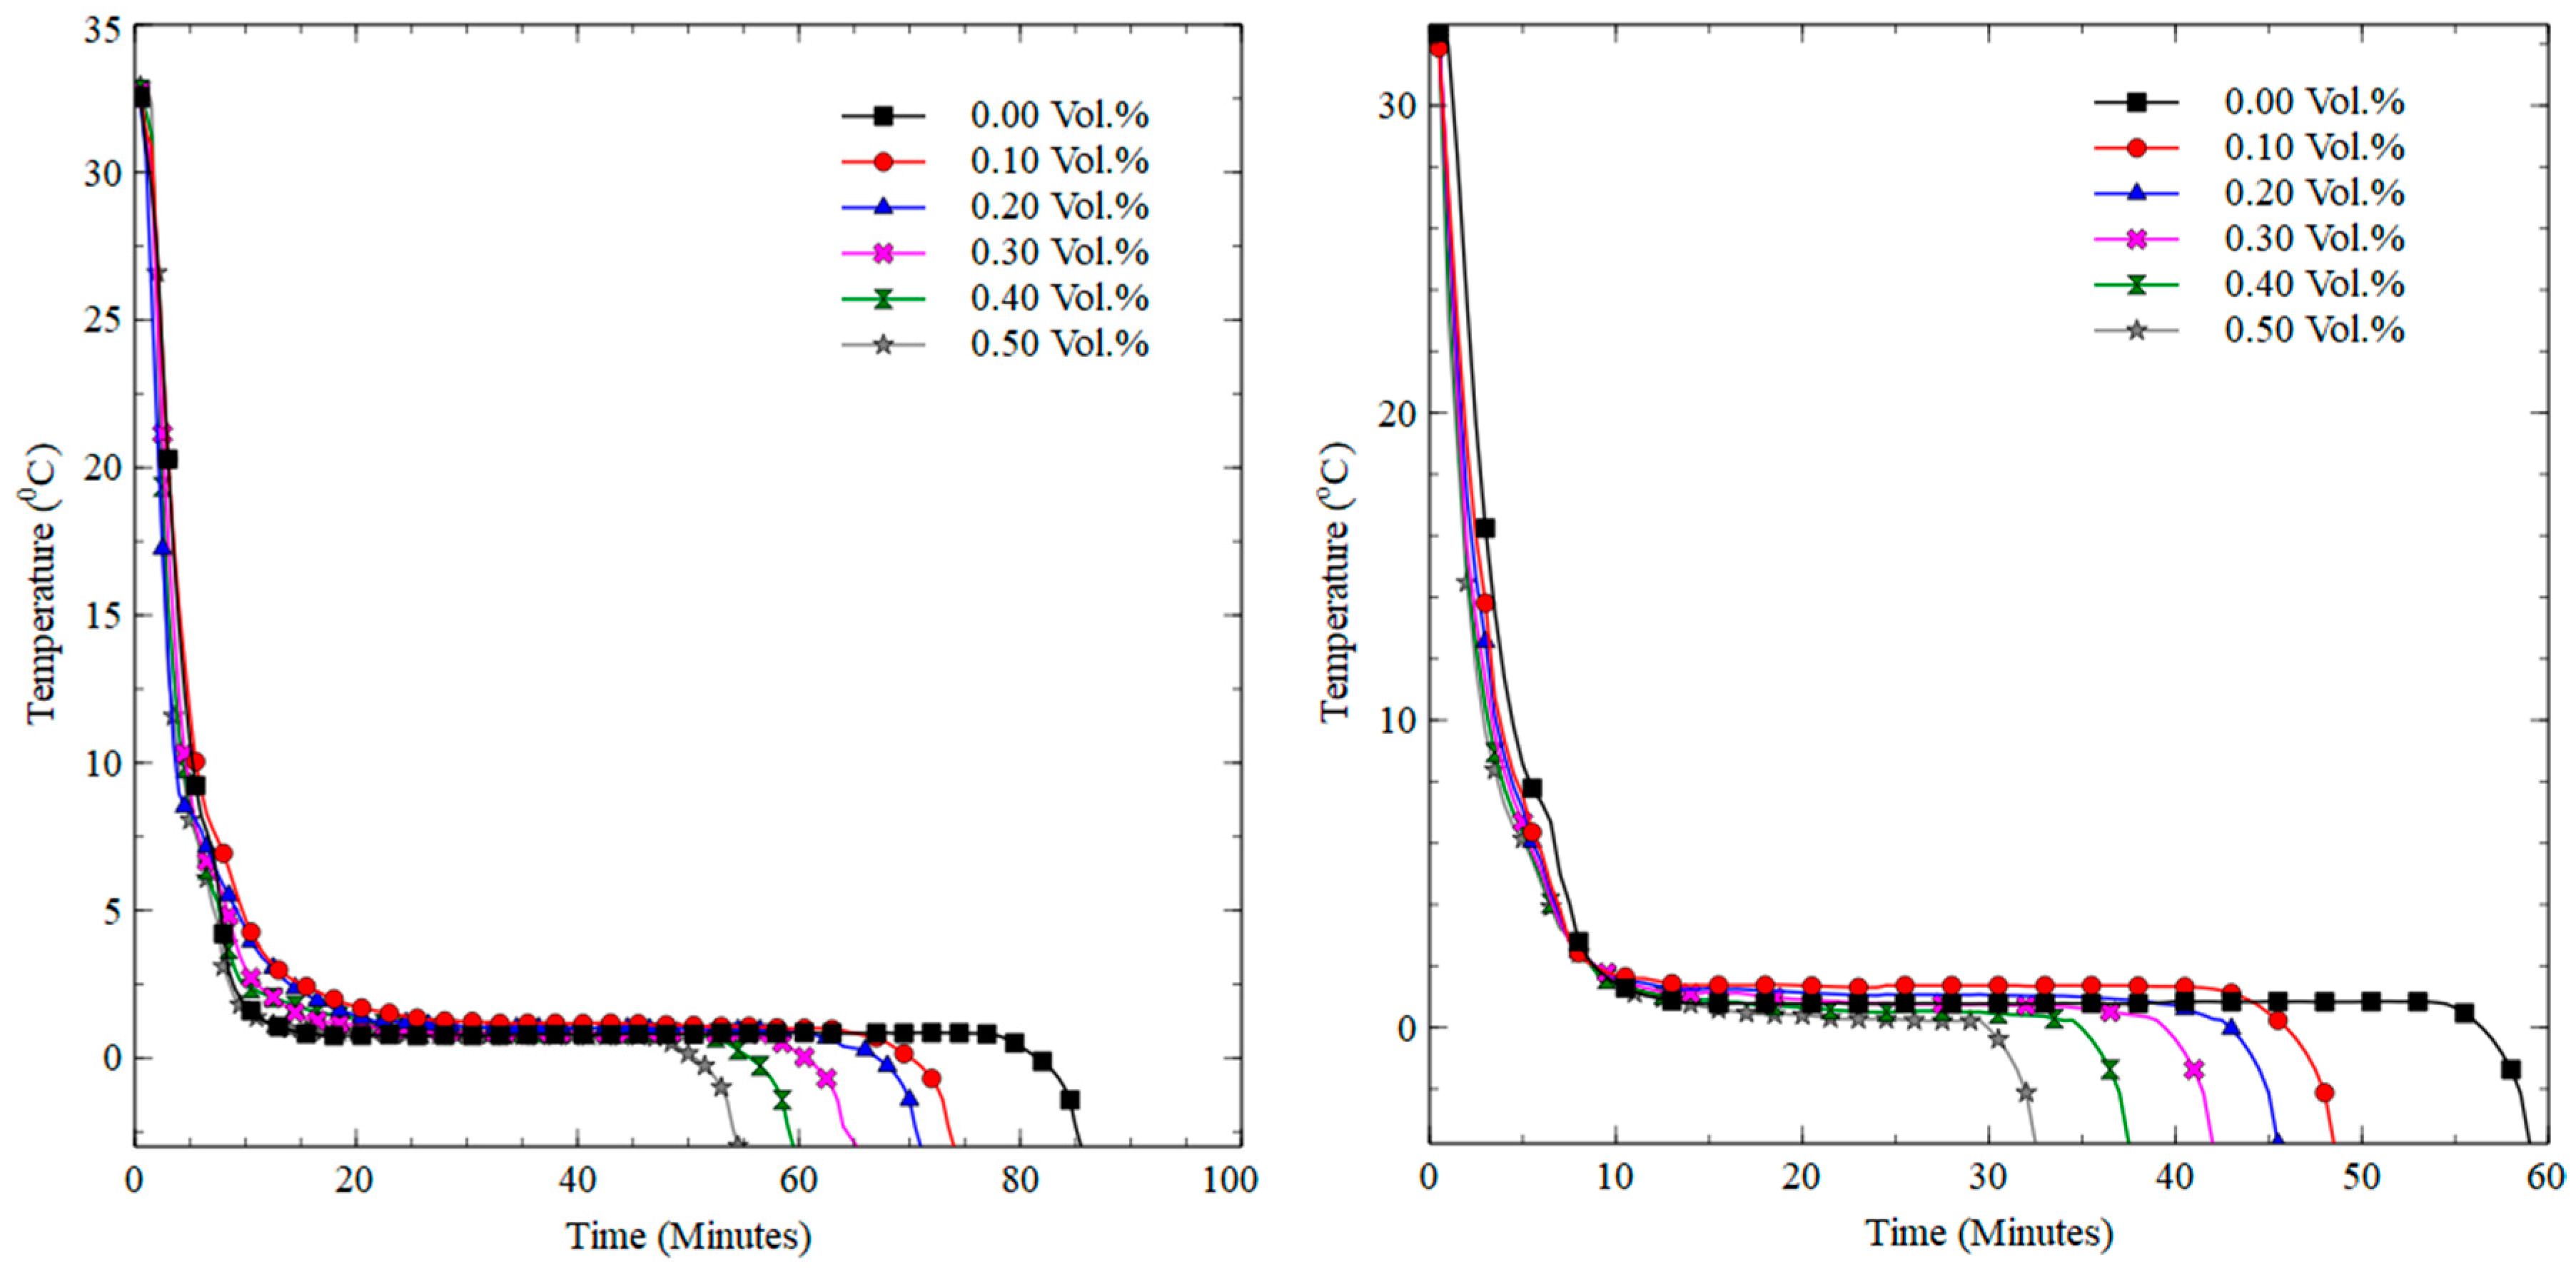
3.2.1. Freezing Process

Initially the nanocomposite, which is in the liquid phase at room temperature (32 °C), gets sensibly cooled to the freezing temperature by placing it inside the cold bath maintained at the desired temperature. After sensible cooling, the nanocomposite begins to solidify starting from the outermost surface, which is exposed to the heat-conducting surface. As a result, the outermost layer starts to solidify first. The solidification process continues until the midpoint of nanocomposite solidifies. After complete solidification, sensible cooling of the solidified sample takes place until the nanocomposite reaches −3 °C. The bath temperatures for freeing experiments were −6 °C and −10 °C.
Figure 5 shows the freezing curve at −6 °C and −10 °C for the base fluid and nanocomposites for different volume percentages of GnP from 32 °C to −3 °C. The time taken by the base fluid to solidify was 91.5 min, whereas the time taken by the 0.1%, 0.2%, 0.3%, 0.4%, and 0.5% vol. fraction nanocomposites to solidify was 77 min, 71 min, 65 min, 59 min, and 55 min, respectively. Thus, the addition of nanoparticles aided to reduce the freezing time by 15.30%, 22.40%, 28.96%, 35.52%, and 39.89% for the 0.1%, 0.2%, 0.3%, 0.4% and 0.5% vol. fractions, respectively.
Similarly, at the bath temperature of −10 °C, the time taken to solidify the base fluid was 55.5 min, whereas for the 0.1%, 0.2%, 0.3%, 0.4%, and 0.5% vol. fractions of nanocomposites, the time taken was 46 min, 43.5 min, 40 min, 36 min, and 31 min, respectively. Thus, the addition of nanoparticles reduced the freezing time by 12.25%, 15.48%, 16.12%, 25.16%, and 31.61% for the 0.1%, 0.2%, 0.3%, 0.4%, and 0.5% vol. fractions, respectively.

3.2.2. Melting Process

The solidified nanocomposite is sensibly heated up to the melting temperature when placed inside the hot bath. After sensible heating, the nanocomposite begins to melt starting from the outermost surface, which is exposed to the heat-conducting surface. Consequently, the outermost layer starts to melt first. The melting process continues until the midpoint of the nanocomposite melts completely. Then the sensible heating of the liquid sample takes place until it is in thermal equilibrium with the hot bath temperature. The melting experiment is also carried out for the base fluid as well as the nanocomposites. The bath temperatures for the melting experiments were 31 °C and 36 °C, respectively. The melting process was carried out until the nanocomposite sample reached 30 °C.
Figure 6 shows the comparison of melting curves from −3 °C to 30 °C for the base fluid and nanocomposites, kept at bath temperatures of 31 °C and 36 °C. The sensible heating process was faster compared to the latent process. The time taken by the DI water to melt completely was 6 min, whereas the time taken by the 0.1%, 0.2%, 0.3%, 0.4%, and 0.5% vol. fractions of nanocomposites was 5.5 min, 5 min, 4.5 min, 4 min, and 3.5 min, respectively. Thus, the addition of the nanoparticles reduced the melting time by 8.33%, 17.67%, 25%, 33.33%, and 41.67% for the 0.1%, 0.2%, 0.3%, 0.4%, and 0.5% vol. fractions, respectively. Similar trends were observed when the samples were melted from −3 to 30 °C when kept in a hot bath at 36 °C. Under this condition, the time taken by DI water to melt completely was 4 min, whereas for the 0.1%, 0.2%, 0.3%, 0.4%, and 0.5% vol. fractions of nanocomposites, the time taken was 3.5 min, 3 min, 2.5 min, 2 min, and 1.5 min, respectively. Thus, the addition of nanoparticles reduced the melting time by 12.5%, 25%, 37.5%, 50%, and 62.5% for the 0.1%, 0.2%, 0.3%, 0.4%, and 0.5% vol. fractions, respectively.
During melting, the solidified fluid near the walls absorbs heat and starts to melt. Conduction is the dominant mechanism in the initial time when the thickness of the liquid layer is so thin. The thickness of the liquid layer increases and buoyancy force is developed relative to time. The difference between the solid and liquid density causes the melted water to sink towards the bottom of the capsule and to consequently push the ice up. It intensifies the convection force and accelerates the melting rate. However, it can be noticed that the thermal conductivity of the liquid is lower than the solid, and therefore the heat conduction in the liquid is lower than in the solid. Thus, as the thickness of the liquid layer increases, the heat transfer conduction is reduced, and conversely the natural convection is enhanced. Therefore, melting is accelerated because of this natural convection in the liquid [33].
During freezing, the liquid near the walls rejects heat to the surrounding cold bath and starts to solidify. As time passes, the thickness of the solid layer increases. Water is denser than ice, which causes ice to float. Therefore, water gets accumulated at the bottom of the capsule. It can be seen that in the initial period of time, the solidification rate is high and conduction is the dominant mechanism of heat transfer between liquid and cold surfaces. As time progresses, a greater amount of liquid becomes solid and therefore the solid layer near the cold surfaces becomes thicker. Although the thermal conductivity of the solid is higher than the liquid, the solid layer imposes thermal resistance for heat conduction from the cold surface to the warm liquid. Thus, heat conduction decreases by increasing the thickness of the solid layer. The solidification rate reduces gradually during the process, especially near the end of process where the solid layer covers the whole of the capsule except a small region [33]. In both the freezing and melting experimentations, it was observed that the addition of nanoparticles enhanced the freezing and melting rates, and the maximum enhancement was observed with the 0.5% volume percentage of GnP.

4. Conclusions

Water-based graphene nanocomposites were chemically prepared using the covalent functionalization method and thermal conductivity was measured experimentally. The freezing and melting characteristics of the prepared nanocomposites were studied experimentally by varying the bath temperatures and volume percentages of the GnP. The results showed that the addition of GnP nanoplatelets increased the thermal conductivity of all volume fractions; a maximum enhancement of 23.95% was observed for the 0.5% volume fraction in the liquid state. Similarly, in the solid state, the maximum thermal conductivity enhancement was 53.05% for the 0.5% volume fraction. The freezing and melting time decreased for all the test conditions when the volume percentage of GnP increased.

Author Contributions

Conceptualization S.H and M.L.D.; Methodology, S.S. and S.C.; Formal analysis, S.S. and S.C. and S.H; writing—original draft preparation, S.S.; writing—review and editing, S.H., S.C. and M.L.D.; supervision M.L.D.

Funding

S.S. and M.L.D. would like to acknowledge the University Grants Commission (UGC), Government of India for providing the financial support to the first author under the Maulana Azad National Fellowship Scheme (F1-17.1/2016-17/MANF-2015-17-TAM-51497). S.H acknowledges the support of International Institute for Carbon-Neutral Energy Research (WPI-I2CNER).

Conflicts of Interest

The authors declare no conflict of interest.

References

  1. de Blas, M.; Appelbaum, J.; Torres, J.L.; García, A.; Prieto, E.; Illanes, R. A Refrigeration Facility for Milk Cooling Powered by Photovoltaic Solar Energy. Prog. Photovolt. Res. Appl. 2003, 11, 467–479. [Google Scholar] [CrossRef]
  2. Torres-Toledo, V.; Meissner, K.; Coronas, A.; Müller, J. Performance characterisation of a small milk cooling system with ice storage for PV applications. Int. J. Refrig. 2015, 60, 81–91. [Google Scholar] [CrossRef]
  3. Pedersen, P.H.; Maté, J. SolarChill Vaccine Cooler and Refrigerator: A Breakthrough Technology. Industria Informatione. Refrig. Air Cond. 2006, 300 (Suppl. 1), 17–19. [Google Scholar]
  4. Axaopoulos, P.J.; Theodoridis, M.P. Design and experimental performance of a PV Ice-maker without battery. Sol. Energy 2009, 83, 1360–1369. [Google Scholar] [CrossRef]
  5. Direct Drive Solar Coolers Per Henrik Pedersen, Ivan Katic. 2016. Available online: https://www.dti.dk/_/media/56756_SolarChill_a_solar_pv_refrigerator_without_battery.pdf (accessed on 20 December 2018).
  6. Guruprasad, A.; Lingkun, L.; Xiang, H.; Fang, G. Thermal energy storage materials and systems for solar energy applications. Renew. Sustain. Energy Rev. 2017, 68, 693–706. [Google Scholar]
  7. Sathishkumar, A.; Kathirkaman, M.D.; Ponsankar, S.; Balasuthagar, C. Experimental investigation on solidification behaviour of water base nanocomposite pcm for building cooling applications. Indian J. Sci. Technol. 2016, 9, 1–7. [Google Scholar] [CrossRef]
  8. Ahammed, N.; Lazarus, G.A.; Titus, J.; Bose, J.R.; Wongwises, S. Measurement of thermal conductivity of graphene–water nanocomposite at below and above ambient temperatures. Int. Commun. Heat Mass Transf. 2016, 70, 66–74. [Google Scholar] [CrossRef]
  9. Harikrishnan, S.; Deepak, K.; Kalaiselvam, S. Thermal energy storage behavior of composite using hybrid nanomaterials as PCM for solar heating system. J. Therm. Anal. Calorim. 2014, 115, 1563–1571. [Google Scholar] [CrossRef]
  10. Harish, S.; Daniel, O.; Yasuyuki, T.; Masamichi, K. Thermal conductivity enhancement of lauric acid phase change nanocomposite with graphene nanoplatelets. Appl. Therm. Eng. 2015, 80, 205–211. [Google Scholar] [CrossRef]
  11. Sakr, M.H.; Abdel-Aziz, R.M.; Ghorab, A.A.E. Experimental and theoretical study on freezing and melting in capsules for thermal storage. ERJ Soubra Fac. Eng 2008, 9, 48–65. [Google Scholar]
  12. Kaygusuz, K.; Sari, A. Thermal energy storage system using a technical grade paraffin wax as latent heat energy storage material. Energy Sources 2005, 27, 1535–1546. [Google Scholar] [CrossRef]
  13. Kaygusuz, K. Experimental and theoretical investigation of latent heat storage for water based solar heating systems. Energy Convers Manag. 1995, 36, 315–323. [Google Scholar] [CrossRef]
  14. Regin, A.F.; Solanki, S.C.; Saini, J.S. Latent heat thermal energy storage using cylindrical capsule: Numerical and experimental investigations. Renew. Energy 2006, 31, 2025–2041. [Google Scholar] [CrossRef]
  15. Zalba, B.; Sánchez-valverde, B.; Marín, J.M. An experimental study of thermal energy storage with phase change materials by design of experiments. J. Appl. Stat. 2005, 32, 321–332. [Google Scholar] [CrossRef]
  16. TEAP Energy Products. 2004. Available online: http://www.teappcm.com (accessed on 5 September 2018).
  17. Yoon, J.I.; Moon, C.G.; Kim, E.; Son, Y.S.; Kim, J.D.; Kato, T. Experimental study on freezing of water with supercooled region in a horizontal cylinder. Appl. Eng. 2001, 21, 657–668. [Google Scholar] [CrossRef]
  18. Kalaiselvam, S.; Veerappan, M.; Arul Aaron, A.; Iniyan, S. Experimental and analytical investigation of solidification and melting characteristics of PCMs inside cylindrical encapsulation. Int. J. Sci. 2008, 47, 858–874. [Google Scholar] [CrossRef]
  19. Novoselov, K.; Geim, A.K.; Morozov, S.V.; Jiang, D.; Zhang, Y.; Dubonos, S.V.; Grigorieva, I.V.; Firsov, A.A. Electric field effect in atomically thin carbon films. Science 2004, 306, 666–669. [Google Scholar] [CrossRef] [PubMed]
  20. Mehrali, M.; Tahan Latibari, S.; Mehrali, M.; Mahlia, T.M.I.; Metselaar, H.S.C.; Naghavi, M.S. Preparation and characterization of palmitic acid/graphene nanoplatelets composite with remarkable thermal conductivity as a novel shape-stabilized phase change material. Appl. Eng. 2013, 61, 633–640. [Google Scholar] [CrossRef]
  21. Mehrali, M.; Sadeghinezhad, E.; Latibari, S.T.; Kazi, S.N.; Mehrali, M.; Zubi, M.N.B.M.; Metselaar, H.S.C. Investigation of thermal conductivity and rheological properties of nanofluids containing graphene nanoplatelets. Nanoscale Res. Lett. 2014, 9, 15. [Google Scholar] [CrossRef] [PubMed]
  22. Liu, Y.D.; Li, X.; Hu, P.F.; Hu, G.H. Study on the supercooling degree and nucleation behavior of water-based graphene oxide nanofluids PCM. Int. J. Refrig. 2015, 50, 80–86. [Google Scholar] [CrossRef]
  23. Liu, J.; Ye, Z.C.; Zhang, L.; Fang, X.M.; Zhang, Z.G. A combined numerical and experimental study on graphene/ionic liquid nanofluid based direct absorption solar collector. Sol. Energy Mater. Sol. Cells 2015, 136, 177–186. [Google Scholar] [CrossRef]
  24. Hadadian, M.; Goharshadi, E.K.; Youssefi, A. Electrical conductivity, thermal conductivity, and rheological properties of graphene oxide-based nanofluids. J. Nanopart. Res. 2014, 16, 2788. [Google Scholar] [CrossRef]
  25. Sudeep, P.M.; Taha-Tijerina, J.; Ajayan, P.M.; Narayananc, T.N.; Anantharaman, M.R. Nanofluids based on fluorinated graphene oxide for efficient thermal management. RSC Adv. 2014, 4, 24887. [Google Scholar] [CrossRef]
  26. Mehrali, M.; Deghinezhad, E.S.; Latibari, S.T.; Mehrali, M.; Togun, H.; Zubir, M.N.M.; Kazi, S.N.; Metselaar, H.S.C. Preparation, characterization, viscosity, and thermal conductivity of nitrogen doped graphene aqueous nanofluids. J. Mater. Sci. 2014, 49, 7156–7171. [Google Scholar] [CrossRef]
  27. Liu, J.; Wang, F.X.; Zhang, L.; Fang, X.M.; Zhang, Z.G. Thermodynamic properties and thermal stability of ionic liquid-based nanofluids containing graphene as advanced heat transfer fluids for medium-to-high-temperature applications. Renew Energy 2014, 63, 519–523. [Google Scholar] [CrossRef]
  28. Selvam, C.; Mohan Lal, D.; Harish, S. Thermal conductivity enhancement of ethylene glycol and water with grapheme nanoplatelets. Thermochim. Acta 2016, 642, 32–38. [Google Scholar] [CrossRef]
  29. Park, S.; Ruoff, R.S. Chemical methods for the production of graphenes. Nat. Nanotechnol. 2009, 4, 217–224. [Google Scholar] [CrossRef] [PubMed]
  30. Harr, L.; Gallagher, J.S.; Kell, G.S. NBS/NRC Steam Tables; Hemisphere Publishing Corporation: Washington, WA, USA, 1984. [Google Scholar]
  31. Marsh, K.N. Recommended Reference Materials for the Realization of Physicochemical Propertie; Blackwell Scientific Publications: Oxford, UK, 1987. [Google Scholar]
  32. Sengers, J.V.; Watson, J.T.R. Improved international formulations for the viscosity and thermal conductivity of water substance. J. Phys. 1986, 15, 1291. [Google Scholar] [CrossRef]
  33. Rabinataj, A.D.; Hassanzadeh, H.A.; Khaki, M.; Abbasi, M. Unconstrained melting and solidification inside rectangular enclosure. J. Fundam. Appl. Sci. 2015, 7, 436–451. [Google Scholar] [CrossRef]
Figure 1. (a) SEM visualization of GnP; (b) TEM visualization of GnP.
Applsci 09 01099 g001
Figure 2. Zeta potential distribution of the nanocomposite at 0.5 vol. %.
Applsci 09 01099 g002
Figure 3. Experimental setup for the freezing/melting study.
Applsci 09 01099 g003
Figure 4. Variation of thermal conductivity with respect to temperature for different volume percentages.
Applsci 09 01099 g004
Figure 5. Freezing curves at from 32 °C to −3 °C with a bath temperature of −6 °C and −10 °C.
Applsci 09 01099 g005
Figure 6. Melting curves from −3 °C to 30 °C with a bath temperature at 31 °C and 36 °C.
Applsci 09 01099 g006
Table 1. Freezing and melting test matrix.
Volume Percentage of Functionalised GnPInitial Temperature of the SampleBath Temperatures for FreezingSample Temperature after FreezingBath Temperature for MeltingSample Temperature after Melting
0%, 0.1%, 0.2%, 0.3%, 0.4% & 0.5%32 °C−6 °C & −10 °C−3 °C31 °C & 36 °C30 °C
Table 2. Thermal conductivity of nanocomposite with respect to temperature and vol.%.
Temp (°C)DI Water Standard K (W/mK)DI Water Measured K (W/mK)Nanocomposite (0.1%)Nanocomposite (0.2%)Nanocomposite (0.3%)Nanocomposite (0.4%)Nanocomposite (0.5%)
K (W/mK)Percentage Increase (%)K (W/mK)Percentage Increase (%)K (W/mK)Percentage Increase (%)K (W/mK)Percentage Increase (%)K (W/mK)Percentage Increase (%)
−102.302.3172.77119.592.93026.463.15636.213.37145.513.56553.87
−52.252.272.69418.672.85125.593.05534.583.29245.023.47953.24
02.222.2332.6317.772.79225.052.98033.463.23244.733.39552.04
50.570.5760.64411.800.65613.870.67917.80.70021.530.71724.42
100.580.5890.65611.370.66913.570.69217.520.71521.340.73124.19
150.5890.5960.66211.070.67413.030.69817.10.72020.830.73823.85
200.5980.6040.66910.760.68212.950.70616.810.72920.710.74823.79
250.6070.6090.67611.000.69013.330.71317.050.73620.850.75523.94
300.6150.6160.68210.710.69713.20.72016.890.74420.70.76223.78
350.6230.6230.69010.750.70613.30.72916.950.75020.450.77023.54
400.630.6350.69910.070.72013.450.74417.150.76620.620.78423.46

