Research and Development of Automatic Monitoring System for Livestock Farms

Department of Mechanical Engineering, National Pingtung University of Science and Technology, Pingtung County 91201, Taiwan
*
Author to whom correspondence should be addressed.
Appl. Sci. 2019, 9(6), 1132; https://doi.org/10.3390/app9061132
Submission received: 31 January 2019
/
Revised: 11 March 2019
/
Accepted: 11 March 2019
/
Published: 18 March 2019
(This article belongs to the Special Issue Selected Papers from TIKI-ICICE 2018)
Abstract
:In this study we have developed an automatic monitoring system based on wireless communication networks in both dairy and pig farms to replace traditional manual data collection of the environmental conditions and manual controls of fans and water control valves in livestock farms to solve the man-power shortage problem for livestock farming. Firstly, sensors for detecting temperature, humidity, illumination, wind speed and the control circuit and communication system were installed. The monitoring programs were subsequently designed to transmit the data back to the user interface display of the office through RFU-400 wireless communication modules, and the data collected from the farm environment have been stored in a database for data analysis. Finally, the fans and water spray valves have been automatically activated duly to improve the temperature and humidity of the livestock farms. We analyzed the data collected from the sensors with regard to the lactation yields for dairy cows, and suggested optimized environmental parameters for dairy cows to increase their appetite and lactation yield, or increase the feed conversion rate of the pigs. We expect the process and results of this study can result in helpful reference to livestock farming, and help to achieve the best economic benefits in raising cattle, pigs and so forth.
1. Introduction
Nowadays since the birth rate of Taiwan keeps on declining and the population aging rate keeps on increasing, the labor force is gradually shrinking consequently. The working population has been coming down year by year from its peak in 2015, and it is estimated that in 2065 it will shrink to around 50.38% of what in 2018 [1]. Issues of lack of labor population have been found in traditional industries, especially in agriculture and livestock farming which require large amounts of labors. As young adults no longer intend to stay in the rural areas that make the work force shortage issues even more serious, and that results in challenges for the development of agriculture and livestock farming in Taiwan. In order to sustain these industries, automation and smart agriculture are surely the key solutions for resolution.
Wireless communication exhibits the features of “hassle-free” and “high mobility”. Therefore, wiring pre-configuration and installation are not required and construction time and cost can be saved. It is also a maintenance-effective system that shows less problems from rat and insect bites, and the network architecture can be quickly re-configured without rewiring. The development of wireless communication technology contributes to the applications in a range of fields such as everyday life, agriculture [2,3,4], livestock farming, traditional industries, vehicle [5], transportation [6], medical care [7], and military defense. It makes hard things easy and thus reduce time consumption and improve the operational efficiency. The wireless communication technologies are prospectively applied on various industrial fields with explosive marketing potentials.
The IEEE 802 standards specify the rules of data access control, comprising data transmission and data retrieving across network. The most commonly used wireless communication technologies include Bluetooth, ANT, wireless mobile communication, infrared, ultra-wide band, wireless broadband, Wi-Fi, WiMax (Worldwide Interoperability for Microwave Access) broadband technology, ZigBee and LPWAN (Low-Power Wide-Area Network) LoRa, Sigfox and NB-IoT technologies. Each communication technology has its own characteristics and areas suitable for its application.
Traditional detecting approaches for the environmental conditions of livestock farms require manual management to take the sampling records from the livestock farms and control the switches such as fans and water spray valves by general timers or time-consuming manual controls. However, such traditional practices may result in problems as seasonal and weather changes happen. Moreover, manual controls will take extra man-hours. With the growth and development of industrial automation and wireless communication technology, applications of the automatic monitoring and control on the livestock farming and agriculture have become much more comprehensive and versatile. We may refer to the articles [8,9,10,11] for the environmental monitoring platform designs of wireless sensing networks (WSNs). Concerning Smart Agricultural System, Akyildiz et al. [12] have established a complete wireless system with multimedia-sensing network. Su et al. [13] have used LabVIEW graphical program to construct a plant monitoring system which can instantly track the environmental changes around crops. Chen et al. have combined programmable logic controller (PLC) and Internet of Things to establish a multi-platform cloud environment control system [14], so that people could access and monitor the environmental data through mobile phones. Chang et al. [15] have designed an agricultural-purpose wireless sensing network system to detect environmental parameters of the farms.
Wireless transmission technology has also been widely used in livestock farming. Wang et al. [16] have applied Radio Frequency Identification (RFID) technology on the research of the production and management of dairy farms to improve the management efficiency of dairy cows. Edwards Murphy et al. [17] have used network technology of wireless sensing to monitor the hives and collect information of their surroundings. Asikainen et al. have also used wireless sensing for animal tracking and animal behavior analysis [18,19]. Llario et al. [20] have used a network of wireless nodes technology to monitor the vital signs of the sheep and goats. Parra et al. [21] have proposed a set of WSN sensors for monitoring the water quality and fish behavior in aquaculture tanks during the feeding process. Loreti et al. [22] have described a WSN node designed to monitor the habit of pink iguanas at the Galápagos Islands. Qi et al. [23] have also developed a WSN based traceability system for recirculation aquaculture and so forth.
Livestock farms are often located in sparsely populated remote areas. Due to the environmental considerations such as high cost, difficulty in erecting power lines, or signal attenuation caused by long lines, it’s not possible to widely apply wired remote data transmission. Therefore, this study has applied radio frequency (RF) technology for remote wireless data transmission and remote control for monitoring the environment parameters of livestock farms. The signal transmitters emit electromagnetic waves through the antennas, and the signal receiver side can receive the messages through the receivers and demodulation process.
This study firstly set up sensors for readings such as temperature, humidity, wind speed and illuminance in the dairy barns, and combined with programmable logic controllers (PLC), analog-to-digital converter modules and human-machine interfaces (HMI) to collect environmental data of dairy farms. Through RFU-400CR wireless communication transmitting device produced by ICP DAS CO., LTD. (Hsinshu, Taiwan), the collected environmental data were dumped into to a remote office’s database and instantly playback on the human-machine interface or displays. Finally, the heat stress and apparent temperature of the dairy cows were analyzed based on the temperature–humidity index [24], wind speed and illuminance according to the data from the database to investigate the influence of environmental factors on the lactation yield and physiological status of dairy cows and accurately grasp the optimized environmental parameters to provide the most comfortable environments for dairy cows. By controlling the system to the optimized environmental condition, the milk production of dairy cows and the appetite were both improved, thereby improving the quality of the animal products. The process and results in this research are expected to contribute to the livestock industries.
2. Overview of the System Architecture
In this paper we have applied wireless transmission technology to establish a comprehensive livestock environment monitoring system. The system development comprises of three parts: experimental environment, experimental hardware architecture, and experimental software and communication transmission architecture. The detailed description is as follows:
2.1. Experimental Environment
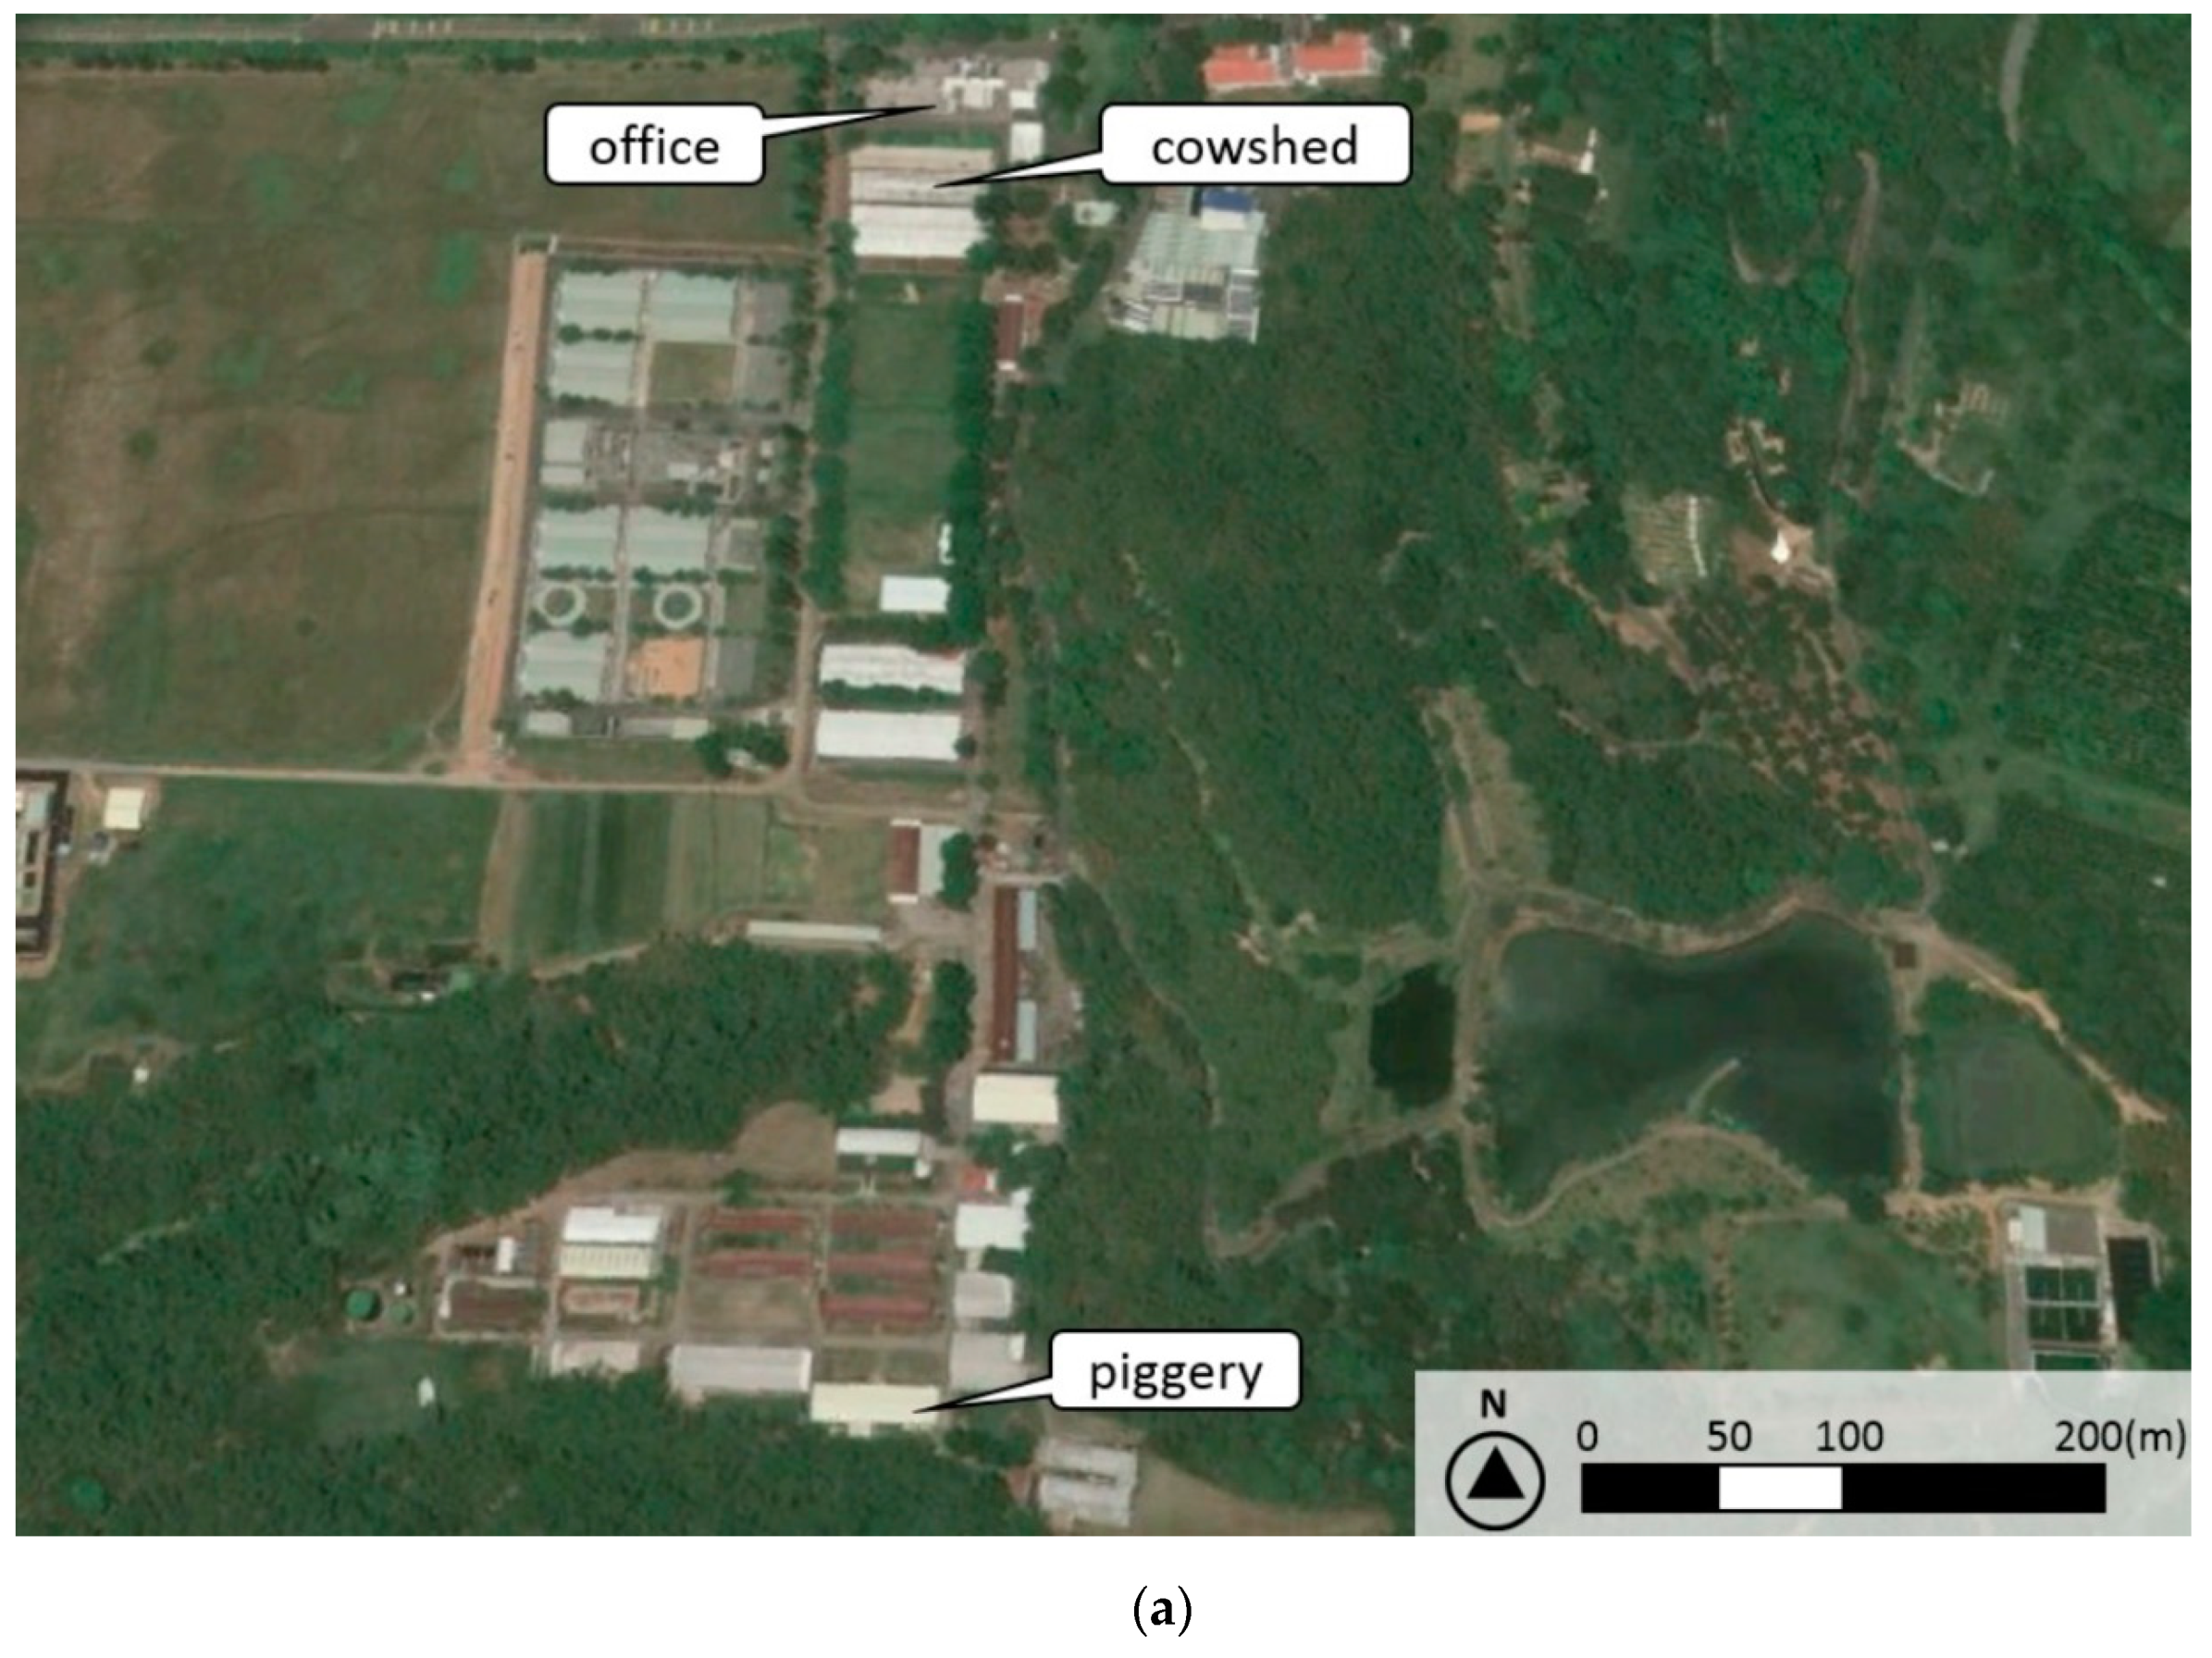
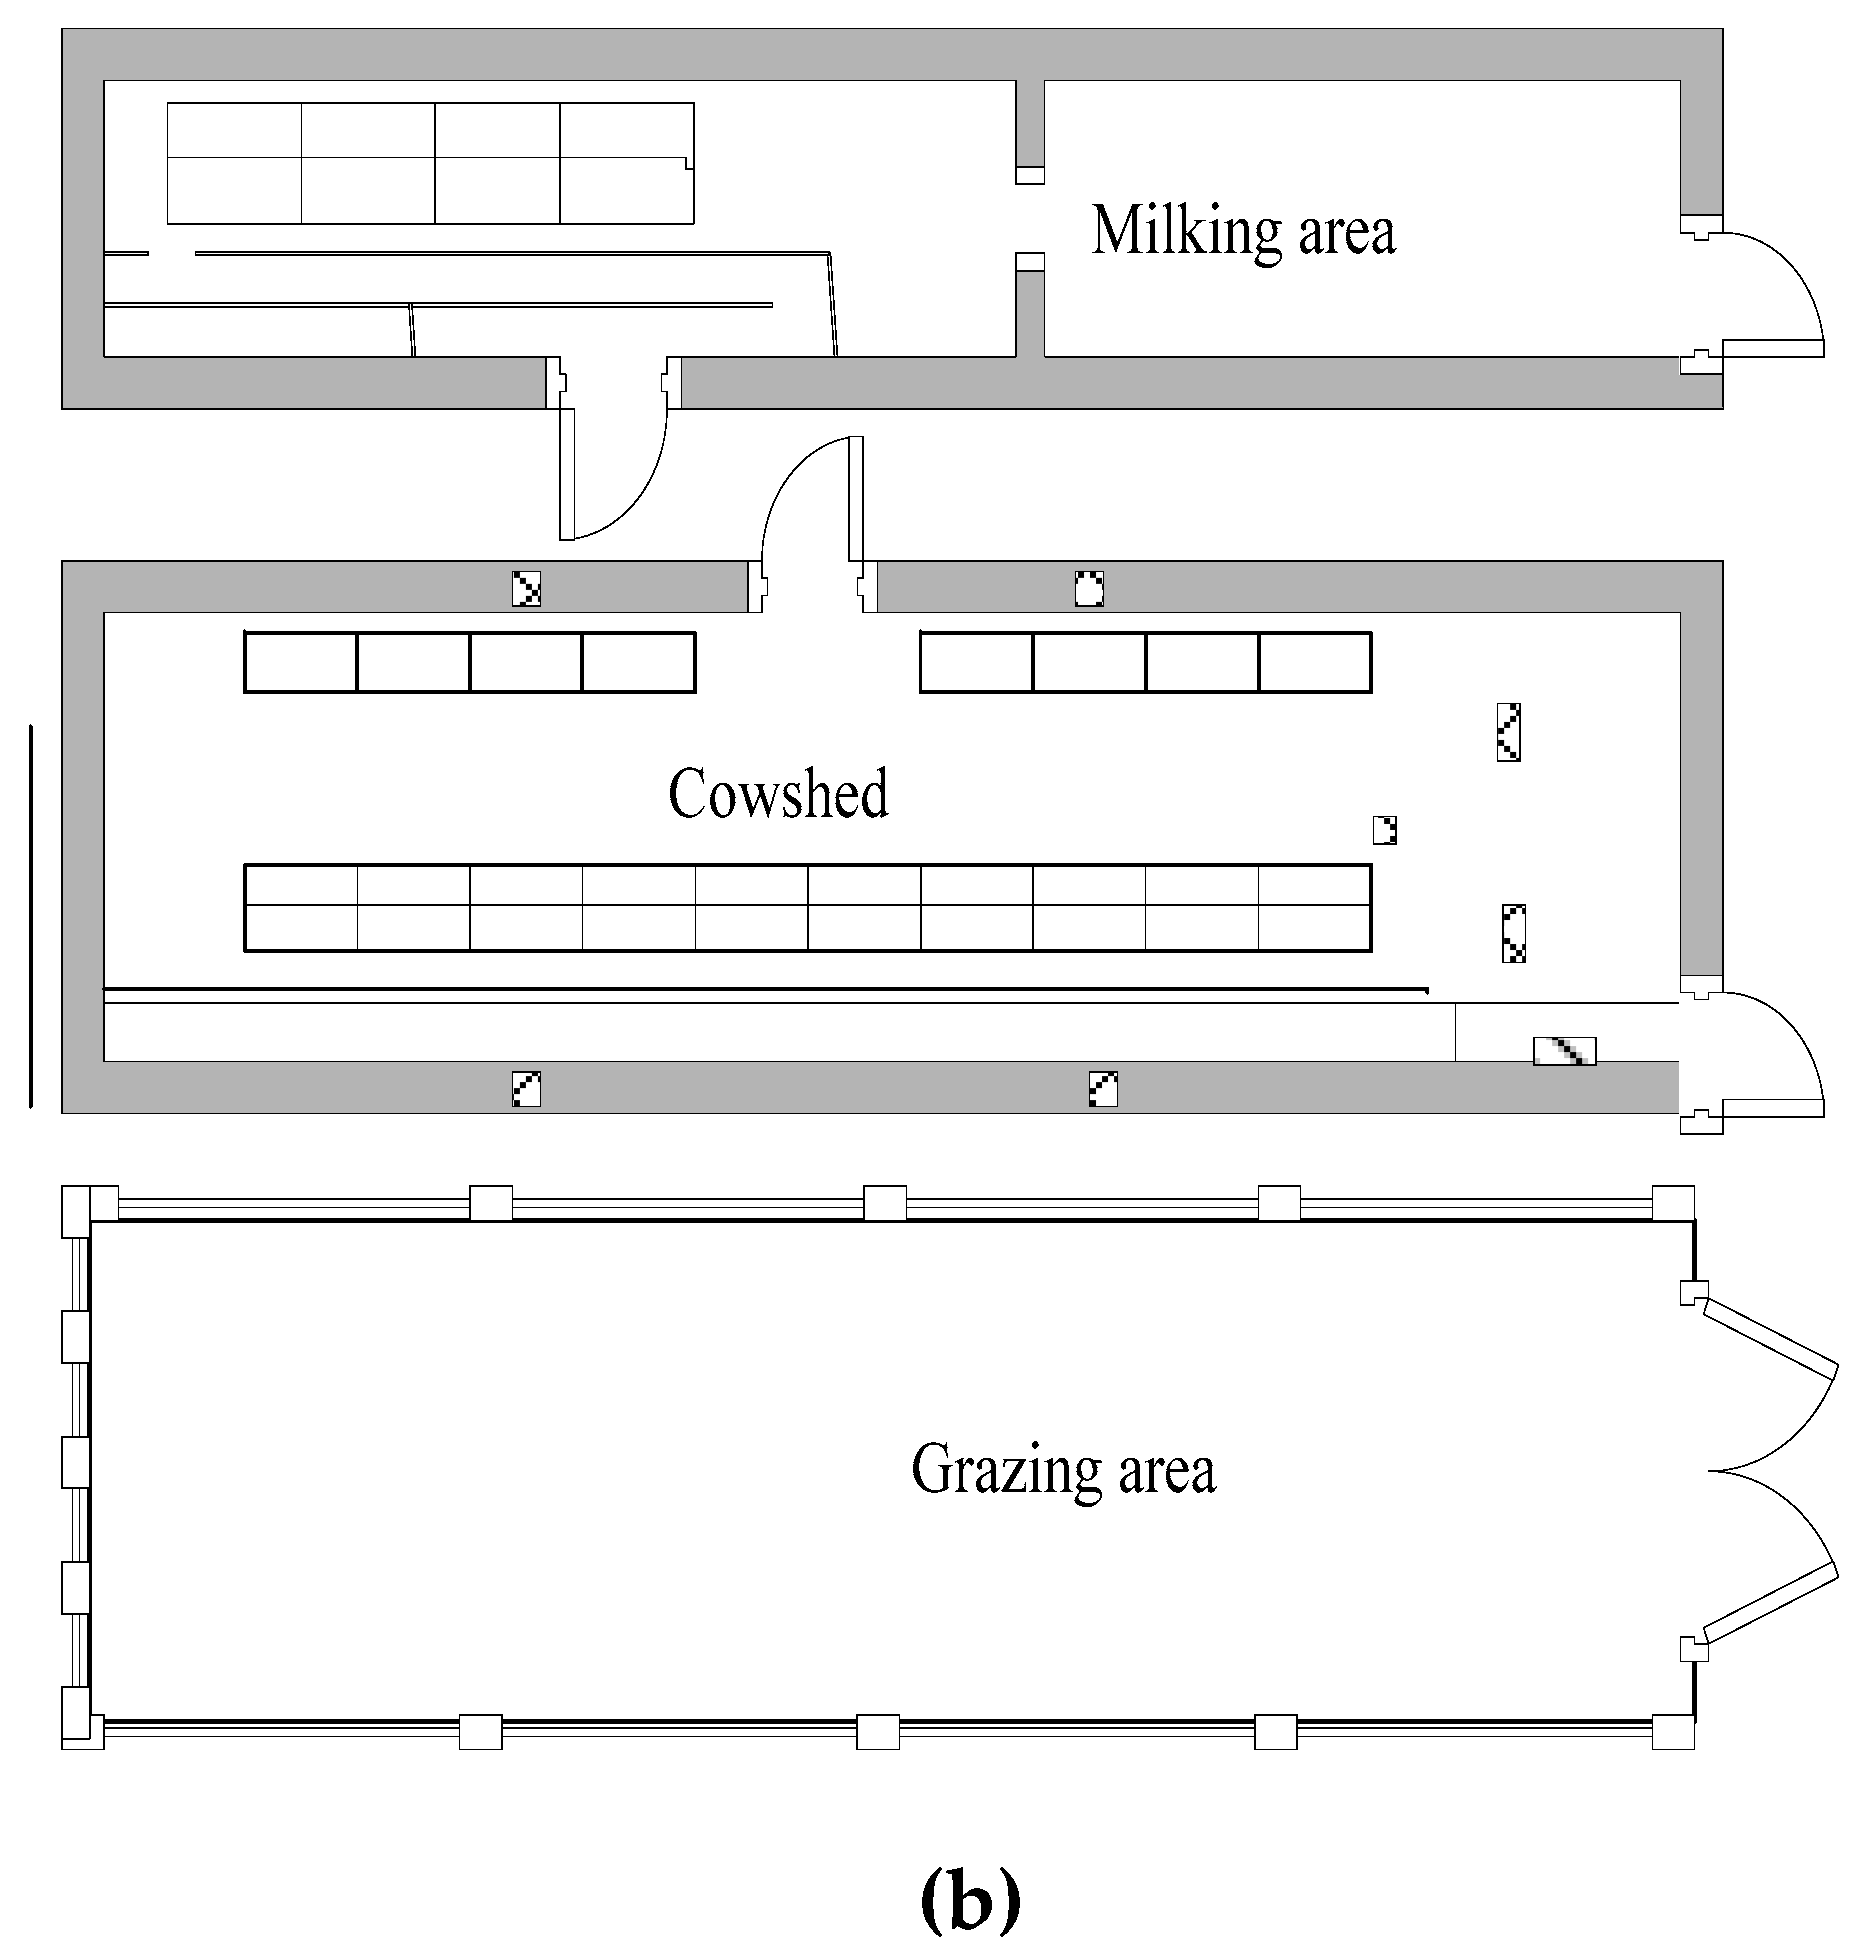
The experimental site of this study was in the livestock farm of the National Pingtung University of Science and Technology, which was located in the foothills of the mountains and the aerial photo is shown in Figure 1a. It was in the remote and open area of the school without wired network, and the Wi-Fi signal was very weak, especially no signal could be received at pig farm. The deployment layout of the dairy farm was shown in Figure 1b. The dairy barn was designed as a semi-open space. There were 28 cattle beds, 14 sets of 220 V single phase fans, automatic scraper systems, feeding areas, and roof sprinkler. On the left side of the dairy farm was the milking house and on the right side was the grazing area. The linear distance between the office from the power distribution box of dairy barn was about 80 m and the distance from the power distribution box of pig barn was about 800 m.
2.2. Experimental Hardware Architecture
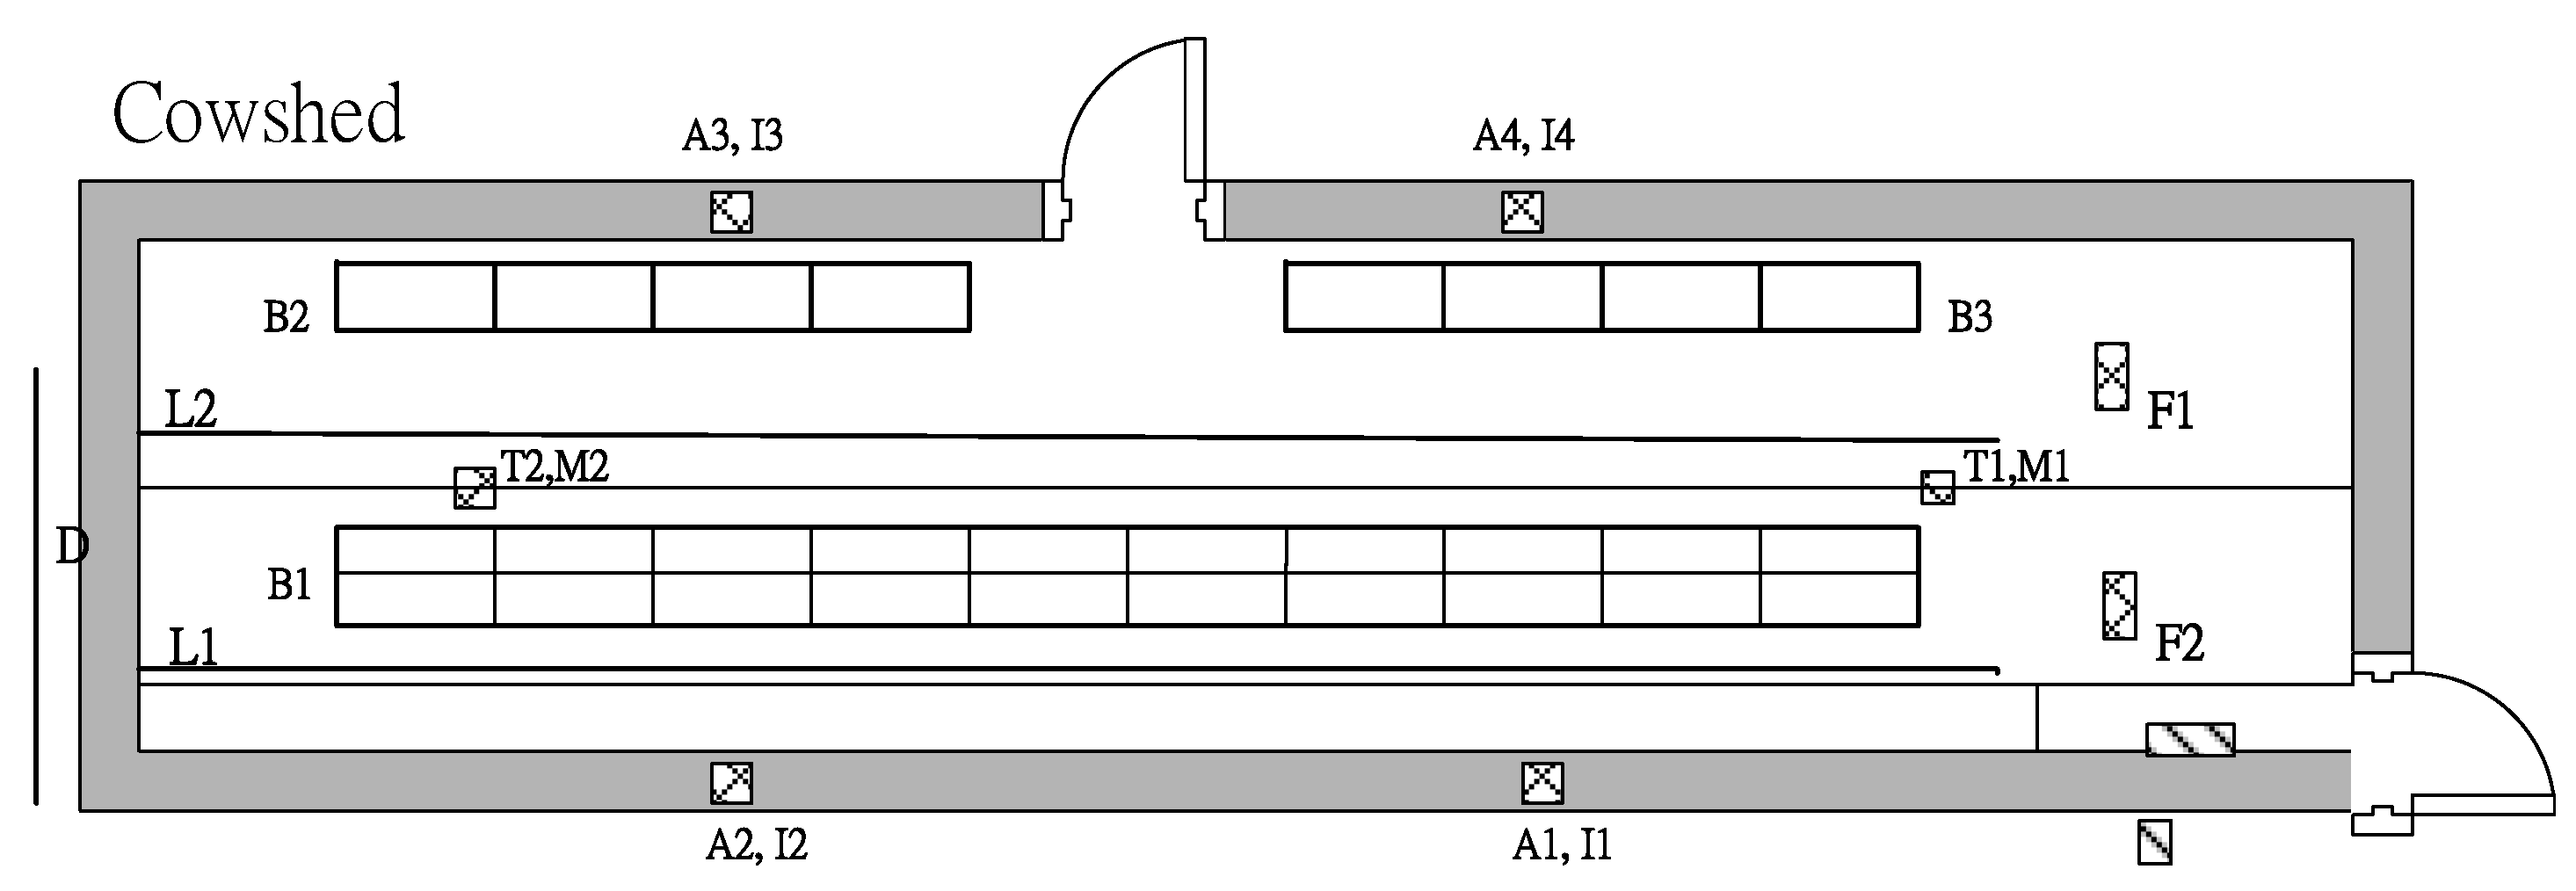
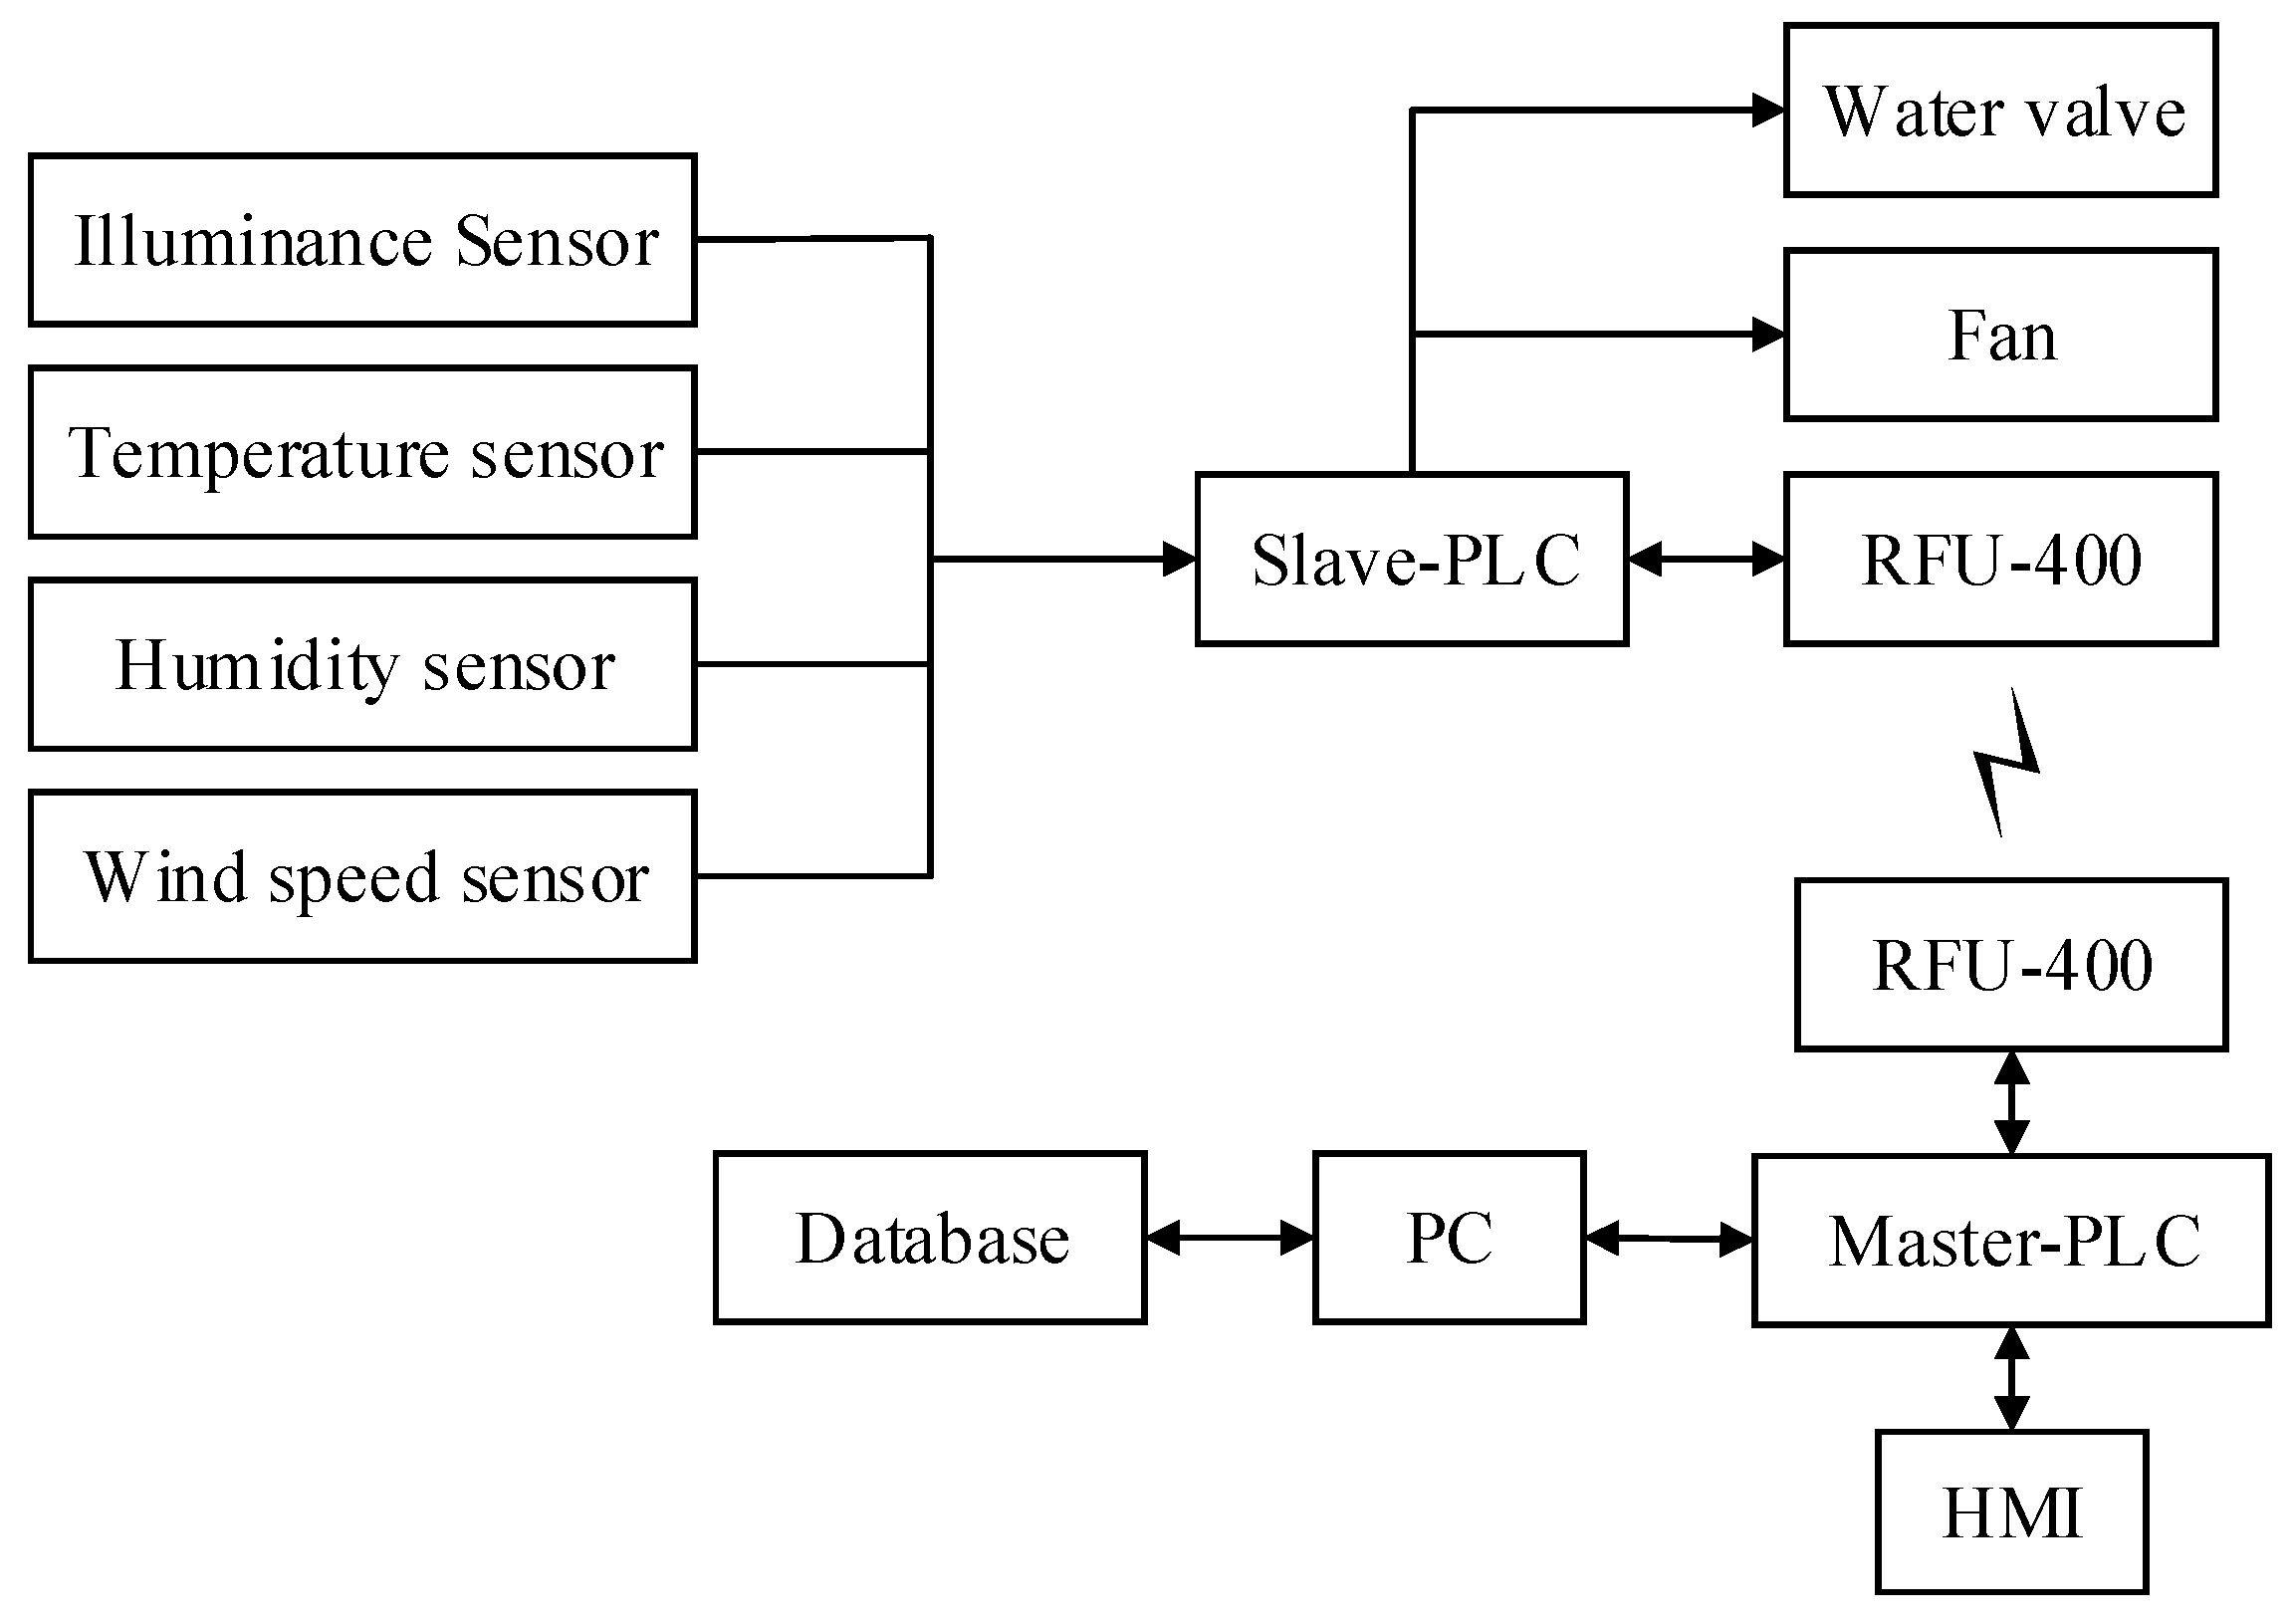
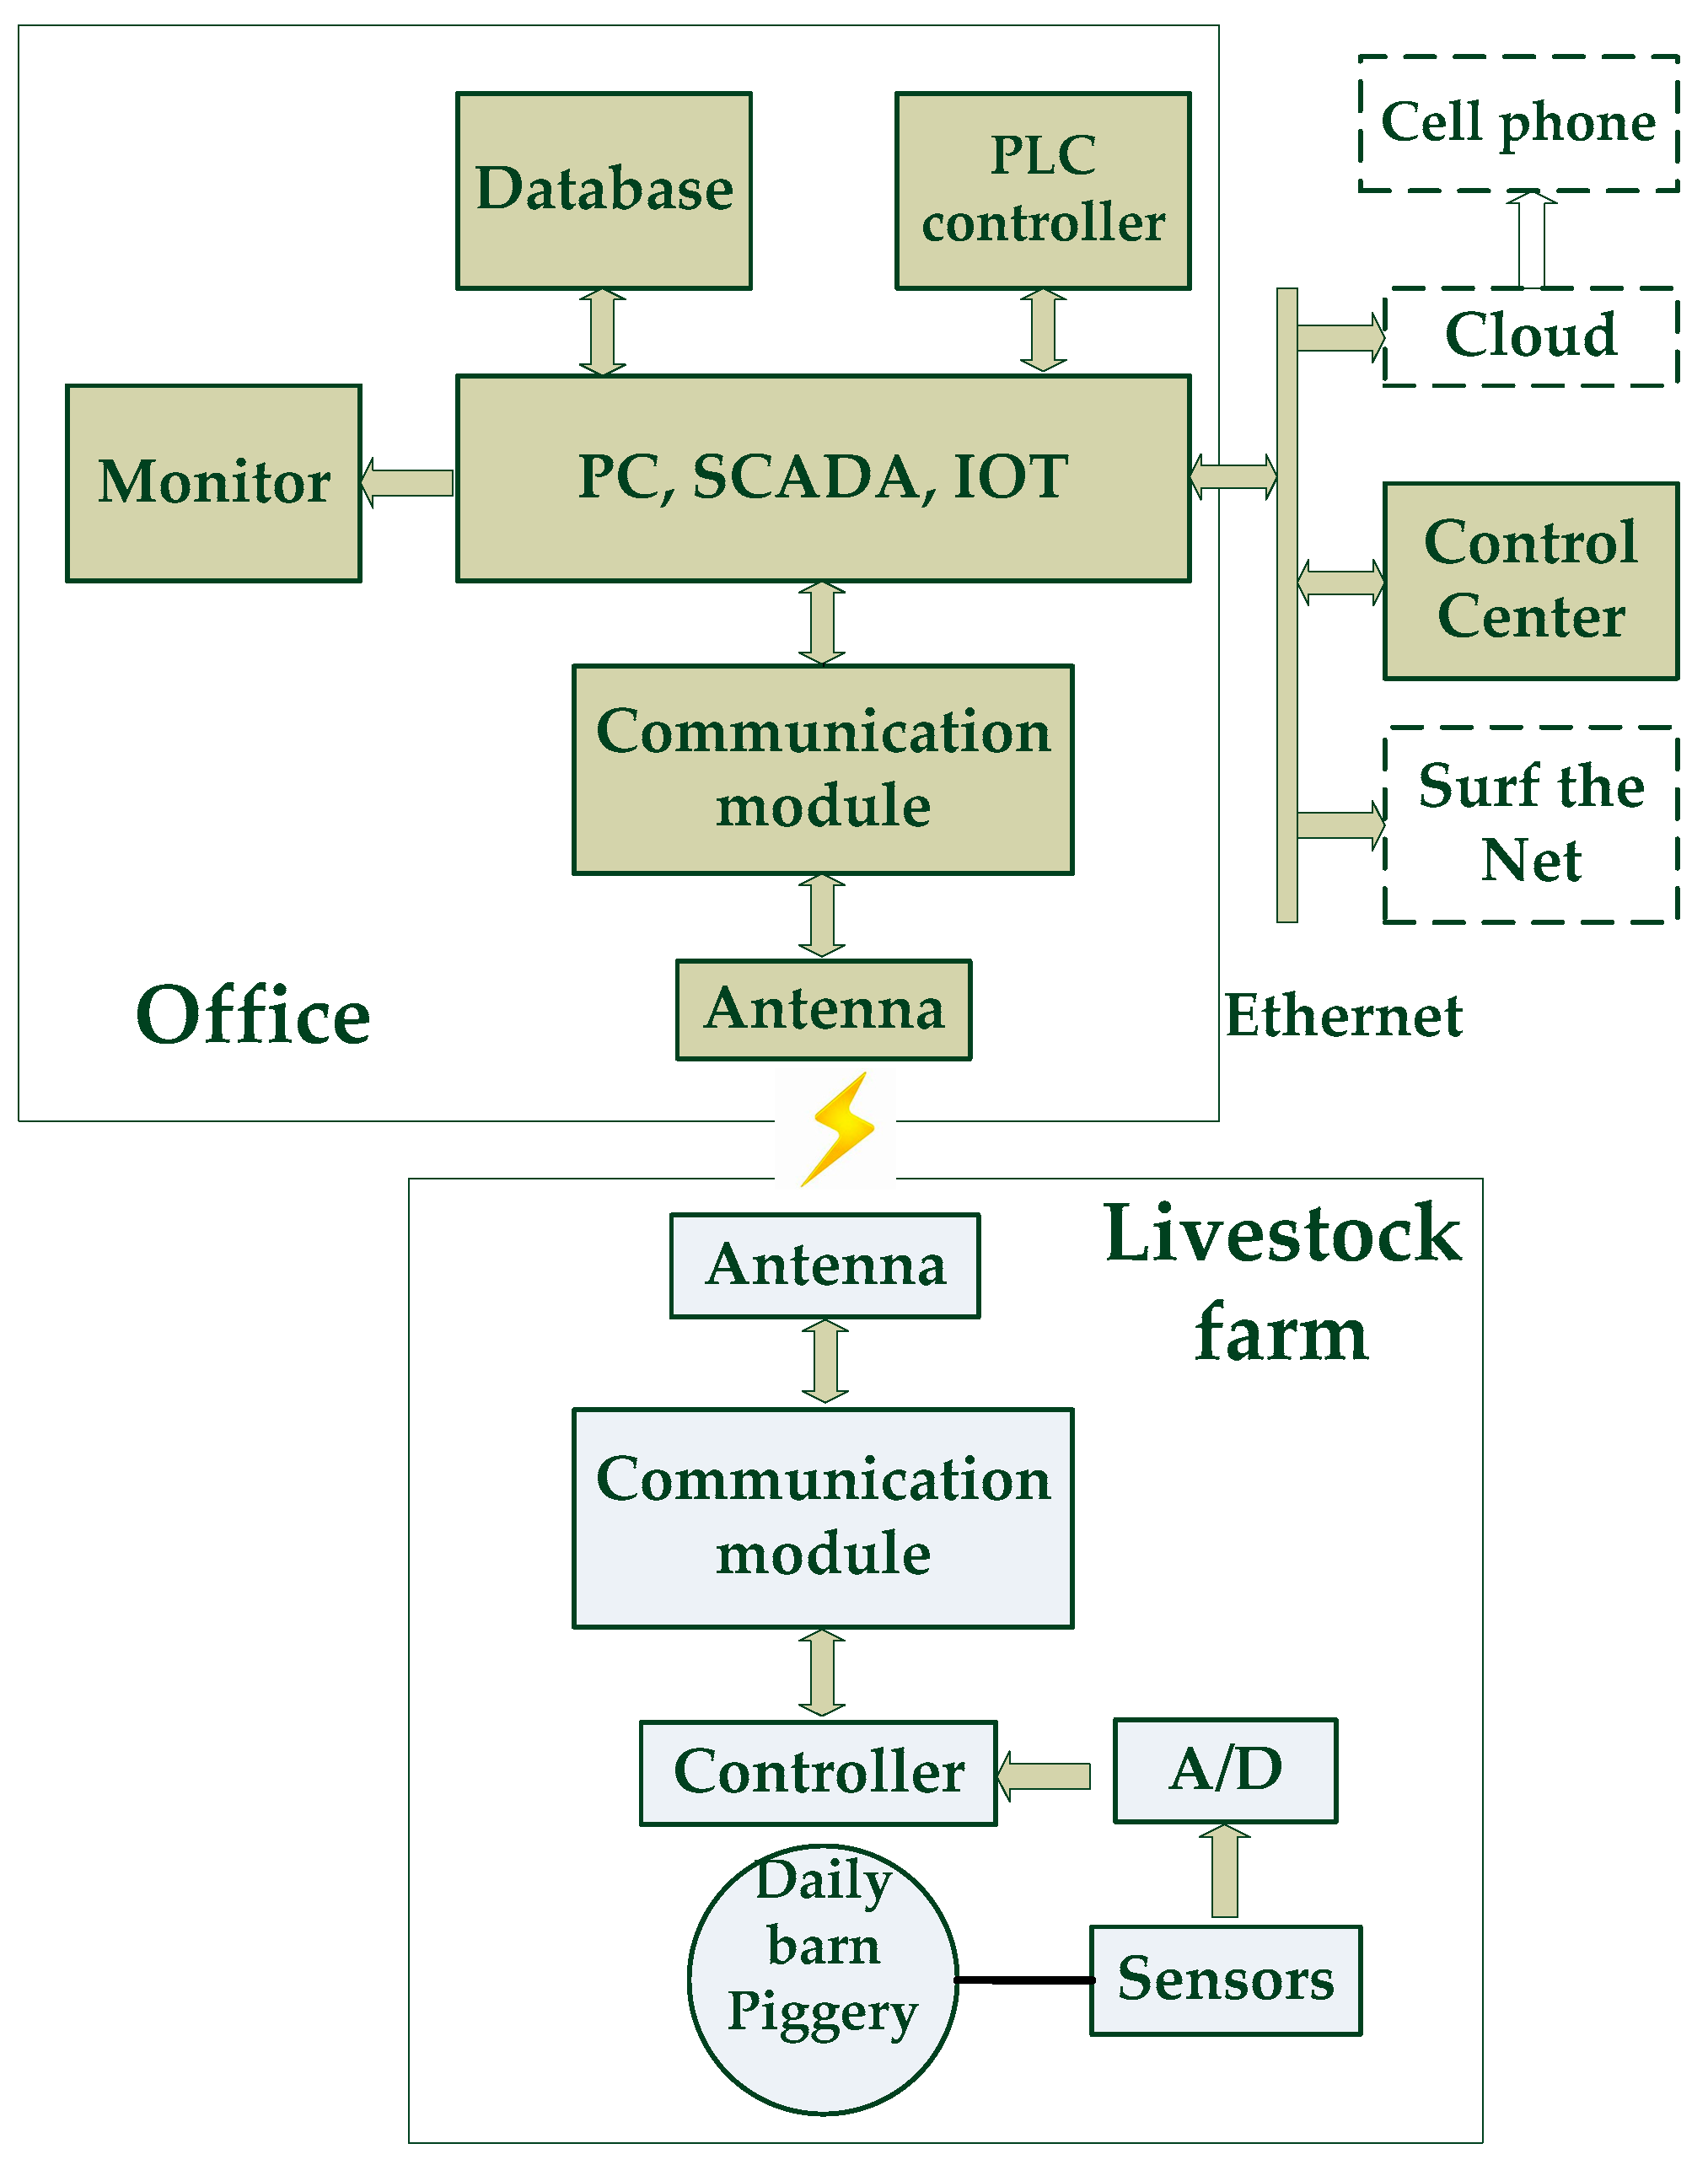
The hardware architecture in this study is shown as follows: personal computers, programmable logic controller, “left-hand side” communication modules, human machine touch screen interface, radio frequency communication module, etc. were installed in the office. A detailed list of hardware manufacturers and product name is shown in Table 1. On the other hand, there were 4 sets of temperature and humidity sensors, 4 sets of luminance sensors, 4 sets of wind speed sensors, programmable logic controller, “left-hand side” communication modules, radio frequency communication module, power distribution box, fans, water control valves, etc. installed in the dairy barn of the livestock farm. The installation layout of dairy barn is shown in Figure 2, and a detailed list of hardware manufacturers and product name is shown in Table 2. The design of hardware architecture in the pig farm was roughly the same as that in the dairy farm. The differences on the hardware architecture between pig and dairy barns were the sensor types. The sensors were configured into temperature, humidity, carbon dioxide, and ammonia sensors according to the environmental monitoring requirements. Besides, a water curtain system was also installed in the pig barn. The overall flow chart of experimental hardware architecture is shown in Figure 3.
2.3. Experimental Software Architecture
In this research, the Mitsubishi GX developer software was used for editing PLC control program. Furthermore, the schematic design for the human-machine interface was carried out by Shihlin Electric’s EU Editor2 software for the purpose of instantly controlling or monitoring the environmental status of temperature and humidity. The wireless communication has adopted the Modbus serial communication protocol for connecting monitoring computers and Remote Terminal Unit (RTU) from the Supervisory Control And Data Acquisition (SCADA) system. As to the database for historical recording, the MX Sheet application software developed by Mitsubishi Corporation has been used, which can directly export the data to Microsoft Excel from PLC, so that the variations in the collected environmental data can be analyzed from Excel. The software architecture diagram is shown in Figure 4.
3. Research Process
The experimental sites of this study were located in the dairy barn and pig barn of the National Pingtung University of Science and Technology. The system architectures set up at the dairy barn and pig barn were roughly the same. The differences on the system architecture between pig and dairy barns were the sensor types which were configured according to the environmental monitoring requirements.
In order to make livestock administrators to instantly monitor and control the environmental conditions of the farms, the “Automatic Monitoring System for Livestock Farms” were constructed into a serial of four-stage work items. Firstly, the conceptual planning of system architecture for livestock farm was designed, and hardware devices were installed, as shown in Figure 5. Next, the sensors and communication transmitting devices were installed in the barns, and then the intelligent monitoring software was implemented to capture, analyze, compare and revise the environmental data of the livestock farm. Furthermore, we compared and analyzed the data that have been corrected normally to the lactation yields for dairy cows, and suggested optimized environmental parameters for livestock farms. The process is summarized in the following three major work items:
3.1. Planning and Implementation of the Hardware for the Automatic Monitoring System of Livestock Farms
In the past, traditional practices utilized manual controls for dairy and pig barns to adjust the environmental parameters by using conventional timers to configure fixed time settings daily for controlling the switches of the water valves or water curtains, and manually activated or deactivated the fuseless switches for the fans to lower down the temperature in the dairy and pig barns. As the temperature was manually measured and recorded without setting up the devices for detecting wind speed, illuminance, carbon dioxide and so forth, there was no complete and instant information for the environmental status in the livestock farms. Due to financial and wire-erecting considerations and the environmental parameters needed in this study, the corresponding sensor types and wireless technology for data transmission have been adapted after the discussions with the livestock administrators. The design and installation of hardware devices are shown in Figure 5. For the sake of staff and vehicle access requirements, we reconfigured new power distribution boxes to replace the old ones, one was at the backside of the dairy barn, and the other was outside the pig barn. As to the water valves, water curtains, and fans, we used existing devices.
3.2. Installation of Environmental Sensors and Communication Equipment
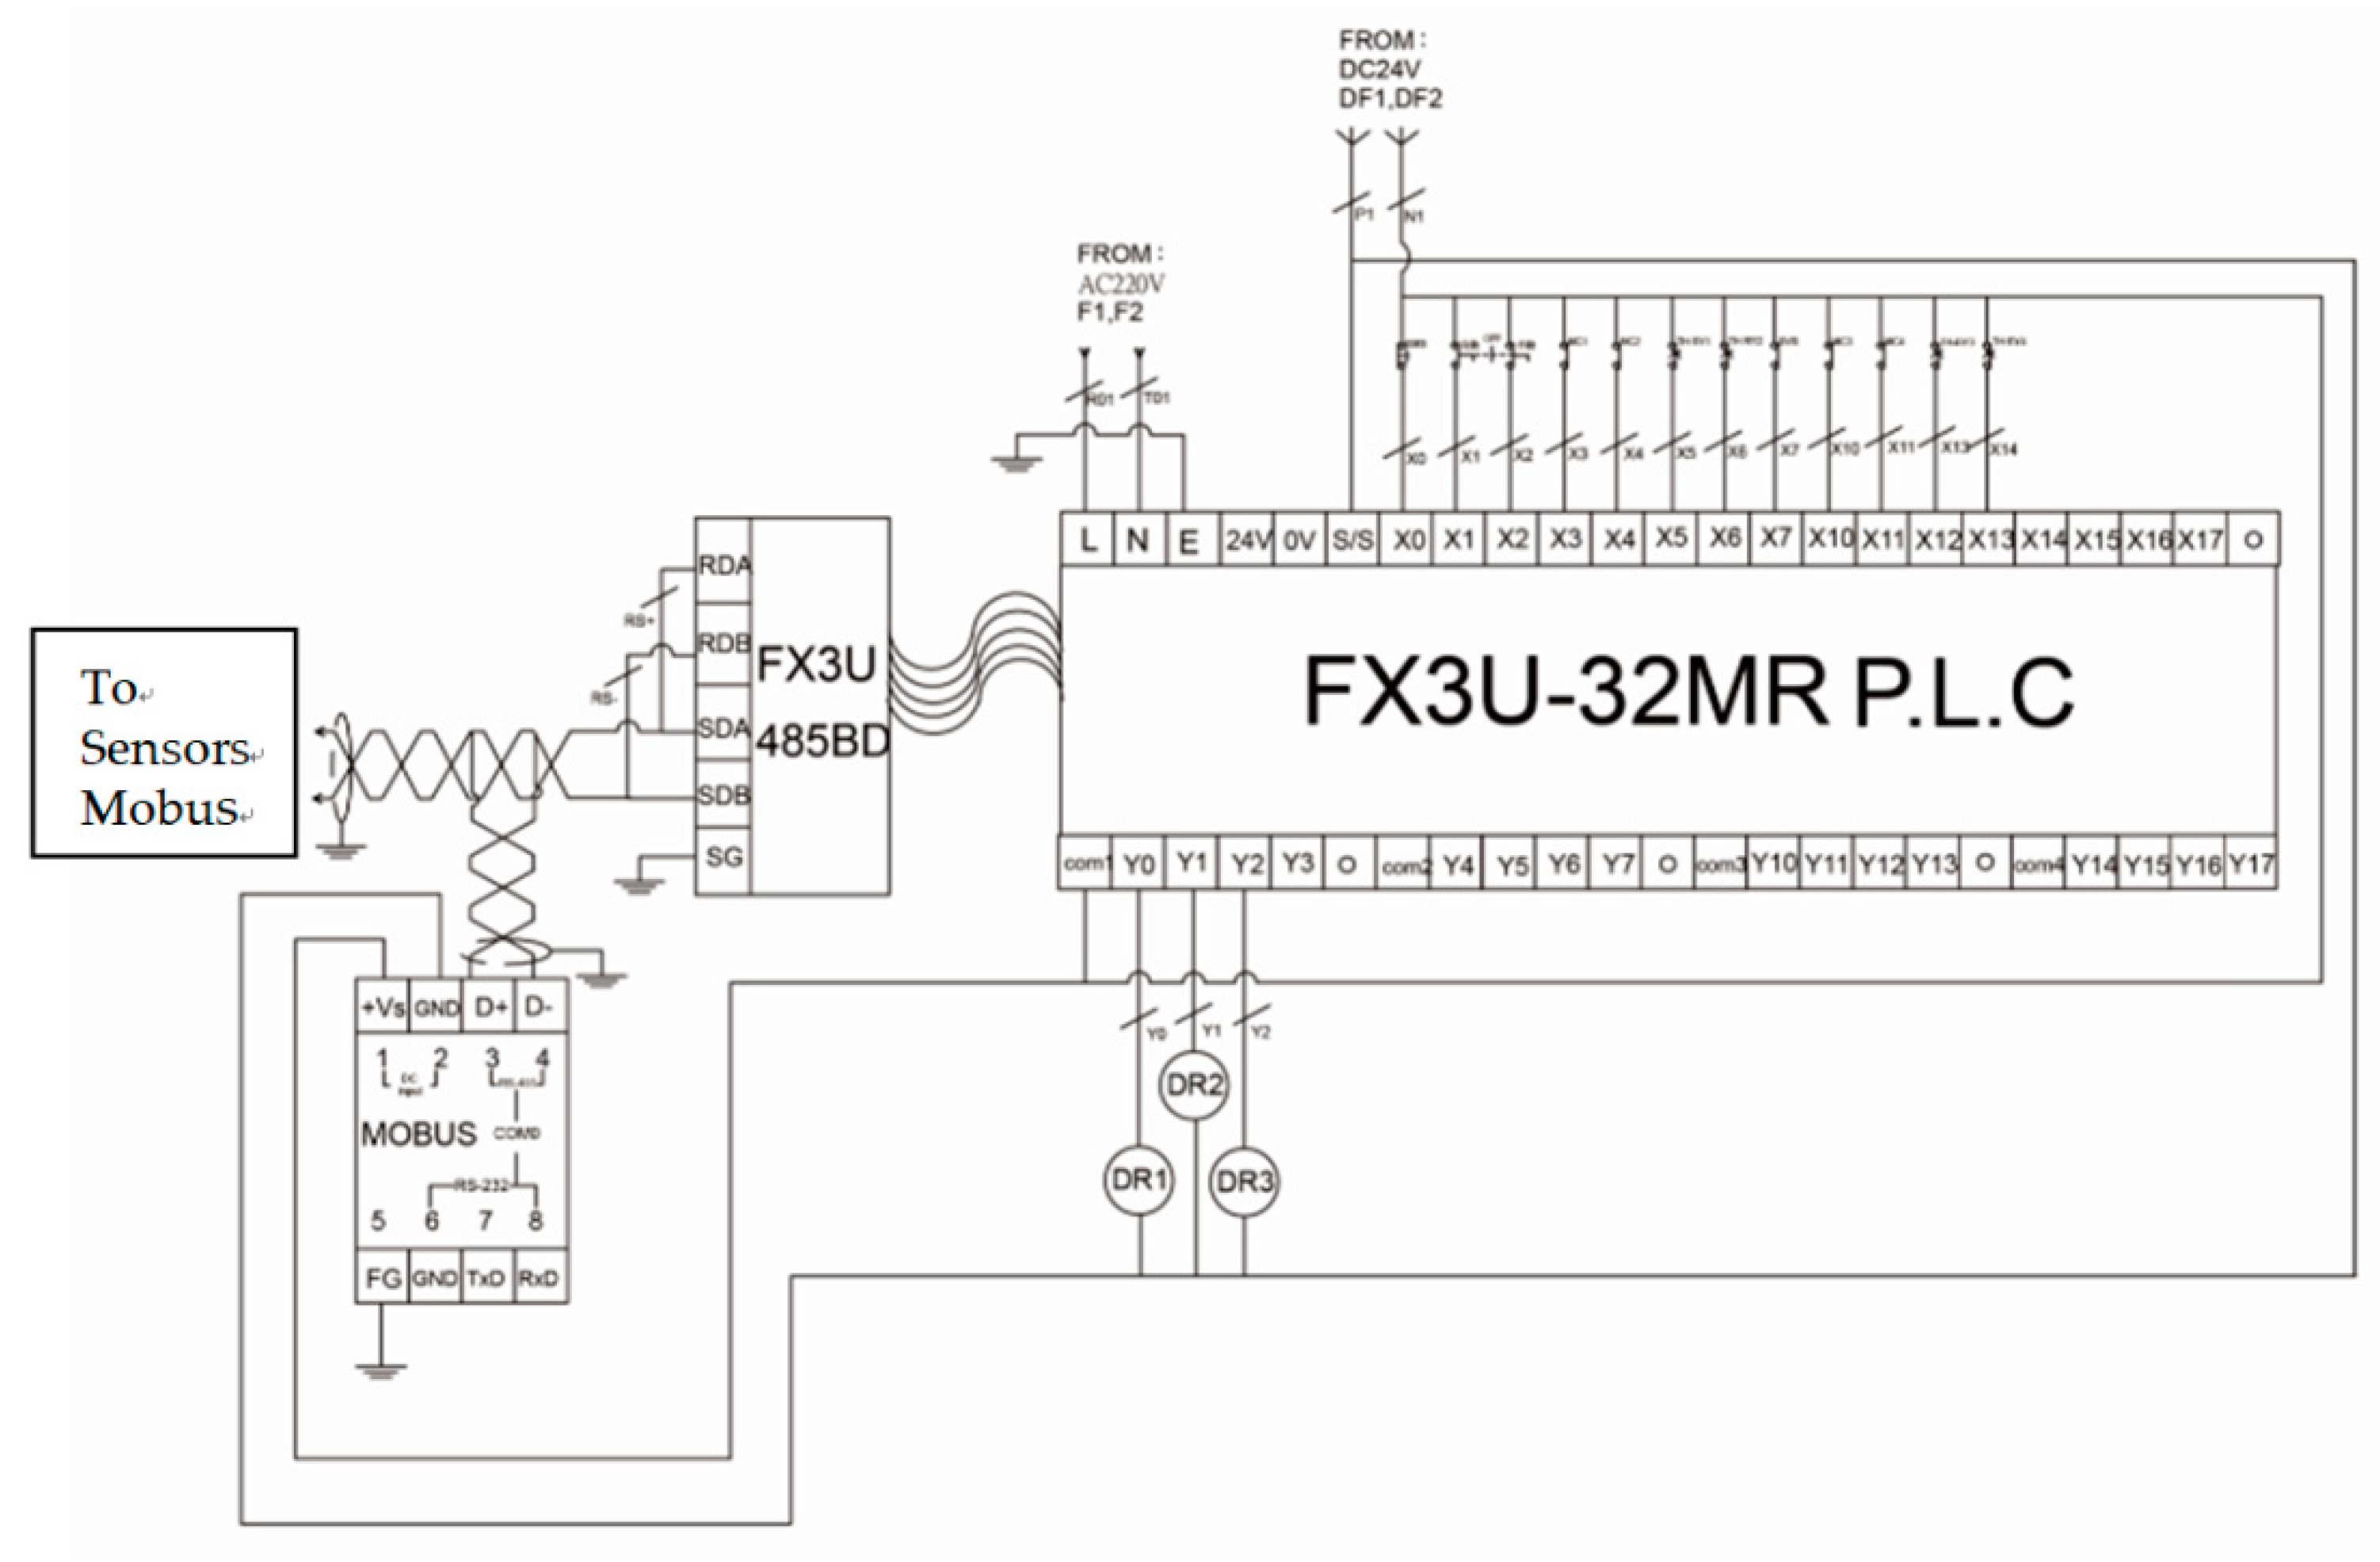
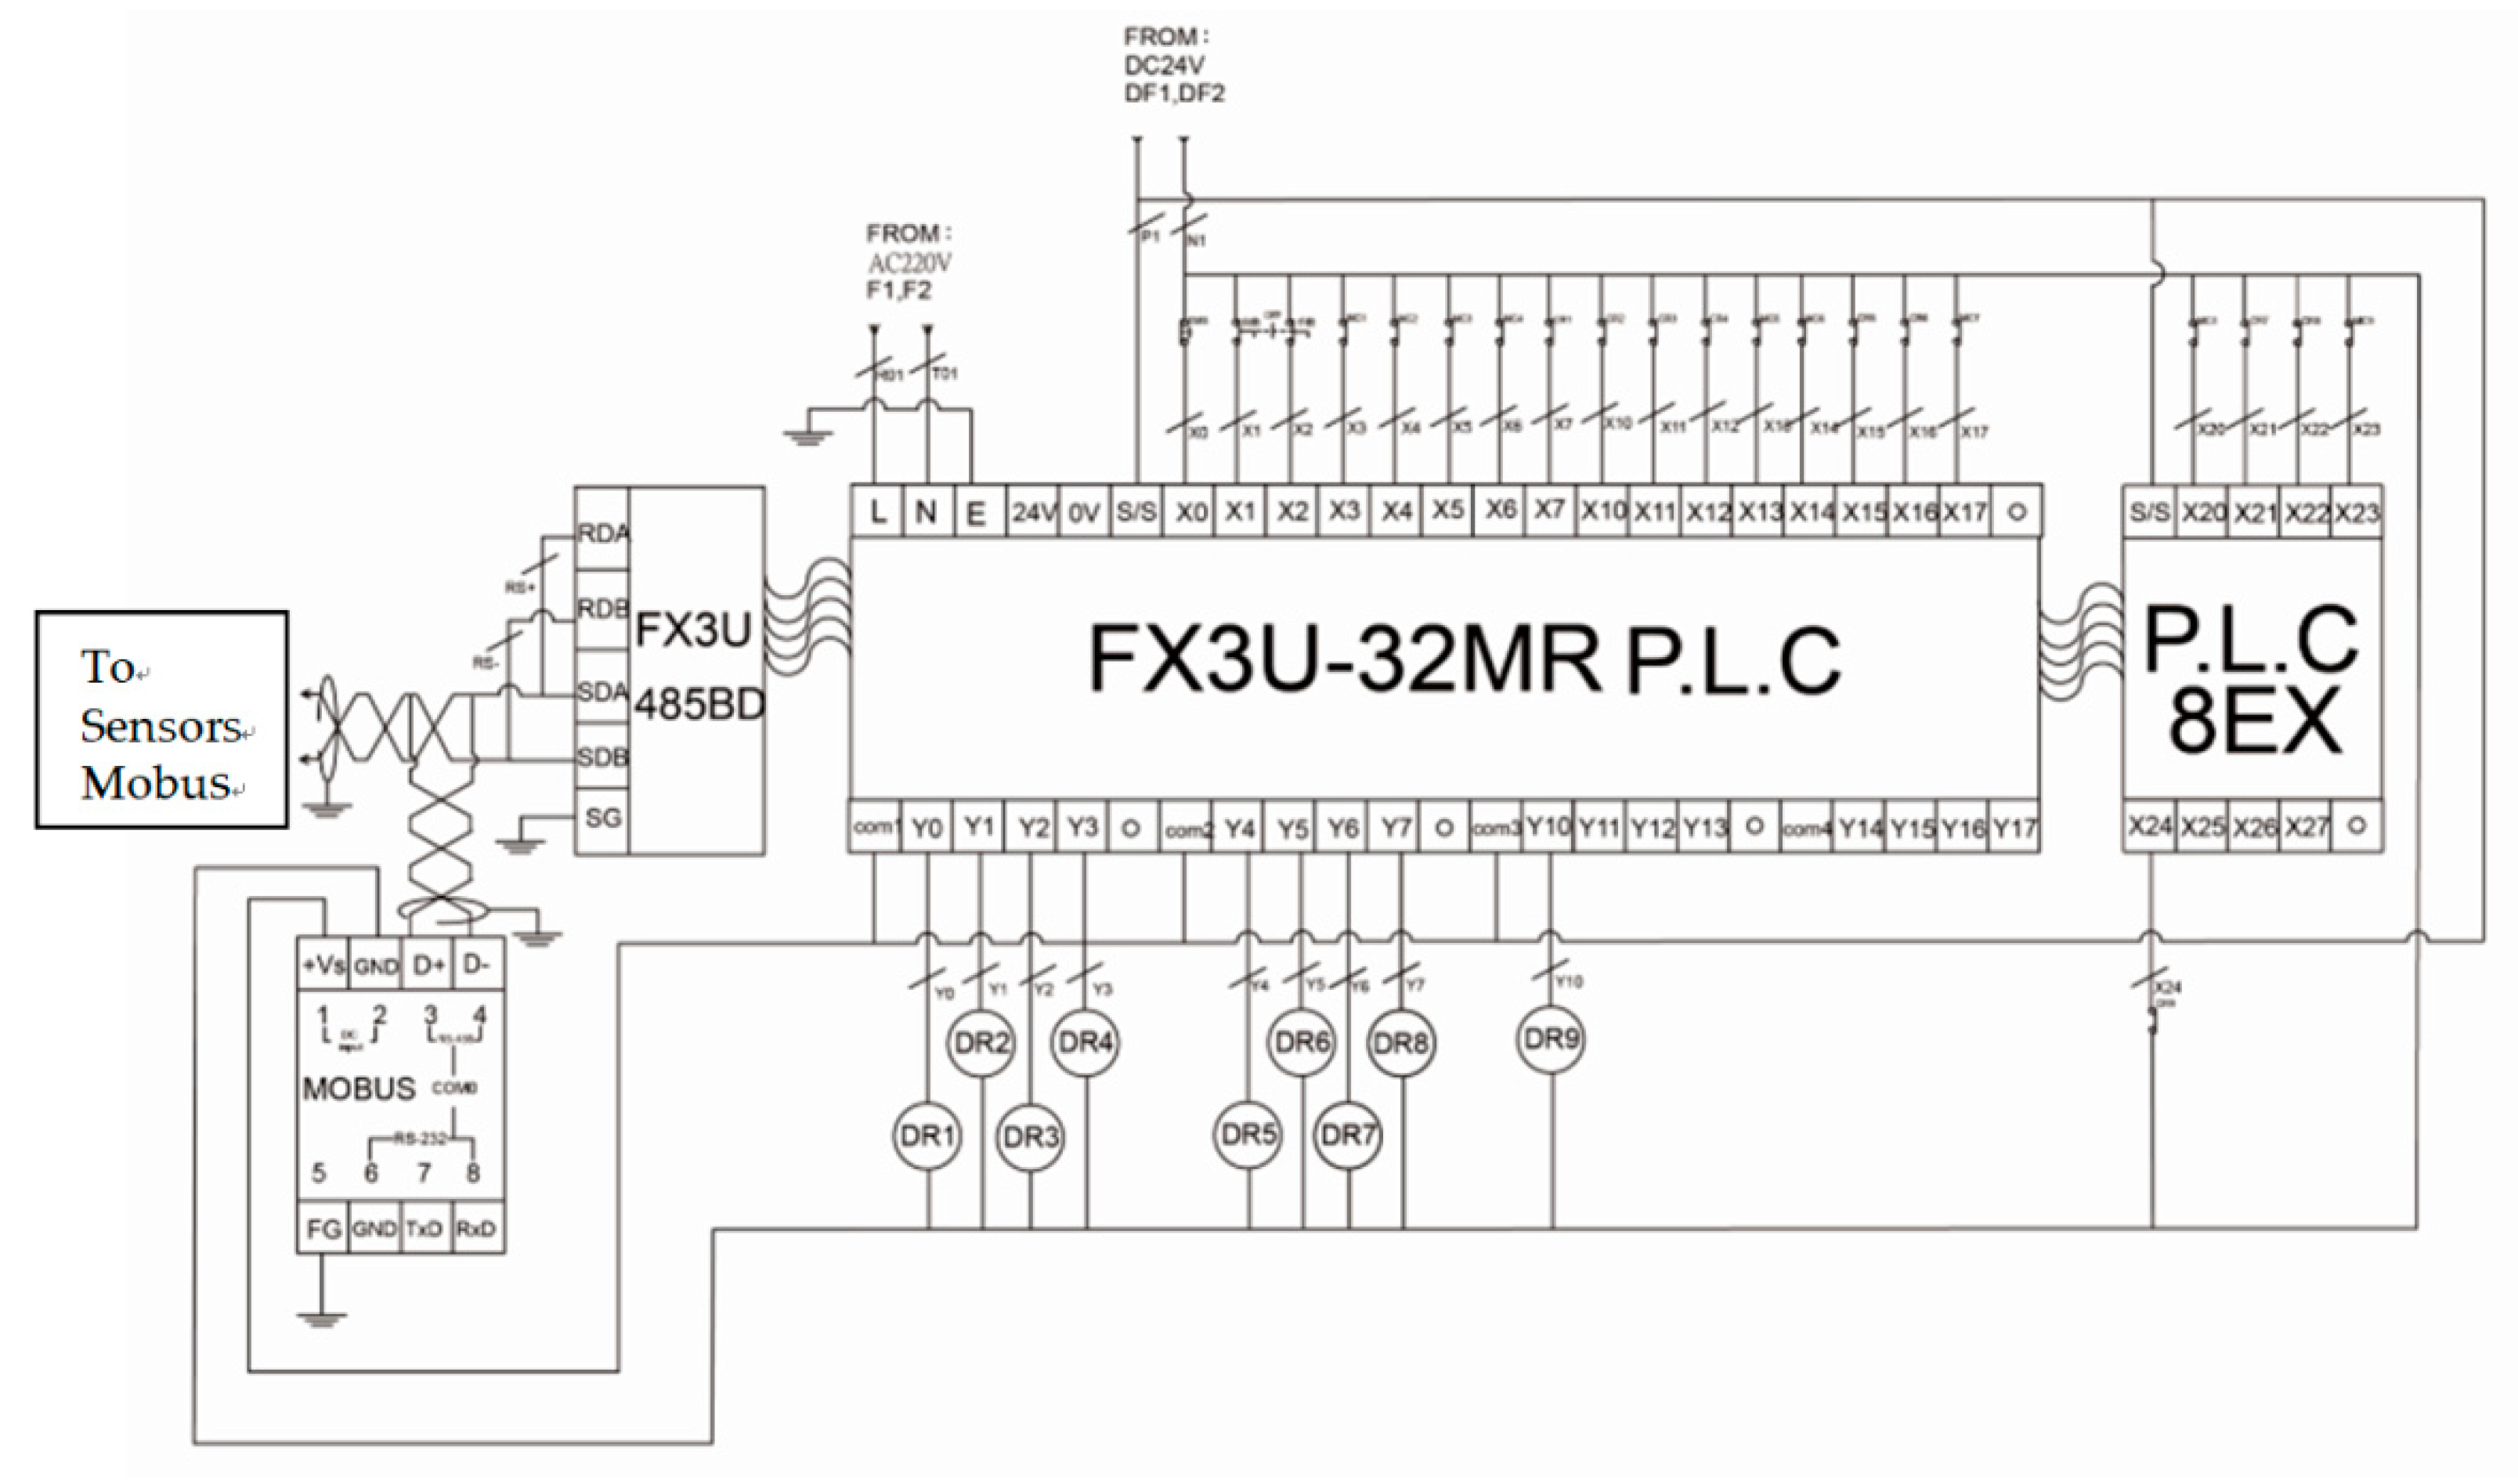
In this research the environmental status information of the livestock farms was expected to instantly be received in order to make adjustments timely according to the environmental conditions. In consideration of the daily behaviors of dairy cows and ample space in the dairy barn, the temperature and humidity sensors were installed at the upper beam of the barn in a symmetrical manner versus the middle beam. The installation positions of the wind speed sensors and illuminance sensors were also designed with in-depth considerations to ensure the environmental parameters could be accurately retrieved from the entire site. The layout and illustrative details of sensors installation are shown in Figure 2. Moreover, Modbus communication protocols have been applied to ensure the smooth transmission of the data collected by the temperature, humidity, wind speed, and illumination sensors and so forth, to provide the important heat stress and body temperature analysis data of the dairy cows. The circuit wiring diagram of the input and output devices and PLC are shown in Figure 6 and Figure 7.
The signal retrieved by the temperature, humidity, wind speed and illuminance sensor modules were transmitted to the PLC through the A/D modules, and then the signals have been converted into Modbus specification through the left communication module (FX3U-485ADP-MB). Finally, the RS-232/RS-485 data were converted into ISM (Industrial Scientific Medical) wireless 429 MHz frequency band via RFU-400CR wireless communication transmitting devices produced by ICP DAS CO., LTD. for receiving or sending out. The RFU-400CR in the office was used for signal receiving and transmission purposes, and it would send the data out to PC and PLC for treatments. The retrieved environmental data were instantly displayed on the human-machine interface or displays and stored inside the database. Therefore, the administrator could read the real-time environmental information from the barns, and he could also analyze the historical data in the database to get the best environmental parameters [25]. The application of RFU-400 diagram is shown in Figure 8.
A wireless communication network was then established through the RFU-400CR wireless transceiver. The Master/Slave communication between devices were connected by using the Modbus communication protocol, and the commands were sent by the Master to have the Slave to transmit the data retrieved by PLC from sensors back to the Master. The livestock administrator could observe the environmental data in the barns at a remote terminal. The setting method was as follows: The Modbus station numbers of Master and Slave, communication settings, and packet latency could be set in the PLC program, and the data collected from different sensors were stored in the PLC register by using the “ADPRW” command [26] and then the signal could be smoothly transmitted to the register of the PLC.
3.3. Data Retrieving and Analysis
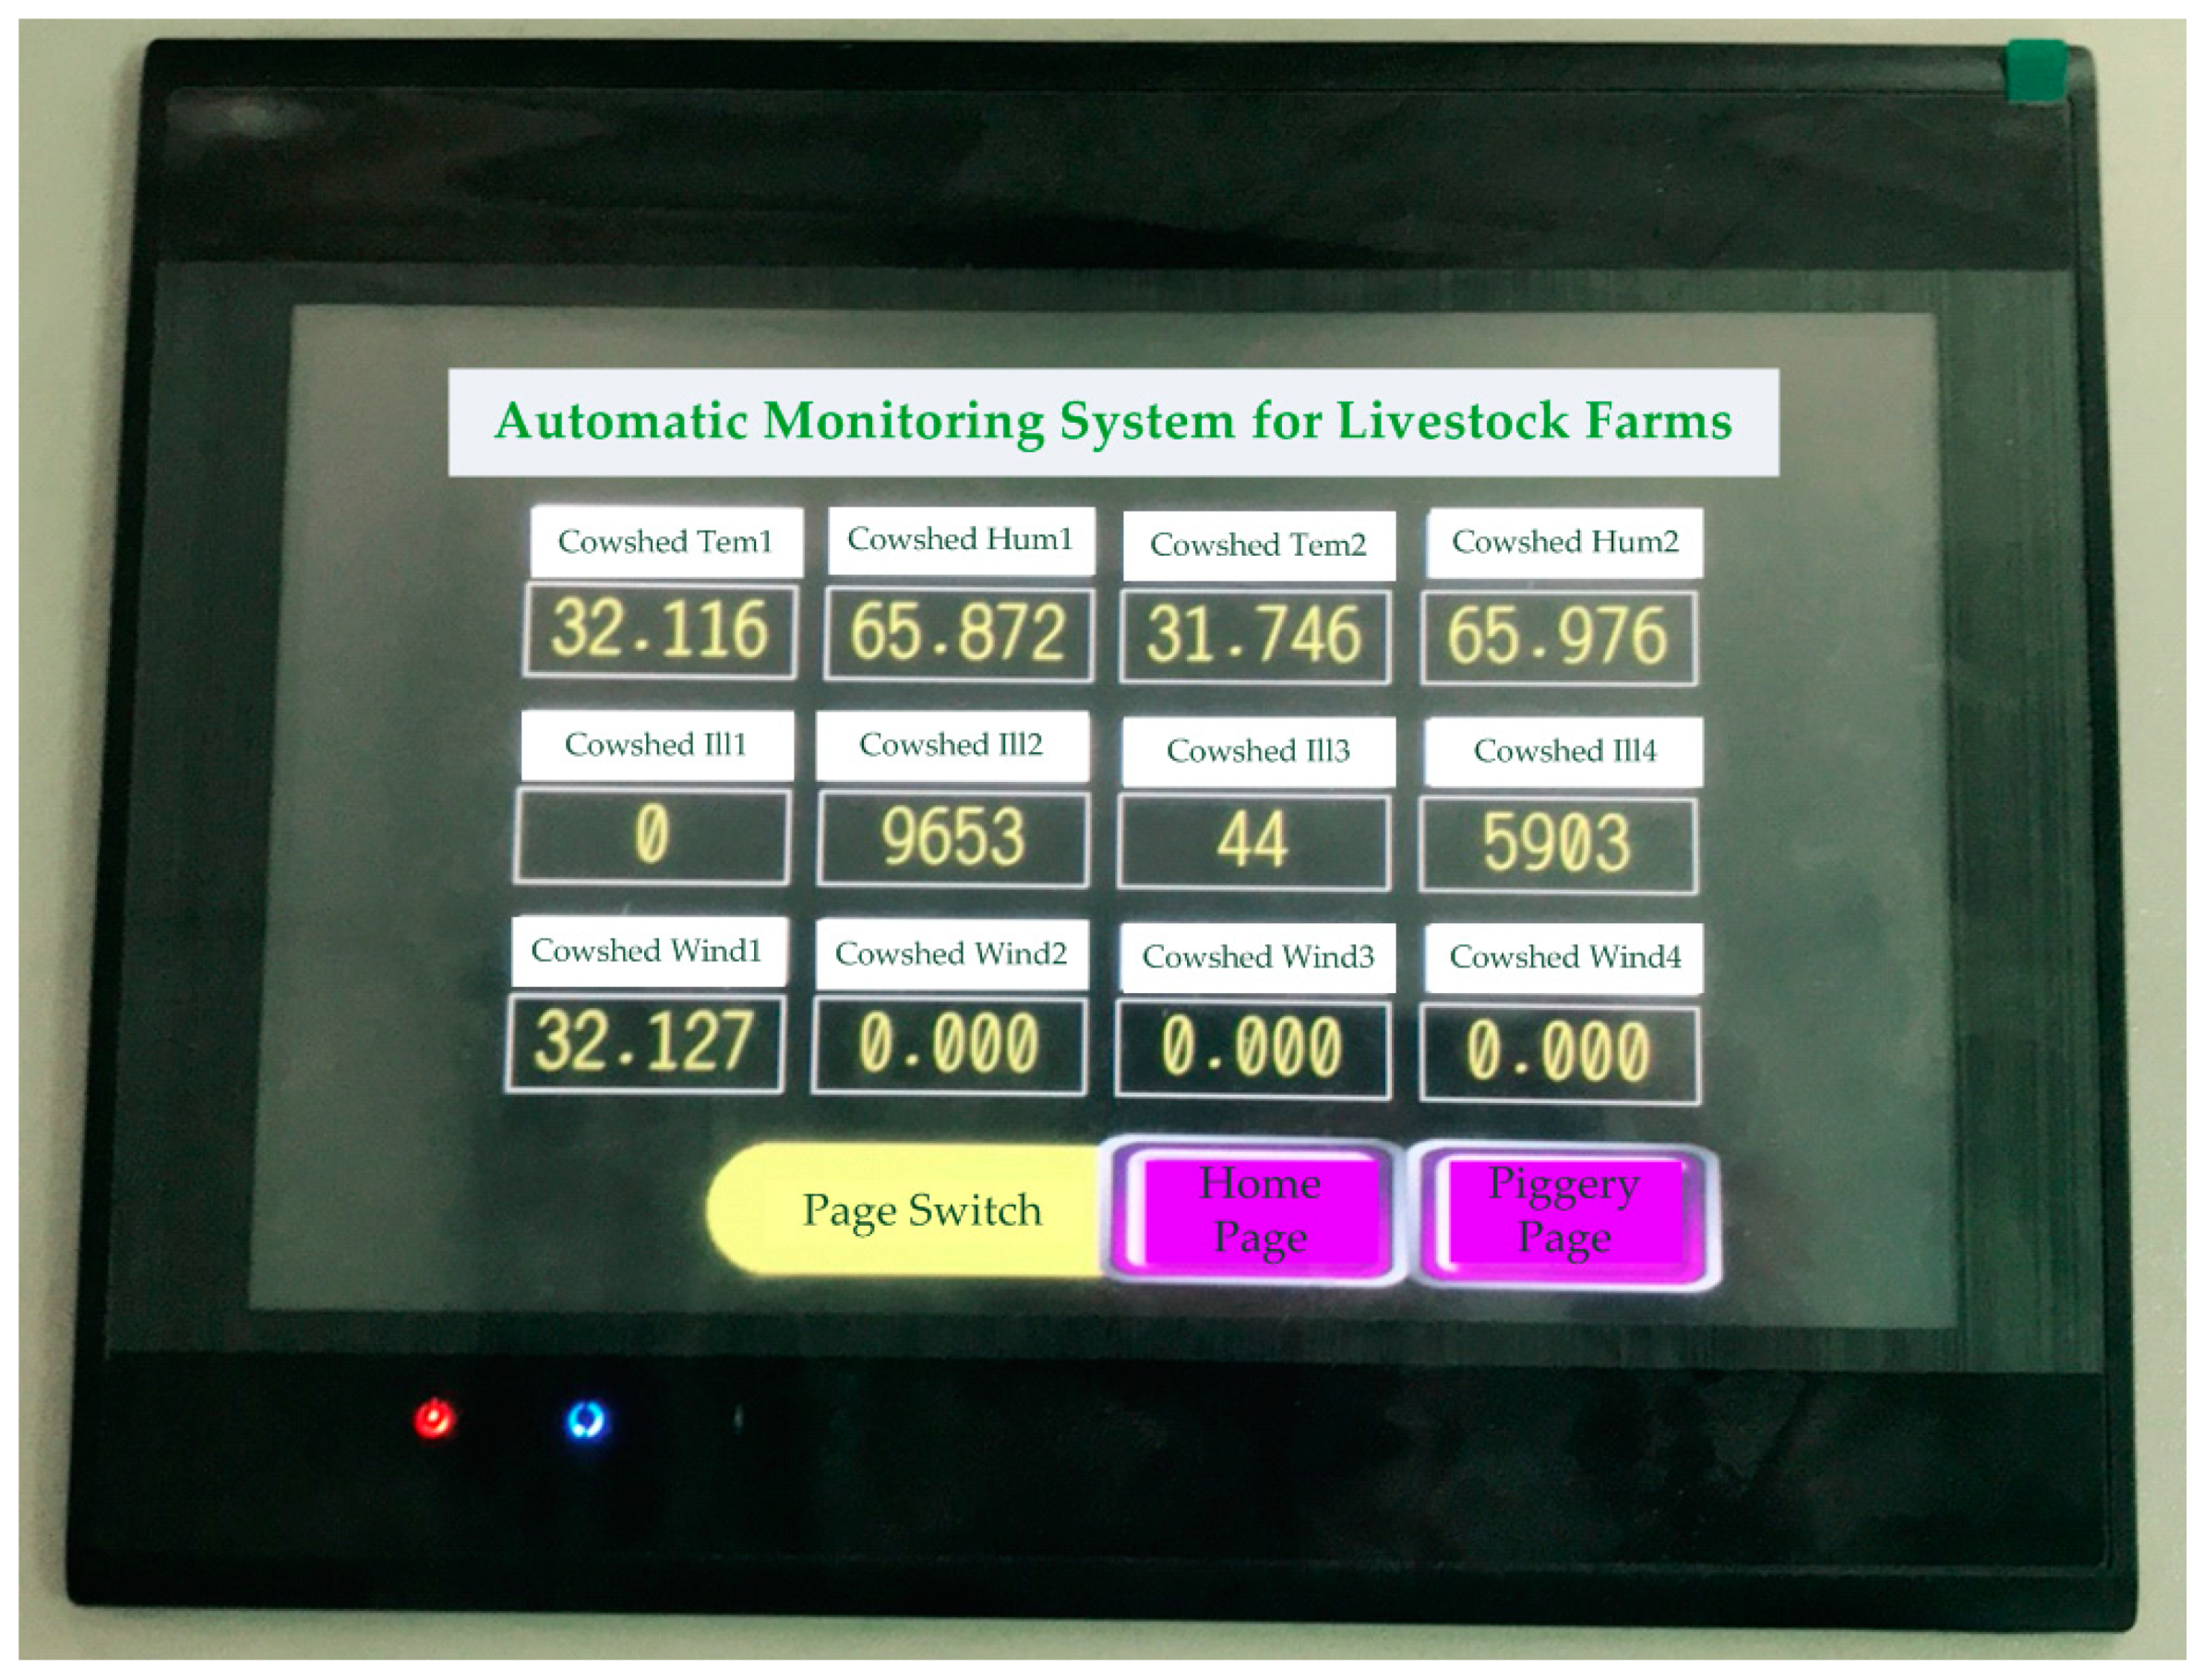
After the data were collected to the PLC’s designated register, the MX sheet package was used to set up the data retrieving time and lengths to retrieve the required data and export the retrieved data into an Excel file database for the researchers’ computation and analysis purposes. Meanwhile, the human-machine interface also retrieved the data from the register, and the data from different sensors were displayed in the human-machine interface for observation by staffs in the livestock farm, as shown in Figure 9.
In this study, the data exported to the Excel file were used to calculate the temperature-humidity index (THI) based on the formula of (1), where T was Celsius temperature and RH was humidity. The temperature-humidity index could be divided into 4 levels [27]: THI < 72 for no heat stress, 72 ≤ THI < 79 for mild heat stress, 80 ≤ THI < 89 for moderate heat stress, 90 ≤ THI < 98 for severe heat stress, the detailed description is as shown in Table 3. We acquired and analyzed the data of lactation yield every 10 minutes during time interval 9:00am to 4:00pm for March, August and November and the lactation yield for dairy cows under different seasons and climates were also discussed.
In addition, the apparent temperature index (AT) of the dairy cows was established based on the formula (2) [28], where T was Celsius temperature (°C), RH is humidity, I was illuminance, e is vapor pressure and V was wind speed (m/s). We compared the apparent temperature index (AT) and the temperature-humidity index (THI), and analyzed the difference between the temperature-humidity index (THI) and lactation yields for dairy cows.
AT = 1.07T + 0.2e − 0.65V − 2.7,
4. Results and Discussions
The experimental sites of this study were in the livestock farms of the National Pingtung University of Science and Technology. The barns were designed as semi-open spaces, and the study was carried out on the common dairy cow breed in Taiwan - Holstein-Friesian. The dairy cows of the European breeds generally show weak heat-resistant. However, the weather from July to August in Taiwan is hot and humid, which tends to cause a decrease in milk production and mastitis in dairy cows. To verify the impacts of weather on dairy cows, we may refer to the articles [29,30,31,32]. To verify the impacts of weather on lactation yields, we acquired the data of lactation yields in March, August and November, representing the good and bad weather conditions respectively for the lactation of dairy cows. We retrieved the daily data during time interval of 9:00 a.m. to 4:00 p.m., that was the timing when dairy cows had increased sensitivity to heat stress. Comparing the experimental data with the lactation yields for dairy cows, the results were analyzed as follows:
- 1.
- The Correlations Between Lactation Yield and Season
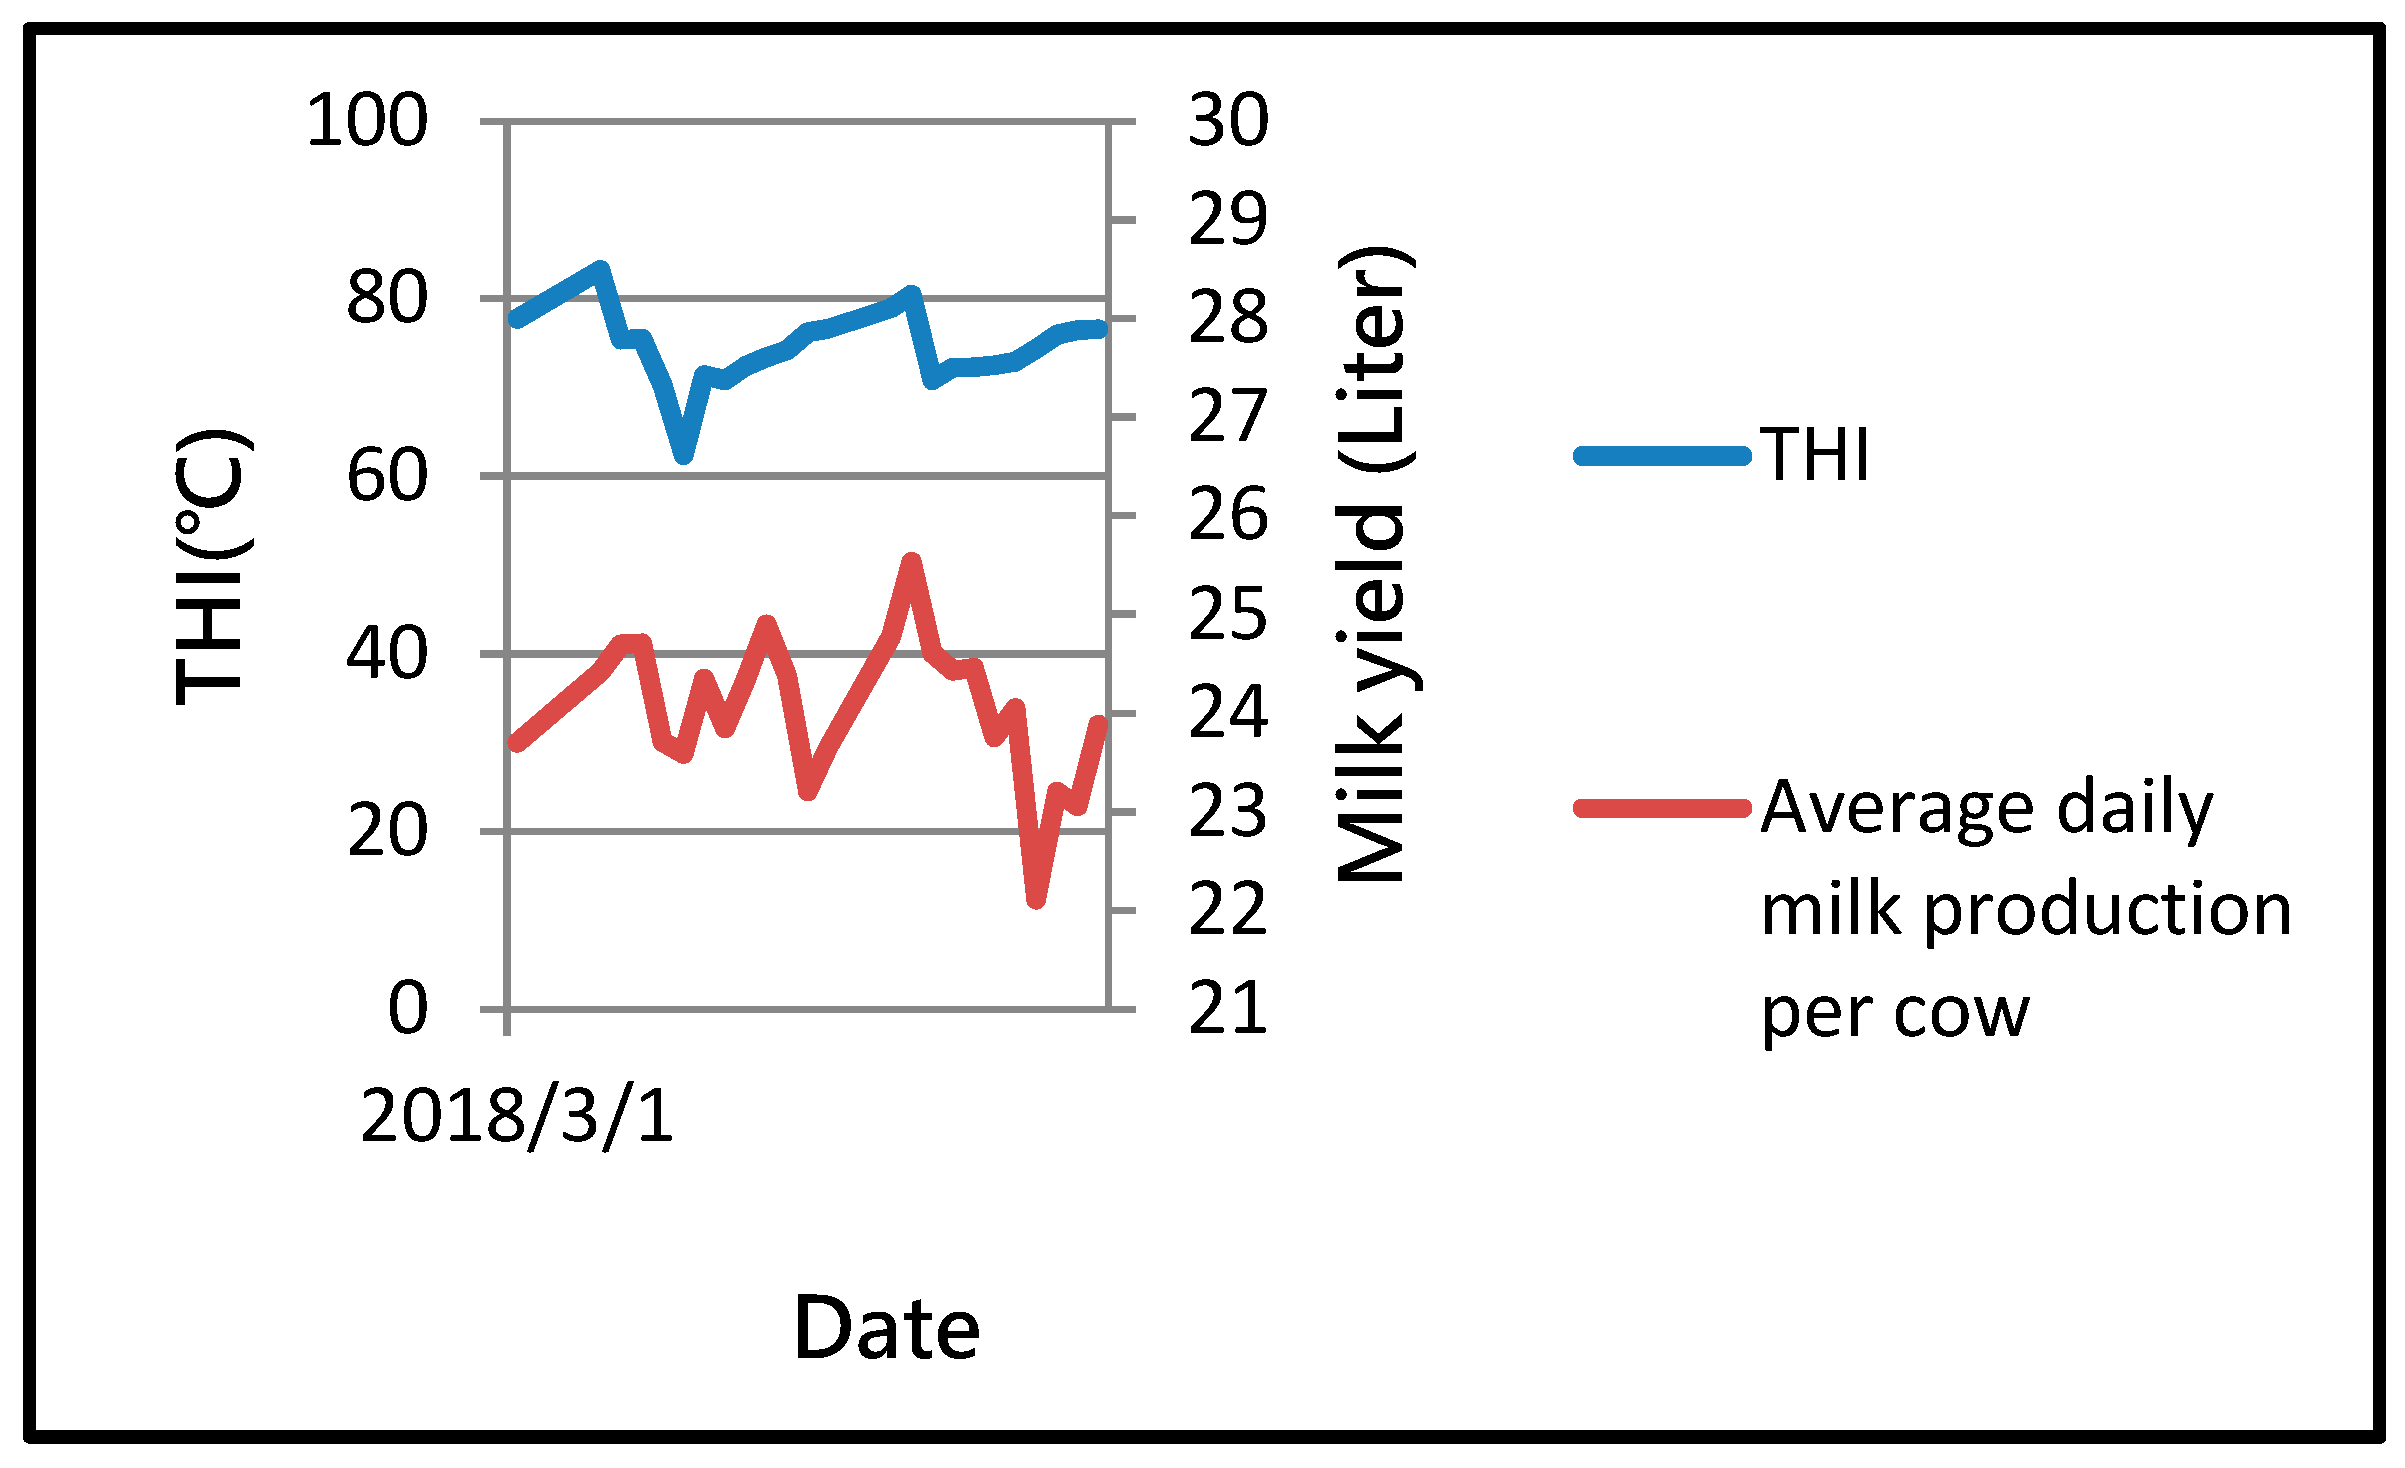
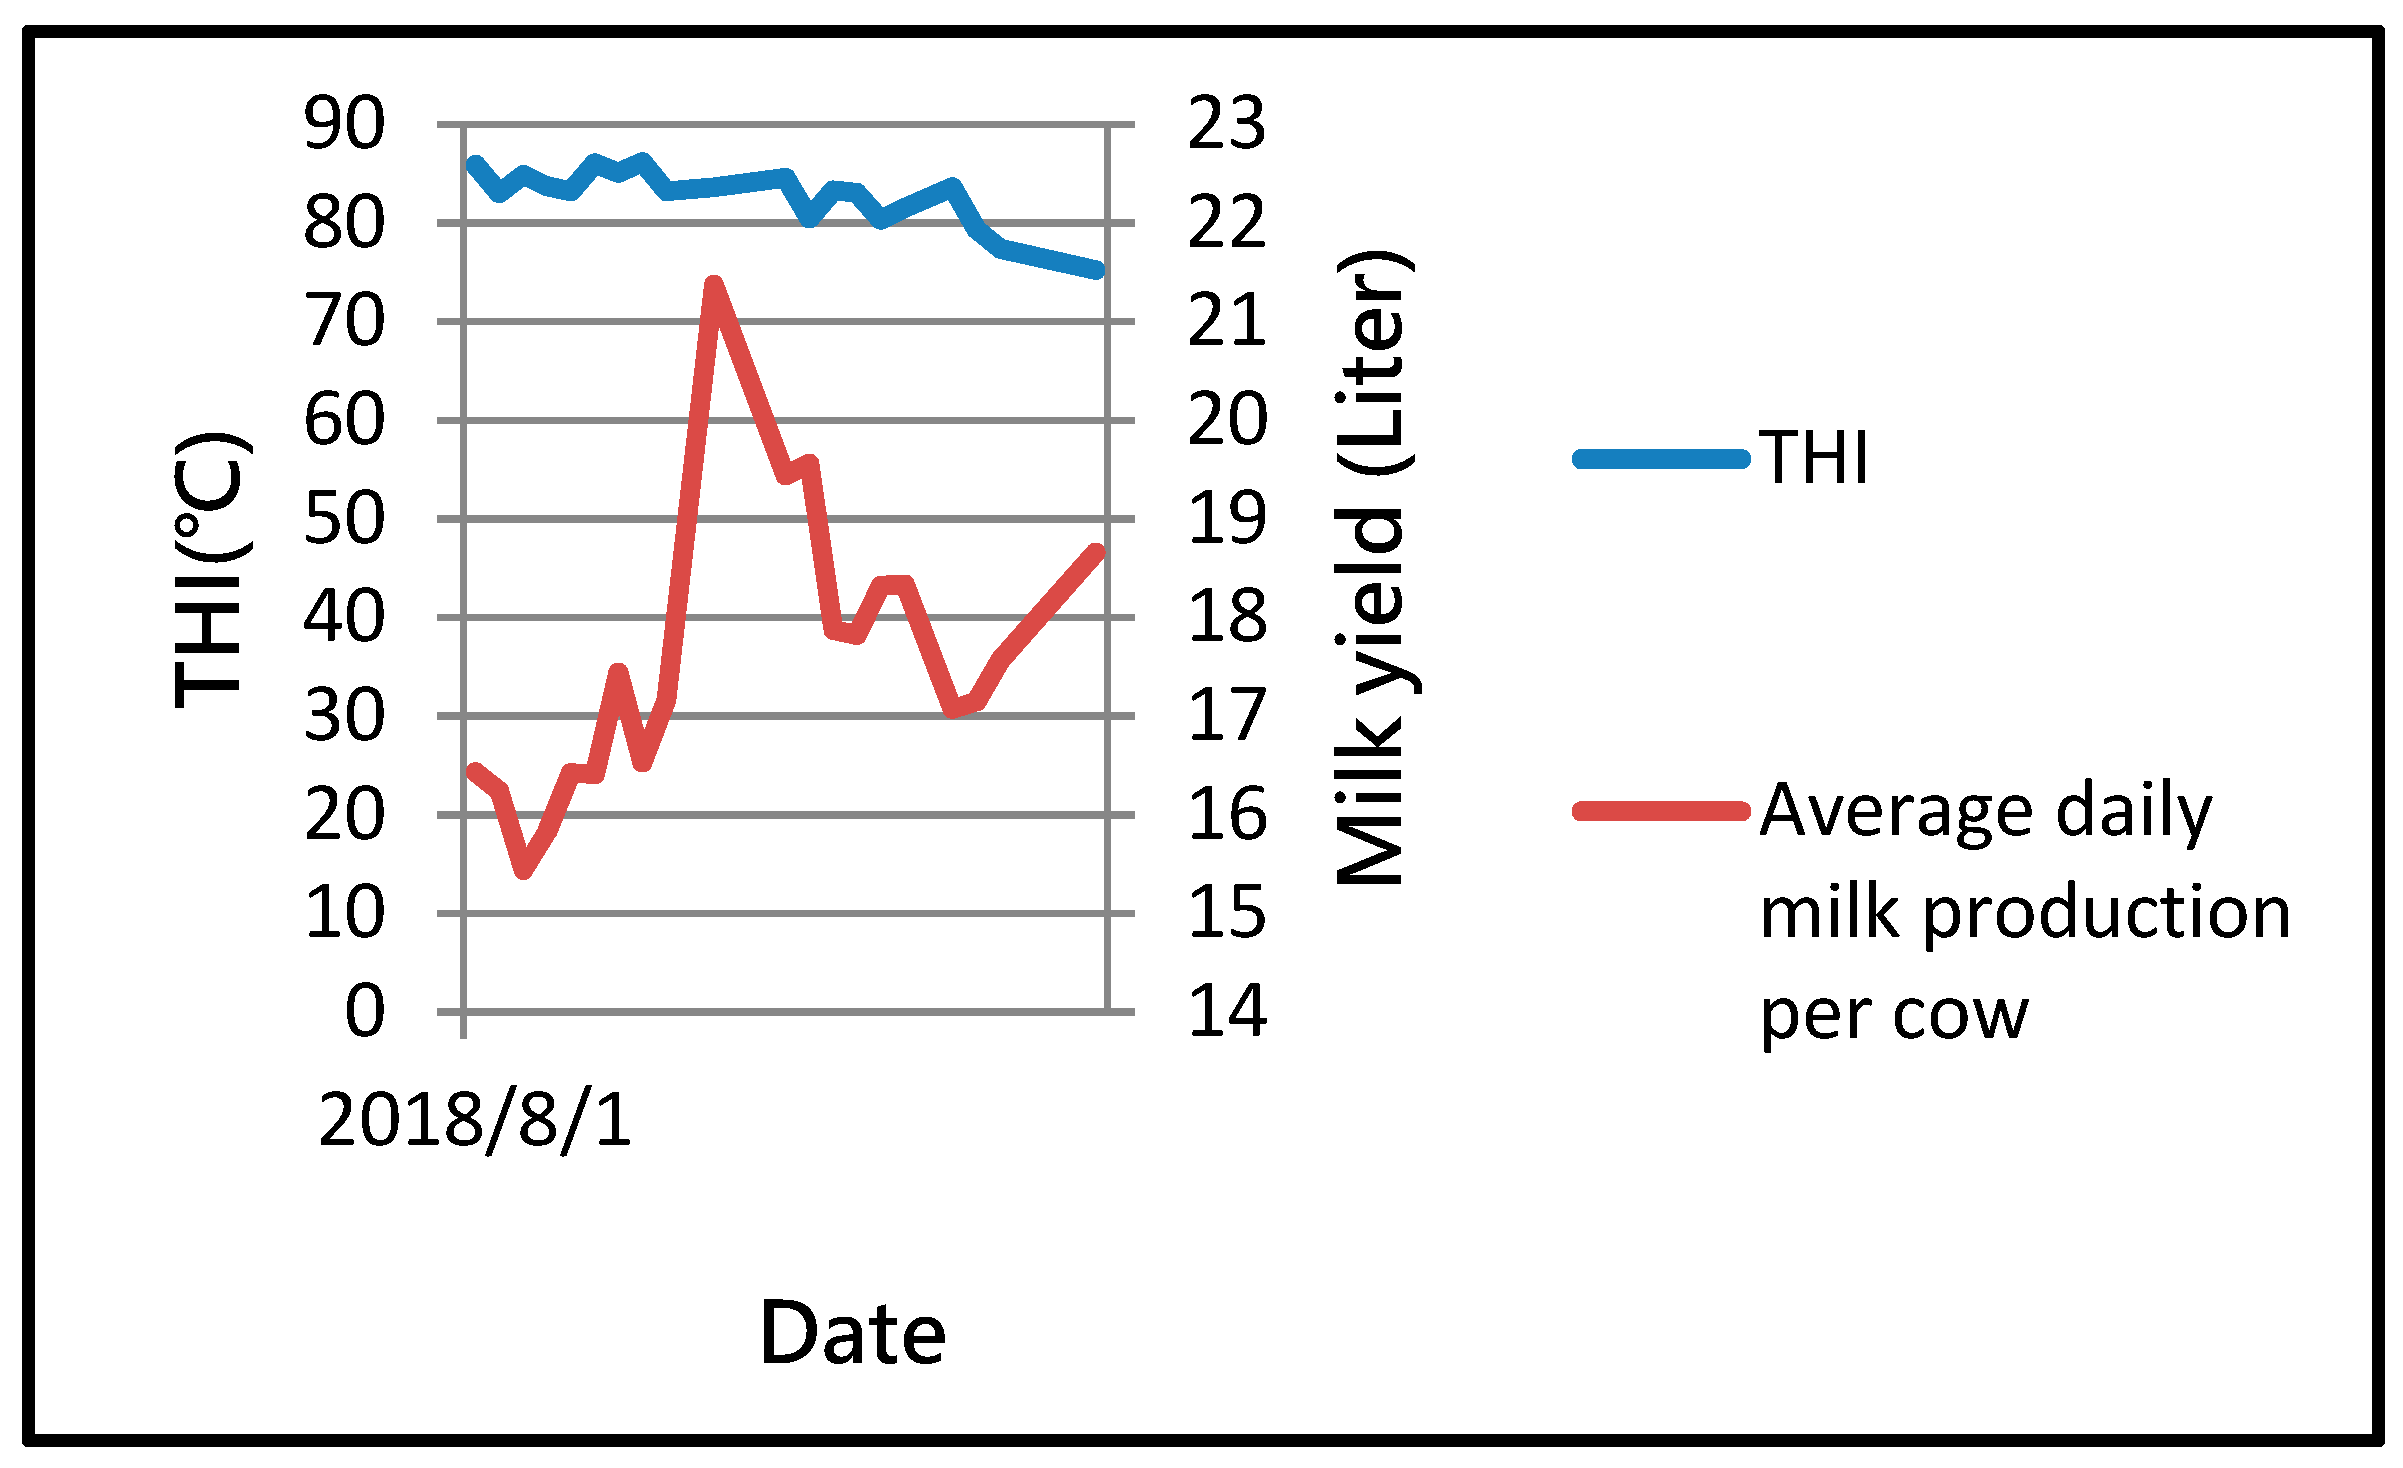
In March, the cooler season, the values of temperature-humidity index (THI) mostly would fall within the range of mild heat stress, and it was showed in Figure 10 that the average lactation yield per dairy cow was 24.9102 L/day. On the other hand, in August, the hot and humid season, the values of temperature-humidity index (THI) would mostly fall within the range of moderate heat stress, and it was showed in Figure 11 that the average lactation yield per dairy cow was 20.8167 L/day, which was significantly 4.0935 L/day lower compared to the average lactation yield per dairy cow in March.
- 2.
- The Correlation Between Lactation Yield and Short-term Temperature Changes
Comparing Figure 10, it indicated that there was only one time that it reached the degree of moderate heat stress, resulting in a 0.4887 L/day reduction of average lactation yield per dairy cow. Furthermore, a strike of three-day cold current also caused a 1.0273 L/day reduction of average lactation yield per dairy cow due to a sudden environmental temperature change. It was found that a one-day heat stress showed little impact on the lactation yield, but the heat stress over a longer period showed significant impact on the lactation yield of dairy cows.
- 3.
- The Correlation Between Lactation Yield and Temperature-Humidity Under Moderate Heat Stress Status
Figure 11 and Figure 12 showed the correlation between temperature and the lactation yield per dairy cow under moderate heat stress status. It was found that the average lactation yield was 16.4354 L/day under the average temperature of 30.9856 °C during 1 to 11 August. Furthermore, the average lactation yield was 18.1641 L/day under the average temperature of 28.3183 °C during rainy days from 16 to 21 August. It indicated that the average lactation yield per dairy cow tended to decrease as the temperature increased under moderate heat stress status. There was a 0.6481 L/day reduction of average lactation yield per dairy cow as the temperature increased about 1 °C.
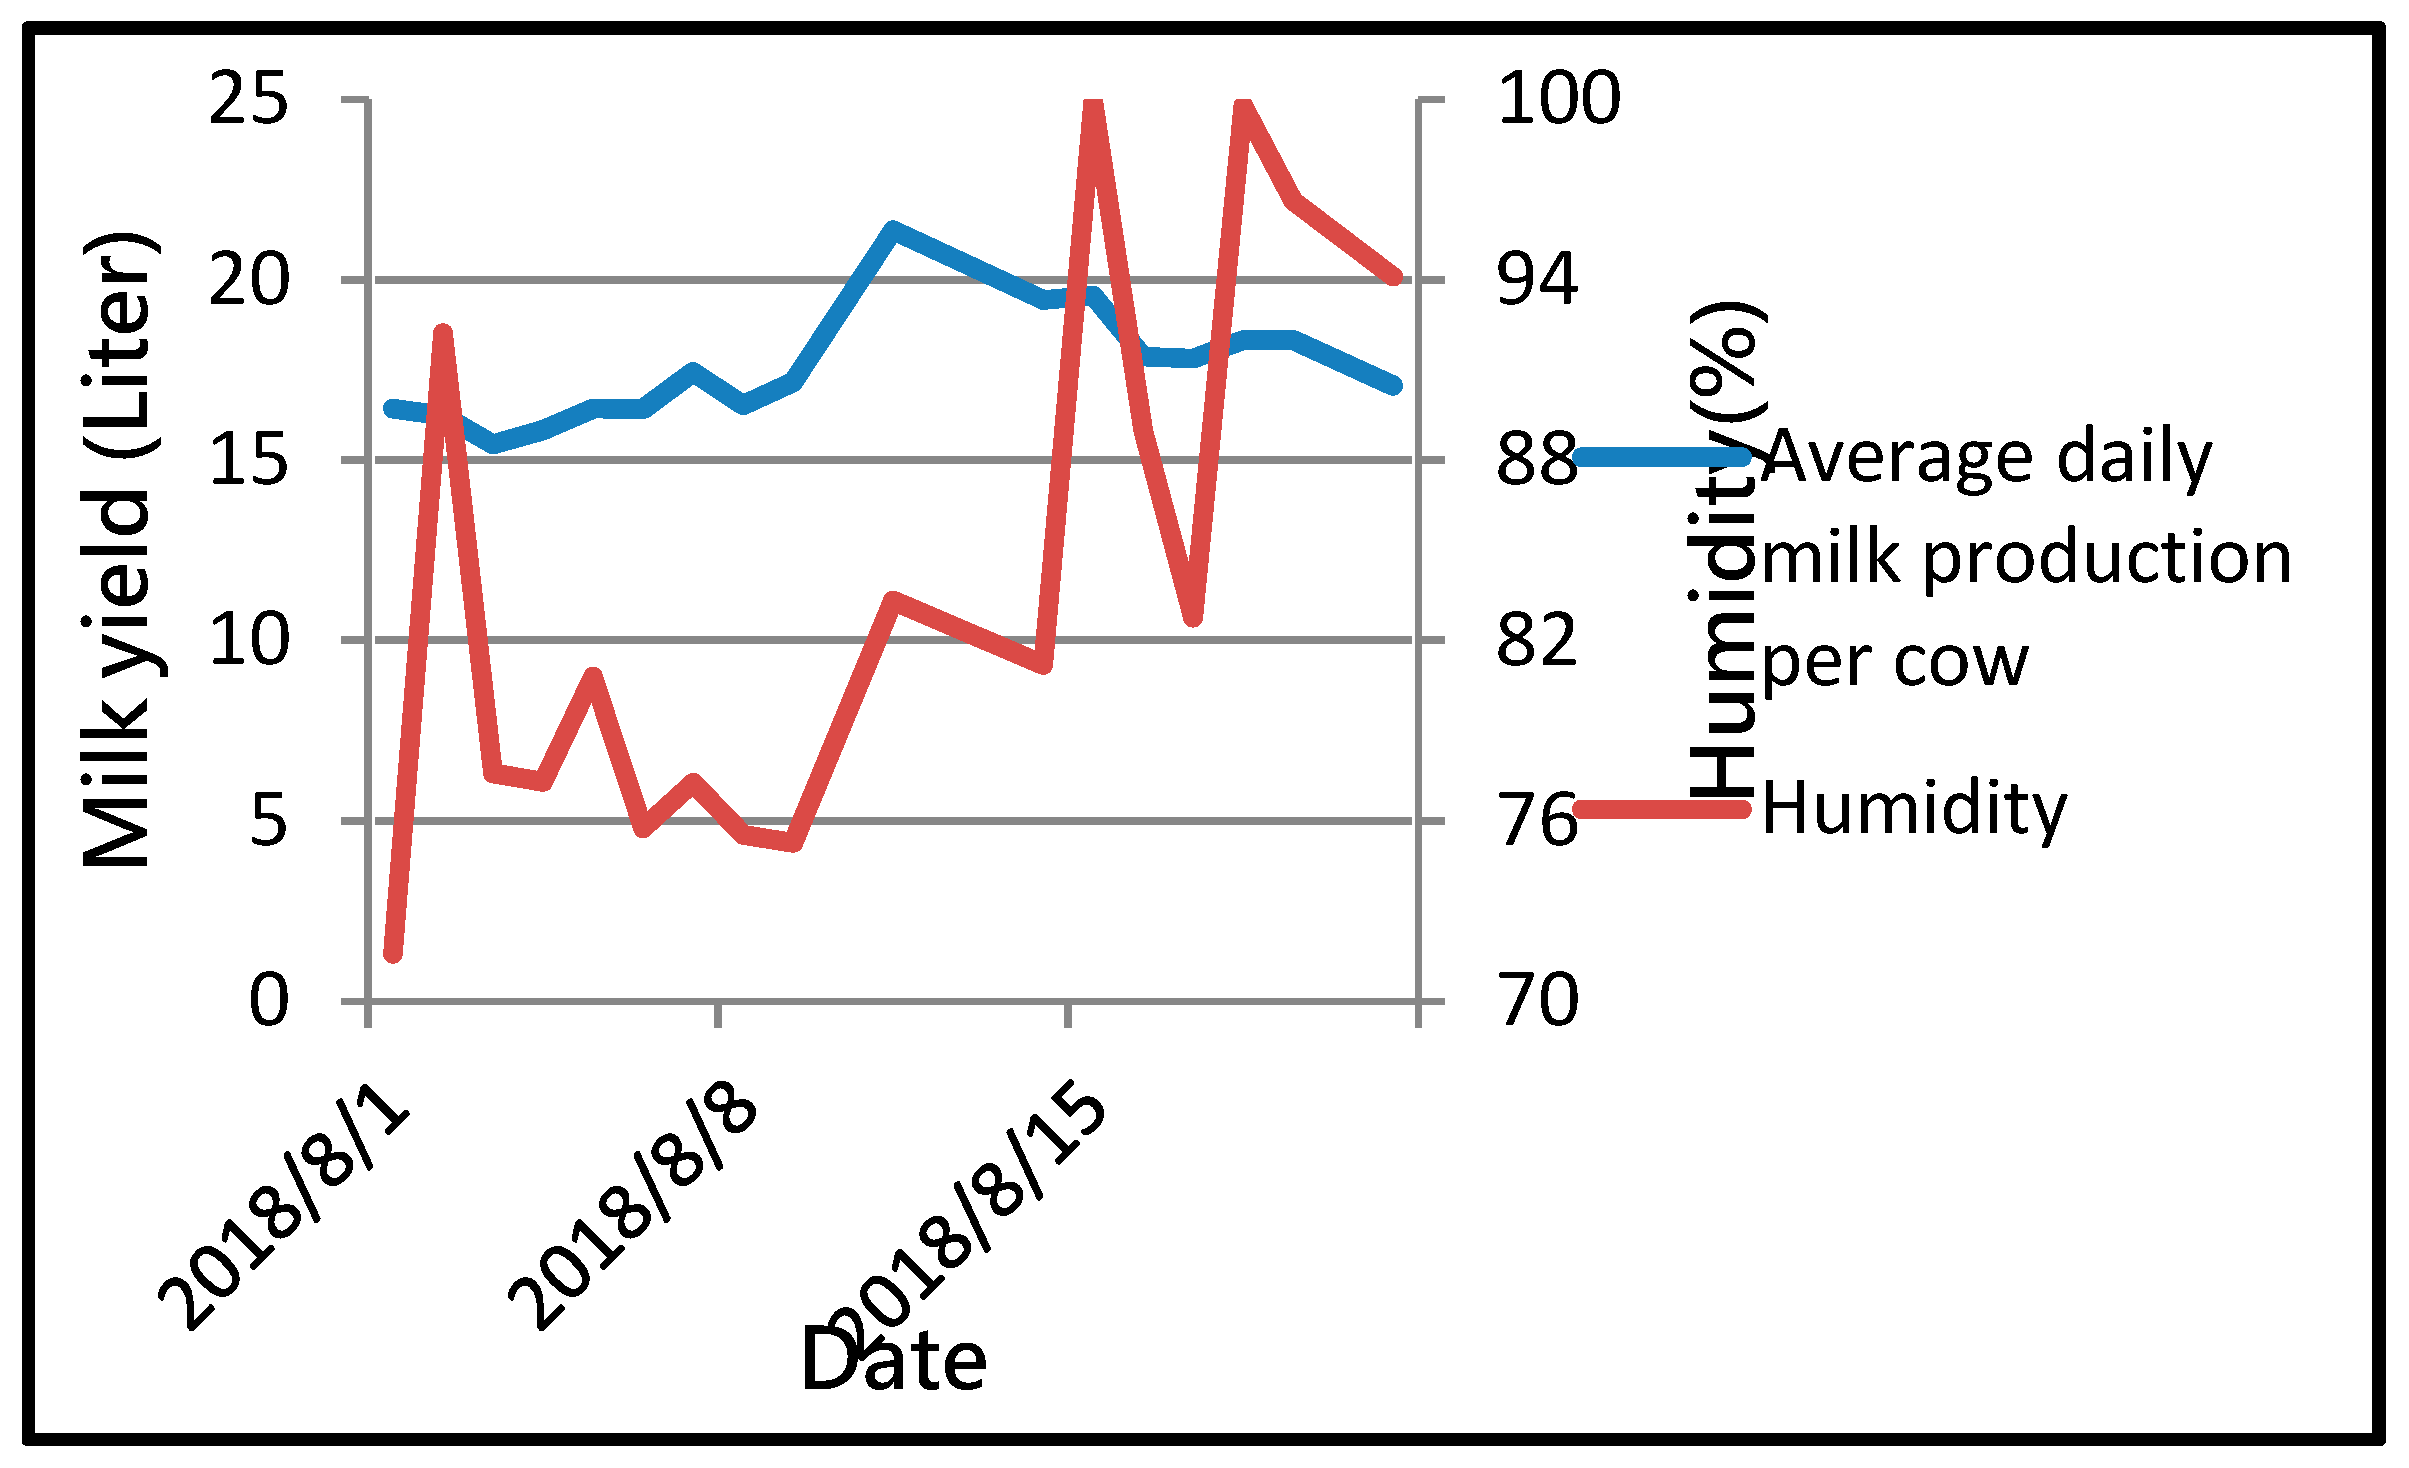
Figure 13 indicated that the lactation yield per dairy cow did not change much even though there was obvious fluctuation in the humidity curve under moderate heat stress status. It indicated that the impact of humidity on lactation yield of dairy cows was not significant under moderate heat stress status.
Compared with Figure 11, Figure 12 and Figure 13, it indicated that the impact of temperature on lactation yield was greater than humidity under moderate heat stress status, showing that we could improve the lactation yield under heat stress by lowering the environment temperature with controls of fans or water valves.
- 4.
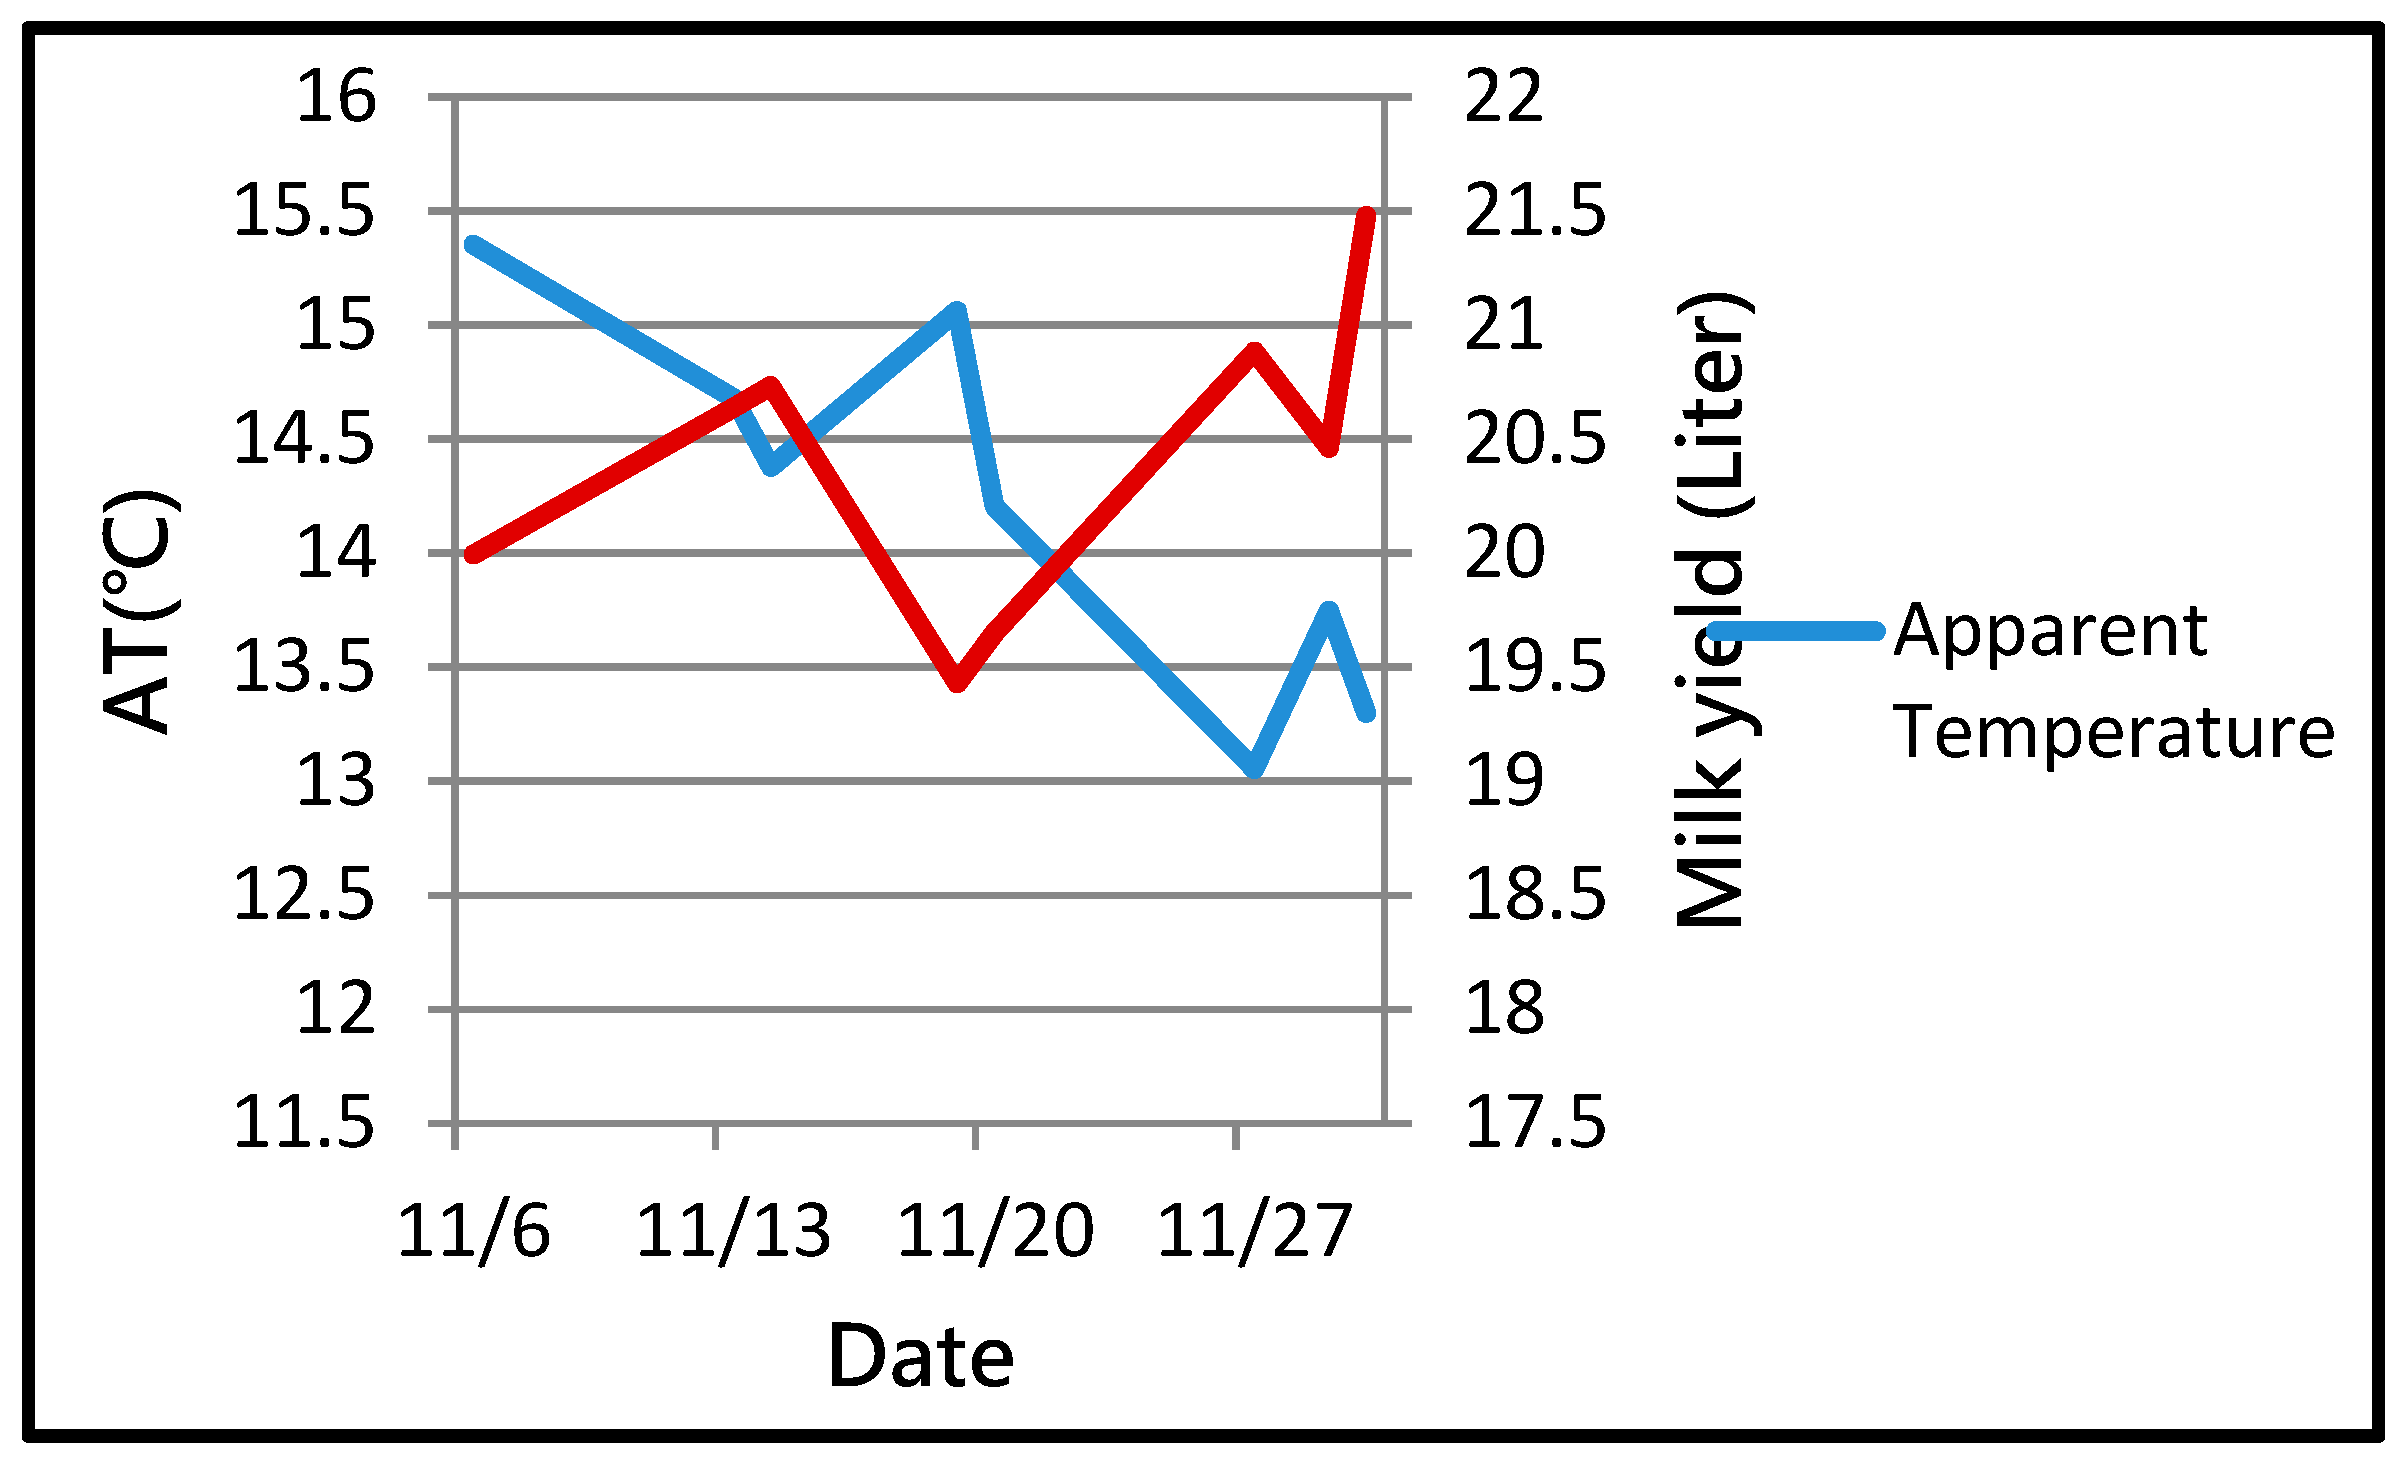
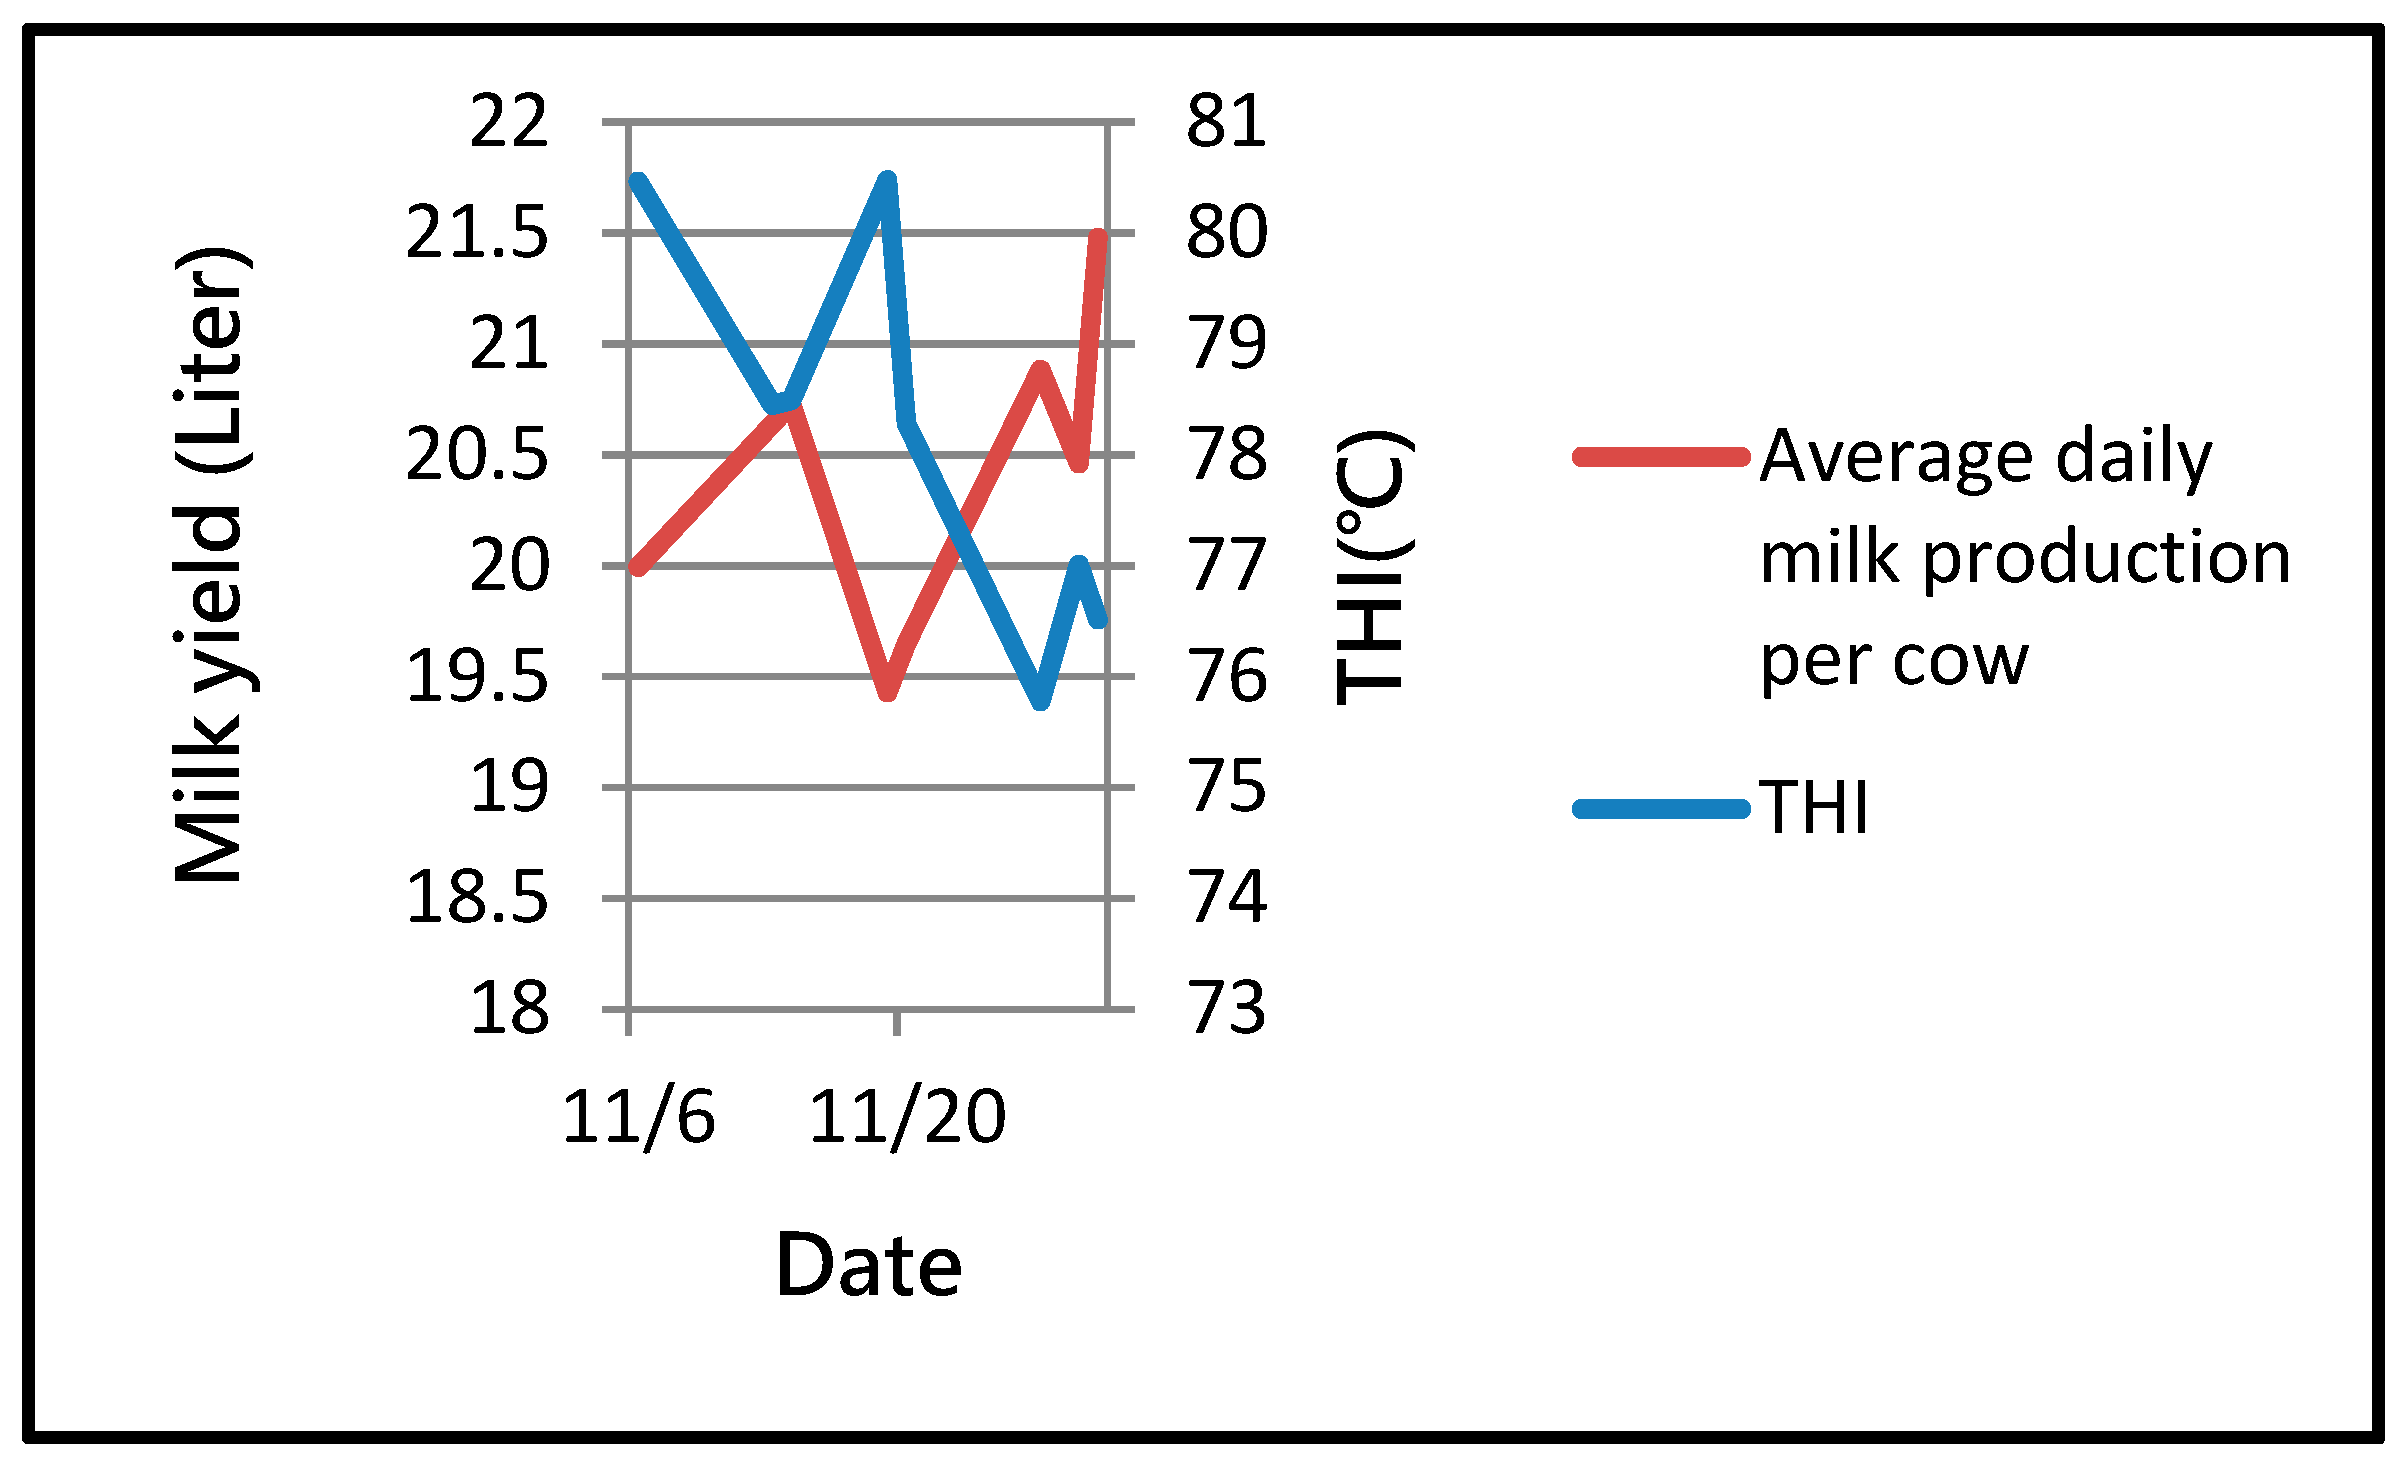
- The Correlation Between Lactation Yield and Apparent Temperature
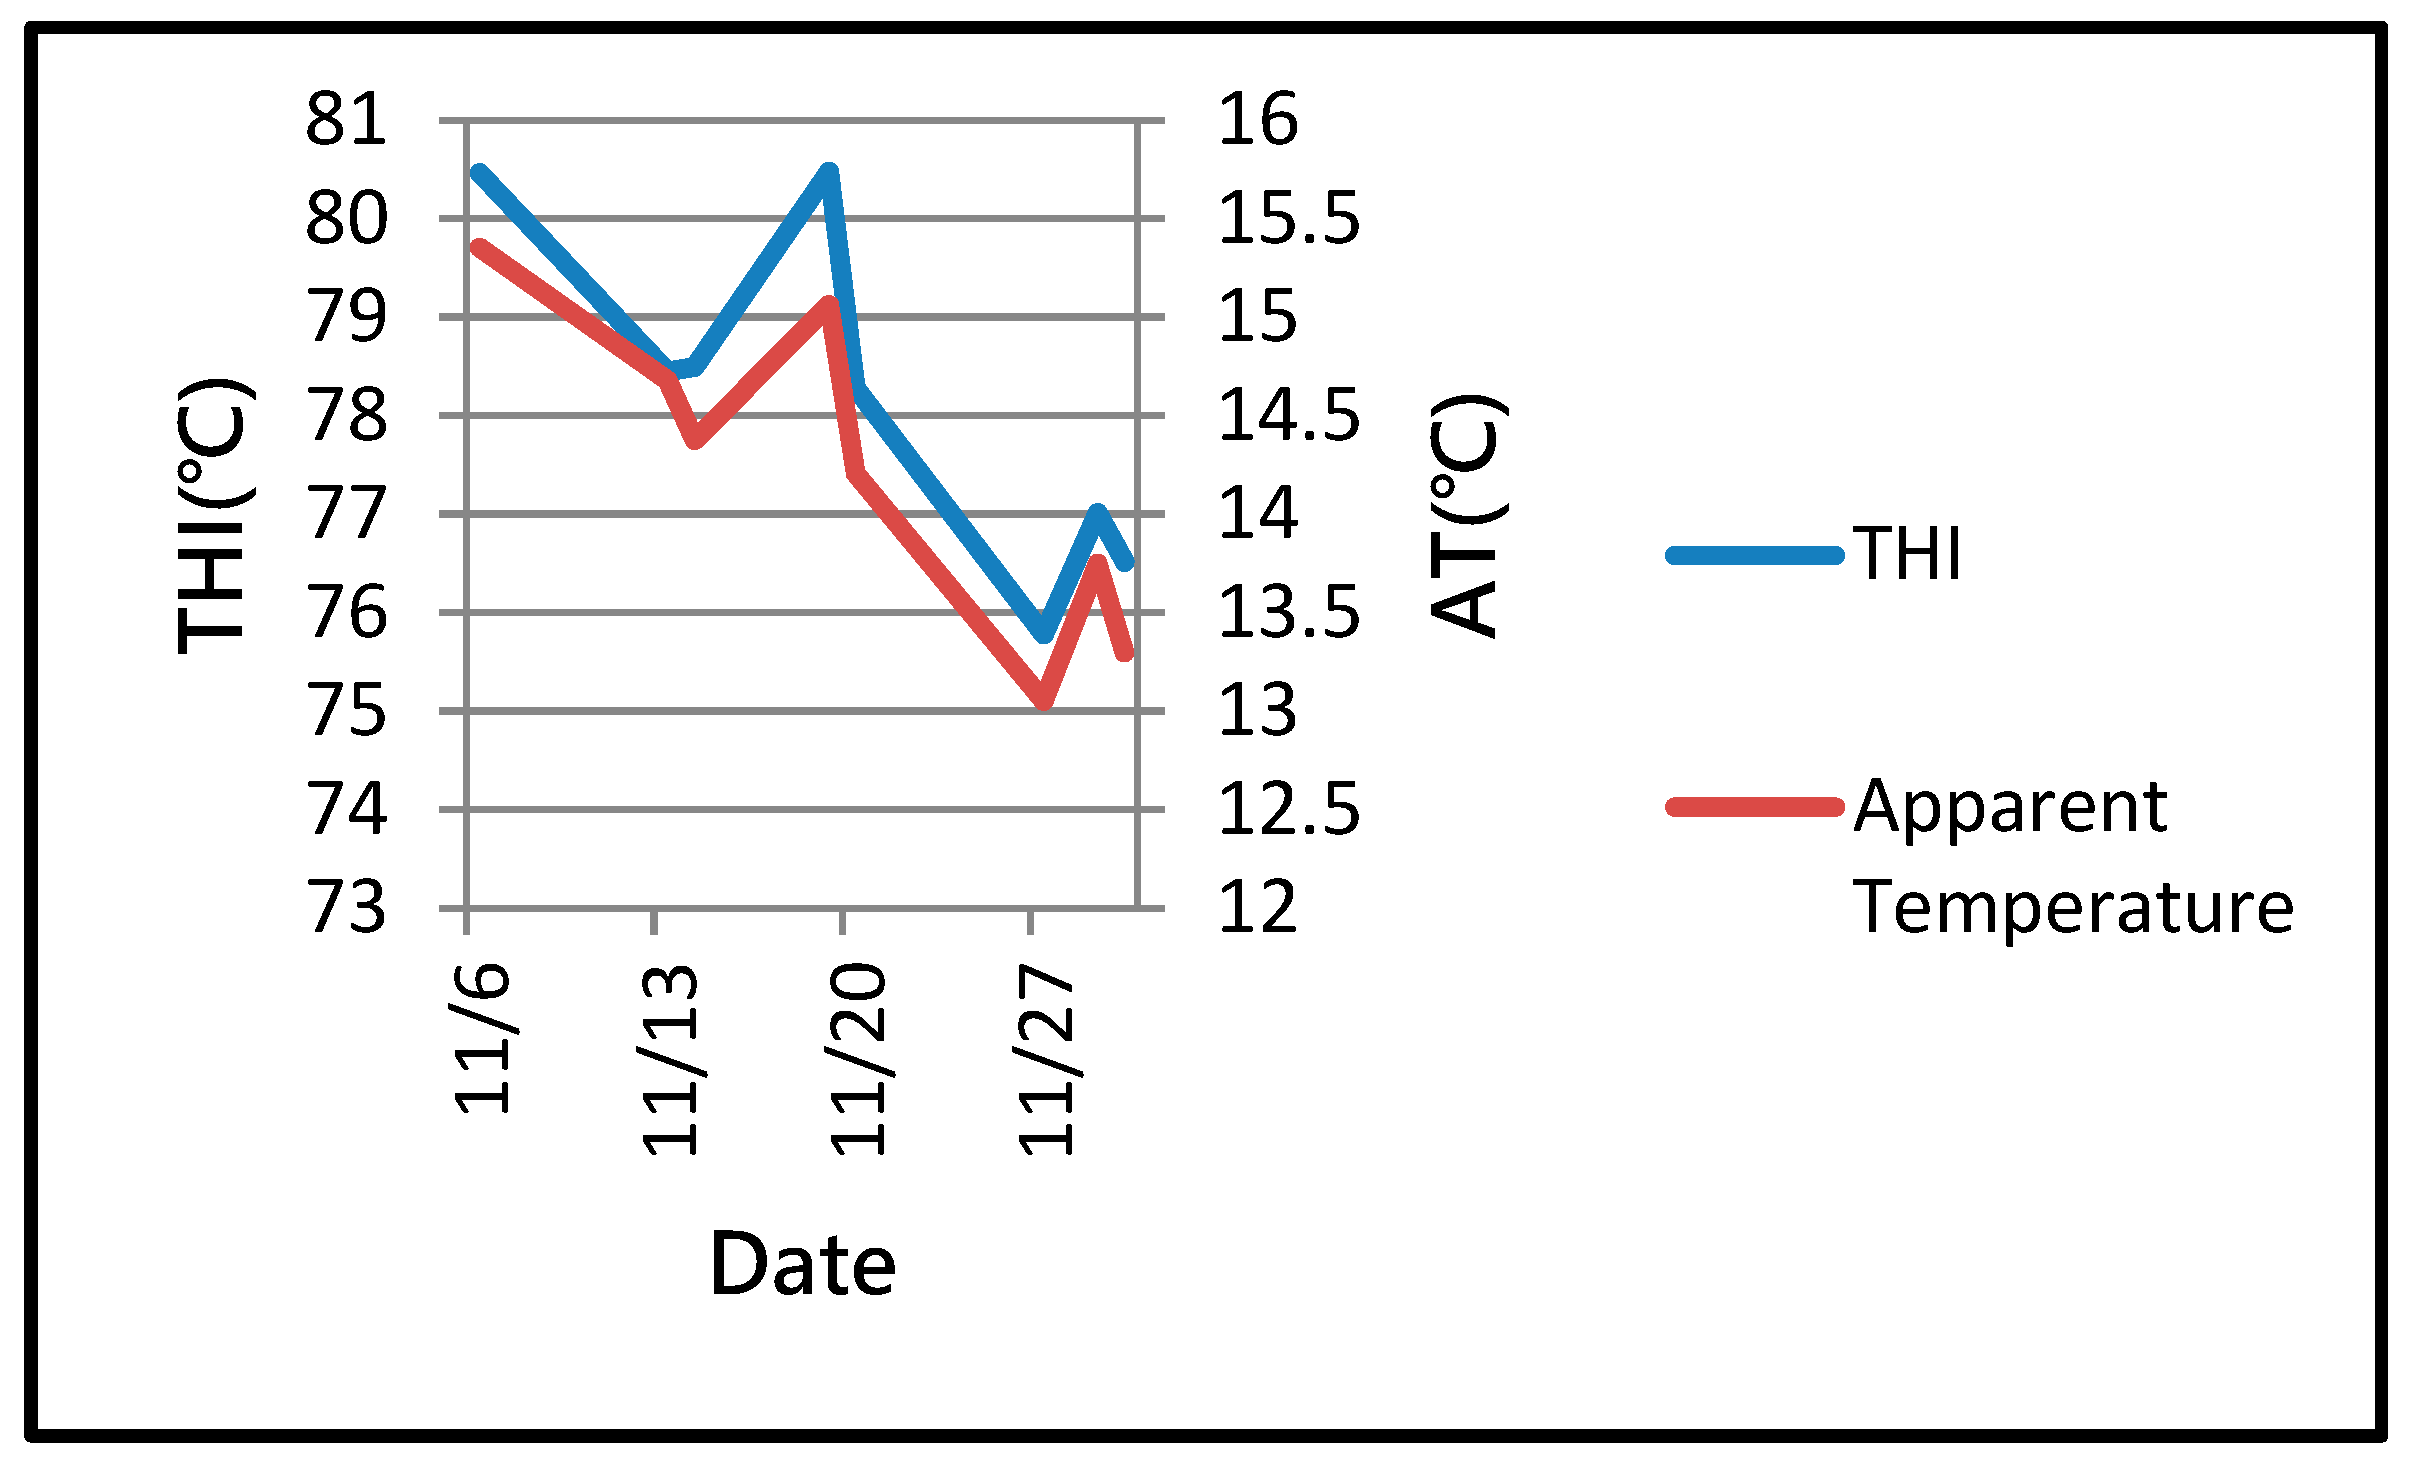
Figure 14 showed similar trends in the temperature-humidity index (THI) and apparent temperature index (AT) of the dairy cows. Under mild heat stress status, the lactation yield decreased as the indexes raised, and vice versa, as shown in Figure 15 and Figure 16. The mathematical correlation between the lactation yield per dairy cow (ymf) and the temperature-humidity index (THI) (yTHIf) was shown in formula (3), and the mathematical correlation between the lactation yield per dairy cow (ymf) and the apparent temperature index (AT) (yATf) was shown in formula (4). Where (yTHIf) is the final value of THI, (yTHIi) is the initial value of THI, (ymi) is a given value of the initial lactation yield per dairy cow, (yAT) is the final value of AT, (yATi) is the initial value of AT, mm is the slope of line of the initial lactation yield per dairy cow, m THI is the slope of THI line, m AT is the slope of AT line.
- 5.
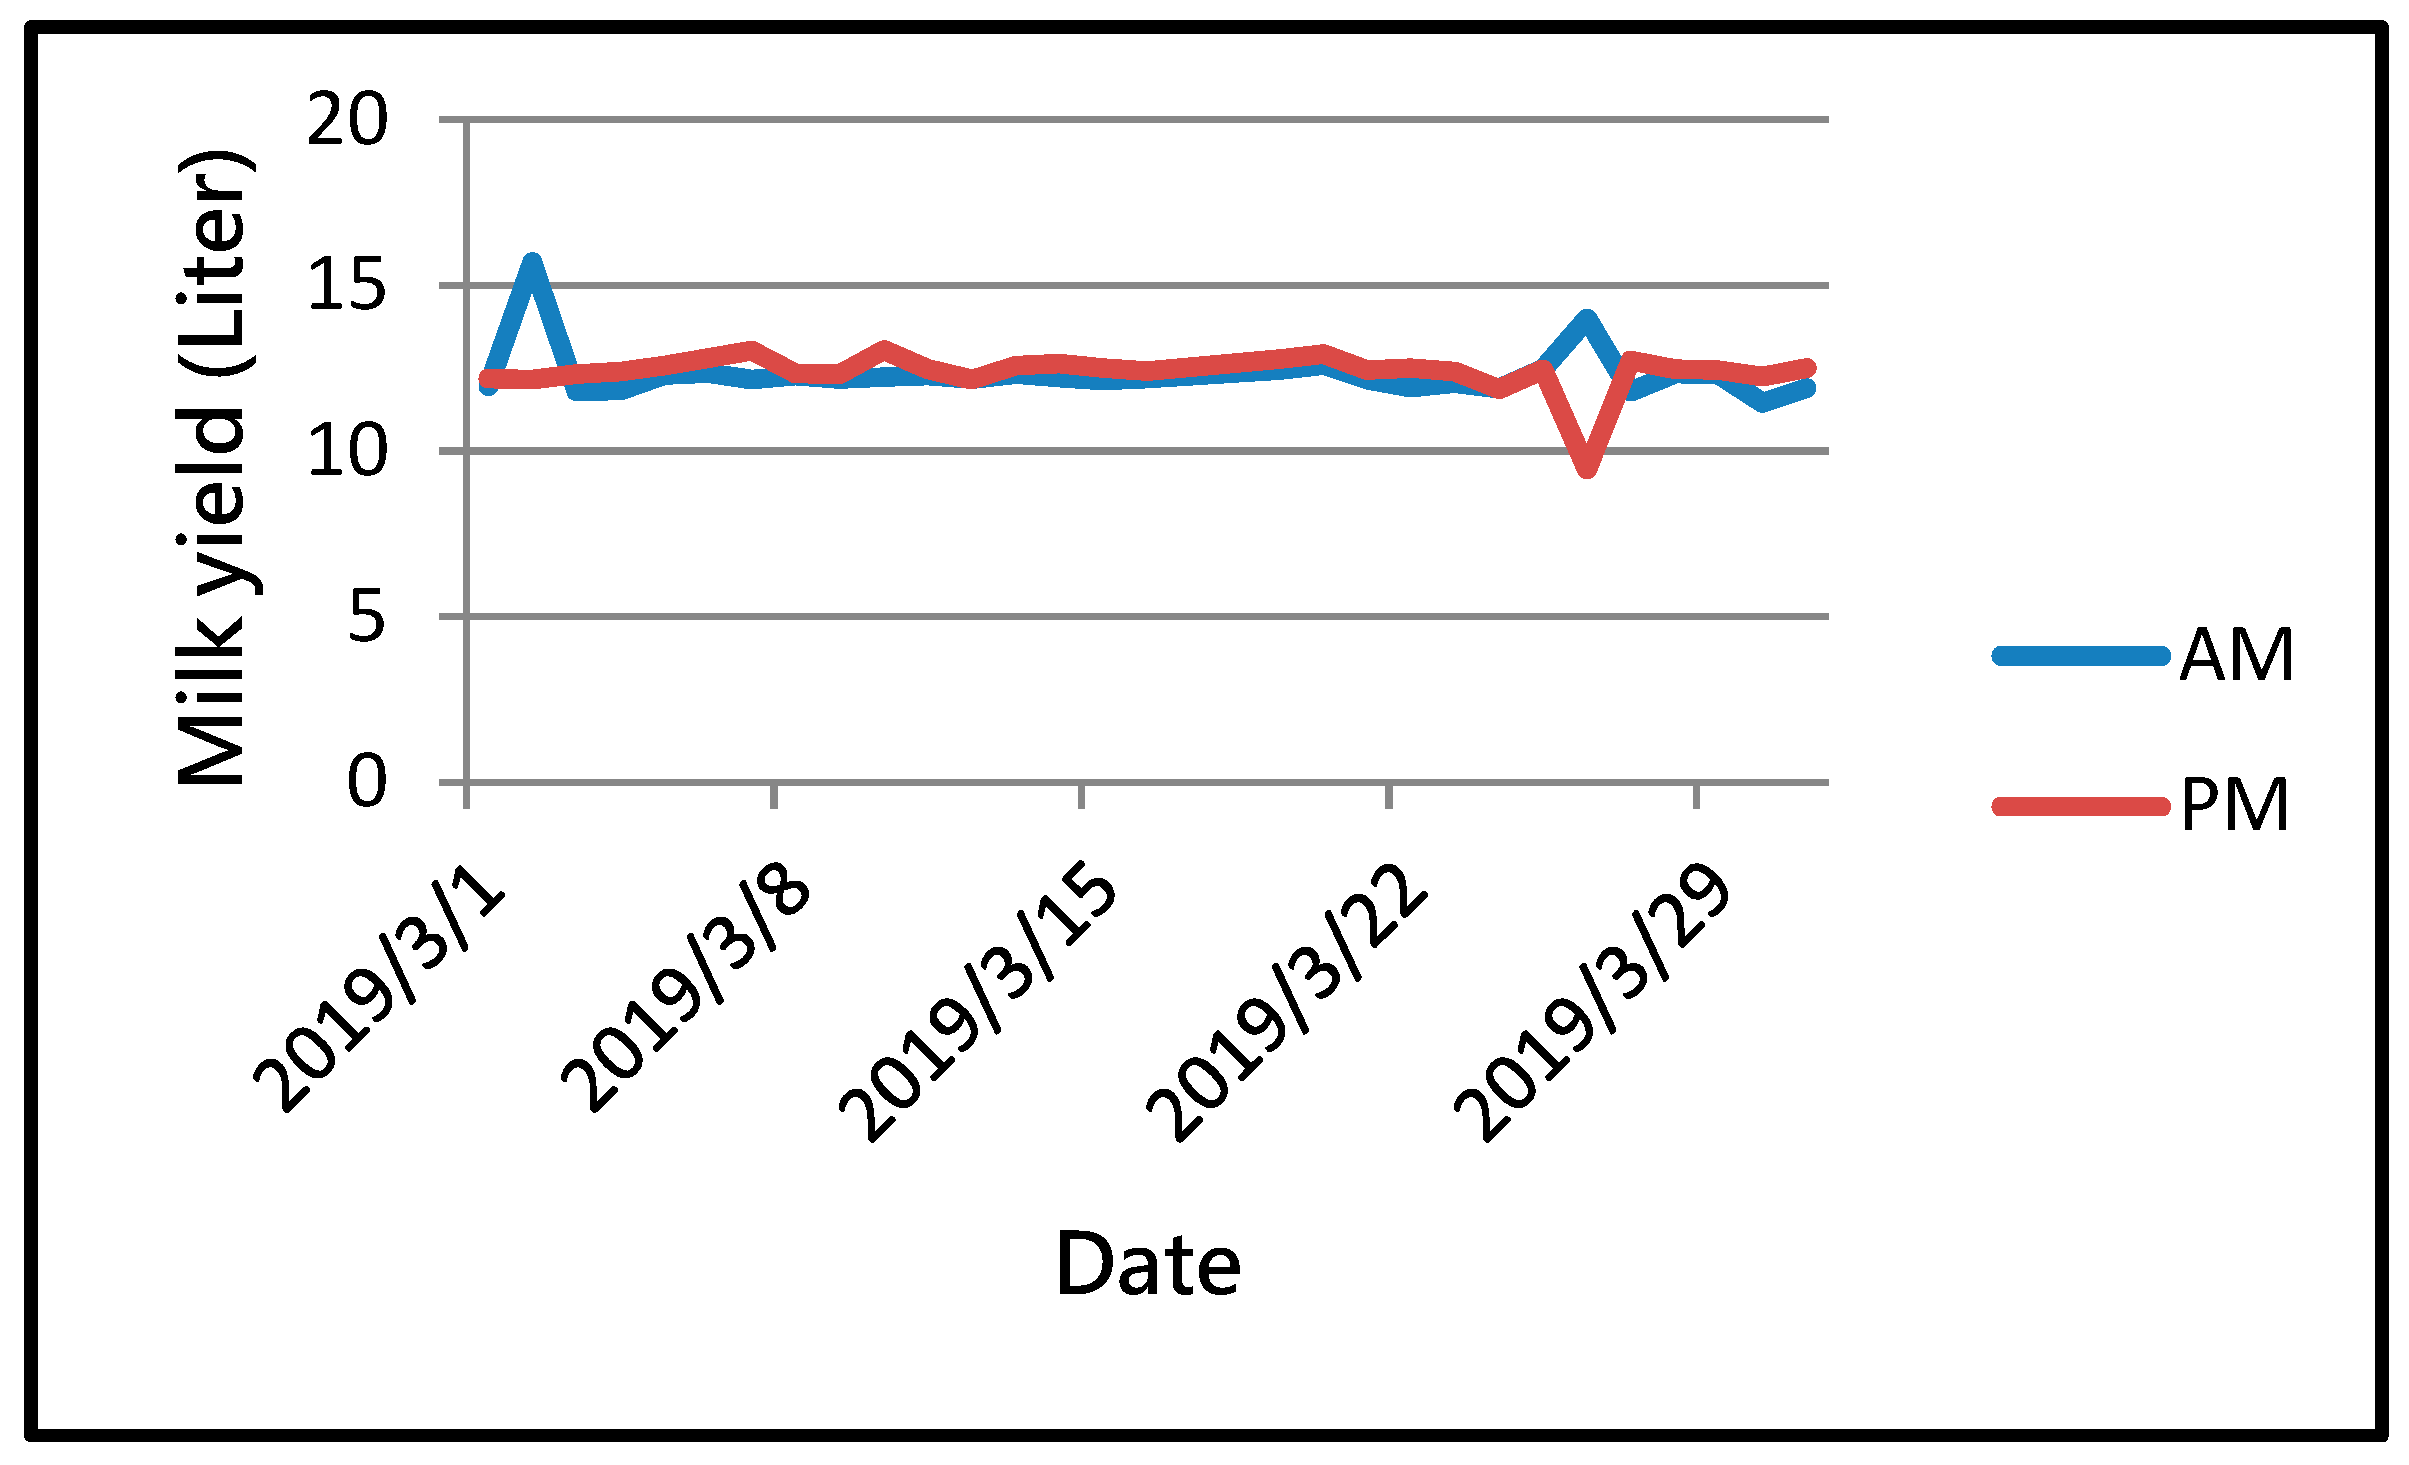
- Differences in Lactation Yield Between Morning and Afternoon
Figure 17 showed that the average lactation yield per dairy cow in the morning was about 0.1354 L/day more than what in the afternoon.
- 6.
- The pig barns were far away from the office, and there were many obstacles such as farmhouses and trees. Though a wireless relay was set up between the pig barns and office, the data retrieving for the environmental status data in pig barns were unstable, especially under bad weather.
5. Conclusions and Prospects
An automatic monitoring system for livestock farms was designed and implemented in this study based on long-term data collection and analysis, and the conclusions of this study have been summarized as follows:
The lactation yields of the Holstein-Friesian cows were found to be significantly correlated to the seasons. Compared to the hot and humid season in August, there was a significant 4.0935 L/day average increase in lactation yield per dairy cow for the cooler season in March. Furthermore, there was a 0.6481 L/day reduction of average lactation yield per dairy cow as the temperature increased about 1 °C under moderate heat stress status. Also, a strike of three-day cold current could cause a 1.0273 L/day reduction of average lactation yield per dairy cow, and a one-day heat stress showed only little impact on the lactation yield.
In addition, the trending of temperature-humidity index (THI) and apparent temperature index (AT) of the dairy cows were pretty much similar. Under mild heat stress status, the lactation yields would decrease as the indexes went up, and vice versa. Therefore, the scheme of the apparent temperature index could also be used to evaluate the physical status of dairy cows.
Under moderate heat stress, the impacts of temperatures on lactation yields were greater than humidity. Therefore, it was necessary to control the environment temperature through adjusting the cooling devices such as fans and water valves to improve the lactation yields of dairy cows under heat stress.
In this experiment, the pig barns were far away from the office, thus the wireless communication was affected by obstacles such as farmhouses and trees which caused instability in the retrieving and transmittance of environmental data. It happened quite often that it was necessary to reset and restart the communication before the signals could be successfully retrieved again. Therefore, we suggest to seriously assess the topography and communication environment prior to selecting appropriate wireless communication method in building the wireless monitoring system. In addition, the selections of sensor types need to put controller compatibility into considerations, so that a stable and accurate monitoring system can be implemented successfully. In the future, the simulation analysis will be studied by the ANSYS HFSS software to obtain the adequate environment for wireless communication. Moreover, we will study the home energy management by optimal analysis approaches as the data collected are rich enough. We also plan to apply the big data for predictive control too.
Author Contributions
C.-S.C. conceived, designed the experiments and wrote the paper; W.-C.C. performed the experiments.
Funding
This research was funded by National Pingtung University of Science and Technology, grant number 1065603-16.
Acknowledgments
We are grateful for the budget support of National Pingtung University of Science and Technology and the assistance of relevant staff in Department of Animal Husbandry and Veterinary.
Conflicts of Interest
The authors declare no conflict of interest.
References
- National Development Council of Taiwan R.O.C. Population Projections for the R.O.C. (Taiwan): 2018~2065, Demographic Fact Book R.O.C.; National Development Council of Taiwan: Taipei, Taiwan, 2018; ISBN 978-986-05-6645-1.
- Park, D.H.; Park, J.W. Wireless Sensor Network-Based Greenhouse Environment Monitoring and Automatic Control System for Dew Condensation Prevention. Sensors 2011, 11, 3640–3651. [Google Scholar] [CrossRef] [PubMed] [Green Version]
- Kevin, K.; Gifford, K.K.; Kuzminsky, S.; Williams, S. An Integrated Architecture for Advanced Environmental and Physiological Monitoring. In Proceedings of the 35th International Conference on Environmental Systems (ICES), Rome, Italy, 11–14 July 2005. [Google Scholar]
- Tzounis, A.; Katsoulas, N.; Bartzanas, T.; Kittas, C. Internet of Things in agriculture, recent advances and future challenges. Biosyst. Eng. 2017, 164, 31–48. [Google Scholar] [CrossRef]
- Potdar, M.; Wani, S. Wireless Sensor Network in Vehicles; SAE Technical Paper 2015-01-0241; SAE International: Troy, NY, USA, 2015. [Google Scholar] [CrossRef]
- Srivastava, J.R.; Sudarshan, T.S.B. Intelligent traffic management with wireless sensor networks. In Proceedings of the 2013 ACS International Conference on Computer Systems and Applications (AICCSA), Ifrane, Morocco, 27–30 May 2013; pp. 1–4. [Google Scholar] [CrossRef]
- Minaie, A.; Sanati-Mehrizy, A.; Sanati-Mehrizy, P.; Sanati-Mehrizy, R. Application of Wireless Sensor Networks in Health Care System. In Proceedings of the 120th ASEE Annual Conference & Exposition, Atlanta, GA, USA, 23–26 June 2013. [Google Scholar]
- Lazarescu, M.T. Design of a WSN Platform for Long-Term Environmental Monitoring for IoT Applications. IEEE J. Emerg. Sel. Top. Circutts Syst. 2013, 3, 45–54. [Google Scholar] [CrossRef] [Green Version]
- Cai, K.; Tie, F.; Huang, H.; Lin, H.; Chen, H. Innovative Experimental Platform Design and Teaching Application of the Internet of Things. iJOE 2015, 11, 28–32. [Google Scholar]
- Wang, J.; Niu, X.; Zheng, L.; Zheng, C.; Wang, Y. Wireless Mid-Infrared Spectroscopy Sensor Network for Automatic Carbon Dioxide Fertilization in a Greenhouse Environment. Sensors 2016, 16, 1941. [Google Scholar] [CrossRef] [PubMed]
- Akkaşa, M.A.; Sokullu, R. An IoT-based Greenhouse Monitoring System with Micaz Motes. Procedia Comput. Sci. 2017, 113, 603–608. [Google Scholar] [CrossRef]
- Akyildiz, I.F.; Melodia, T.; Chowdhury, K.R. A survey on wireless multimedia sensor networks. Comput. Netw. 2007, 51, 921–960. [Google Scholar] [CrossRef] [Green Version]
- Su, Y.S. Establishment of Environment Monitoring System for Plant Factory. Master’s Thesis, Department of Biomechatronic Engineering, National Chiayi University, Chiayi, Taiwan, 2012. [Google Scholar]
- Chen, S.N. The Design of Multi-Platforms Cloud Environmental Control Systems. Master’s Thesis, Department of Biomechatronic Engineering, National Pingtung University of Science and Technology, Neipu, Taiwan, 2013. [Google Scholar]
- Chang, C.L. Design and Implementation of a High-Efficiency and Energy-Saving IoT Platform for Agricultural Applications. Master’s Thesis, Department of Biomechatronic Engineering, National Pingtung University of Science and Technology, Neipu, Taiwan, 2017. [Google Scholar]
- Wang, S.H.; Lee, K.H.; Chen, J.Y.; Chiang, C.C.; Lan, W.W.; Kuo, S.Y.; Chang, C.L. Application of radio frequency identification technology on the management of dairy farm. Taiwan Livestock Res. 2014, 47, 251–260. [Google Scholar]
- Edwards Murphy, F.; Popovici, E.; Whelan, P.; Magno, M. Development of an heterogeneous wireless sensor network for instrumentation and analysis of beehives. In Proceedings of the 2015 IEEE International Instrumentation and Measurement Technology Conference (I2MTC) Proceedings, Pisa, Italy, 11–14 May 2015; pp. 346–351. [Google Scholar]
- Asikainen, M.; Haataja, K.; Toivanen, P. Wireless indoor tracking of livestock for behavioral analysis. In Proceedings of the 2013 9th International Wireless Communications and Mobile Computing Conference, IWCMC, Sardinia, Italy, 1–5 July 2013; pp. 1833–1838. [Google Scholar] [CrossRef]
- Spink, A.; Cresswell, B.; Koelzsch, A.; Langevelde, F.; Neefjes, M.; Noldus, L.; Oeveren, H.; Prins, H.; van der Wal, T.; de Weerd, N.; et al. Animal behaviour analysis with GPS and 3D accelerometers. In Proceedings of the European Conference on Precision Livestock Farming, Leuven, Belgium, 10–12 September 2013; pp. 229–239. [Google Scholar]
- Llario, F.; Sendra, S.; Parra, L.; Lloret, J. Detection and protection of the attacks to the sheep and goats using an intelligent wireless sensor network. In Proceedings of the 2013 IEEE International Conference on Communications Workshops, Budapest, Hungary, 9–13 June 2013; pp. 101–1019. [Google Scholar]
- Parra, L.; Sendra, S.; García, L.; Lloret, J. Design and deployment of low-cost sensors for monitoring the water quality and fish behavior in aquaculture tanks during the feeding process. Sensors 2018, 18, 750. [Google Scholar] [CrossRef] [PubMed]
- Loreti, P.; Catini, A.; Luca, M.D.; Bracciale, L.; Gentile, G.; Natale, C.D. Ultra Low Power Wireless Sensor Network for Pink Iguanas Monitoring. Proceedings 2018, 2, 978. [Google Scholar] [CrossRef]
- Qi, L.; Zhang, J.; Mark, X.; Fu, Z.; Chen, W.; Zhang, X. Developing WSN-based traceability system for recirculation aquaculture. Math. Comput. Modell. 2011, 53, 2162–2172. [Google Scholar] [CrossRef] [Green Version]
- Ugurlu, M.; Teke, B.; Akdag, F.; Arslan, S. Effect of Temperature-Humidity Index, Cold Stress Index and Dry Period Length on Birth Weight of Jersey Calf. Bulgarian J. Agric. Sci. 2014, 20, 1227–1232. [Google Scholar]
- ICP DAS CO., LTD. RFU-400/RFU-433 User Manual; ICP DAS CO.: Hsinshu, Taiwan, 2017. [Google Scholar]
- Mitsubishi CO., LTD.v. FX3S·FX3G·FX3GC·FX3U·FX3UC Series User Manual [MODBUS Communication]; Mitsubishi Electric Corporation: Tokyo, Japan, 2014; pp. 87–113. [Google Scholar]
- Ahirwar, M.K.; Kataktalware, M.; Prasad, K.; Pal, R.P.; Barman, D.; Thul, M.; Rawat, N. Effect of Non-Genetic Factors on Semen Quality in Bulls: A review. J. Entomol. Zool. Stud. 2018, 6, 38–45. [Google Scholar]
- Steadman Robert, G. A universal scale of apparent temperature. J. Climatol. Appl. Meteorol. 1984, 23, 1674–1687. [Google Scholar] [CrossRef]
- Yano, M.; Shimadzu, H. Modelling temperature effects on milk production: a study on Holstein cows at a Japanese farm. Springerplus 2014, 3, 129. [Google Scholar] [CrossRef] [PubMed] [Green Version]
- Summer, A.; Lora, I.; Formaggioni, P.; Gottardo, F. Impact of heat stress on milk and meat production. Anim. Front. 2018, 9, 39–46. [Google Scholar] [CrossRef]
- West, J.W. Effects of Heat-Stress on Production in Dairy Cattle. J. Dairy Sci. 2003, 86, 2131–2144. [Google Scholar] [CrossRef]
- Joksimović-Todorović, M.; Davidović, V.; Hristov, S.; Stanković, B. Effect of Heat Stress on Milk Production in Dairy Cows. Biotechnol. Anim. Husb. 2011, 27, 1017–1023. [Google Scholar] [CrossRef]
Figure 1.
(a) The aerial photo of livestock farm; (b) The floor plan of dairy farm.


Figure 2.
The floor plan of experimental device in dairy housing. Where A is wind speed sensors (A1,A2,A3,A4), F is fans (F1,F2,… F14), I represents illuminance sensors (I1,I2,I3,I4), M denotes the humidity sensors (M1,M2), T is temperature sensors (T1,T2), D denotes distribution box.
Figure 2.
The floor plan of experimental device in dairy housing. Where A is wind speed sensors (A1,A2,A3,A4), F is fans (F1,F2,… F14), I represents illuminance sensors (I1,I2,I3,I4), M denotes the humidity sensors (M1,M2), T is temperature sensors (T1,T2), D denotes distribution box.

Figure 3.
The flow chart of experimental hardware architecture.

Figure 4.
Experimental software architecture diagram.

Figure 5.
Experimental design plan.

Figure 6.
Experimental circuit wiring diagram for programmable logic controller (PLC) in dairy housing.
Figure 6.
Experimental circuit wiring diagram for programmable logic controller (PLC) in dairy housing.

Figure 7.
Experimental circuit wiring diagram for programmable logic controller (PLC) in piggery farm.
Figure 7.
Experimental circuit wiring diagram for programmable logic controller (PLC) in piggery farm.

Figure 8.
Application of RFU-400.

Figure 9.
The data from different sensors were displayed in the human-machine interface (HMI).

Figure 10.
THI and average daily lactation yield per cow in March.

Figure 11.
THI and average daily lactation yield per cow in August.

Figure 12.
Temperature and average daily lactation yield per cow in moderate heat stress.

Figure 13.
Humidity and average daily lactation yield per cow in moderate heat stress.

Figure 14.
The trends of THI and Apparent Temperature in November.

Figure 15.
Apparent Temperature and average daily lactation yield per cow in November.

Figure 16.
THI and average daily lactation yield per cow in November.

Figure 17.
The average lactation yield per dairy cow in the morning and afternoon.


Table 1.
Experimental hardware device in office listed.
| Device name (product model) | Supplier |
|---|---|
| PLC 1 (FX3U-32MR) | Mitsubishi Electric CO., Tokyo Japan |
| Left communication module (FX3U-485ADP-MB) | Mitsubishi Electric CO., Tokyo Japan |
| HMI 2 (EC210-CT1H) | Shihlin Electric CO., Taipei Taiwan |
| Wireless modem (RFU-400) | ICP DAS CO., Hsinshu Taiwan |
| PC 3 (DESKTOP - R8C395T) | ASUS CO., Taipei Taiwan |
1 PLC, Programmable Logic Controller; 2 HMI, Human Machine Interface; 3 PC, Personal Computer.
Table 2.
Experimental hardware in cowshed device listed.
| Device name (product model) | Supplier |
|---|---|
| PLC 1 (FX3U-32MR) | Mitsubishi Electric CO., Tokyo Japan |
| Left communication module (FX3U-485ADP-MB) | Mitsubishi Electric CO., Tokyo Japan |
| Wireless modem (RFU-400) | ICP DAS CO., Hsinshu Taiwan |
| Temperature & humidity sensor (EYC-THS307) | YUDEN-TECH CO., New Taipei Taiwan |
| Aviation plug - Wind speed sensor (CWS-013A) | JETEC Electronics CO., Taipei Taiwan |
| Photo sensor (LXT-401S) | Rixen Technology CO., New Taipei Taiwan |
1 PLC, Programmable Logic Controller.
Table 3.
Classification of zones based on temperature humidity index (THI) values in cattle with THI model [27].
Table 3.
Classification of zones based on temperature humidity index (THI) values in cattle with THI model [27].
| THI | Stress Level | Symptoms in Cattle |
|---|---|---|
| THI 1 < 72 | None | Optimum productive and reproductive performance |
| 72 ≤ THI < 79 | Mild | Dairy cows seek for shade, increase inrespiration rate and dilation of blood vessels |
| 80 ≤ THI < 89 | Moderate | Increase in respiration rate and saliva secretion. Reduction in feed intake and water consumption. Body temperature is increased and reproductive performances are severely affected in cattle |
| 90 ≤ THI < 98 | Severe | There is rapid increase in respiration and excessive saliva production. The reproductive performances in animals are significantly decreased |
1 THI, Temperature-Humidity Index.
© 2019 by the authors. Licensee MDPI, Basel, Switzerland. This article is an open access article distributed under the terms and conditions of the Creative Commons Attribution (CC BY) license (http://creativecommons.org/licenses/by/4.0/).
Share and Cite
MDPI and ACS Style
Chen, C.-S.; Chen, W.-C. Research and Development of Automatic Monitoring System for Livestock Farms. Appl. Sci. 2019, 9, 1132. https://doi.org/10.3390/app9061132
AMA Style
Chen C-S, Chen W-C. Research and Development of Automatic Monitoring System for Livestock Farms. Applied Sciences. 2019; 9(6):1132. https://doi.org/10.3390/app9061132
Chicago/Turabian StyleChen, Chin-Shan, and Wei-Cheng Chen. 2019. "Research and Development of Automatic Monitoring System for Livestock Farms" Applied Sciences 9, no. 6: 1132. https://doi.org/10.3390/app9061132
Note that from the first issue of 2016, this journal uses article numbers instead of page numbers. See further details here.