Seismic Response of High-Rise Buildings Equipped with Base Isolation and Non-Traditional Tuned Mass Dampers


1
Faculty of Civil Engineering, Semnan University, 35131-19111 Semnan, Iran
2
Faculty of Engineering, I. Azad University, 36199-43189 Shahrood, Iran
3
Faculty of Civil and Environmental Engineering, Gdansk University of Technology, 80-233 Gdansk, Poland
*
Author to whom correspondence should be addressed.
Appl. Sci. 2019, 9(6), 1201; https://doi.org/10.3390/app9061201
Submission received: 7 February 2019
/
Revised: 16 March 2019
/
Accepted: 18 March 2019
/
Published: 21 March 2019
(This article belongs to the Section Environmental Sciences)
Abstract
:One of the methods in structural control is the application of combinational control systems in order to reduce the response of structures during earthquakes. The aim of the present paper is to verify the effectiveness of a hybrid control strategy, combining base isolation and non-traditional tuned mass dampers (TMDs) (i.e., TMDs with dashpots directly connected to the ground) in suppressing structural vibrations of high-rise buildings. The study was conducted for structures with a different number of stories exposed to various far-field and near-field earthquake records. Multi degree-of-freedom models of buildings as well as non-linear models of the base isolation system were employed in the analysis. The results of the study clearly confirmed that the response of high-rise buildings during earthquakes could be significantly reduced using base isolation devices and non-traditional TMDs. They showed also that the effectiveness in suppressing structural vibrations substantially depends on the type of the control system used. The influence of the base isolation in the reduction of structural response under different earthquake records was much larger than the influence of non-traditional TMDs. In the case of buildings analyzed in the study, the application of TMDs alone resulted in a reduction not larger than 20%, as compared to the response without any system. On the other hand, the response of buildings equipped with only base isolation devices was reduced by more than 70% under different ground motions. However, the largest reductions (larger than 80%) were obtained for the cases when both control systems (base isolation and non-traditional TMDs) were used simultaneously.
1. Introduction
Earthquakes are considered to be the most dangerous and unexpected loads causing much damage to civil engineering structures in a wide variety of ways [1,2,3,4,5]. Different ideas regarding earthquake reinforcement design were significantly advanced in order to improve structural behavior during ground motions. This is especially important in the case of fire stations, hospitals, and other buildings, in order to secure their functionality after the seismic event. Therefore, traditional designs are replaced with modern schemes and new solutions are proposed. From this point of view, the possibility of employing techniques to control structural vibrations is one of the proper directions to be taken. Energy attenuating systems, different types of dampers as well as base isolation devices can be used for such purposes to prevent buildings from possible damages by reducing the structural response during earthquakes [1,6,7,8,9].
Seismic isolation is a method capable of reducing the accelerations and relative displacements of a building by separating it from the horizontal components of the earth movements and creating a system with a predominant frequency much smaller than earthquake frequencies [10,11,12]. In the base-isolated buildings, the period and attenuation of the first natural mode of the structure is mainly dependent on the isolation system characteristics [13,14]. If the isolation devices are designed properly, the relative displacements between the stories are relatively low and the seismic behavior of the structure is mainly dominated by the first natural vibration mode [15]. Different approaches have been applied in the past, including rollers, sand layers, elastomeric bearings, etc., to attain the idea of base isolation [15]. For example, Lashkari and Kircher [16] studied the seismic response of 31 isolated models with different periods and attenuation ratios by static methods and time history dynamic analysis. The study considered the proposed formula of SEAOC/UBC (Structural Engineers Association of California/Uniform Building Code) with the bi-linear hysteric model of an isolation system for the case of hard and medium rocky soils. Constantinou et al. [17] evaluated the regulations of SEAOC/UBC considering the superstructure of the base-isolated structure to be elastic. Kelly [18] conducted extensive investigations on base-isolated structures. Lin et al. [19] studied the vibrational base isolation system with controllable stiffness. Falborski et al. [20,21,22] investigated the seismic response of base-isolated structures equipped with polymeric bearings. Most recently, a number of researchers focused their studies on a better description of the responses of base-isolated structures. Rezaei Rad and Banazadeh [23] assessed the behavior of base-isolated steel structures subjected to far-field earthquakes using the probabilistic risk-based performance approach. Moreover, Nakai et al. [24] investigated changes in stiffness of the base-isolated layer and the superstructure of the high-rise seismic isolated building with respect to different levels of seismic excitation amplitude. Furthermore, Du et al. [25] proposed the simplified method of modal evaluation of base-isolated high-rise structures considering the soil–structure interaction effects.
Tuned mass dampers (TMDs) are also often employed as one of the most effective passive control approaches in the case of high-rise buildings [1,7,26]. The method is characterized by the use of relatively small mass-spring-dashpot systems calibrated to be in resonance with a particular mode of structural vibration. TMDs are usually installed on the roofs of buildings. They are effective in reducing wind-induced vibrations as well as vibrations induced by the activity of occupants. The application of TMDs for the seismic protection of buildings is also often considered. TMDs are capable of significantly reducing the dynamic response of linear structures without any need for external power sources or sophisticated hardware. Moreover, the strategy is based on the principle of energy attenuation in the form of oscillation of the mass damper and the creation of mass inertial force in the opposite phase of the applied force to the building. Due to the uncertainty in earthquake prediction and the dynamic features of the structure, such as natural frequencies and the attenuation of different vibration modes, it is often recommended to use more mass dampers with close vibrational frequencies in order to cover vast ranges of main frequencies of the structure [1]. In the case of high-rise buildings, the contribution of higher modes is also important; therefore, the damper tuned only to the first natural vibration mode may lose its effectiveness. In addition, when the structure is exposed to severe earthquakes and it enters the non-linear range, its stiffness is changed which can result in the situation where the damper is not tuned and its efficiency is then lost. Moreover, for medium to hard soils, TMDs should be tuned to the natural frequency of the soil–structure system, and not to the structure alone [7,27]. The research on TMDs has been much advanced. Lin et al. [28] and Pinkaew et al. [29] confirmed the efficiency of the method in suppressing structural translational vibrations. Ahlawat and Ramaswamy [30] introduced a new layout for 4 TMDs to control the torsional mode of a building in addition to its translational mode. Sladek and Klingner [31] investigated the effectiveness of TMDs in controlling the response of a non-linear 25-story structure under the El Centro earthquake. Bernal [32] studied the performance of a building equipped with TMDs exposed to the excitation time history of the Mexico City earthquake.
The new idea of a hybrid control strategy combining base isolation and non-traditional TMDs (i.e. TMDs with dashpots directly connected to the ground) has recently been proposed and analyzed by Xiang and Nishitani [33]. They applied a relatively simple numerical model by modelling the superstructure as a single degree-of-freedom system and assuming the linear elastic behavior of the base isolation. Although the results obtained from the study are very promising, further analyses using more detailed structural models are needed in order to confirm the effectiveness of the method. Therefore, the aim of the present paper is to investigate the effectiveness of using base isolation and non-traditional TMDs in suppressing structural vibrations of high-rise buildings with a different number of stories under various far-field and near-field earthquake records applying multi degree-of-freedom models of buildings and assuming a non-linear model of the base isolation system.
2. Materials and Methods
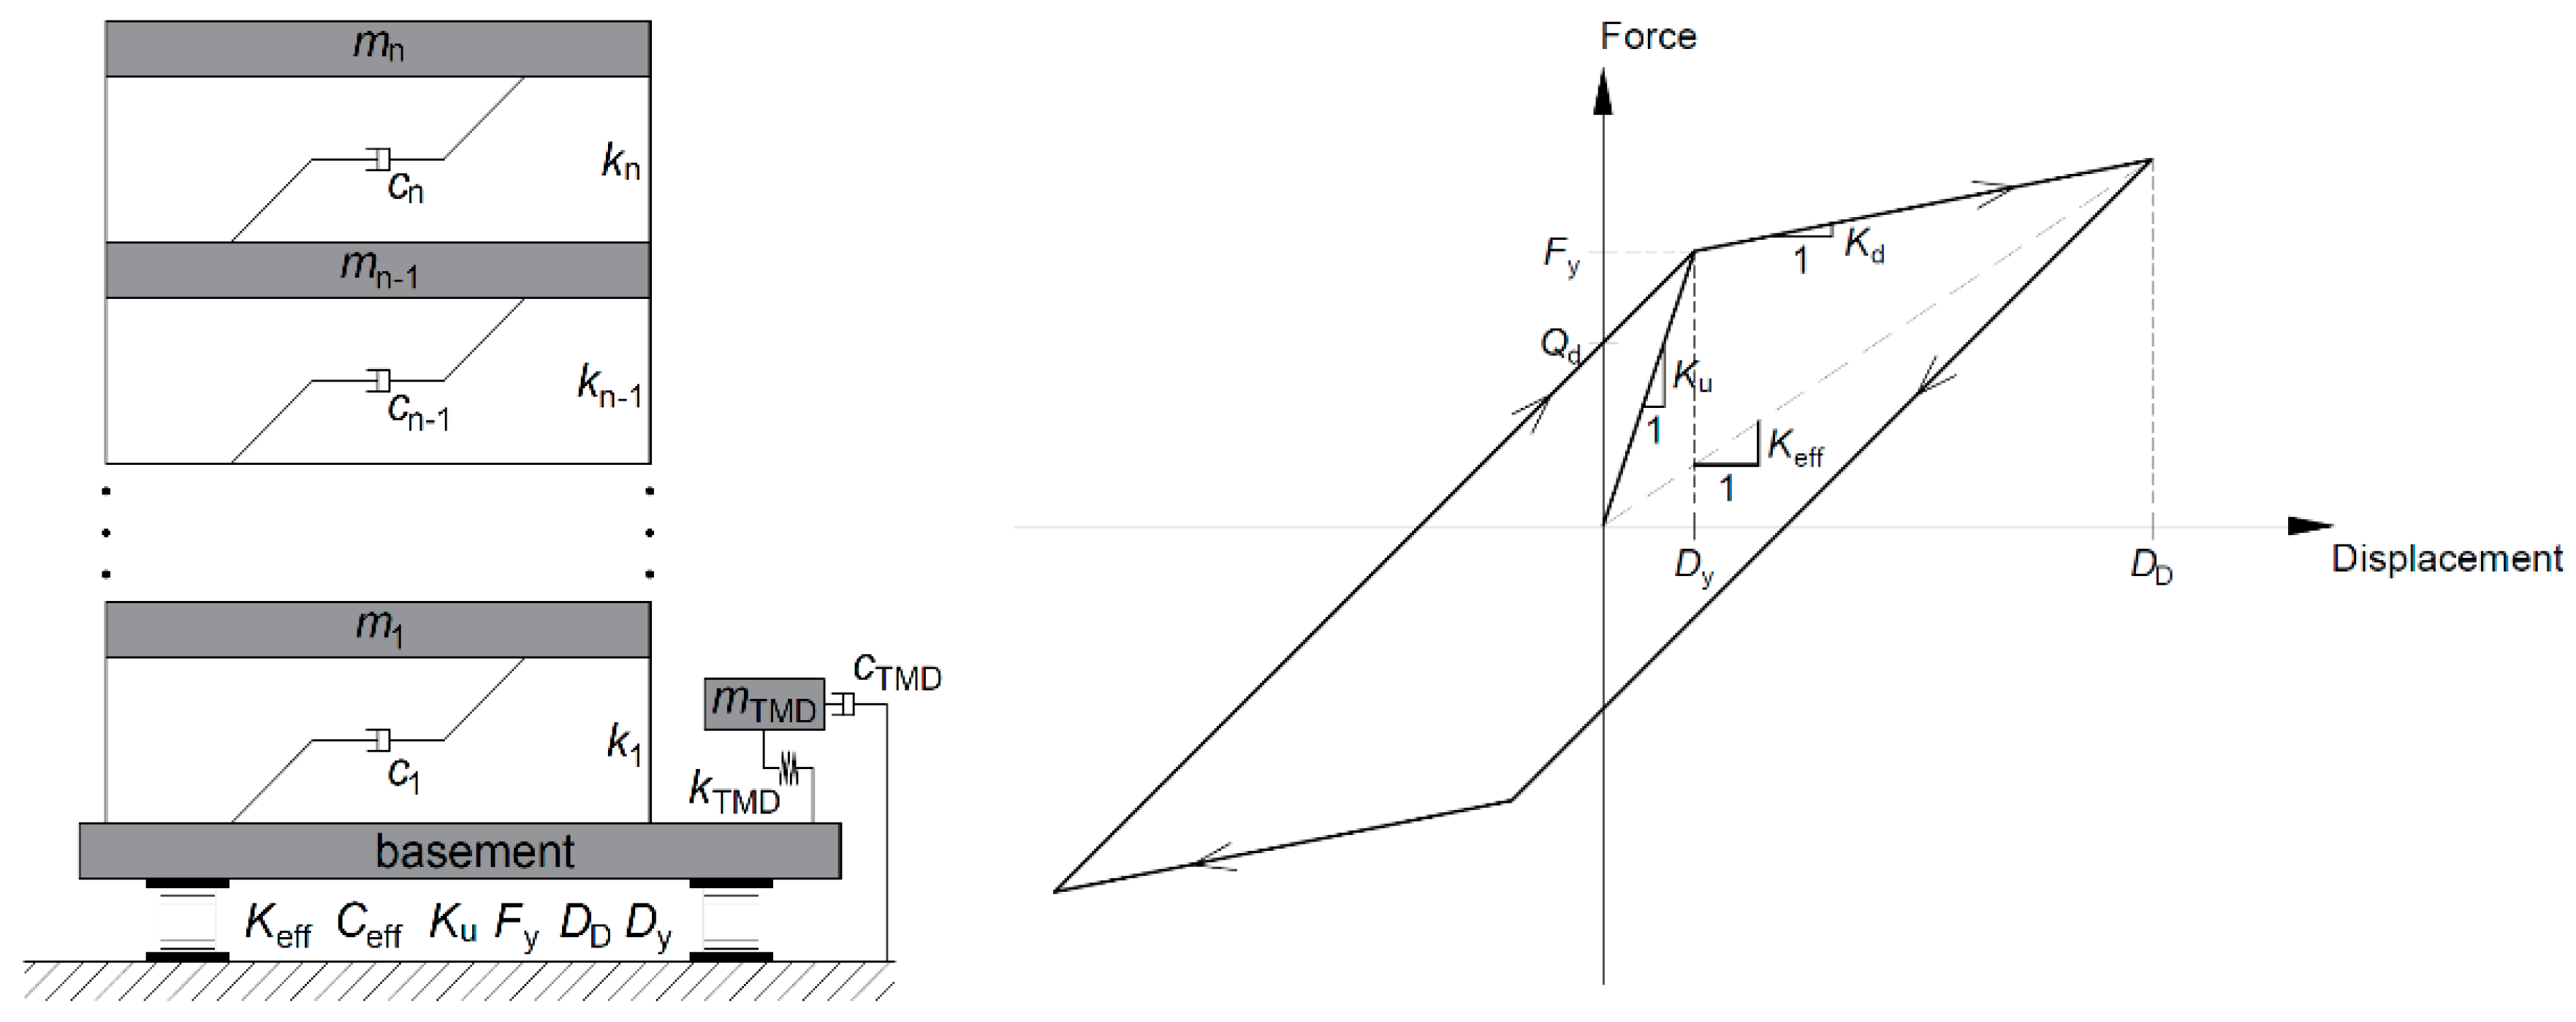
The study focused on the seismic response of buildings with 5, 10, 15, and 20 stories. The detailed multi degree-of-freedom numerical model of each structure, with the mass of each story lumped at the floor level (Figure 1), was created based on the structural parameters used in [33]. Additionally, the bi-linear model of isolation devices (Figure 1), in the form of high-damping rubber bearings, was employed [34]. Specifications of models of buildings equipped with seismic isolation devices are shown in Table 1 (compare [33,34]). The model of the base isolation system is characterized by the following parameters: effective stiffness (Keff), effective damping (Ceff), initial stiffness (Ku), yield force (Fy), design displacement (DD) and yield displacement (Dy), and effective period (Teff). The non-traditional TMDs were considered in the analysis. These control devices are characterized by a significant reduction of the stroke length, in comparison with the traditional TMDs [33]. As a result of previous analyses, the non-traditional TMDs were proposed and confirmed as much better cooperators with base-isolated structures in hybrid control systems [33]. It should be added that the effectiveness of the devices depends on how much of the passive force is added, compared to the effect of seismic isolators on which the building is resting. Thus, the effectiveness of the added TMDs can be somehow modified by changing the proportion of their contribution. A different number of non-traditional TMDs (1, 4, and 8) was considered in the study. Each TMD was modelled as the single degree-of-freedom system with spring connected to the base of building and dashpot directly connected to the ground (see [33] for details). It should be underlined that such a location of TMDs does not require any special arrangements [33]. Specifications of non-traditional TMDs for different computational cases are presented in Table 2. The TMD models are defined by three parameters: mass (MTMD), stiffness (KTMD), and damping (CTMD).
It should be underlined that the analyzed structures were designed based on the provisions of several standards. The Iranian National Building Code [35] and the Iranian code of practice for seismic resistance design of buildings (Standard no. 2800) [36] were used for gravity and seismic loads. Moreover, Standard no. 2800 and the Uniform Building Code, 1994 Edition (UBC-94) [37] were applied for the calculation and equalization of seismic parameters. Finally, the structural elements were analyzed using the Load and Resistance Factor Design (LRFD) method, in accordance with IBC 2006 [38] recommendations. Satisfying the requirements for two categories of the limit states (strength and serviceability) has unequivocally confirmed that the structural elements of buildings were correctly designed.
The numerical investigations were carried out using SAP2000 computational software (CSI, Computers and Structures Inc., v10, CSI, Berkeley, CA, USA). In order to conduct the non-linear time history dynamic analyses, 14 ground motion records were utilized (Table 3). For comparison purposes, all records were scaled to attain the peak acceleration value of 0.5 g, which resulted in the peak ground velocity variation from 13.67 to 95.38 cm/s. The seismic response was calculated in accordance with the time-stepping Newmark method ([39]). Based on the preliminary computations, the time step of 0.01 s was found to be small enough to satisfy the numerical stability and accuracy conditions during the conducted analyses. Therefore, this time step was applied in the time history dynamic analysis.
3. Results
Two passive control systems (seismic isolation and non-traditional TMDs), as well as their combinations, were investigated in the study focused on the behavior of 5, 10, 15, and 20-story buildings under various seismic excitations. A large number of results for different ground motions cases were obtained. Due to the limitation of space, the representative examples are presented in the paper. The examples of the results are shown in Figure 2, Figure 3, Figure 4, Figure 5, Figure 6, Figure 7, Figure 8, Figure 9, Figure 10, Figure 11, Figure 12, Figure 13, Figure 14, Figure 15 and Figure 16 (for the case of the 10-story building) and in Figure A1, Figure A2, Figure A3, Figure A4, Figure A5, Figure A6, Figure A7, Figure A8, Figure A9, Figure A10, Figure A11, Figure A12, Figure A13, Figure A14, Figure A15, Figure A16, Figure A17, Figure A18, Figure A19, Figure A20, Figure A21, Figure A22, Figure A23, Figure A24, Figure A25, Figure A26, Figure A27, Figure A28, Figure A29, Figure A30, Figure A31, Figure A32, Figure A33 and Figure A34 in Appendix A (for the case of the 5, 15, and 20-story buildings). In particular, Figure 2, Figure 3, Figure 4, Figure 5, Figure 6 and Figure 7 and Figure A1, Figure A2, Figure A3, Figure A4, Figure A5, Figure A6, Figure A7, Figure A8, Figure A9, Figure A10, Figure A11 and Figure A12 show the acceleration time histories of the top stories of the high-rise structures exposed to different earthquakes. The peak story moments for the different stories of the buildings are presented in Figure 8, Figure 9, Figure 10, Figure 11, Figure 12 and Figure 13 and Figure A13, Figure A14, Figure A15, Figure A16, Figure A17, Figure A18, Figure A19, Figure A20, Figure A21, Figure A22, Figure A23, Figure A24, Figure A25, Figure A26, Figure A27 and Figure A28. Finally, Figure 14, Figure 15 and Figure 16 and Figure A29, Figure A30, Figure A31, Figure A32, Figure A33 and Figure A34 show the drift ratios for various stories of the high-rise structures.
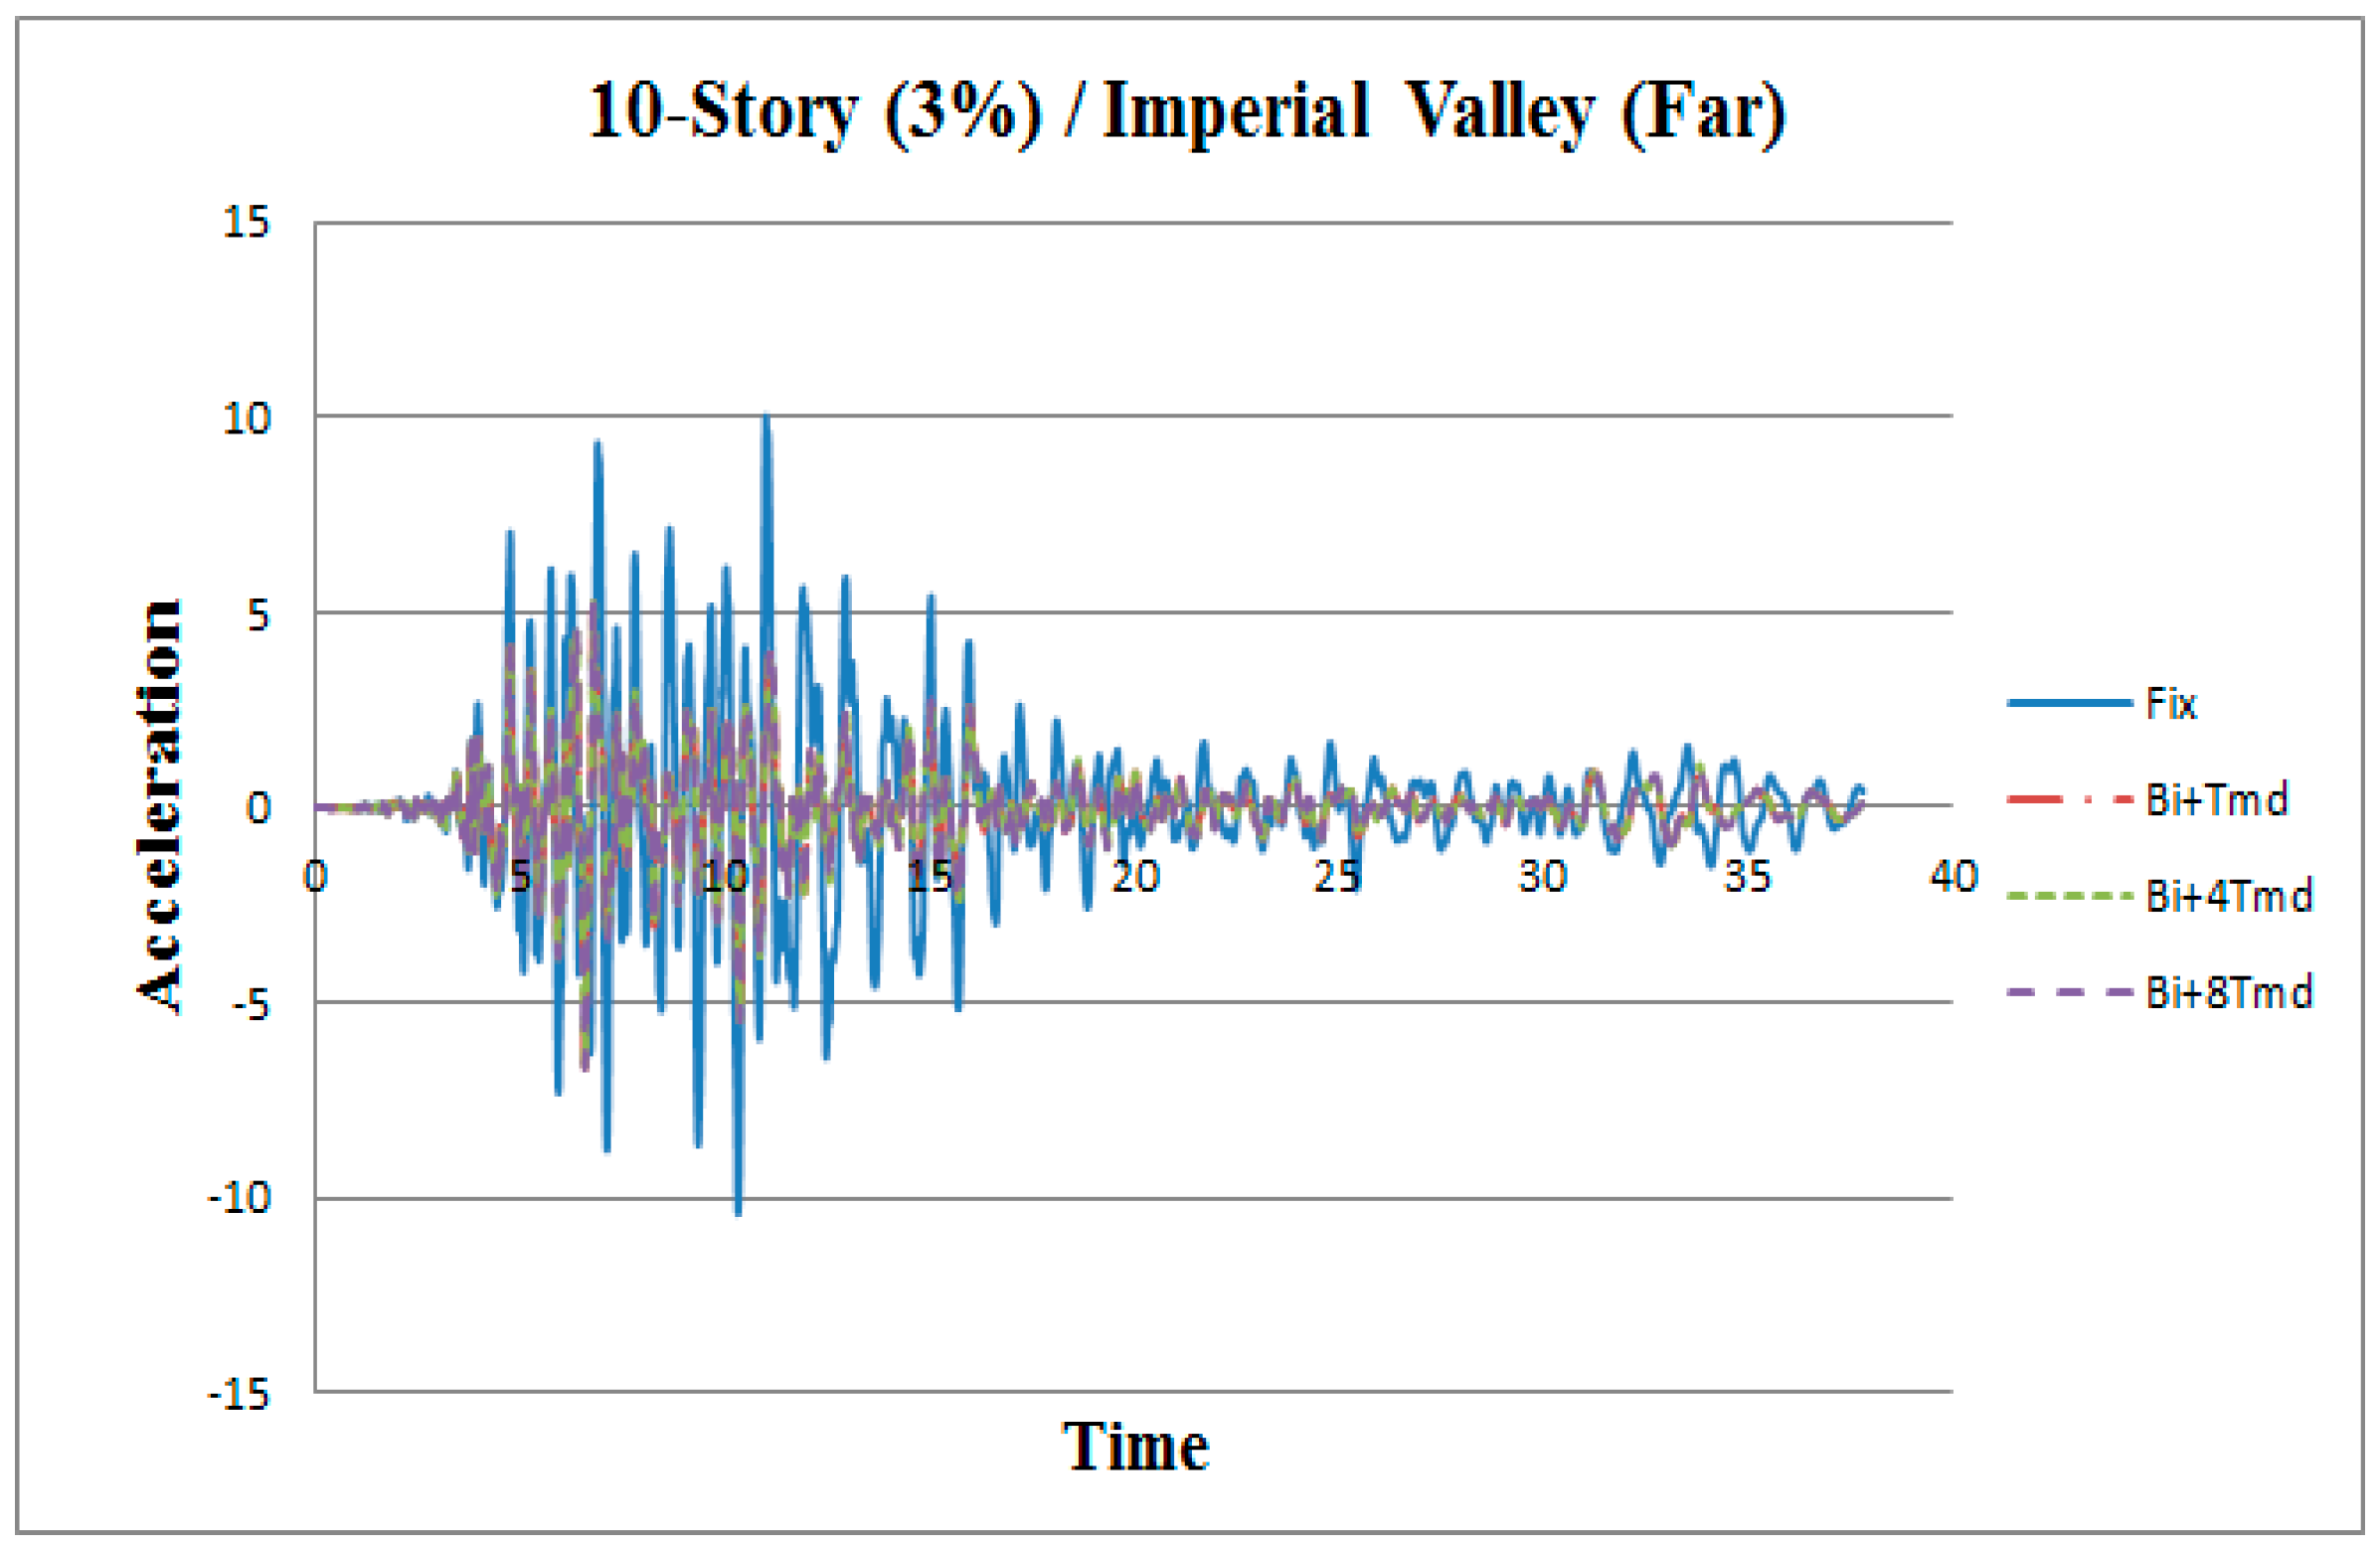
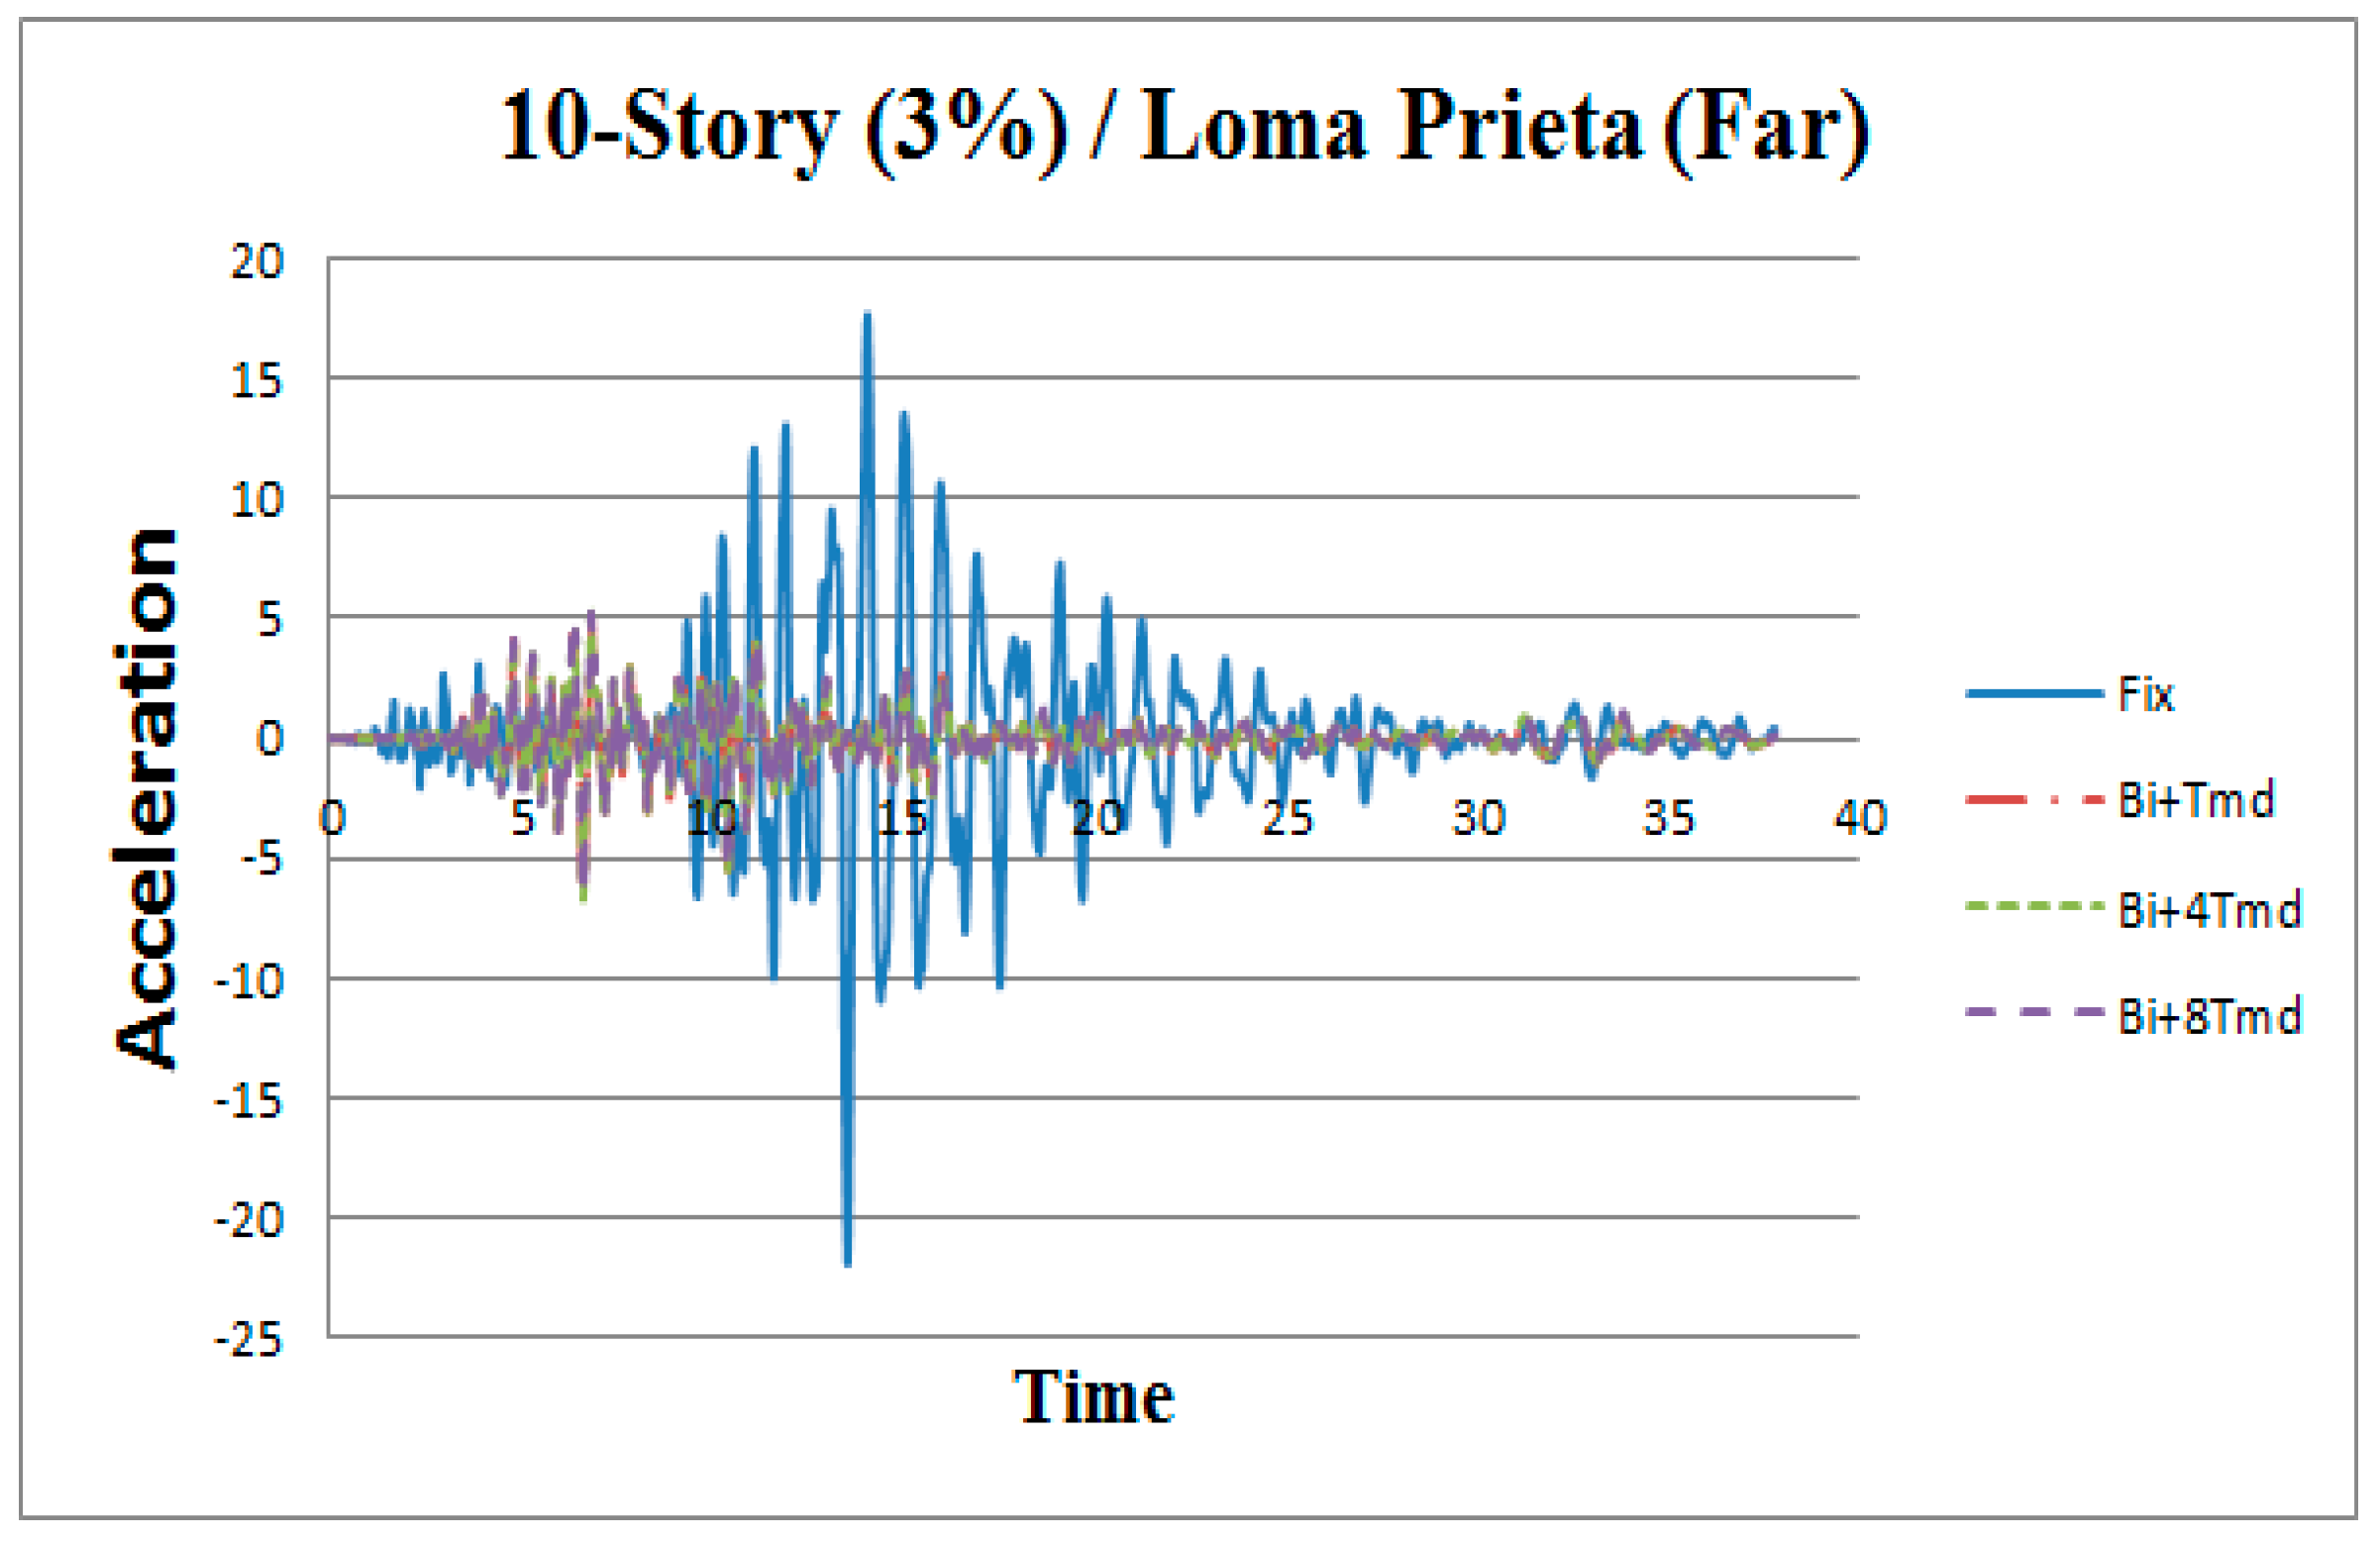
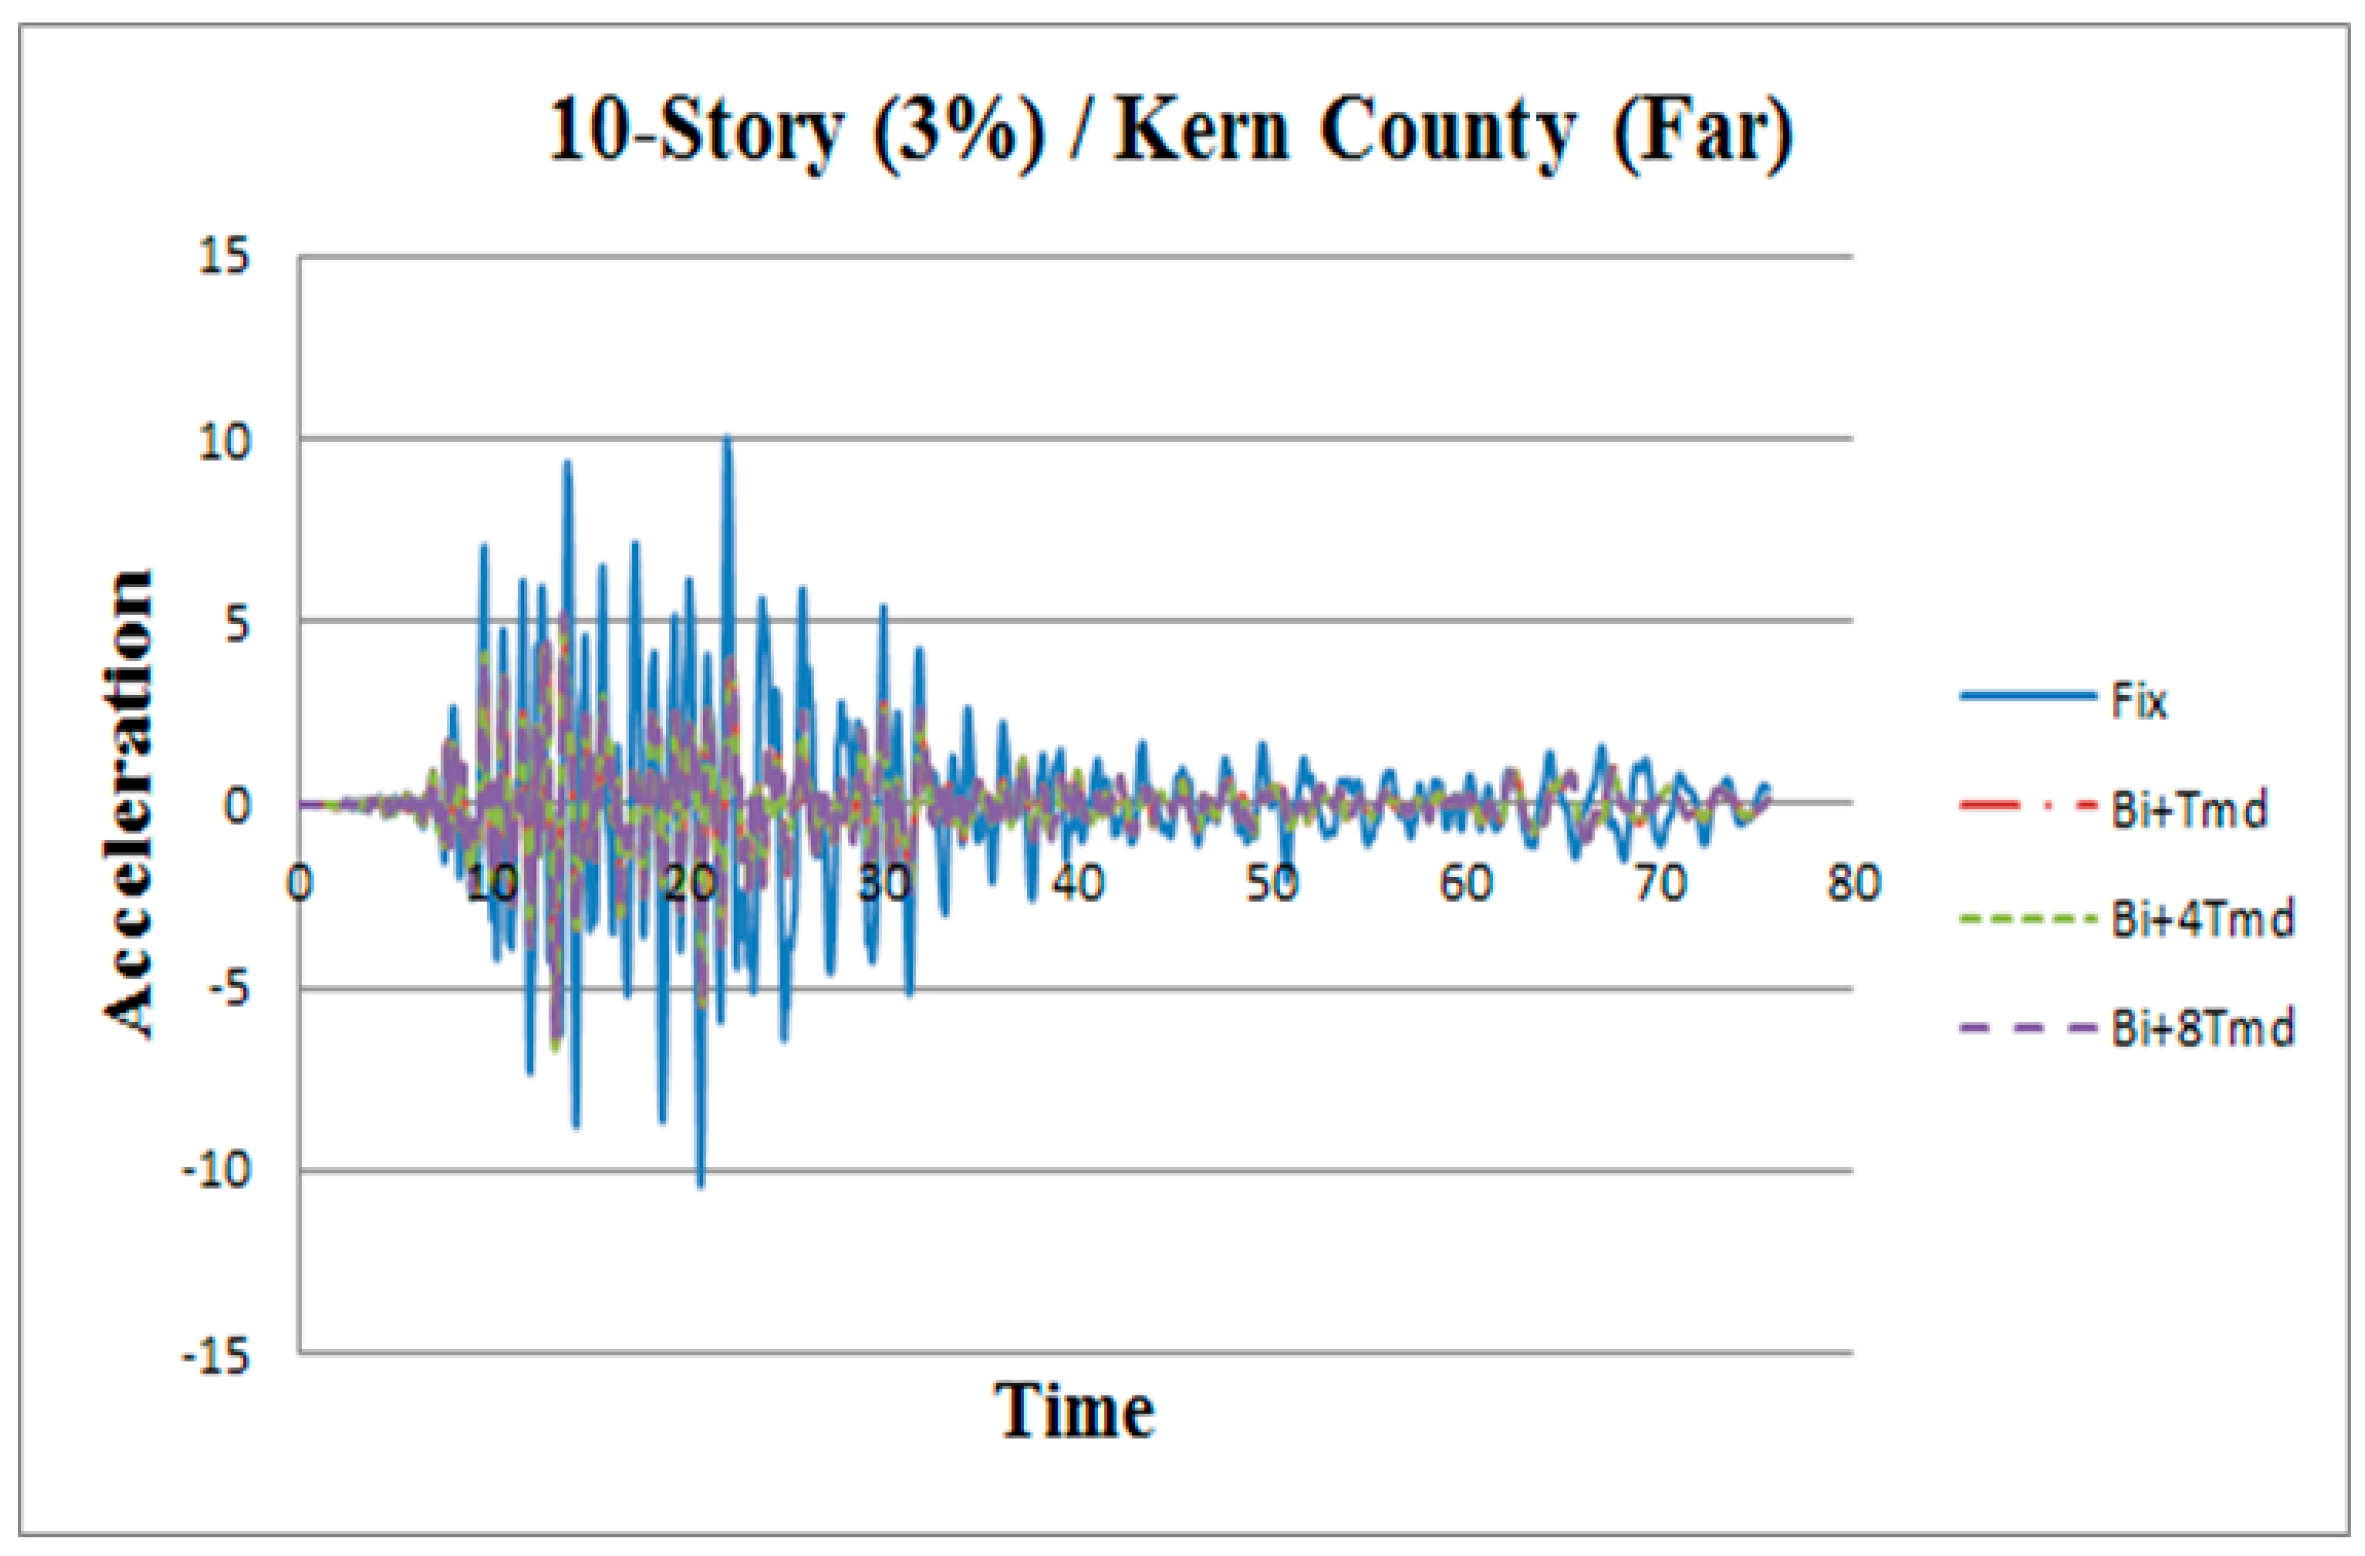
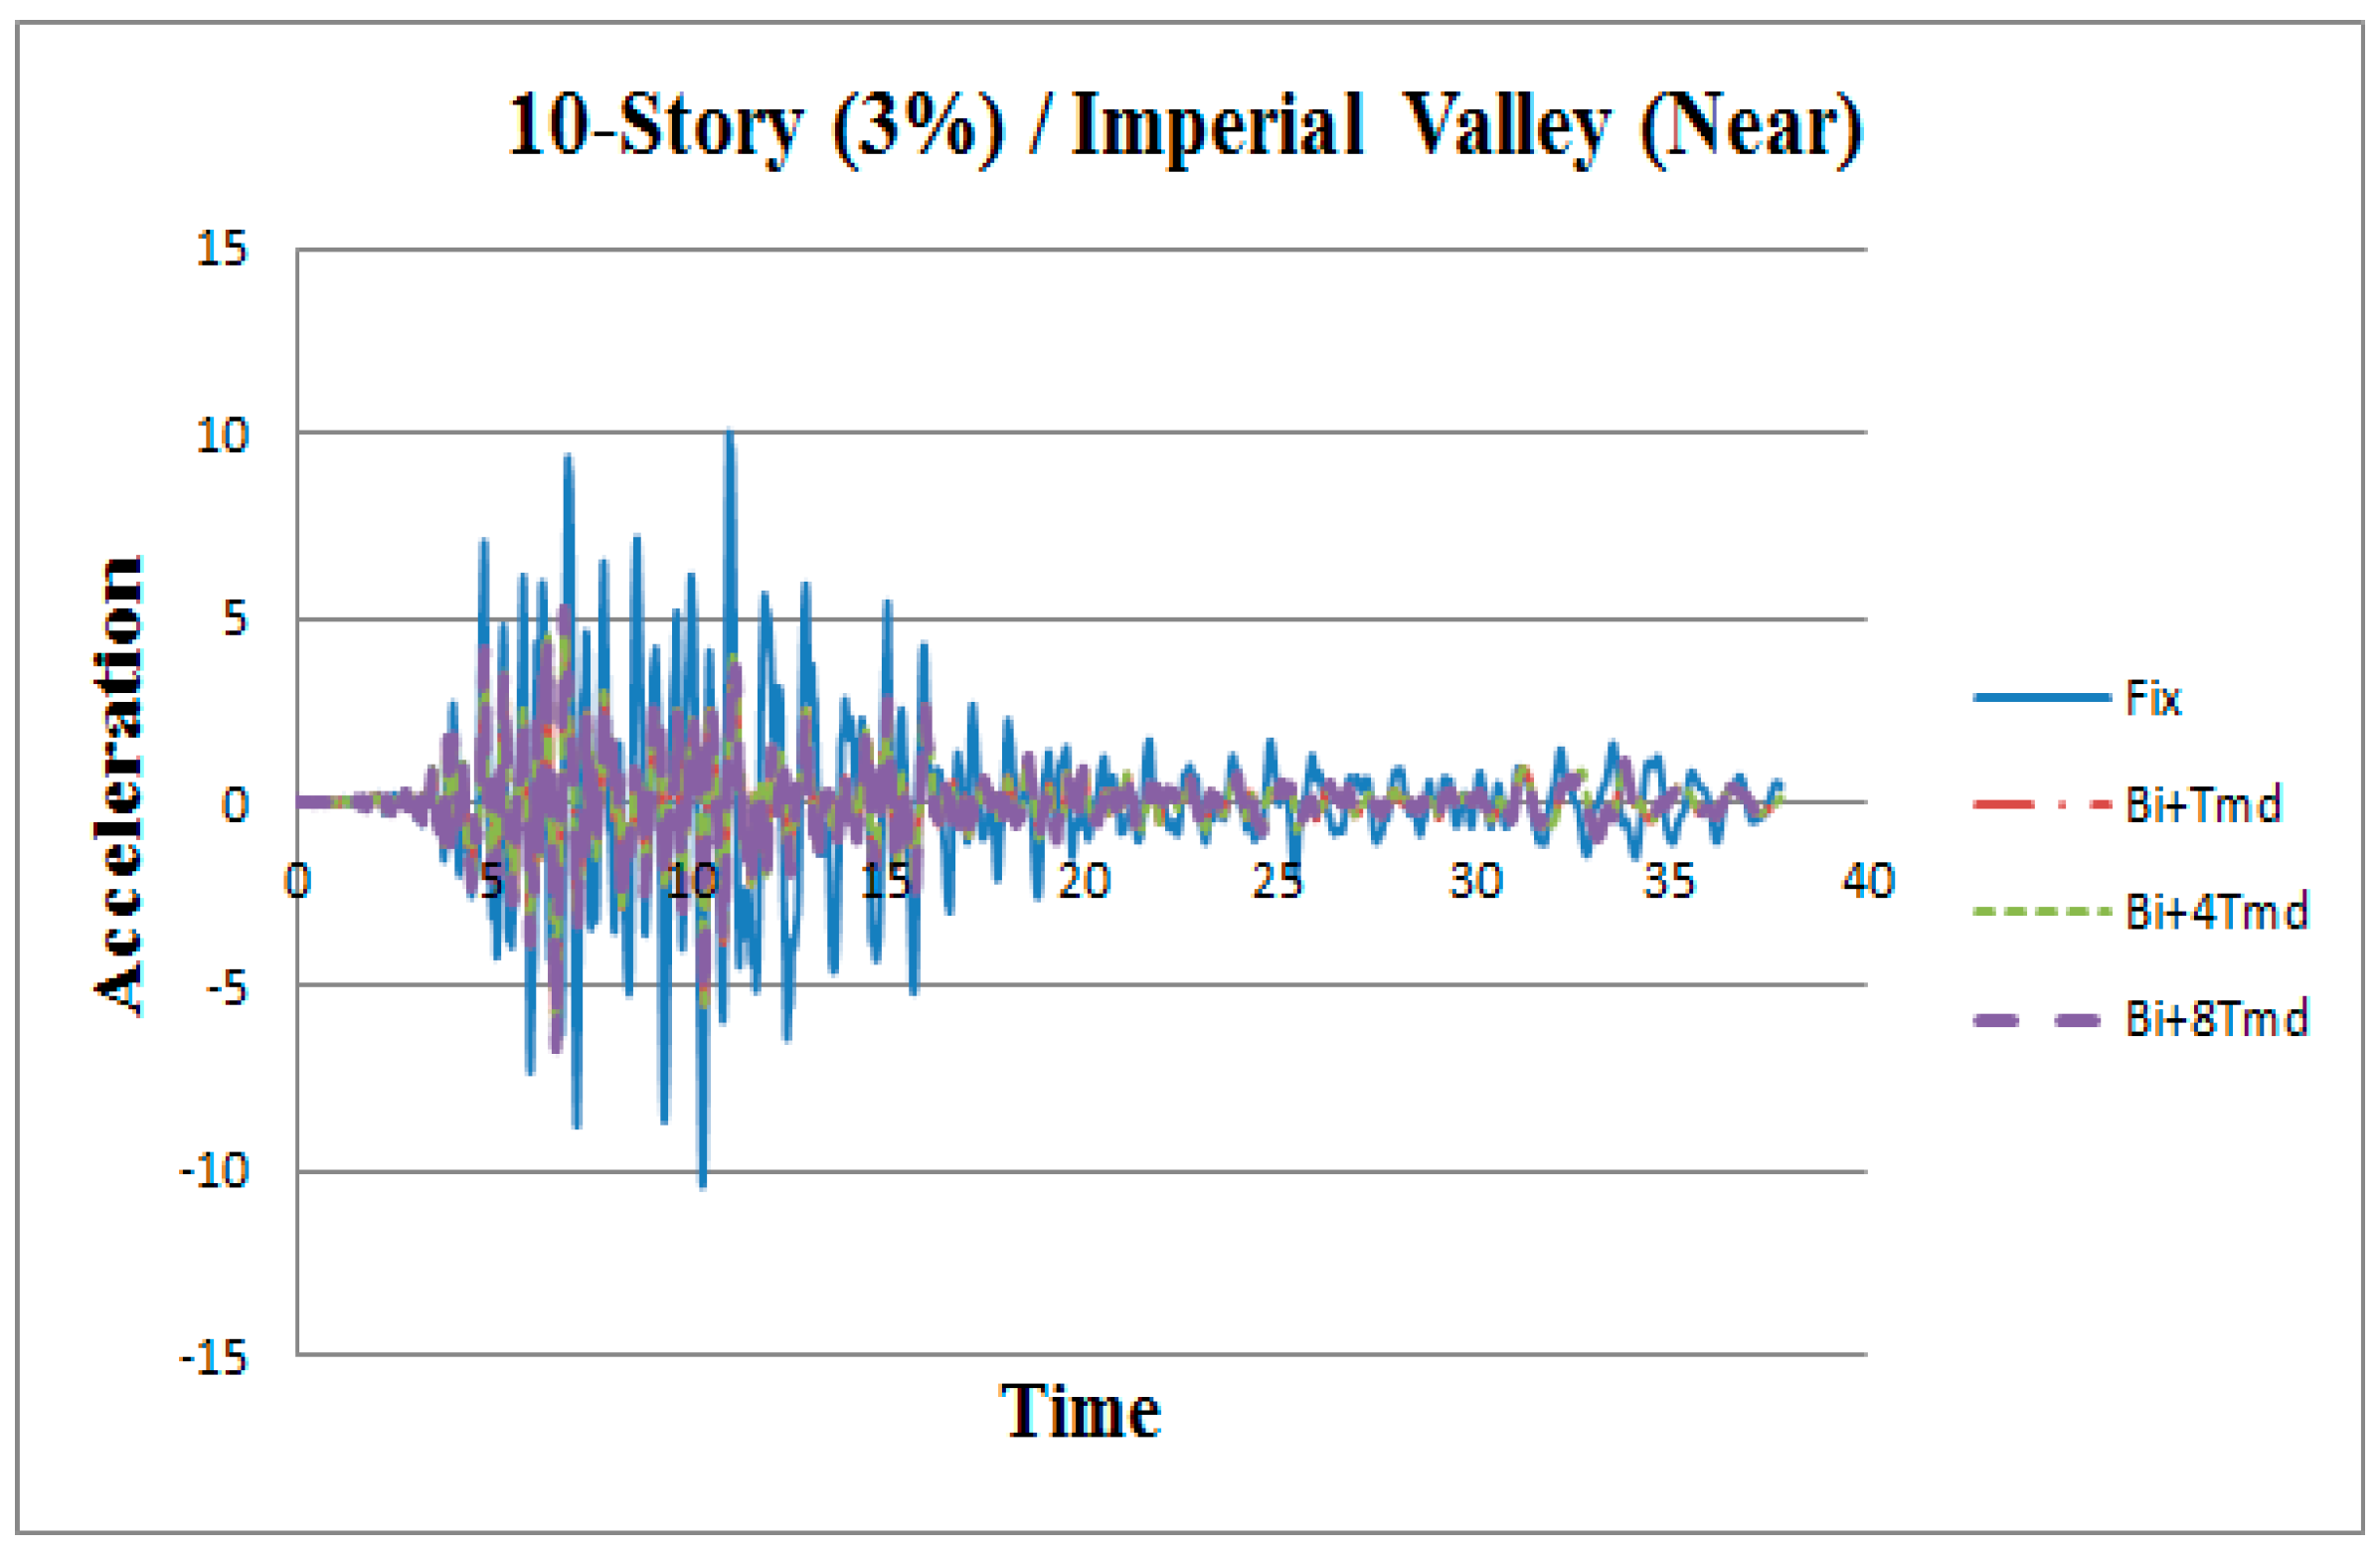
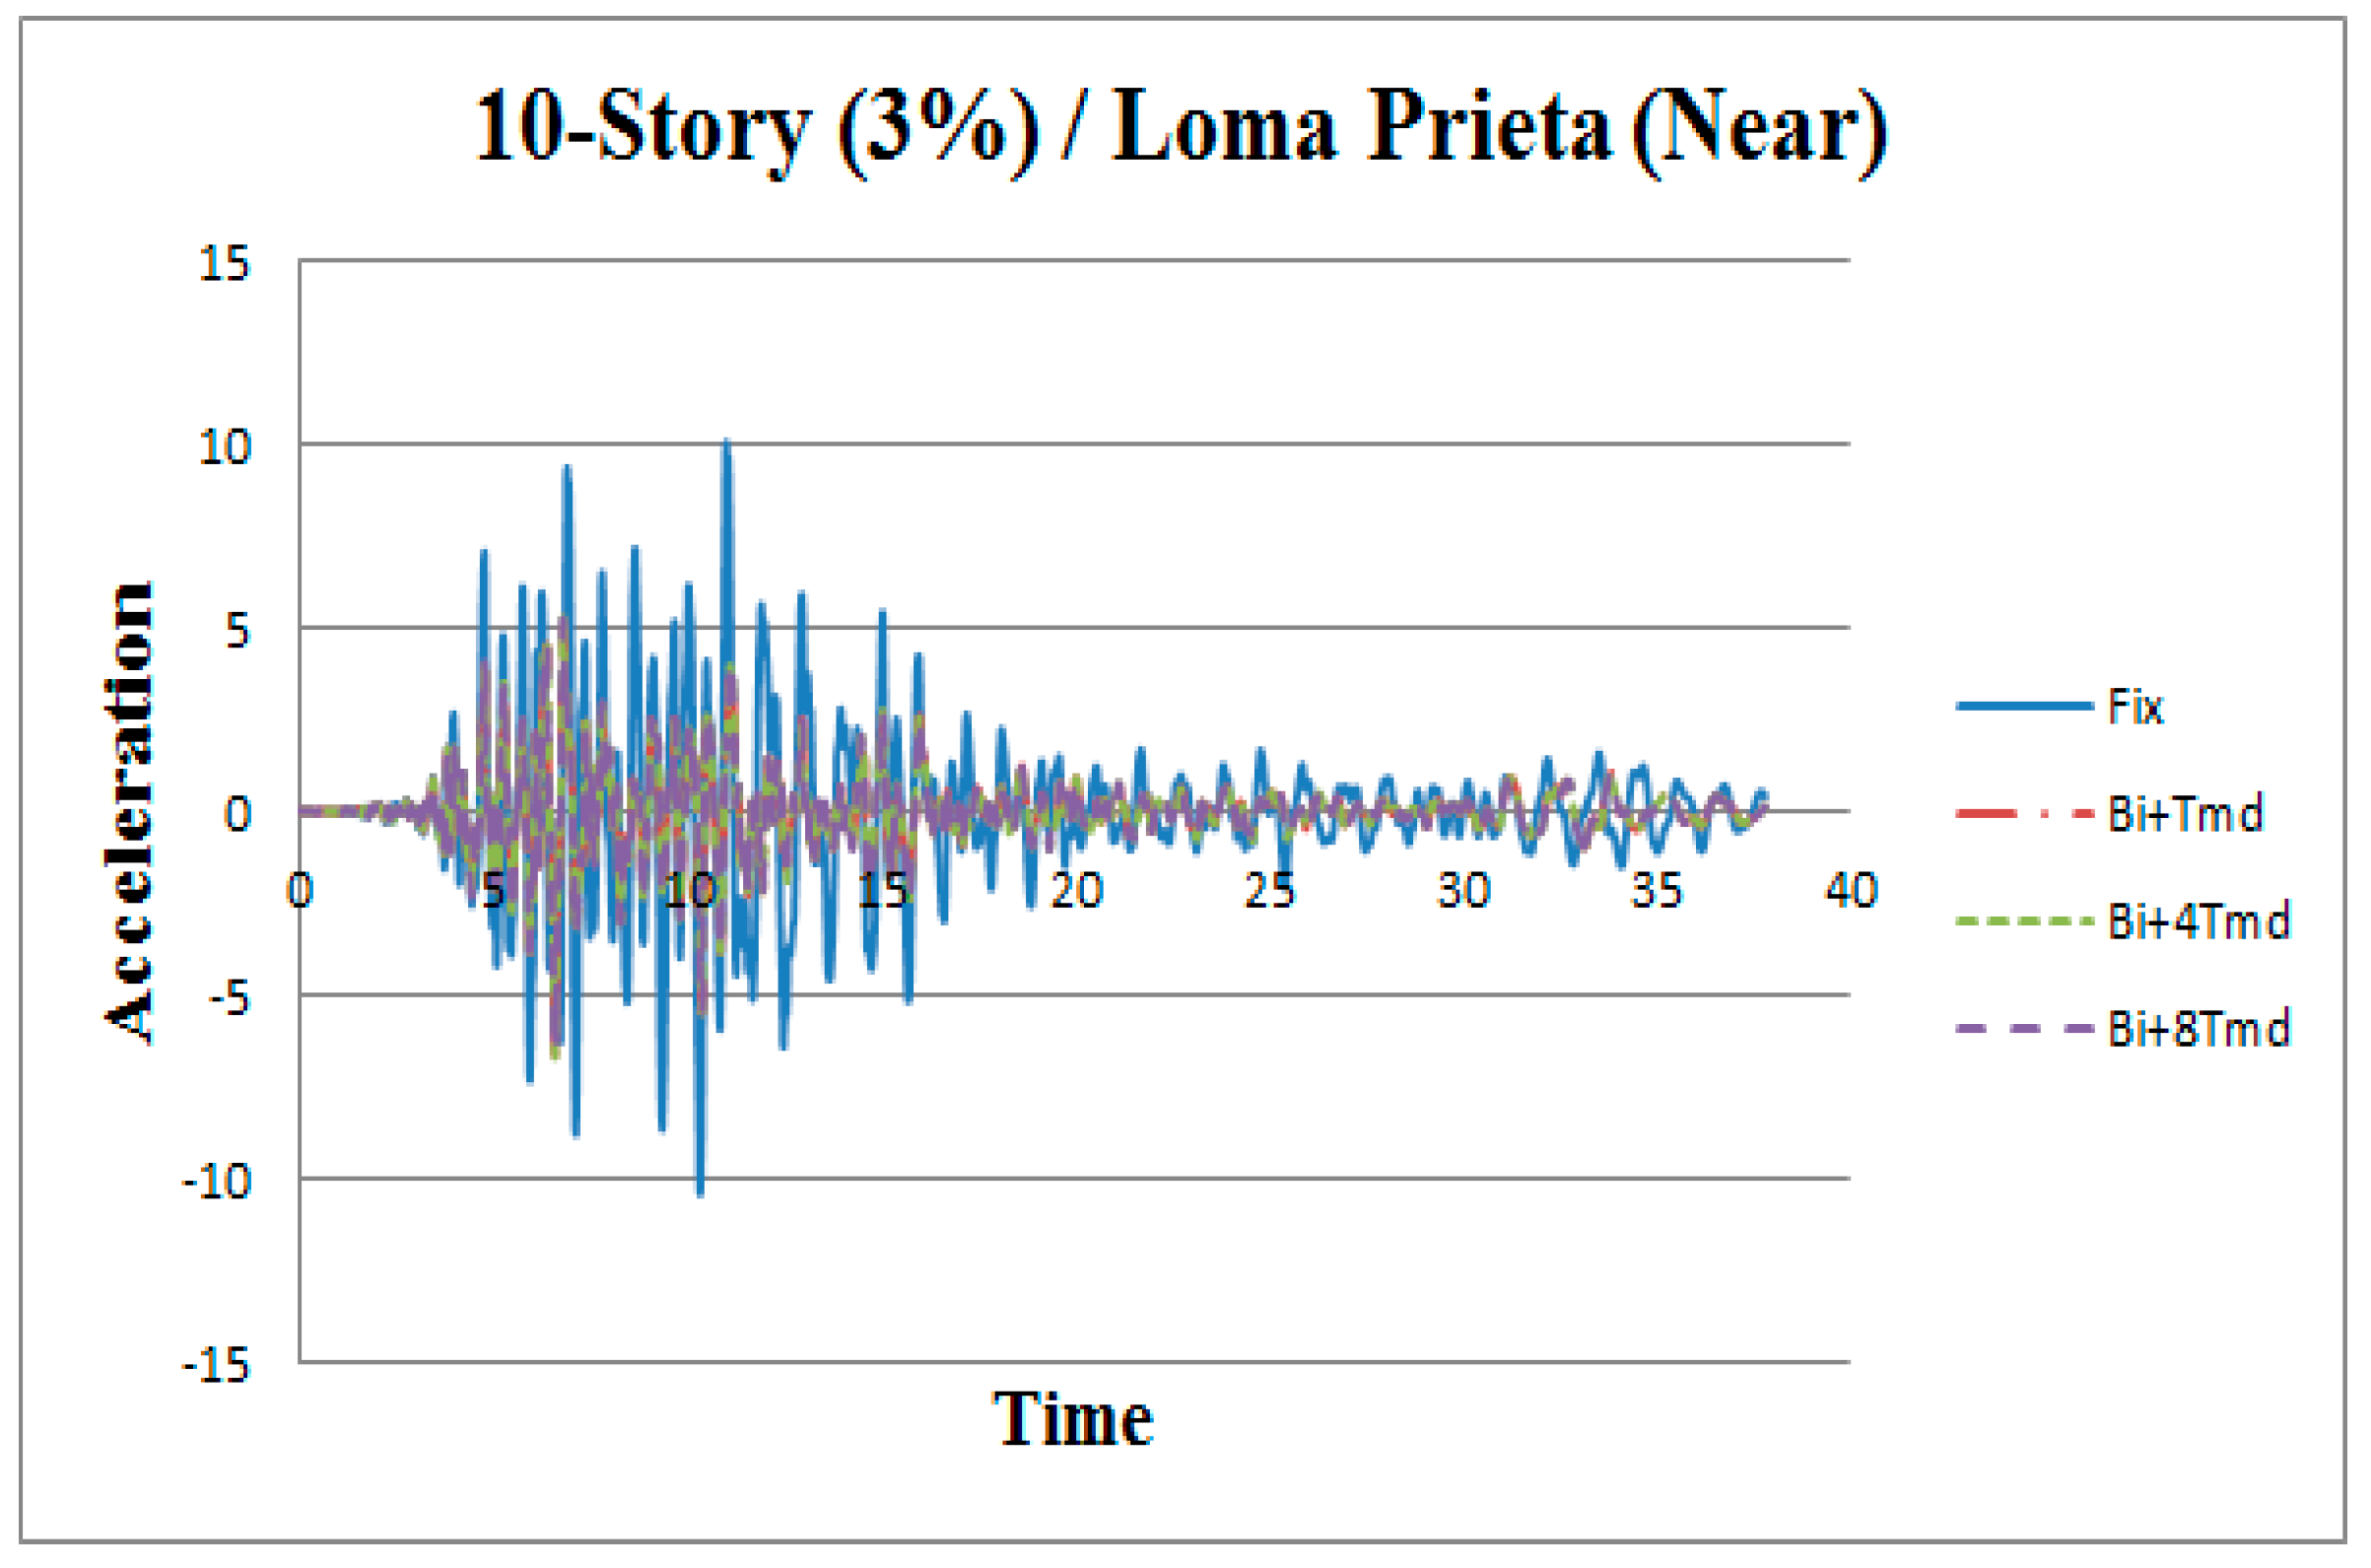
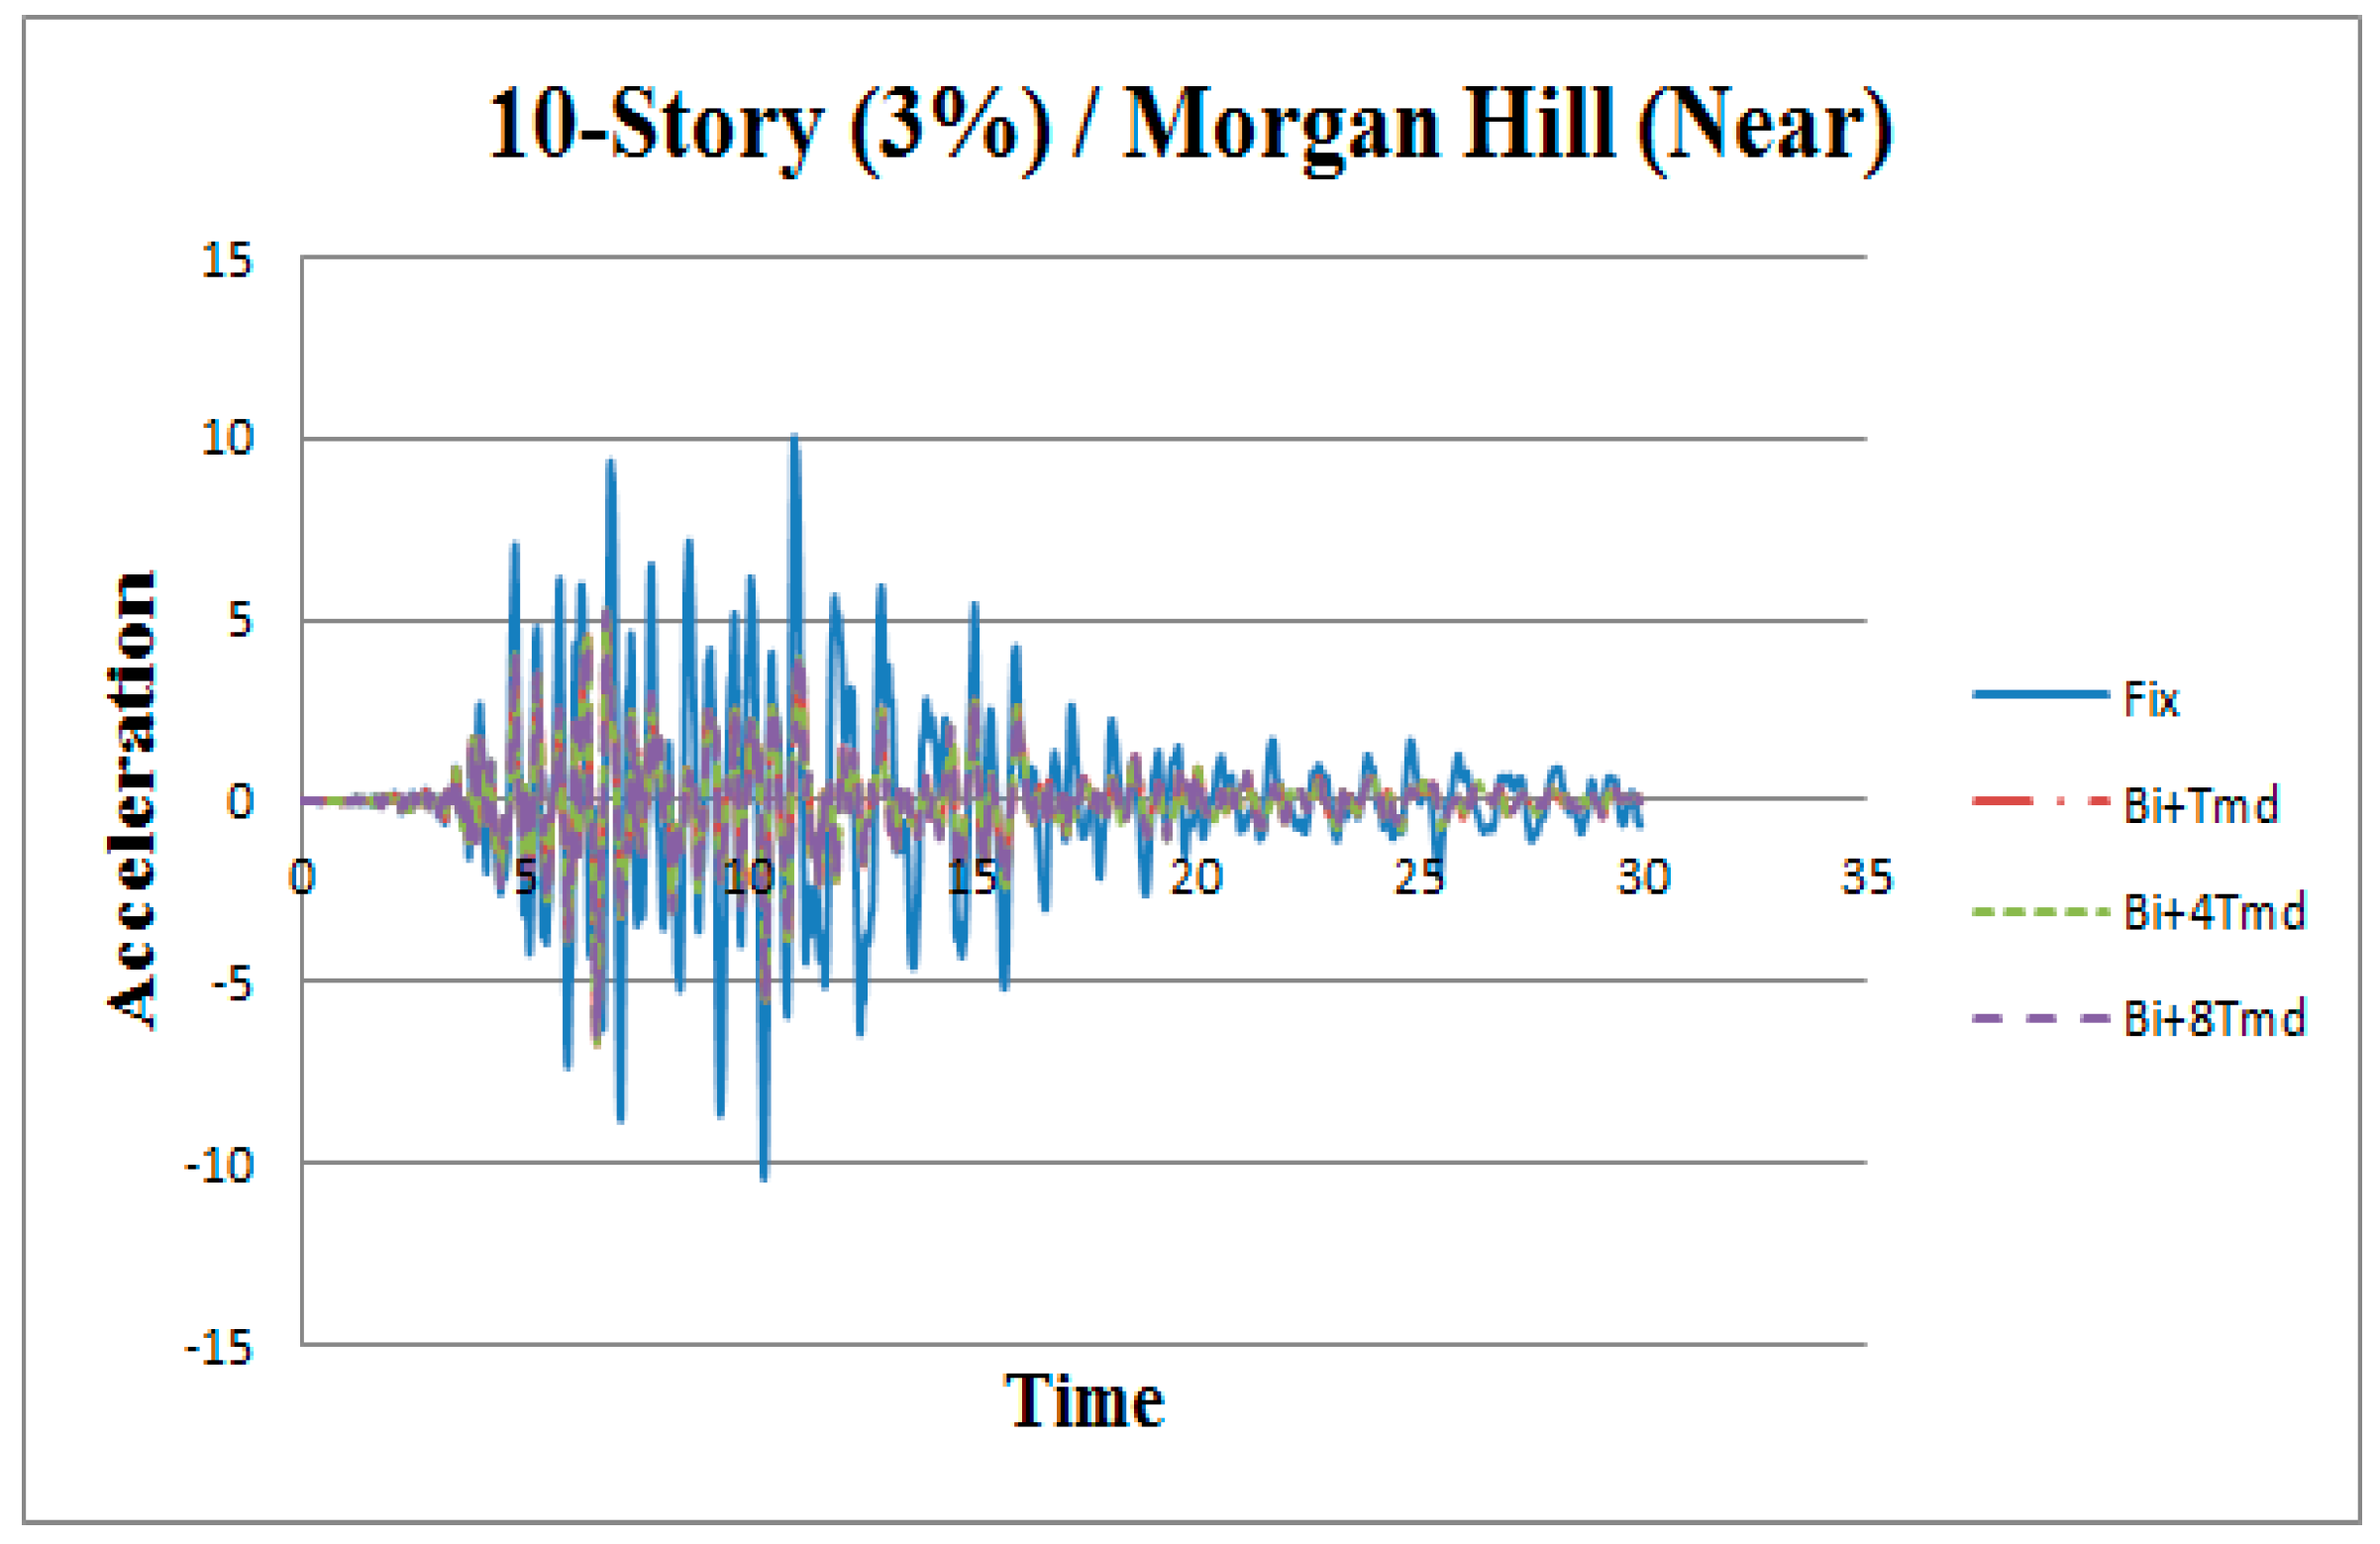
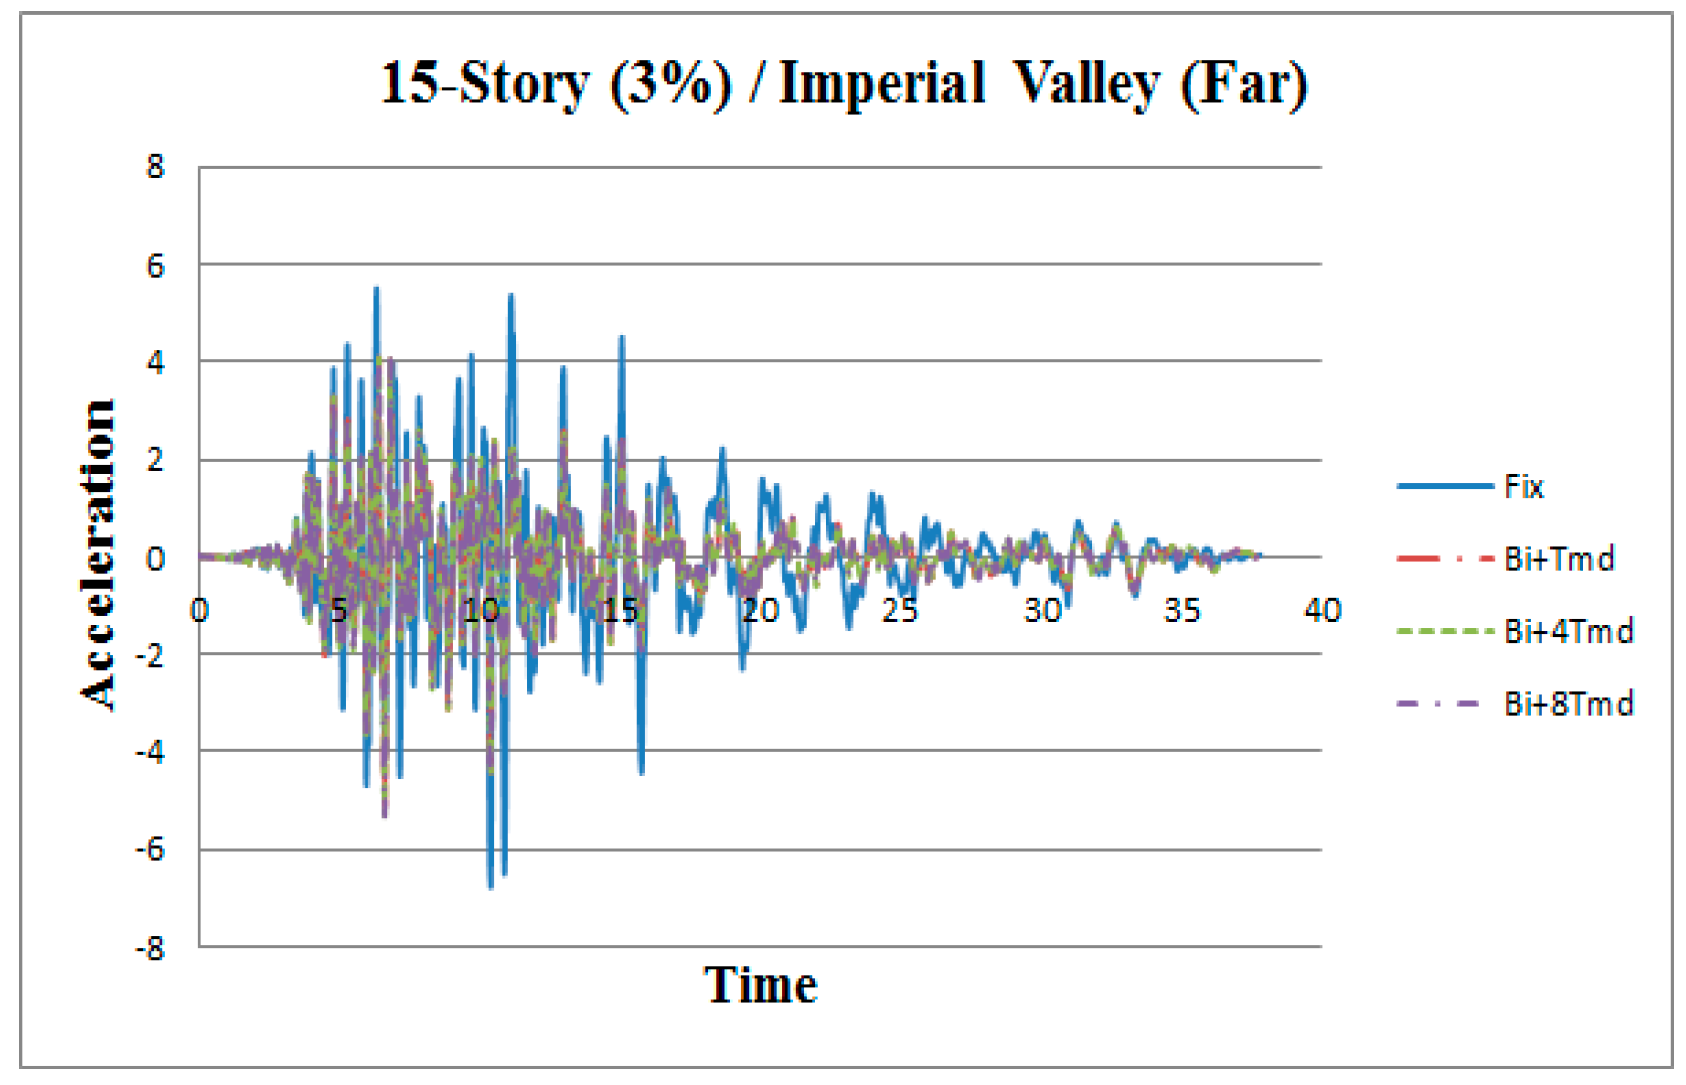
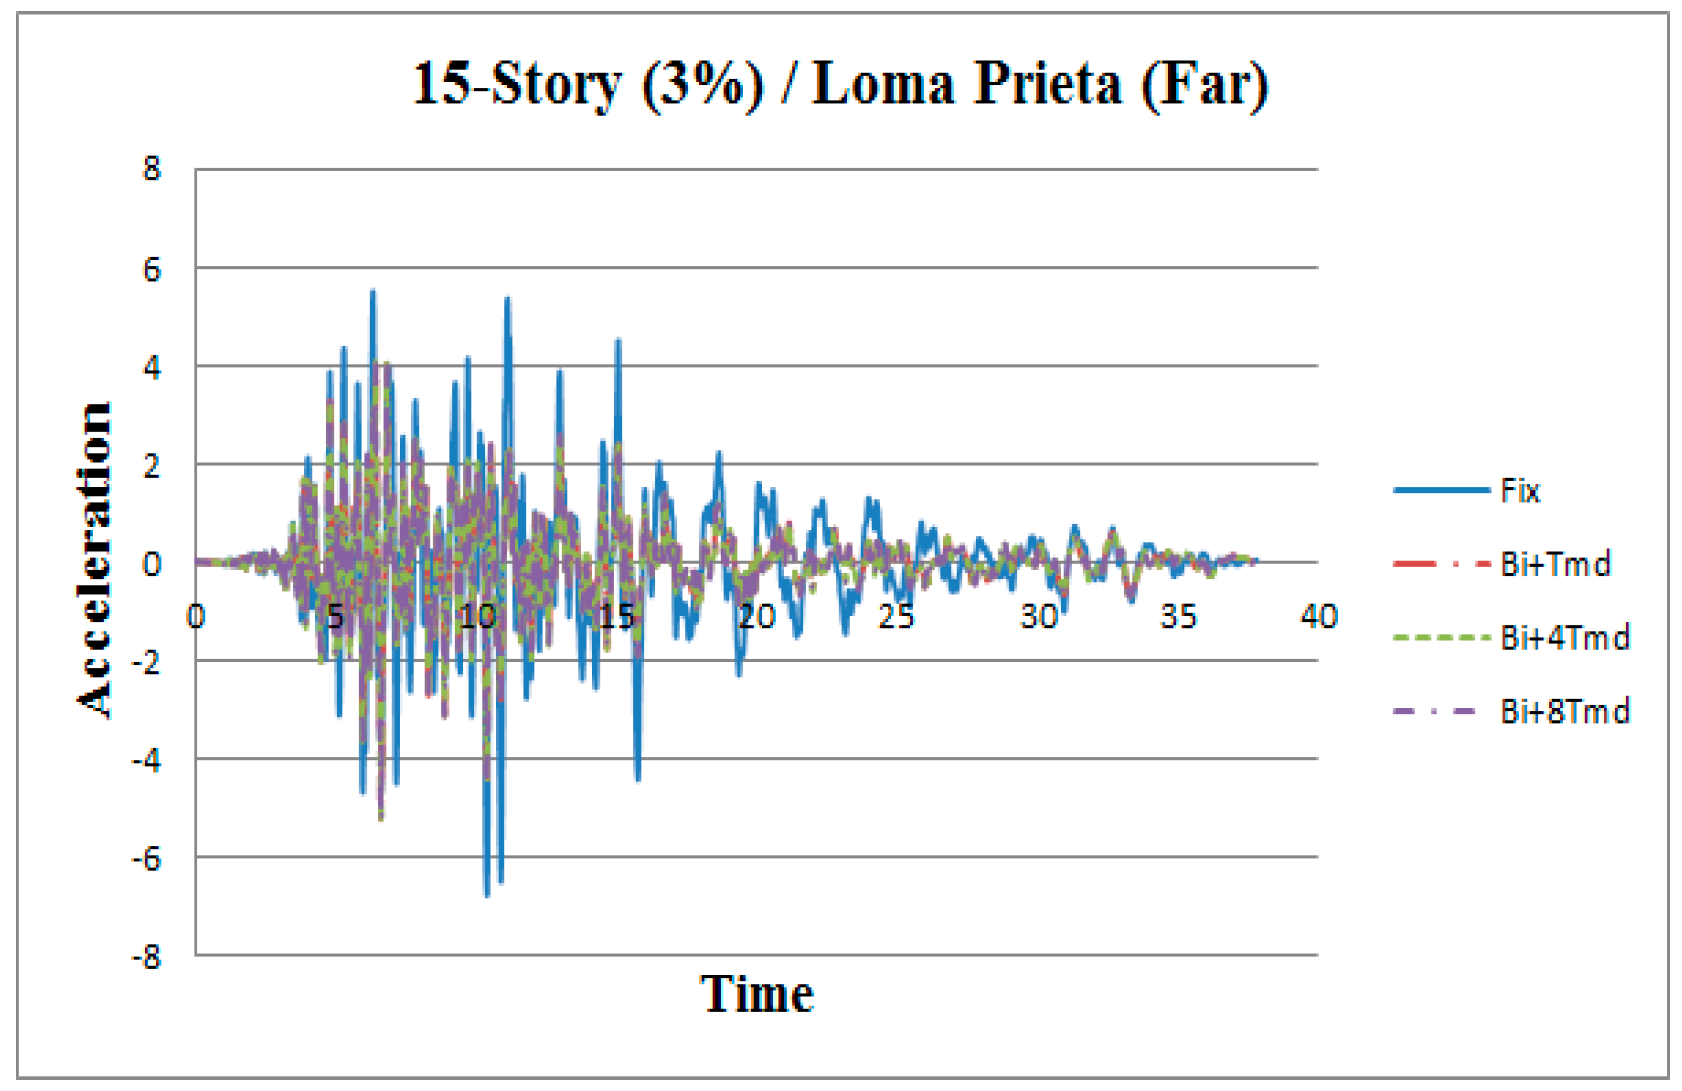
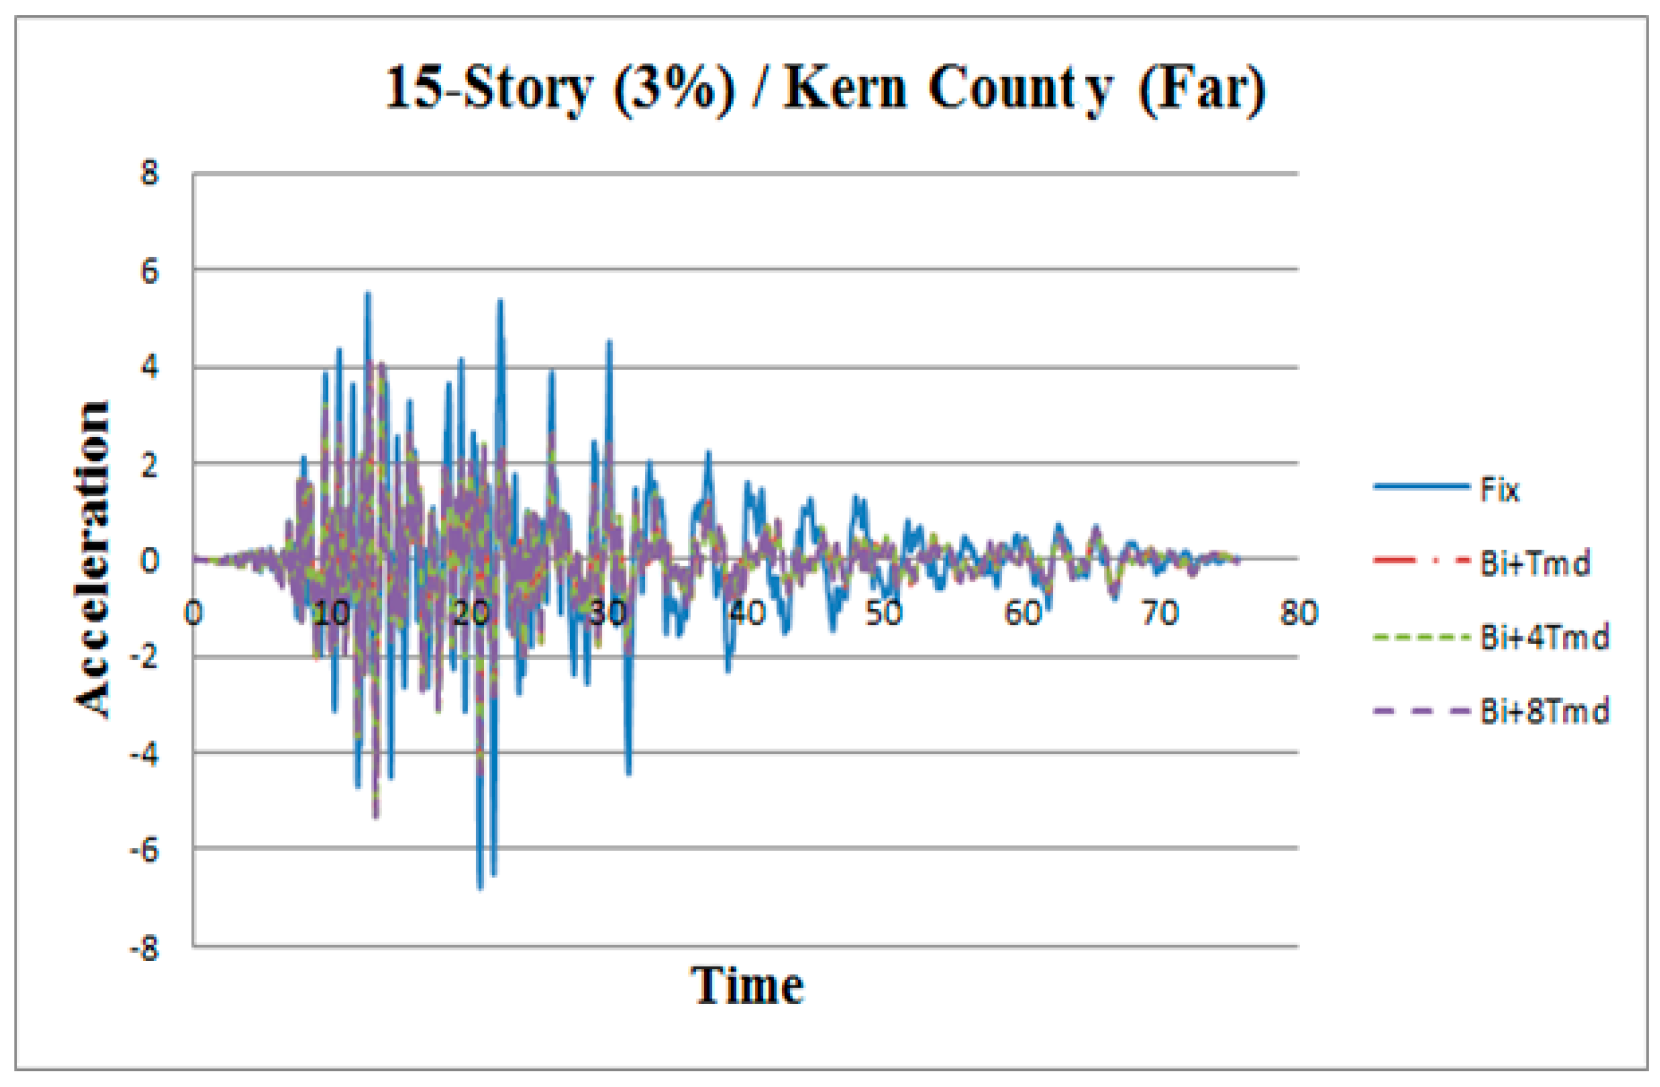
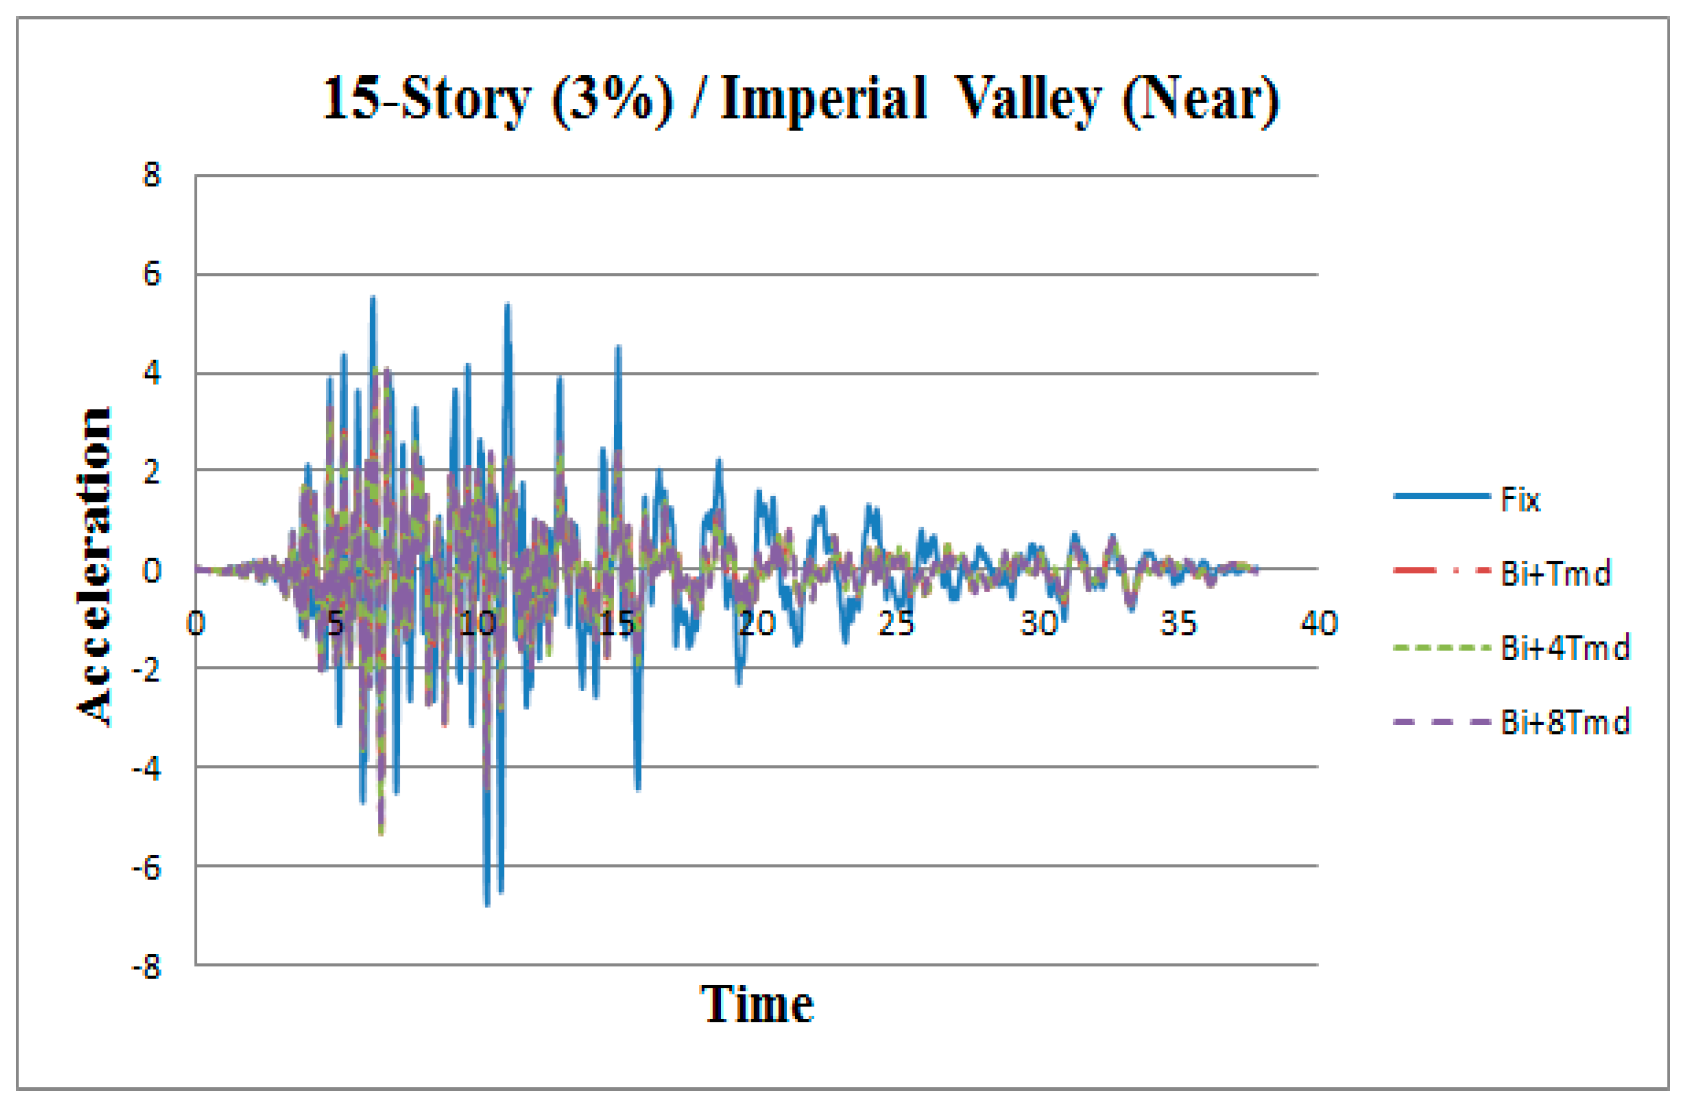
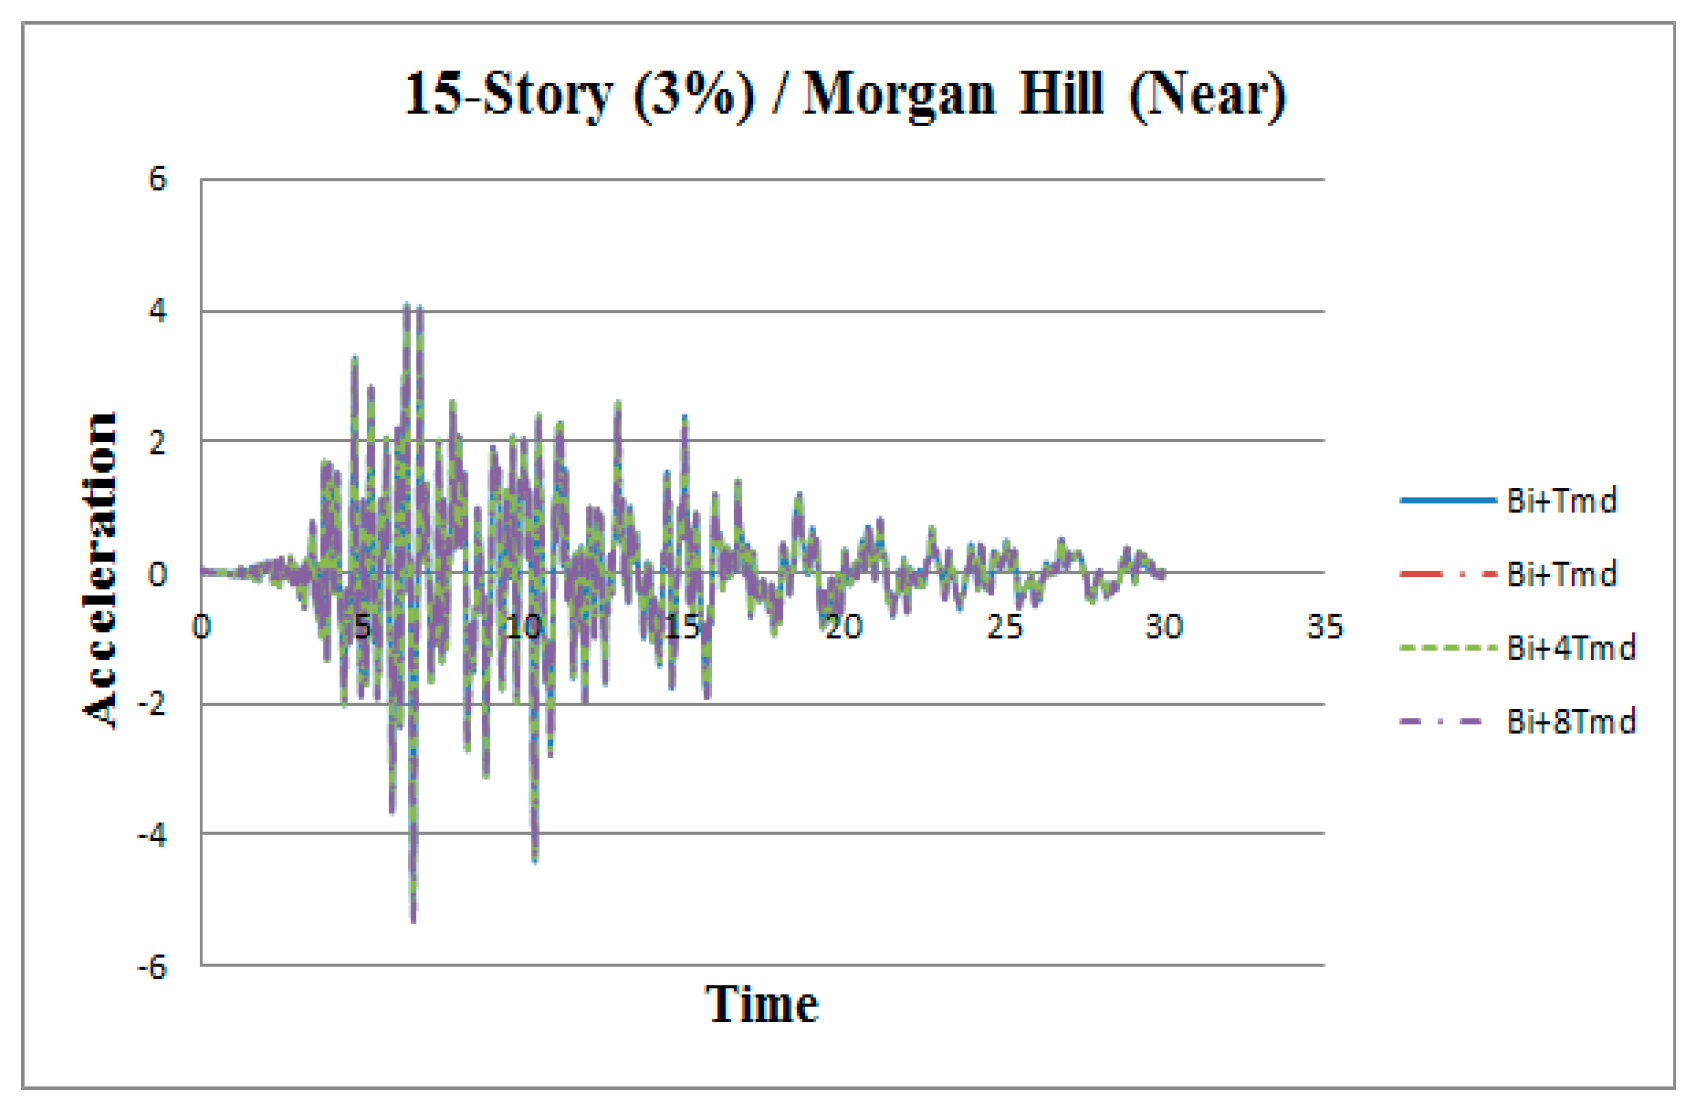
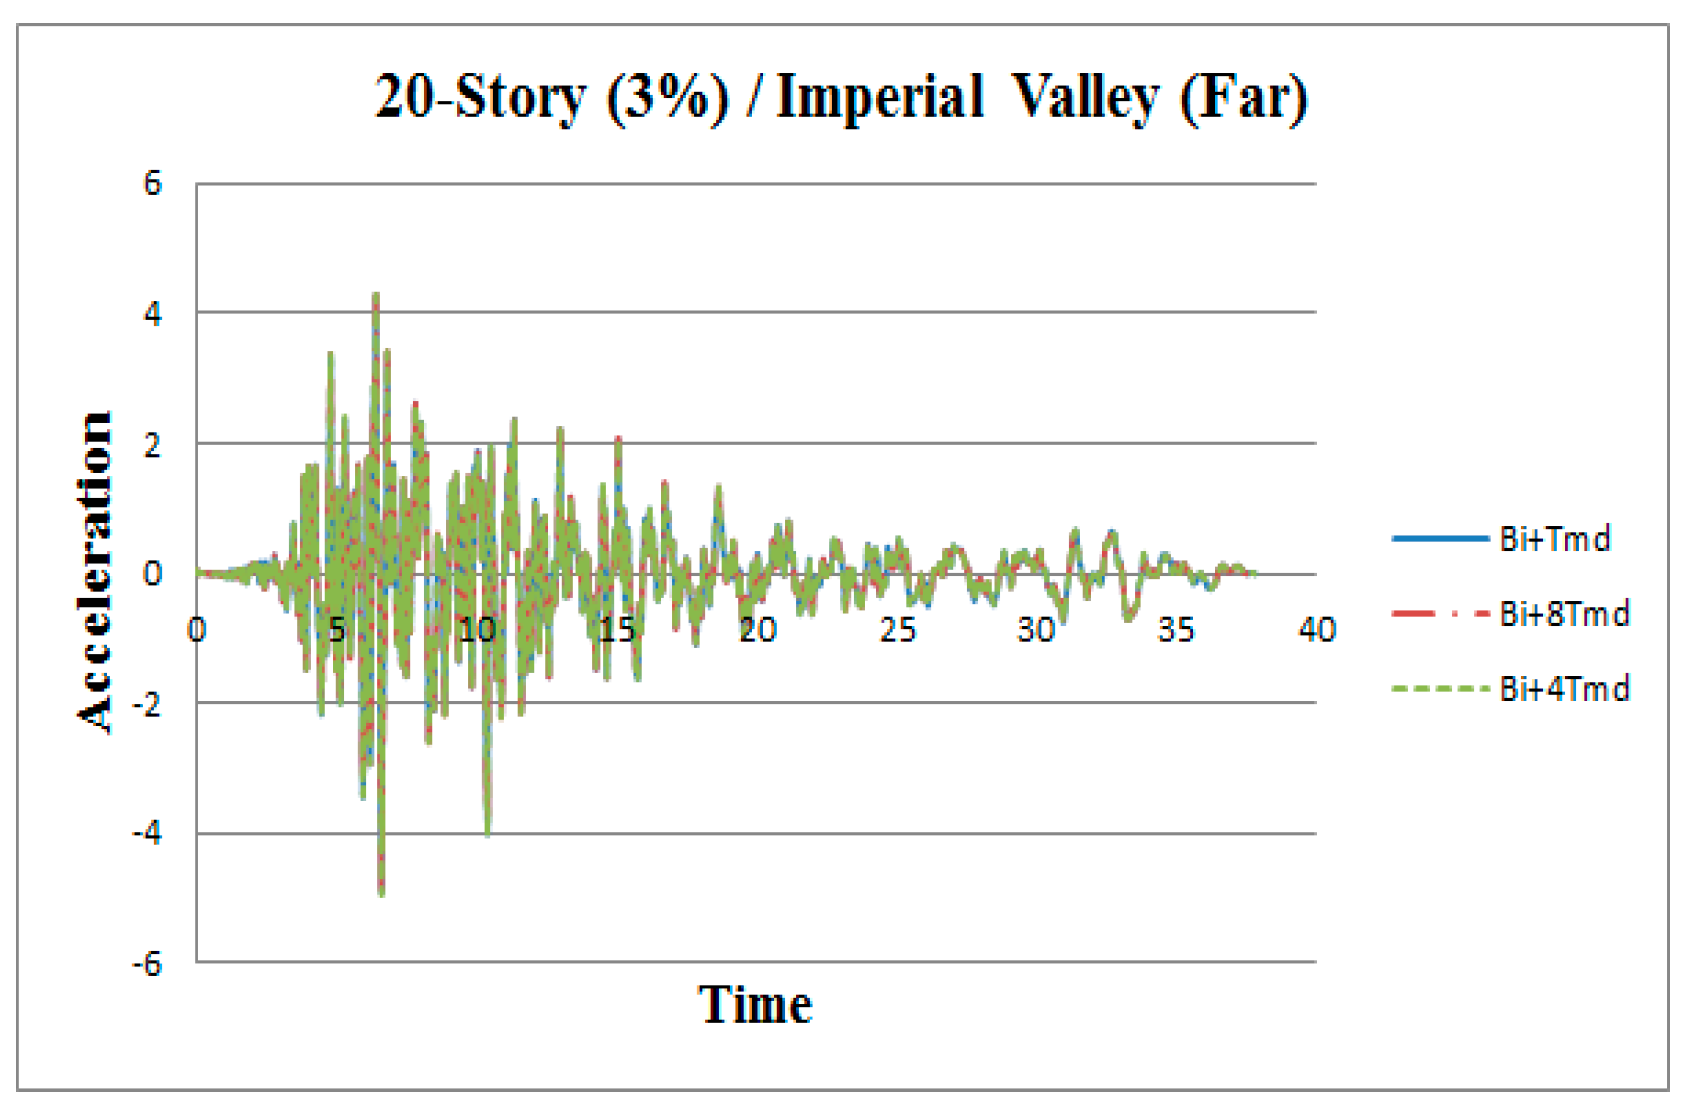
The results of the study clearly indicate that the earthquake-induced response may substantially depend on the type of the control system used to suppress structural vibrations. For example, it can be seen from Figure 2, Figure 3 and Figure 4 that the peak acceleration of the 10-story building equipped with the base isolation system (symbol “Bi”) and 1 TMD is reduced under the far-fault acceleration records by as much as 47% in the case of the Imperial Valley earthquake, 52% in the case of the Loma Prieta earthquake, and 41% in the case of the Kern County earthquake, as compared to the response without any system (symbol “Fix”). Slightly lower reductions are observed for the near-fault acceleration records. For example, the reduction in the peak acceleration of the 10-story building equipped with the base isolation system and 1 TMD is equal to 39% for the Imperial Valley earthquake and 40% for the Loma Prieta and Morgan Hill earthquakes (Figure 5, Figure 6 and Figure 7). Similar effects can be observed in the case of the 5, 15, and 20-story buildings equipped with 1, 4, and 8 TMDs. In the case of the 5-story structure, the largest reduction in the peak acceleration is as large as 81% for the far-fault acceleration records and 68% for the near-fault acceleration records, as compared to the response without any system. Moreover, Figure A1, Figure A2, Figure A3, Figure A4, Figure A5 and Figure A6 indicate that the reduction in the peak acceleration of the 15-story building is equal to 68% for the far-fault acceleration records and 74% for the near-fault acceleration. Finally, in the case of the 20-story structure, the reduction in the peak acceleration is larger than 60% for both far-fault and near-fault acceleration records, as compared to the response without any system (Figure A7, Figure A8, Figure A9, Figure A10, Figure A11 and Figure A12). However, it should be underlined that the results shown in Figure 2, Figure 3, Figure 4, Figure 5, Figure 6 and Figure 7 and Figure A1, Figure A2, Figure A3, Figure A4, Figure A5, Figure A6, Figure A7, Figure A8, Figure A9, Figure A10, Figure A11 and Figure A12 clearly indicate that the influence of the base isolation on the reduction of the structural response under different ground motions is much larger than the influence of non-traditional TMDs.
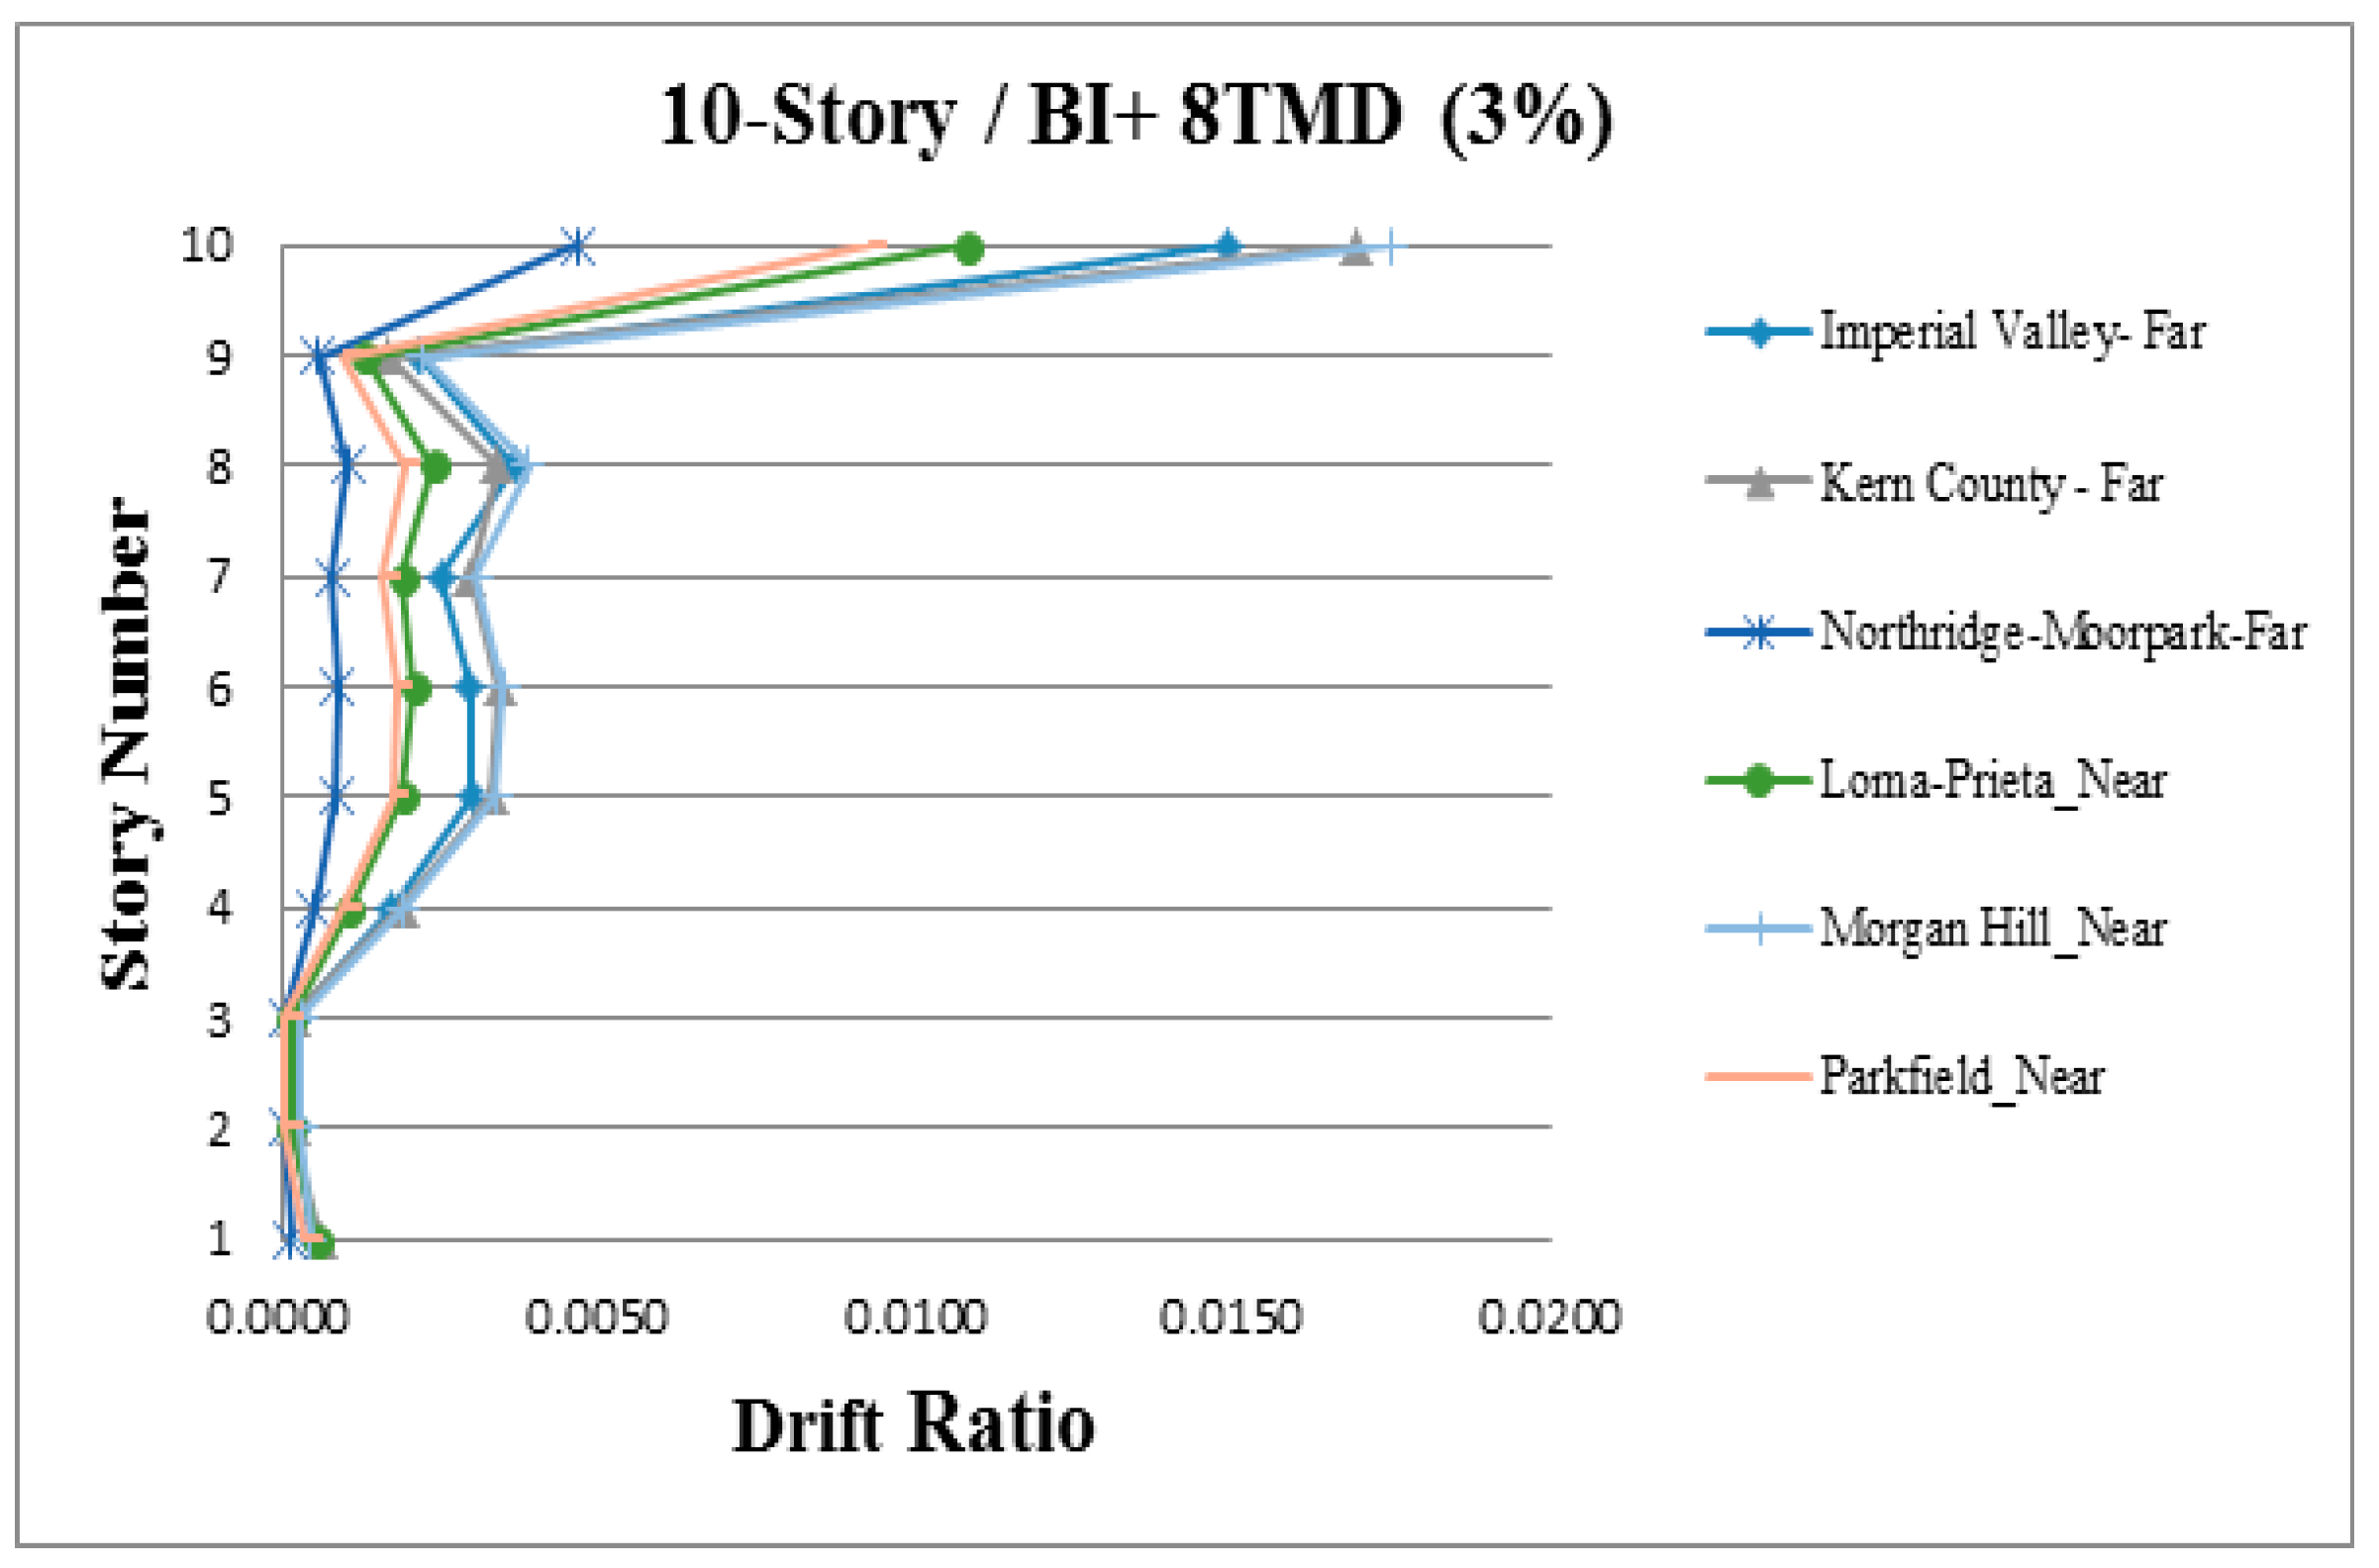
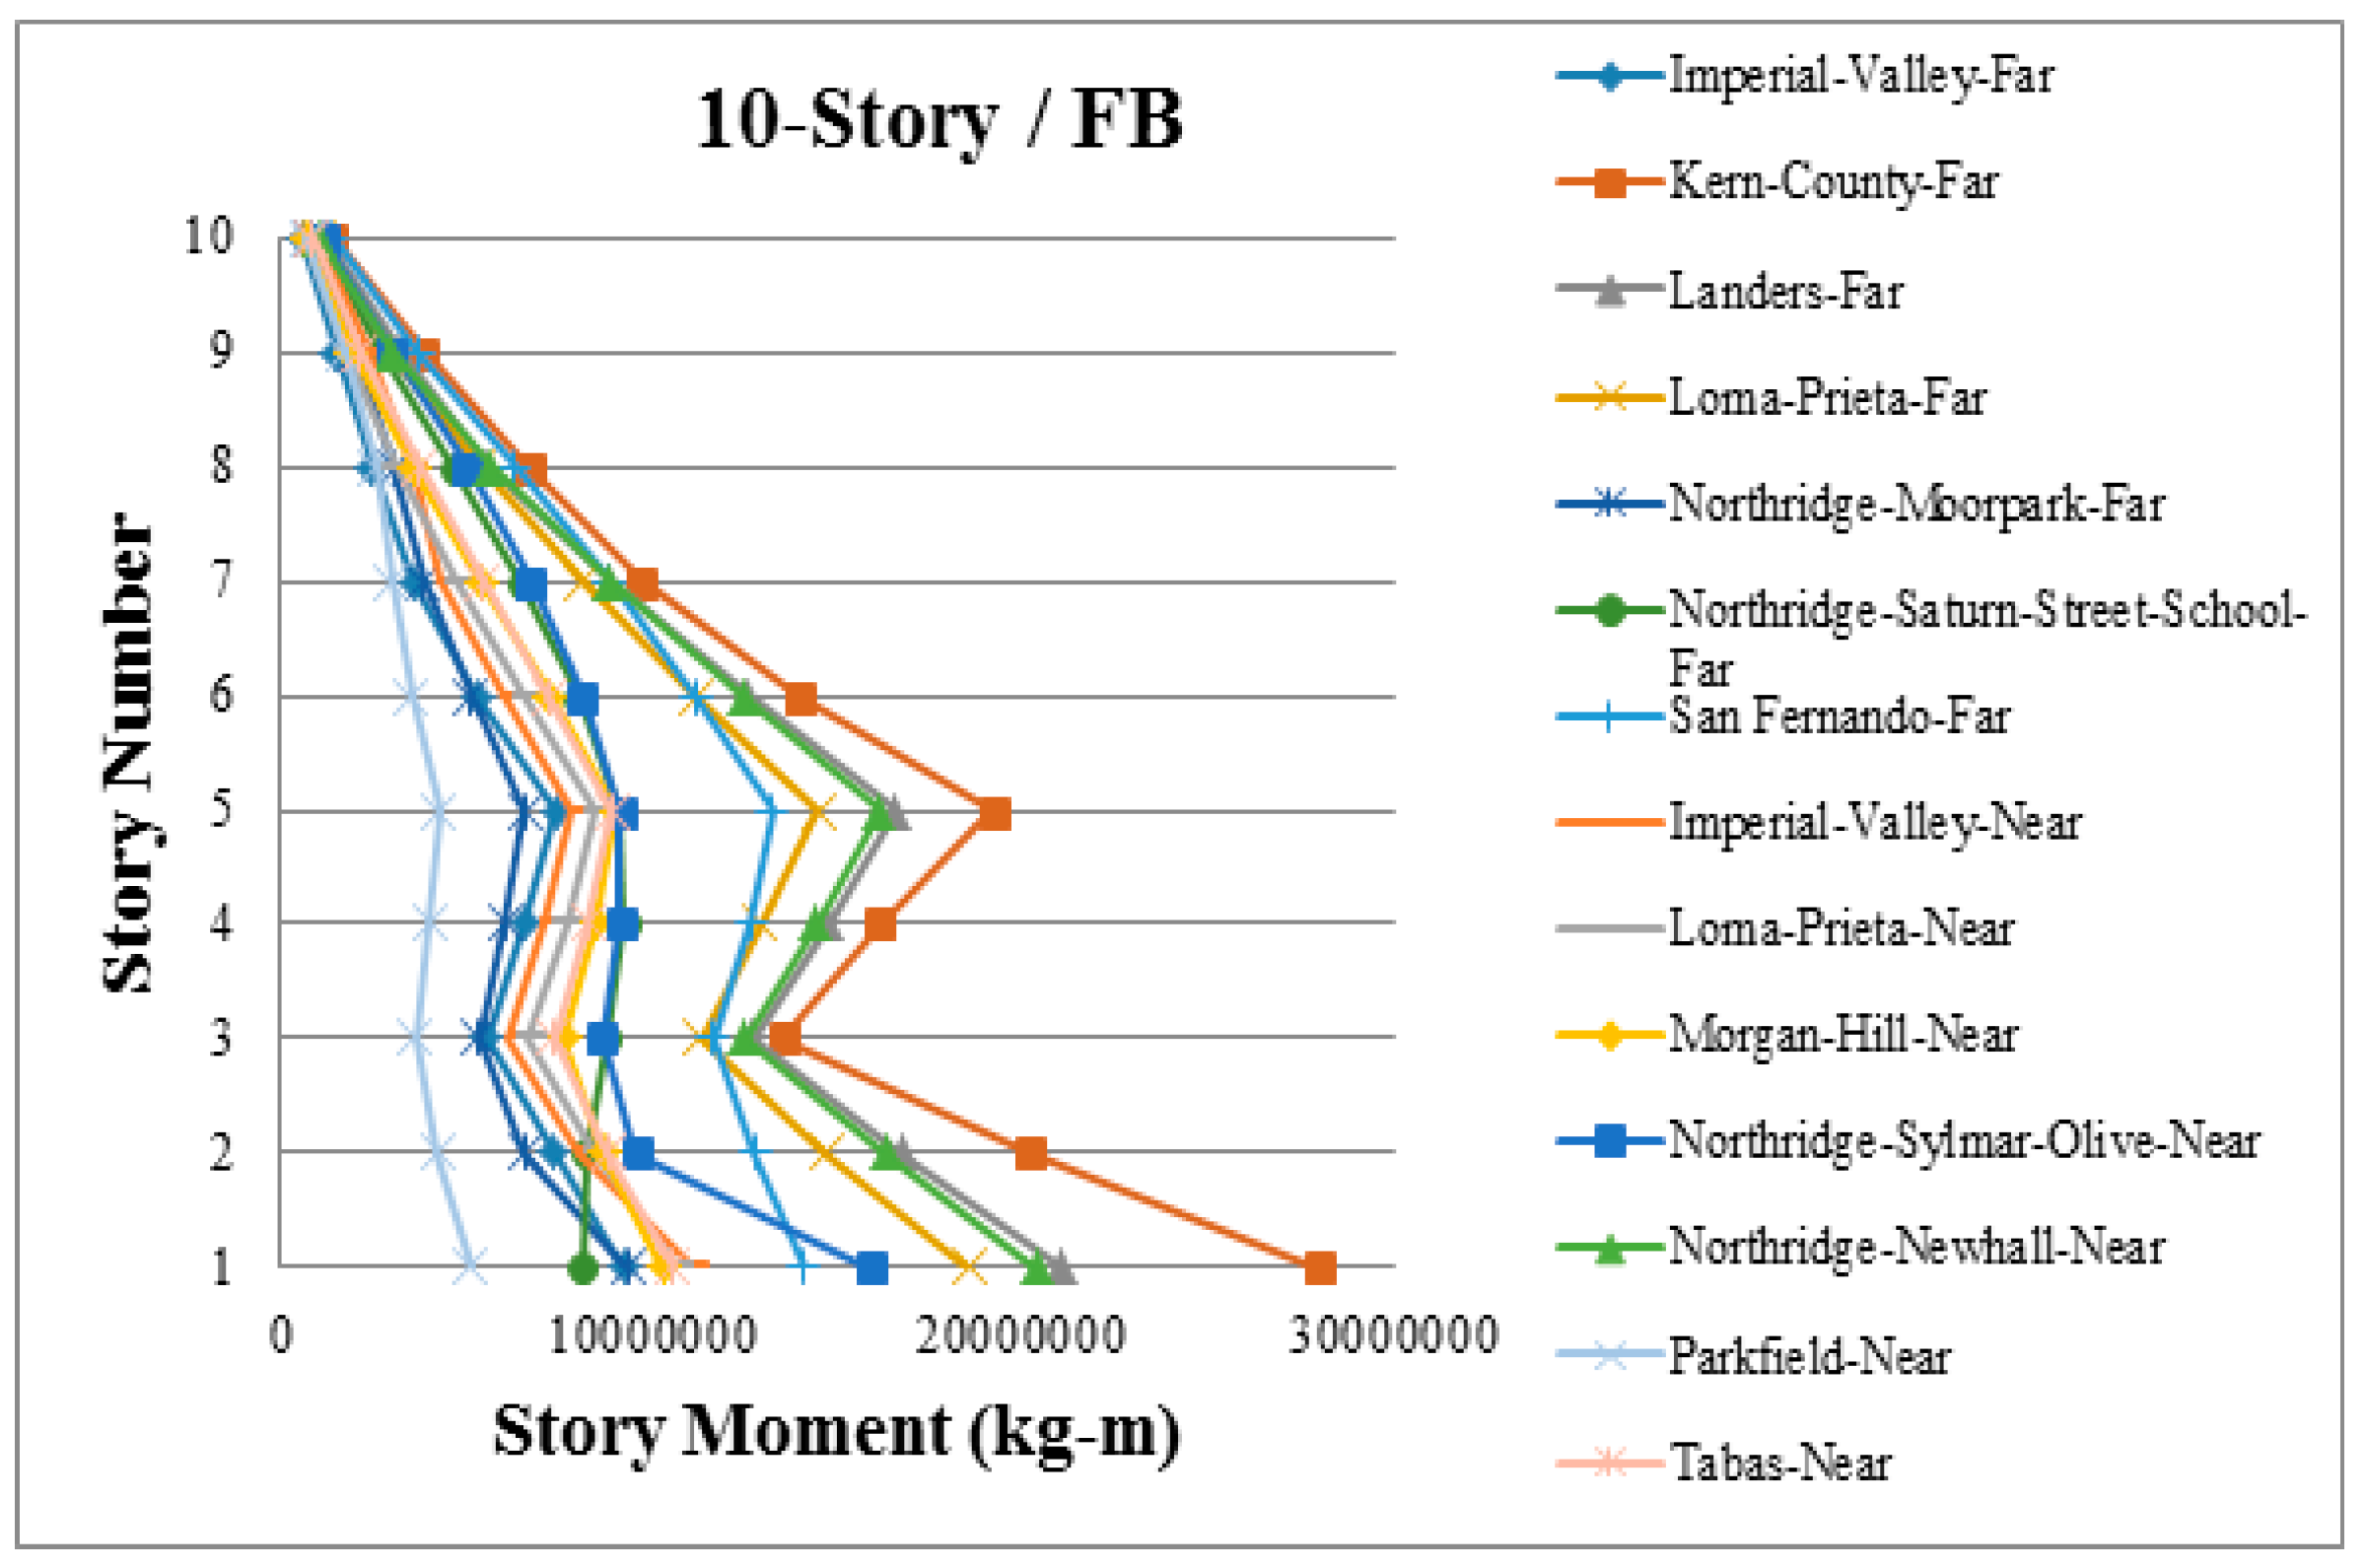
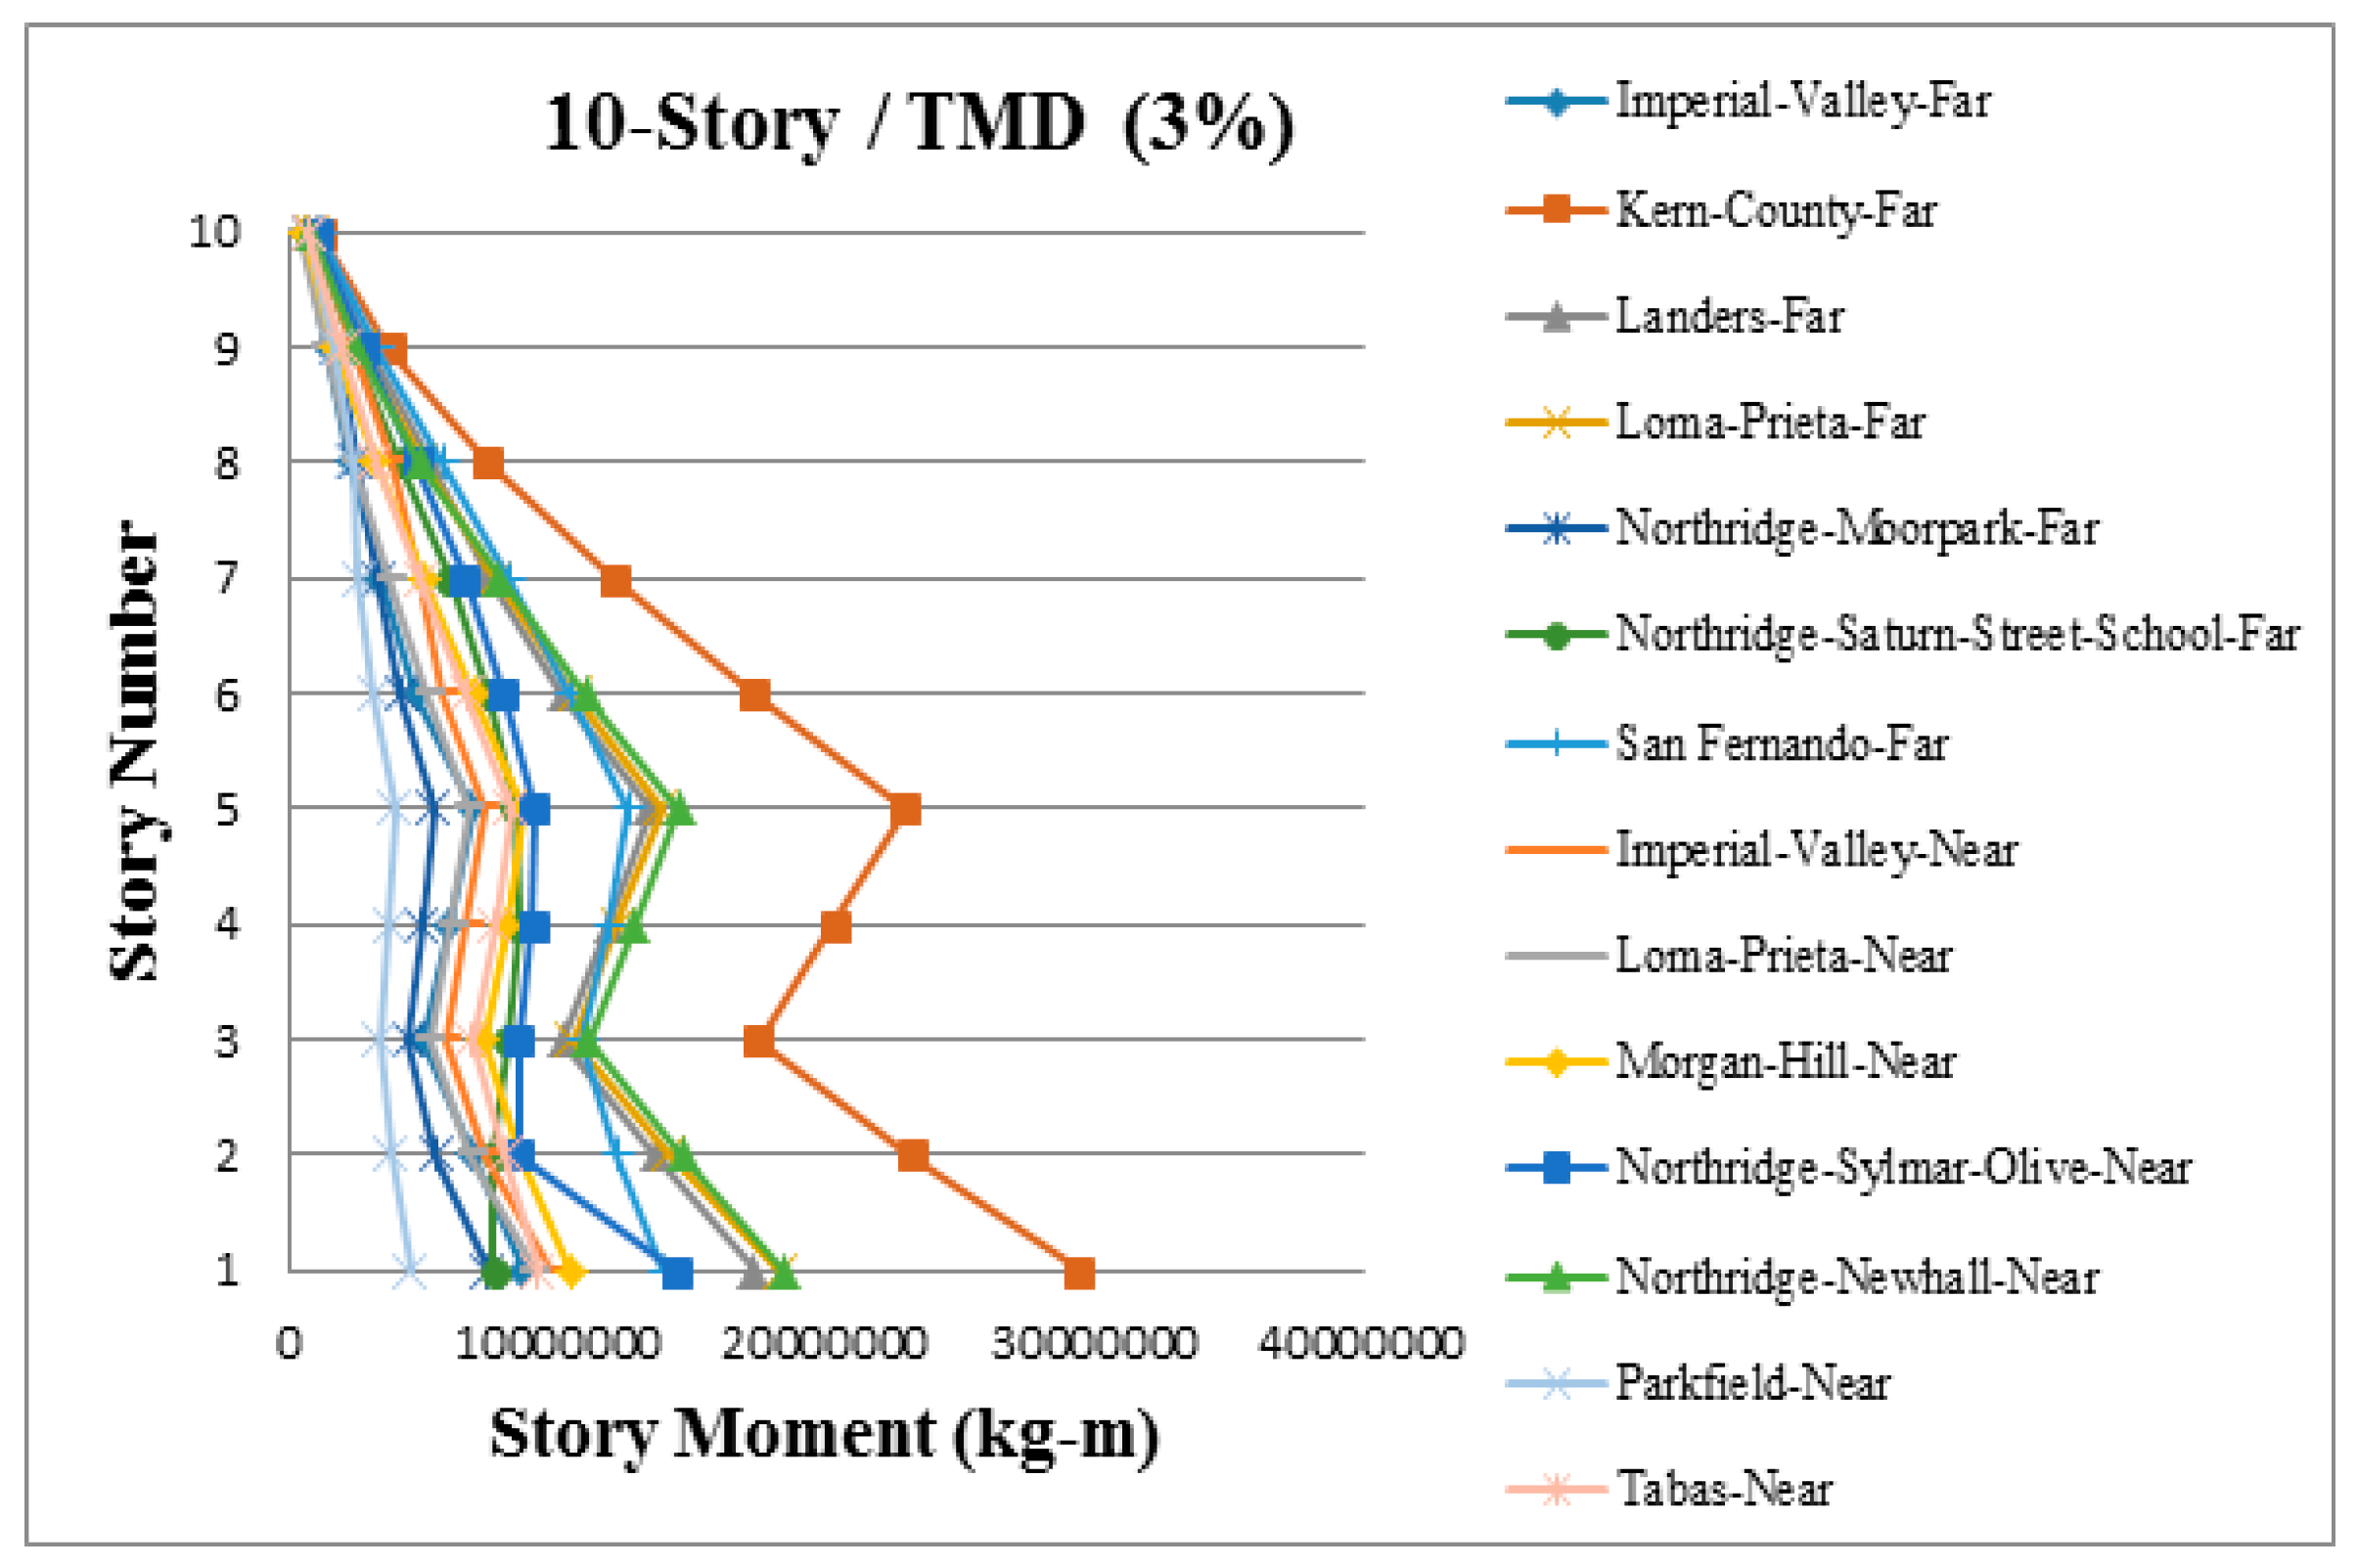
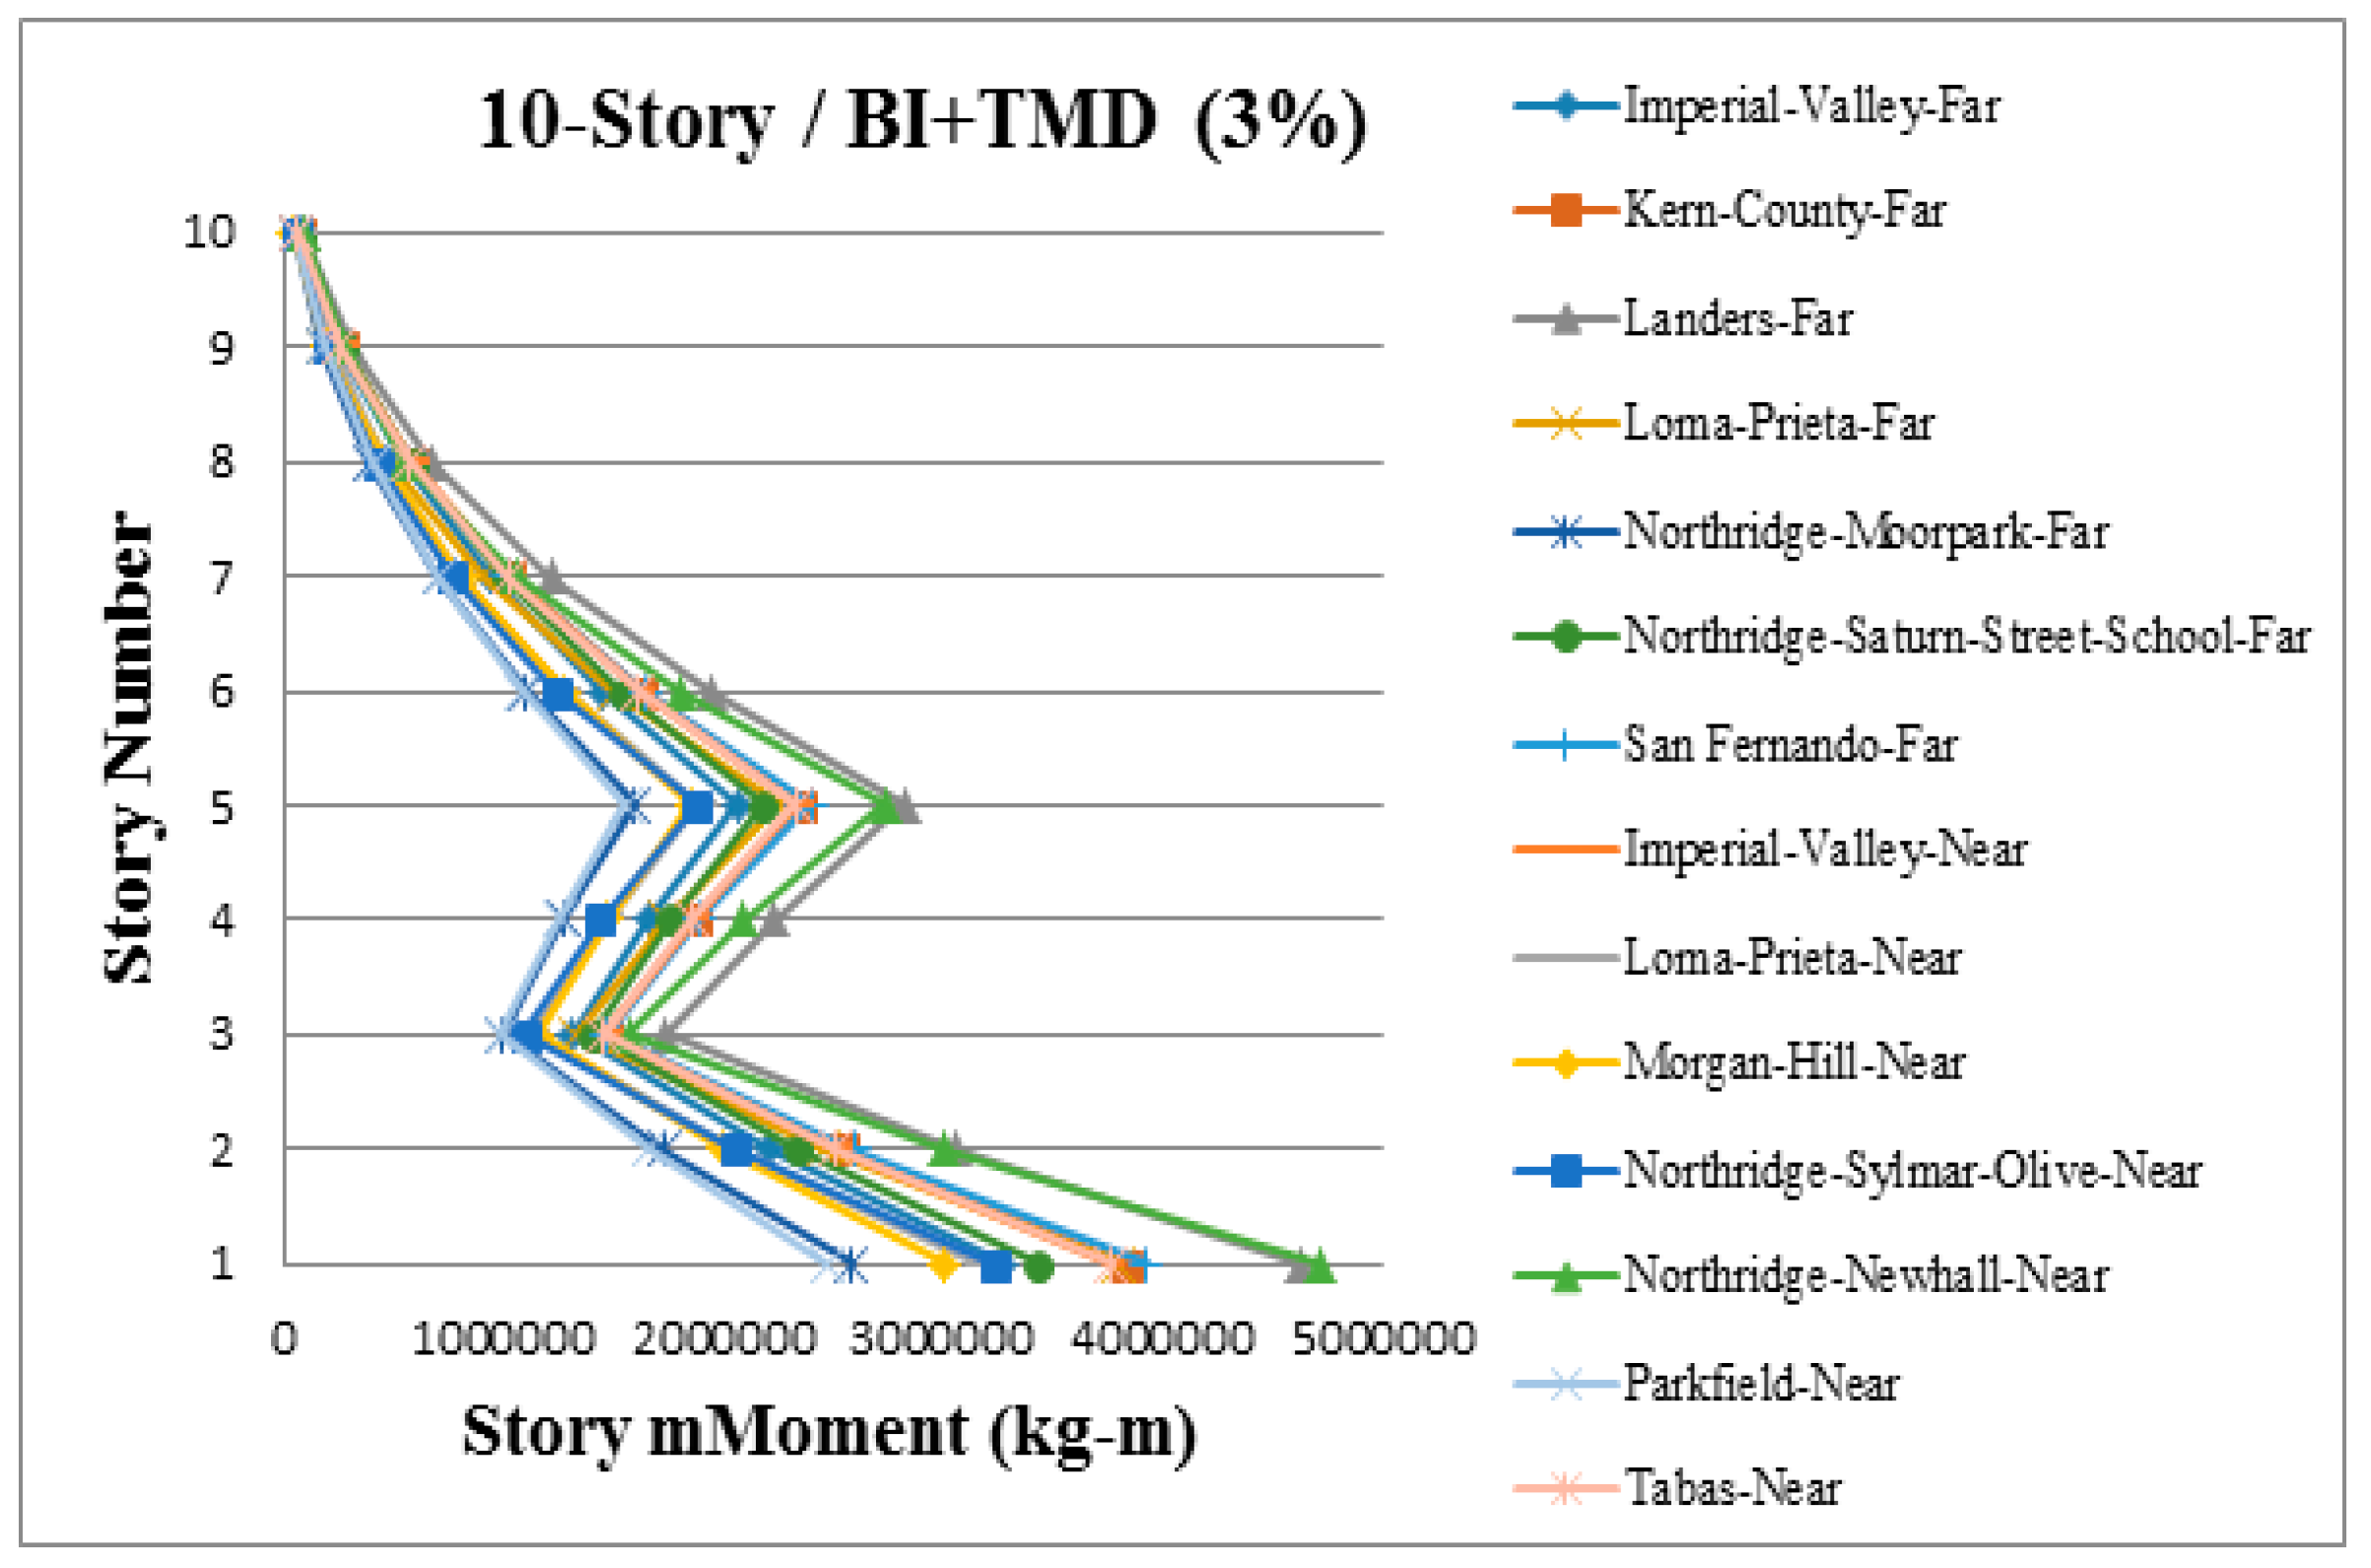
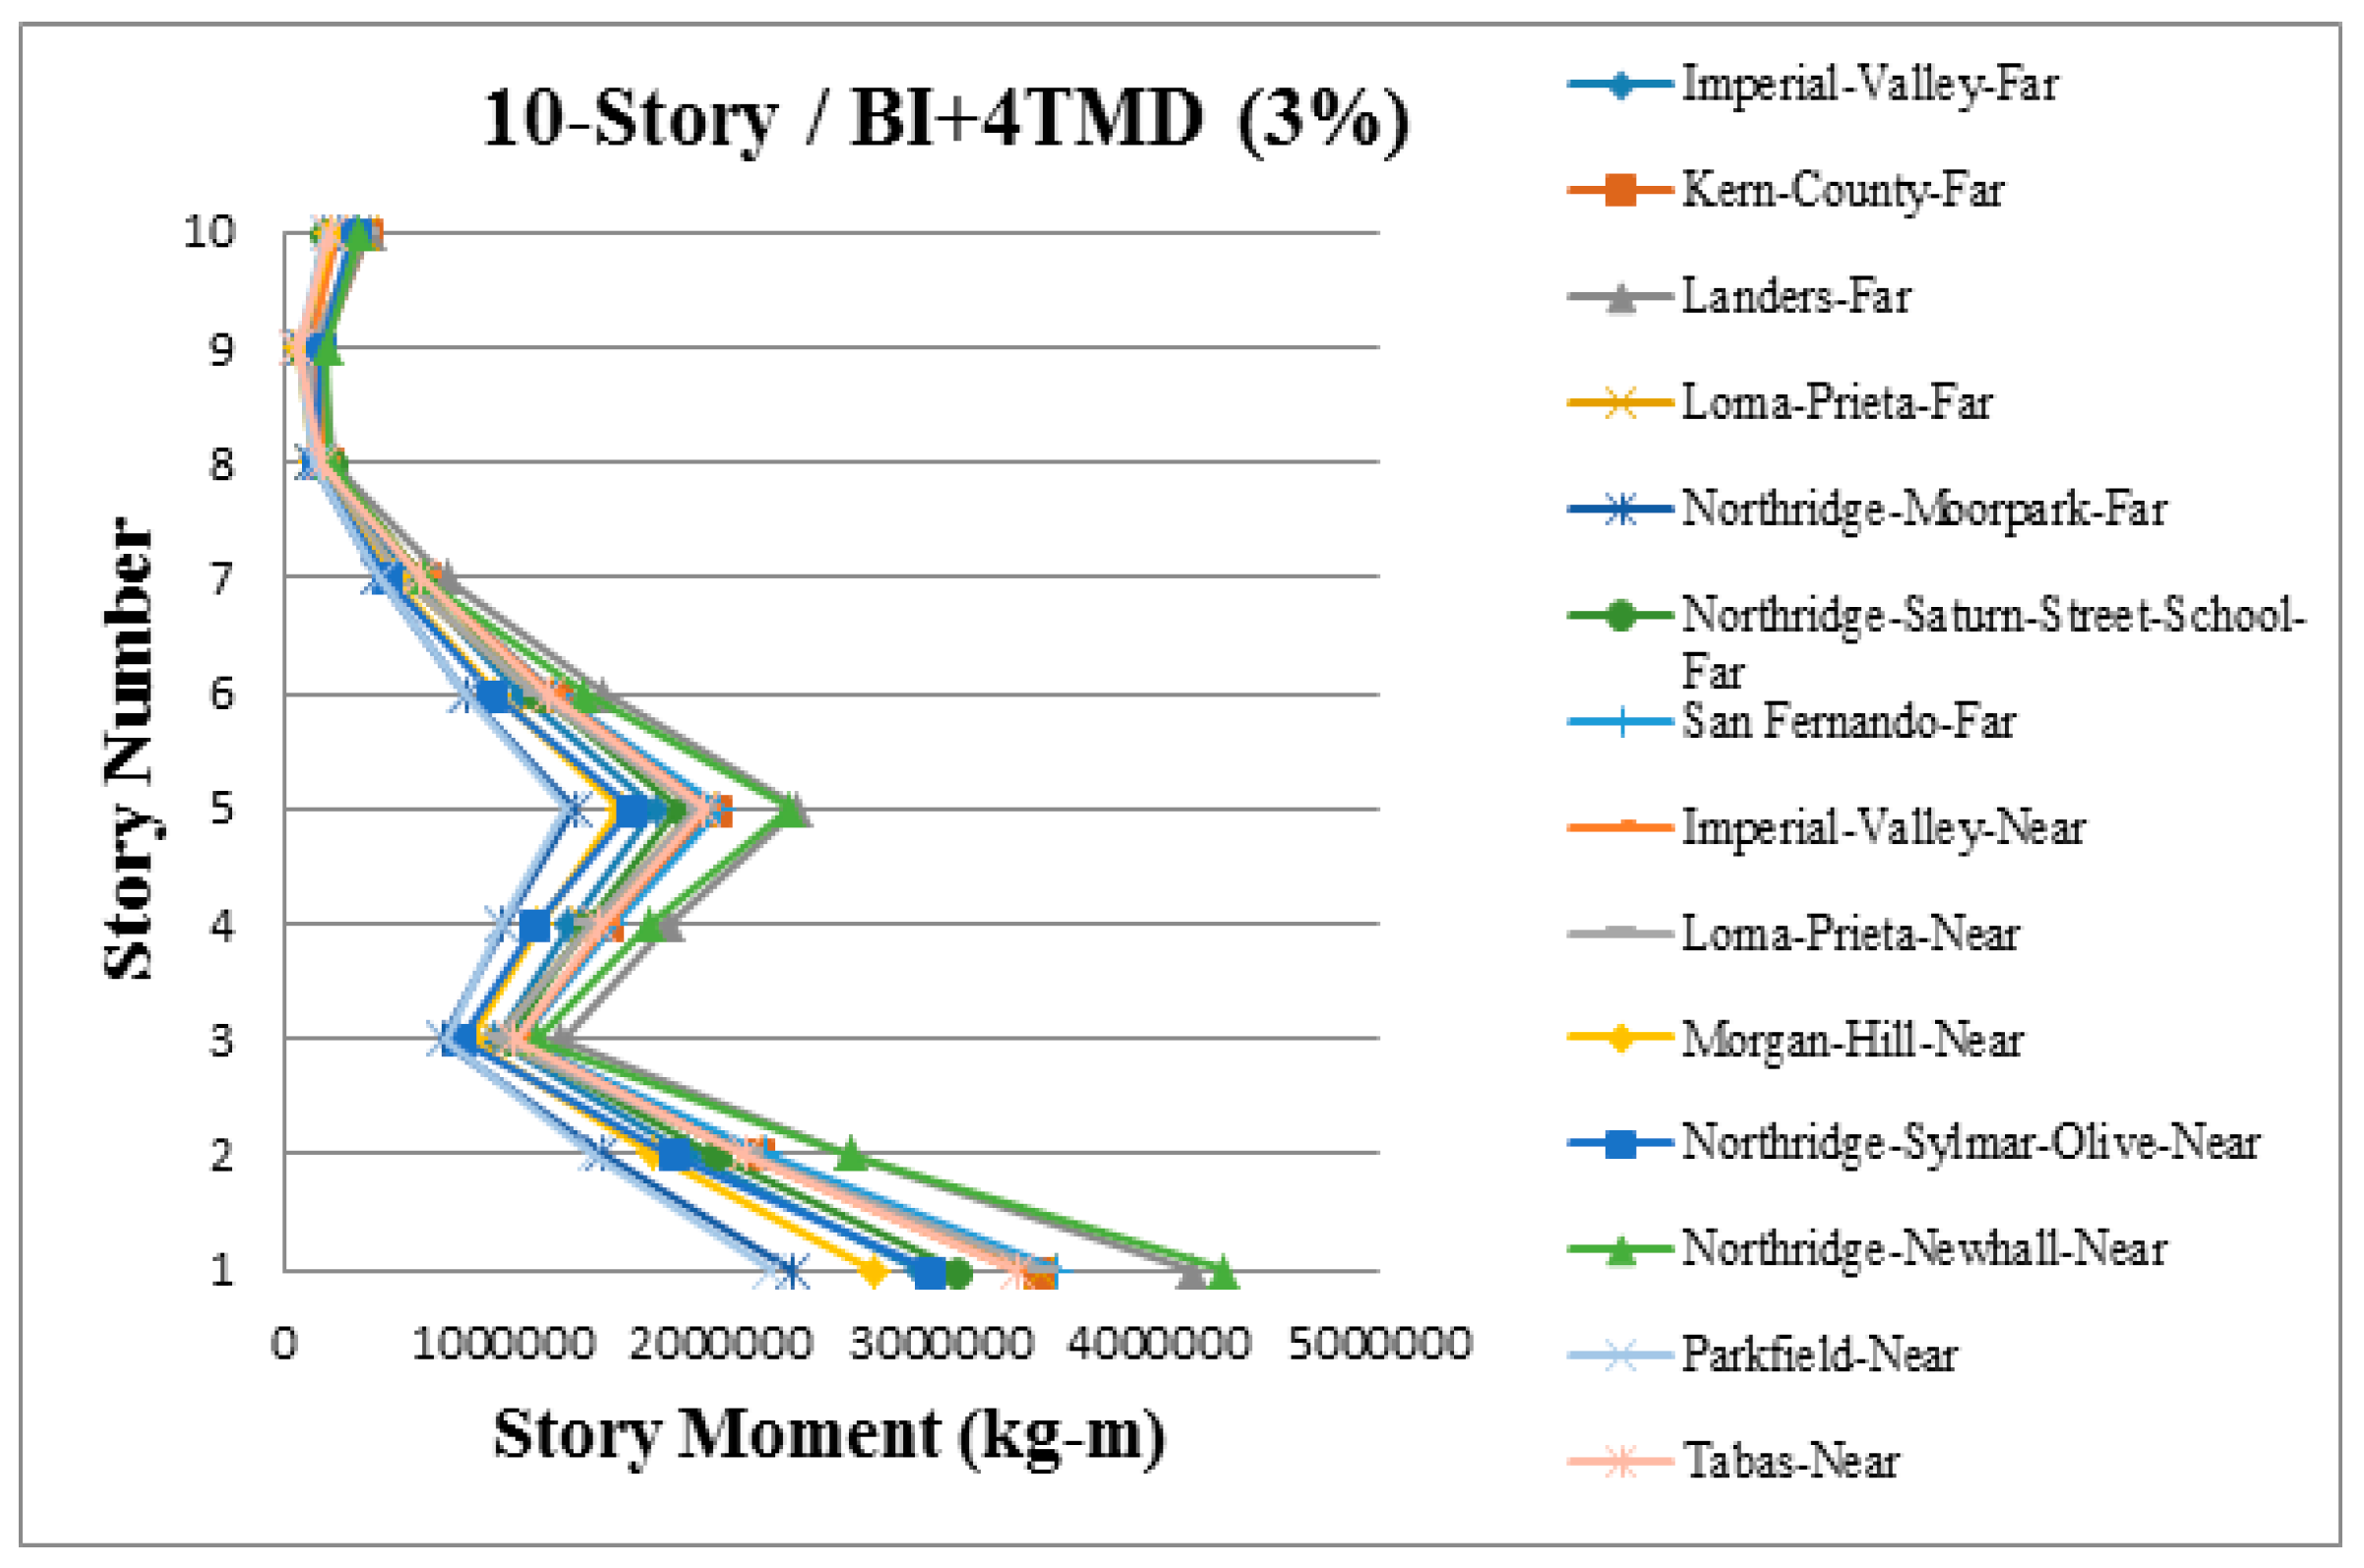
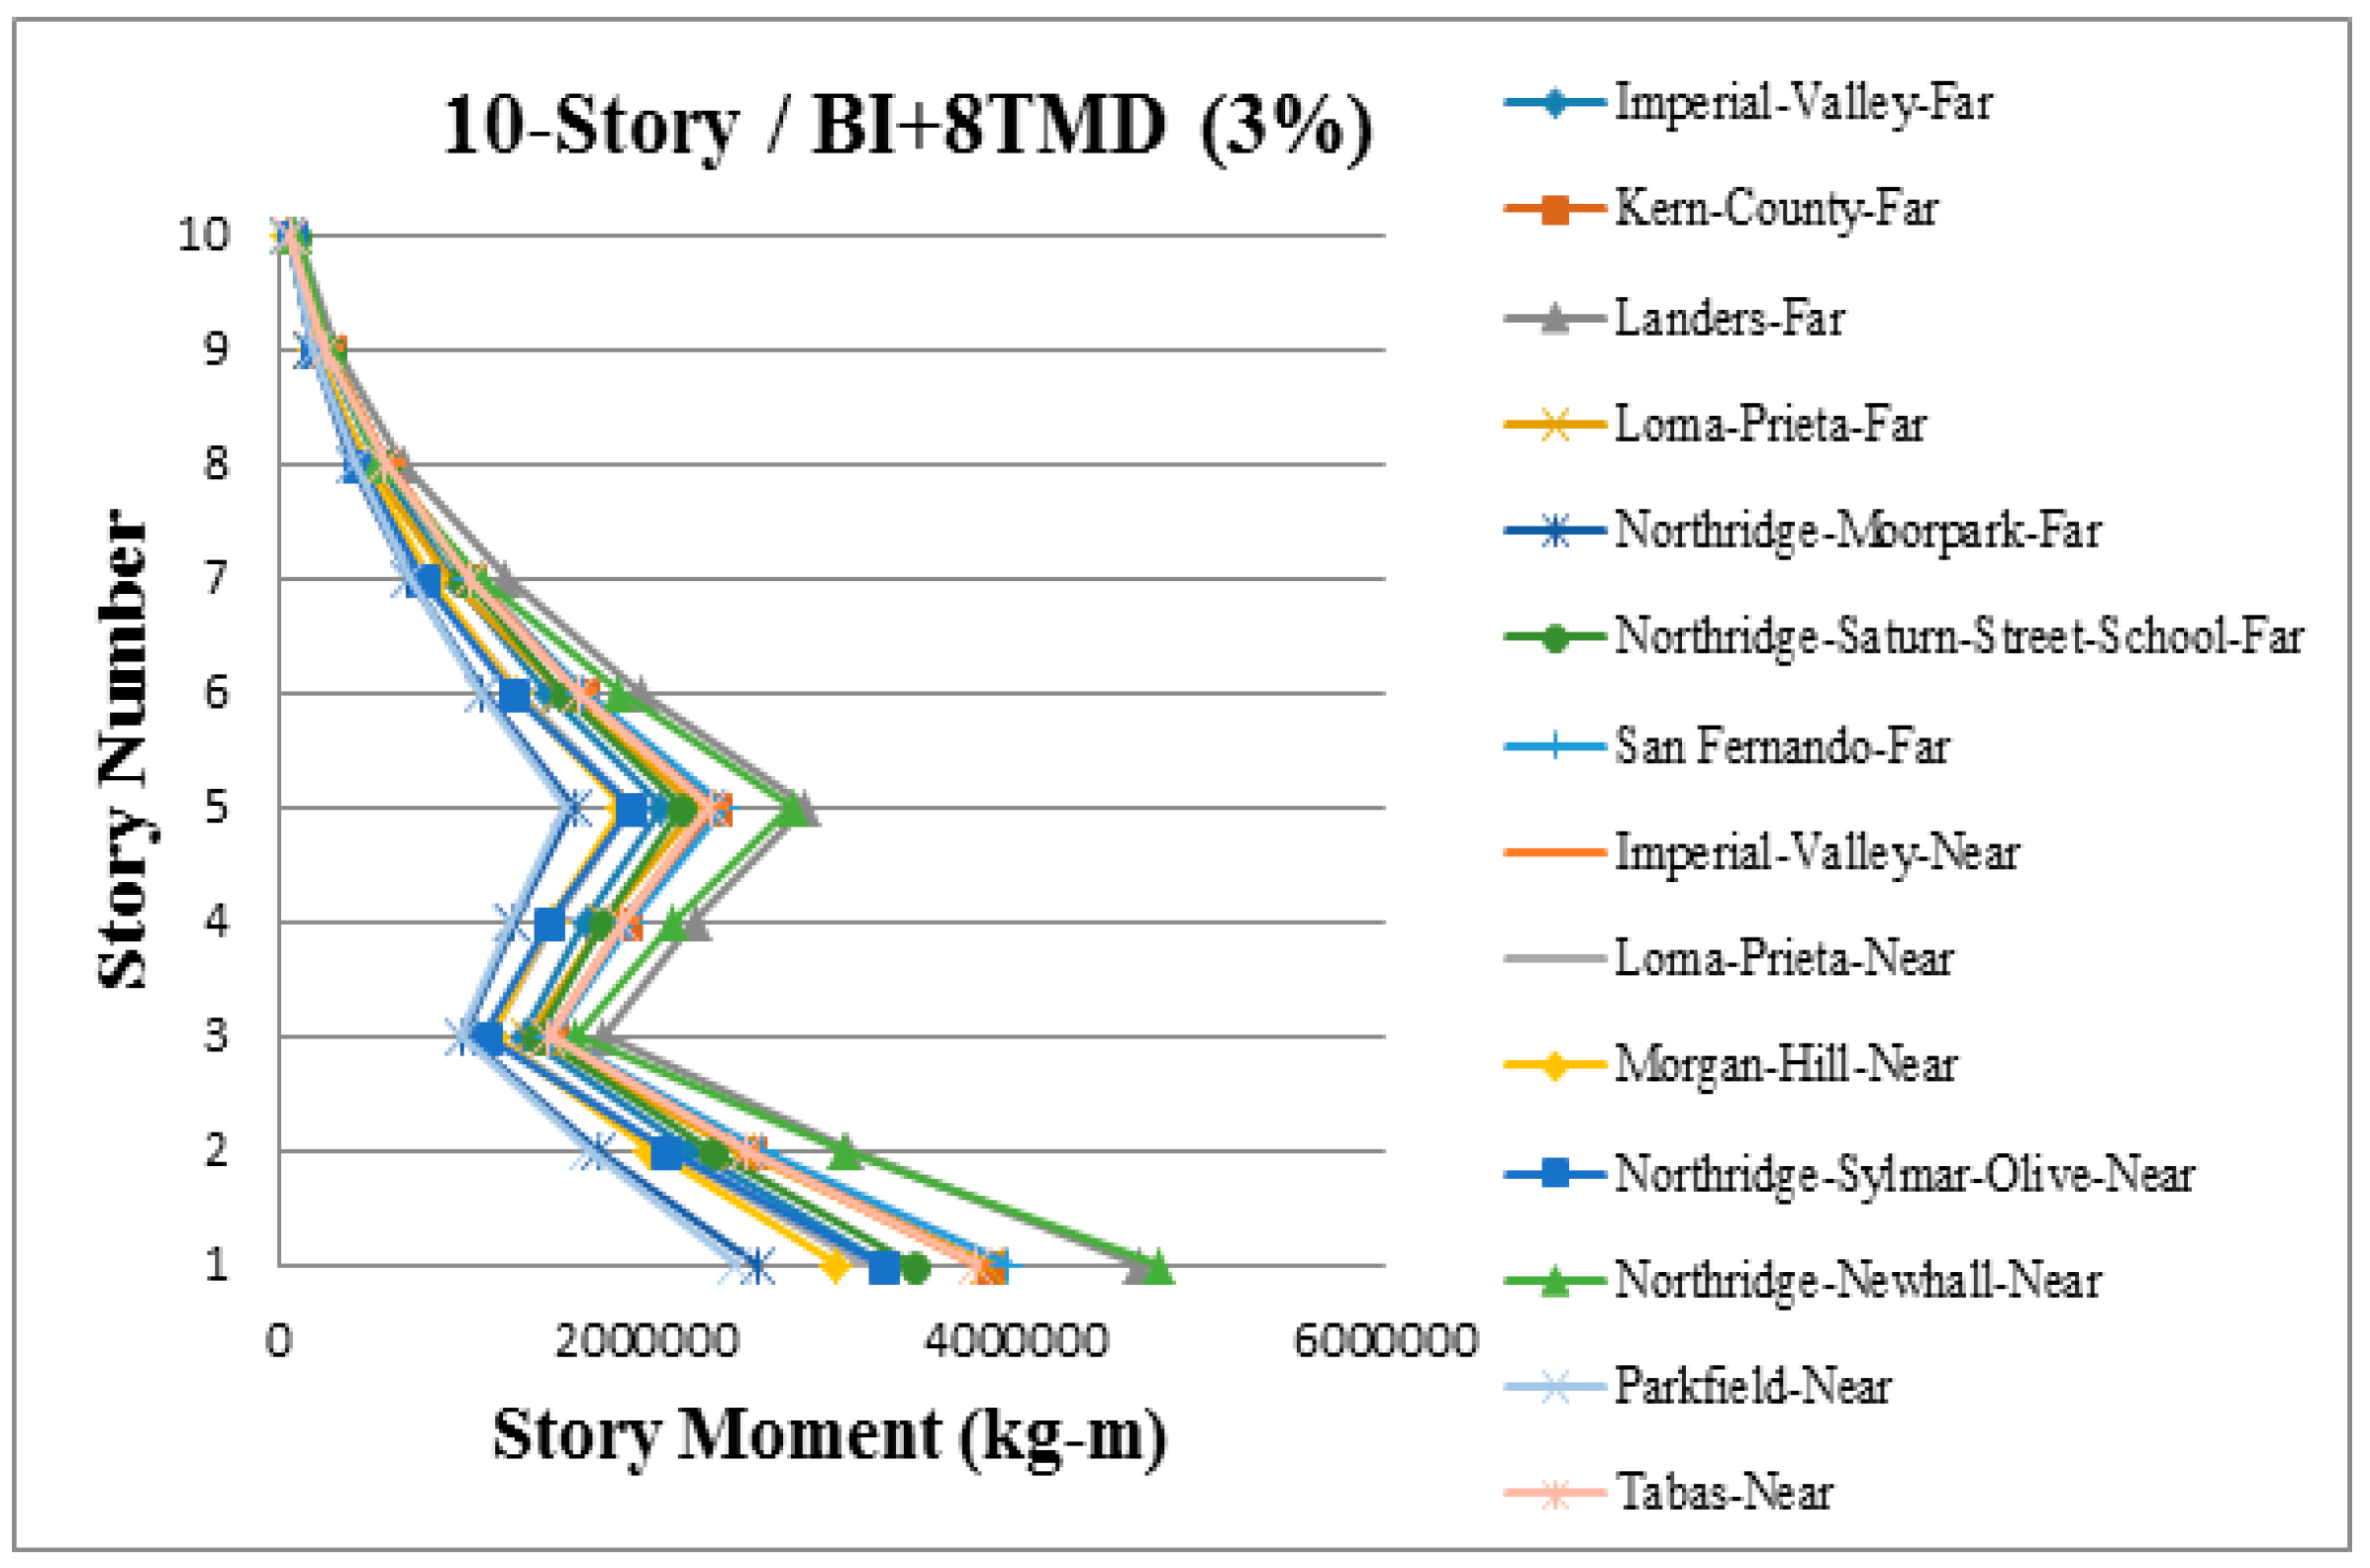
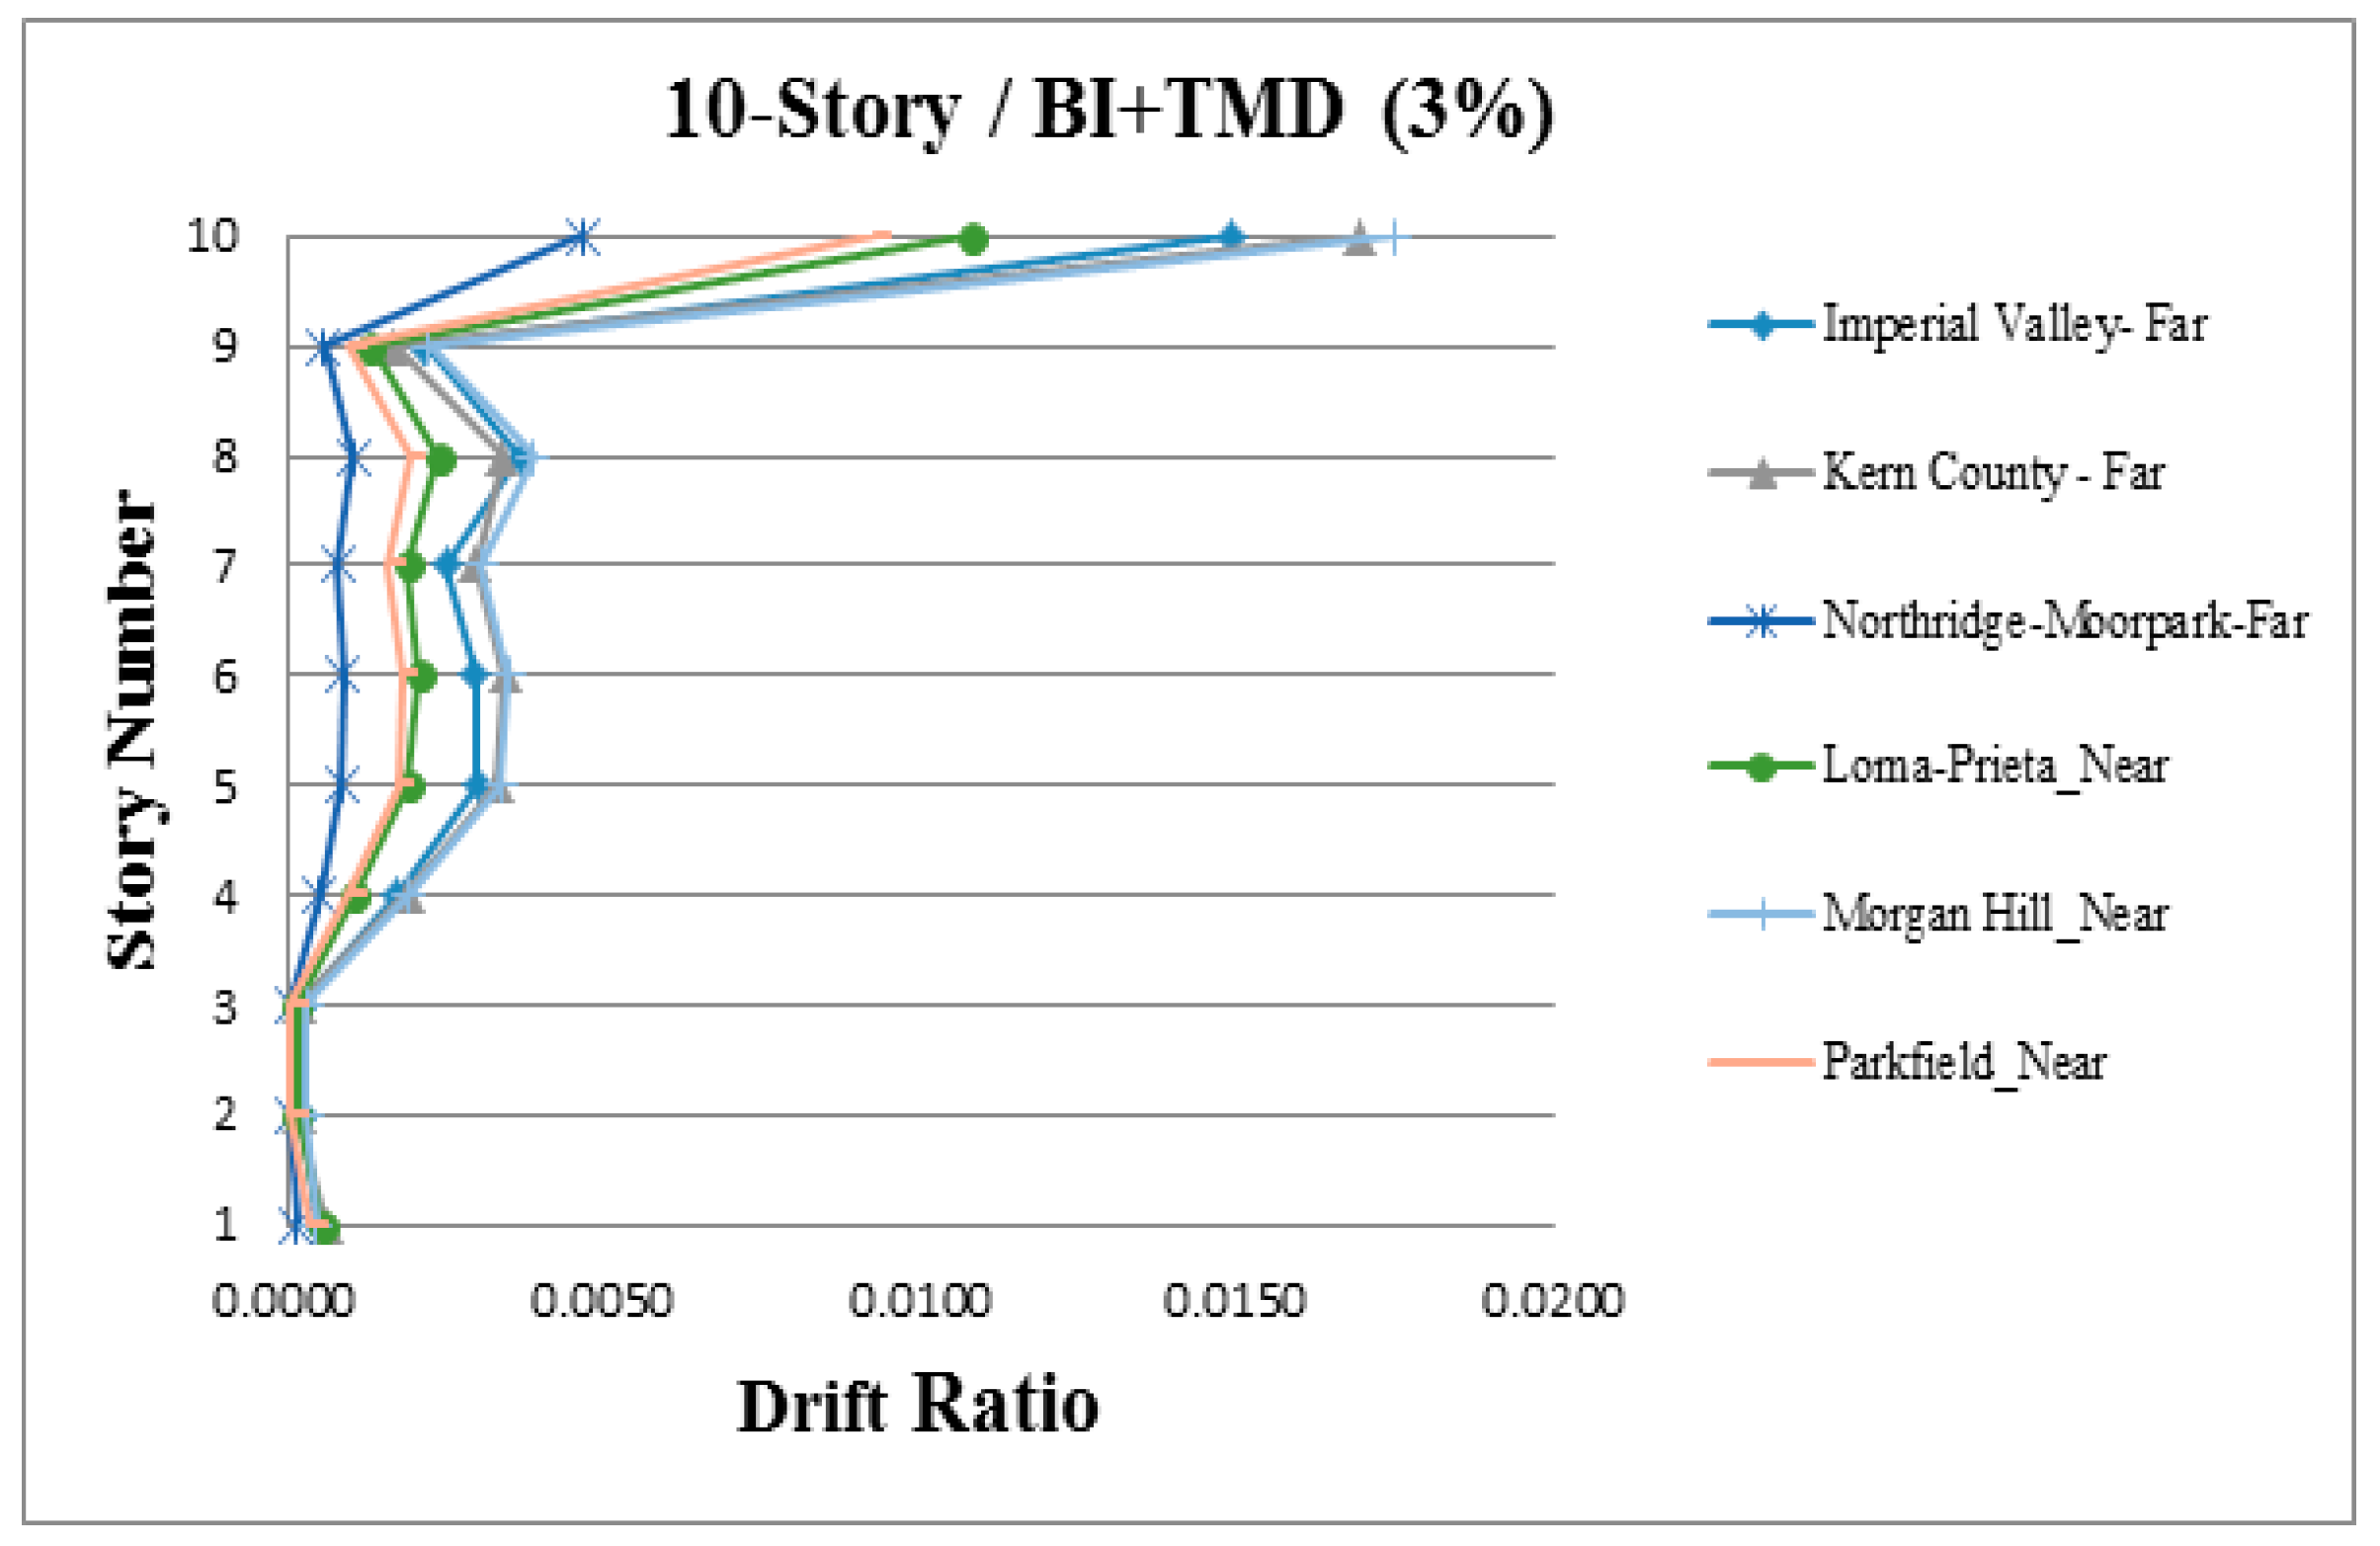
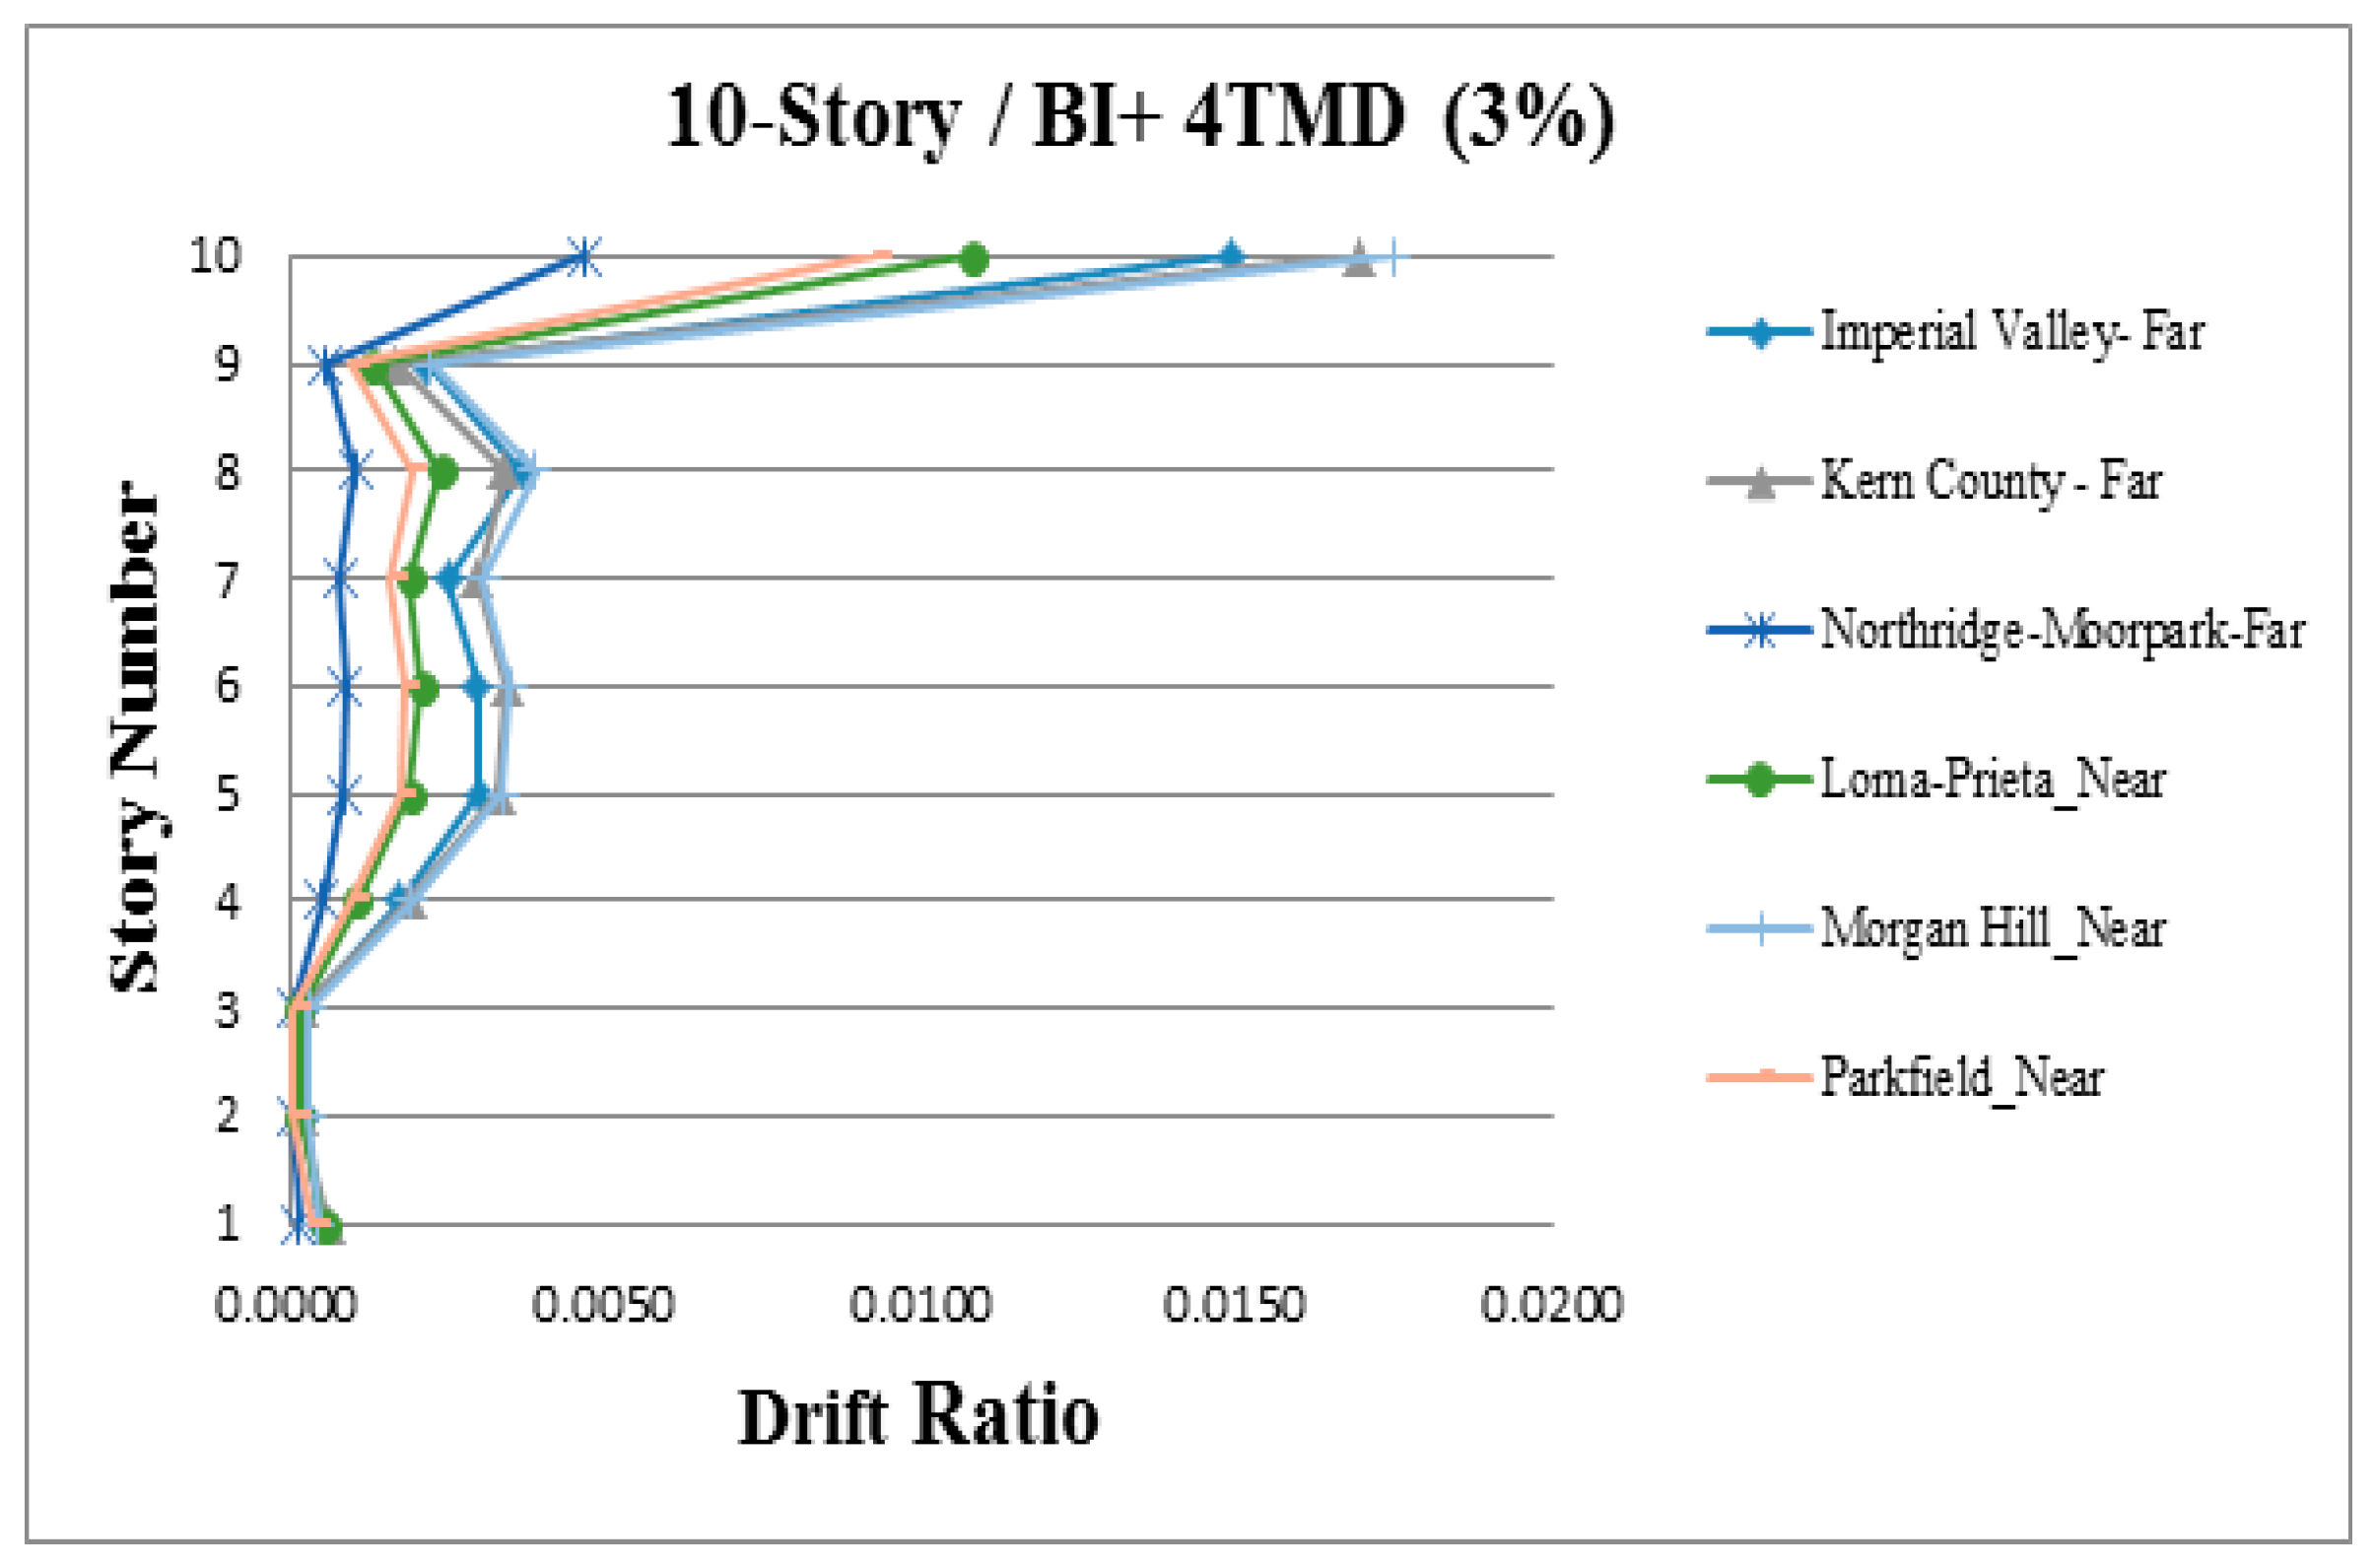
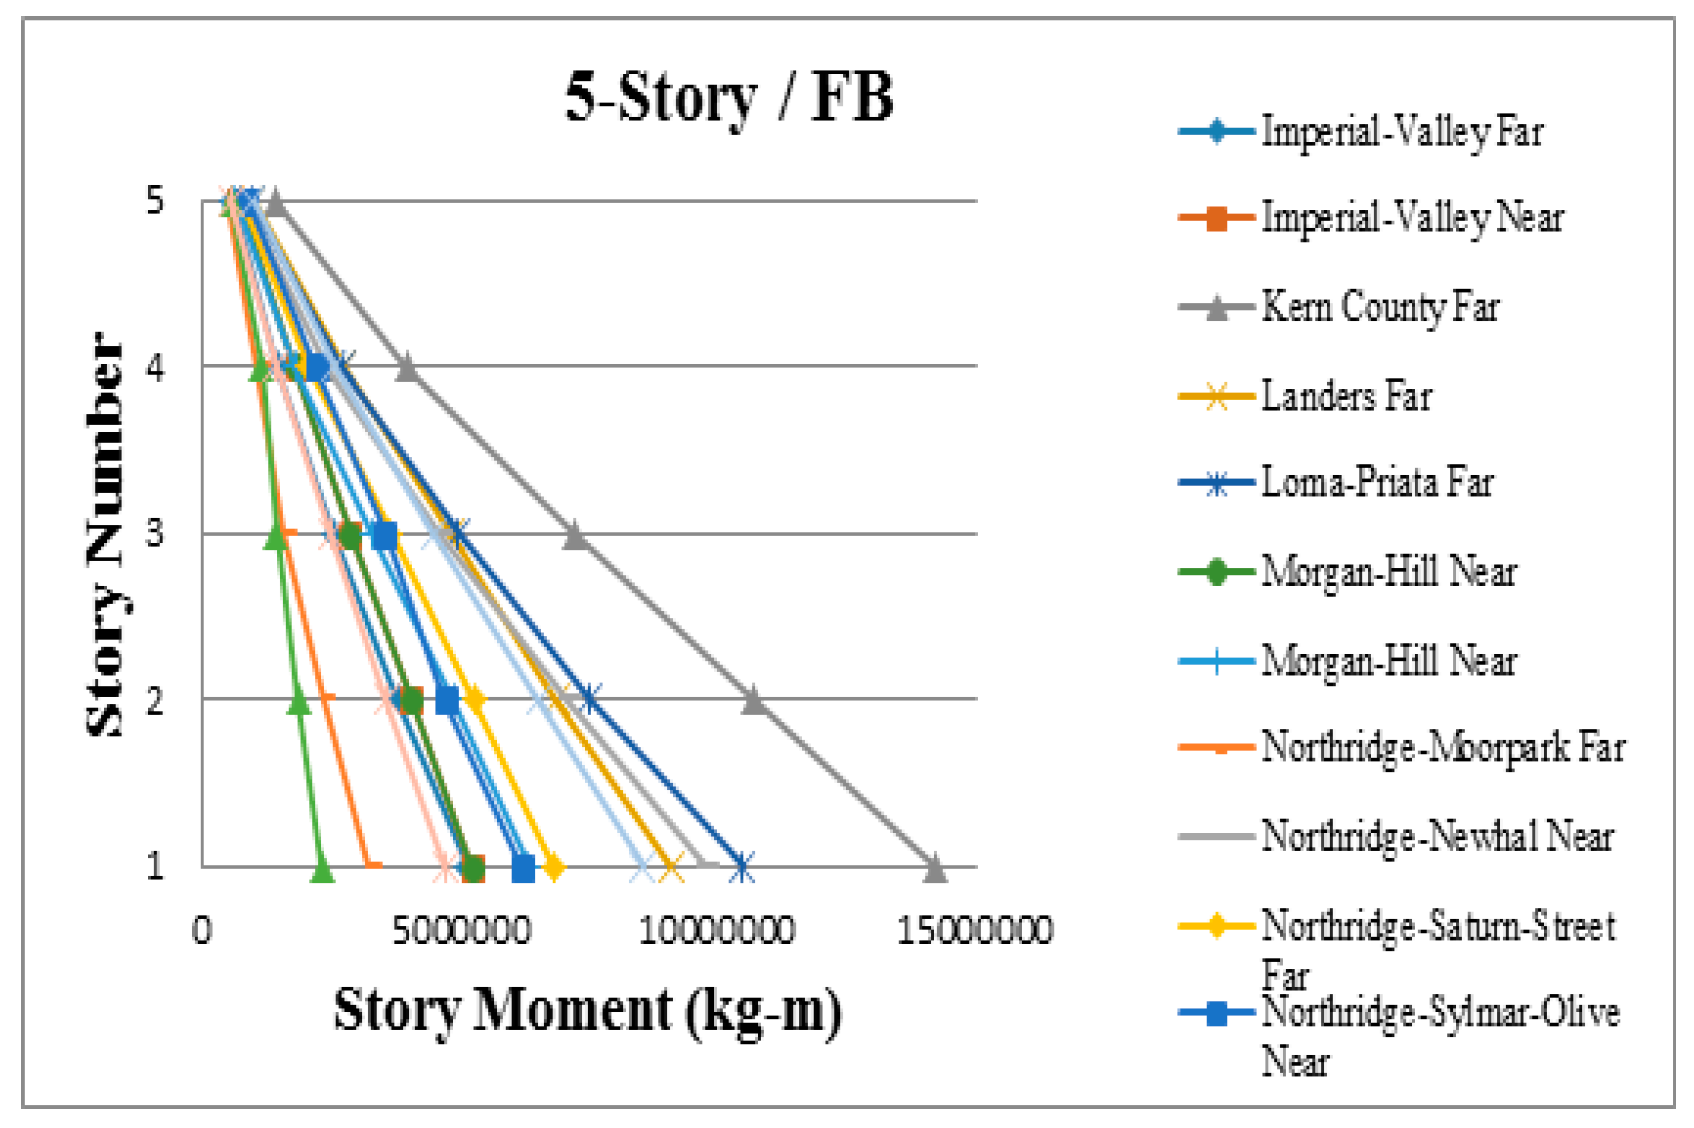
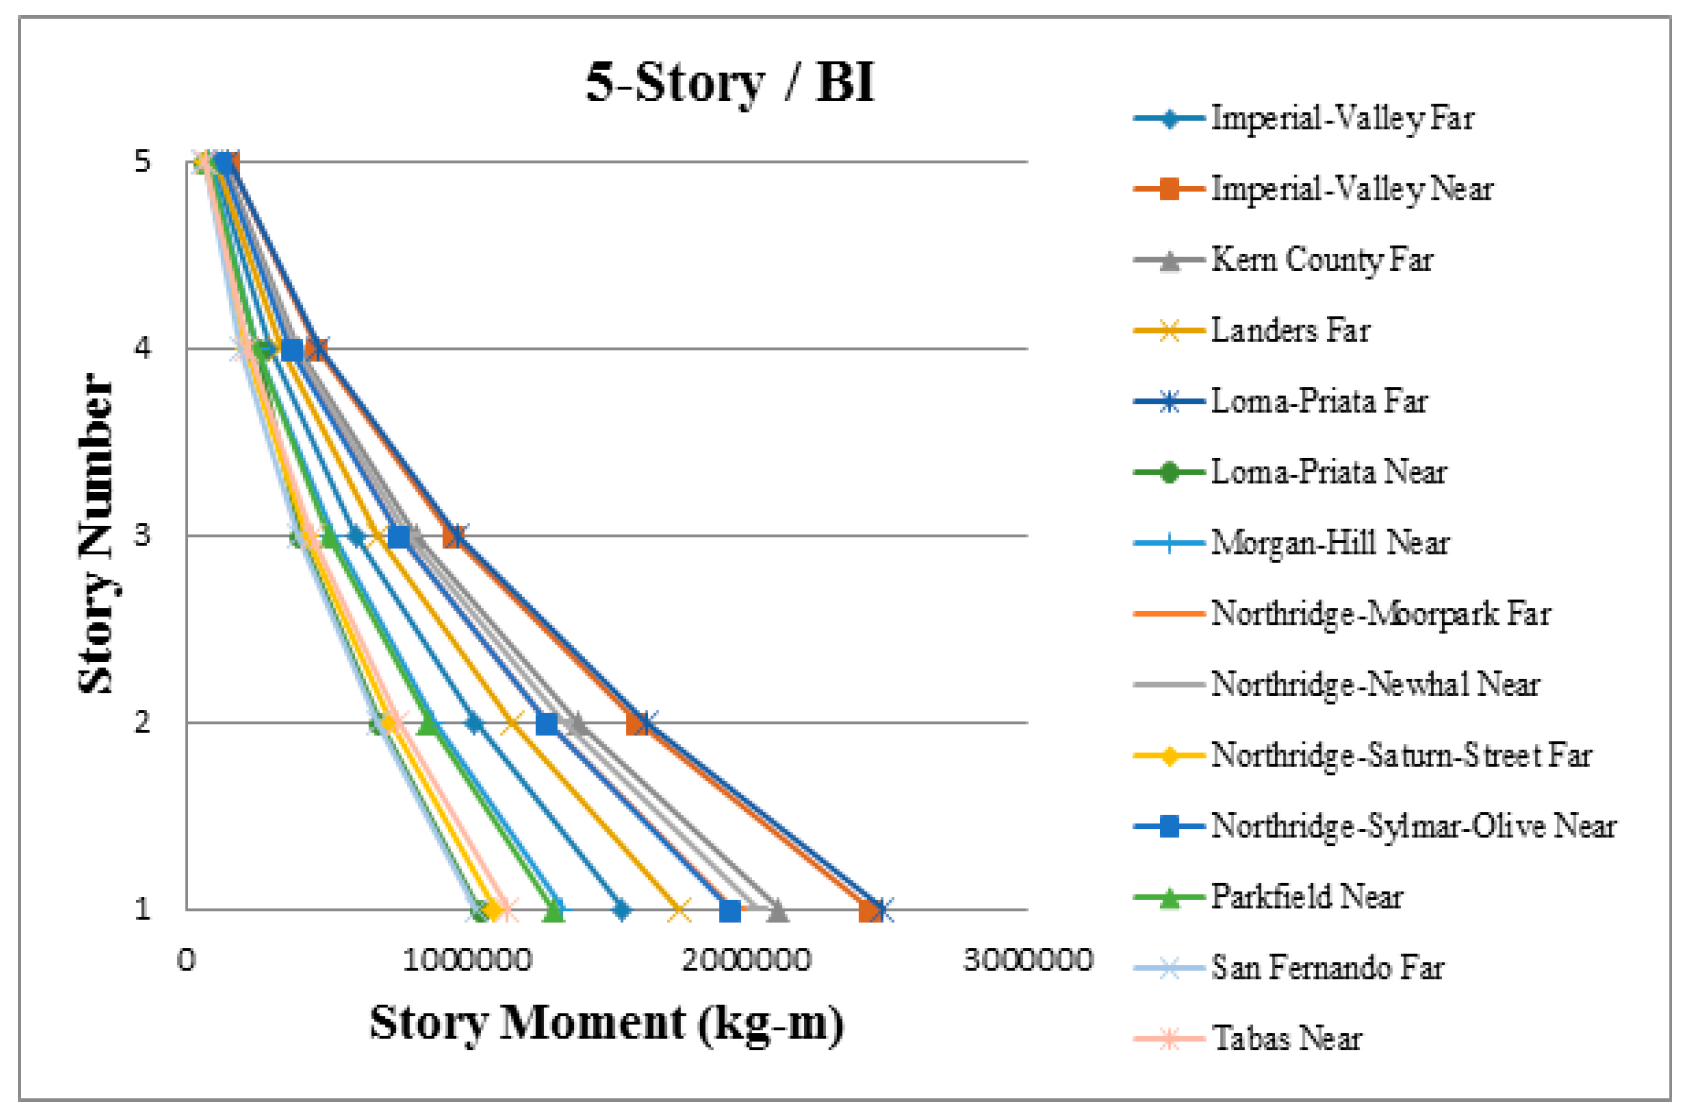
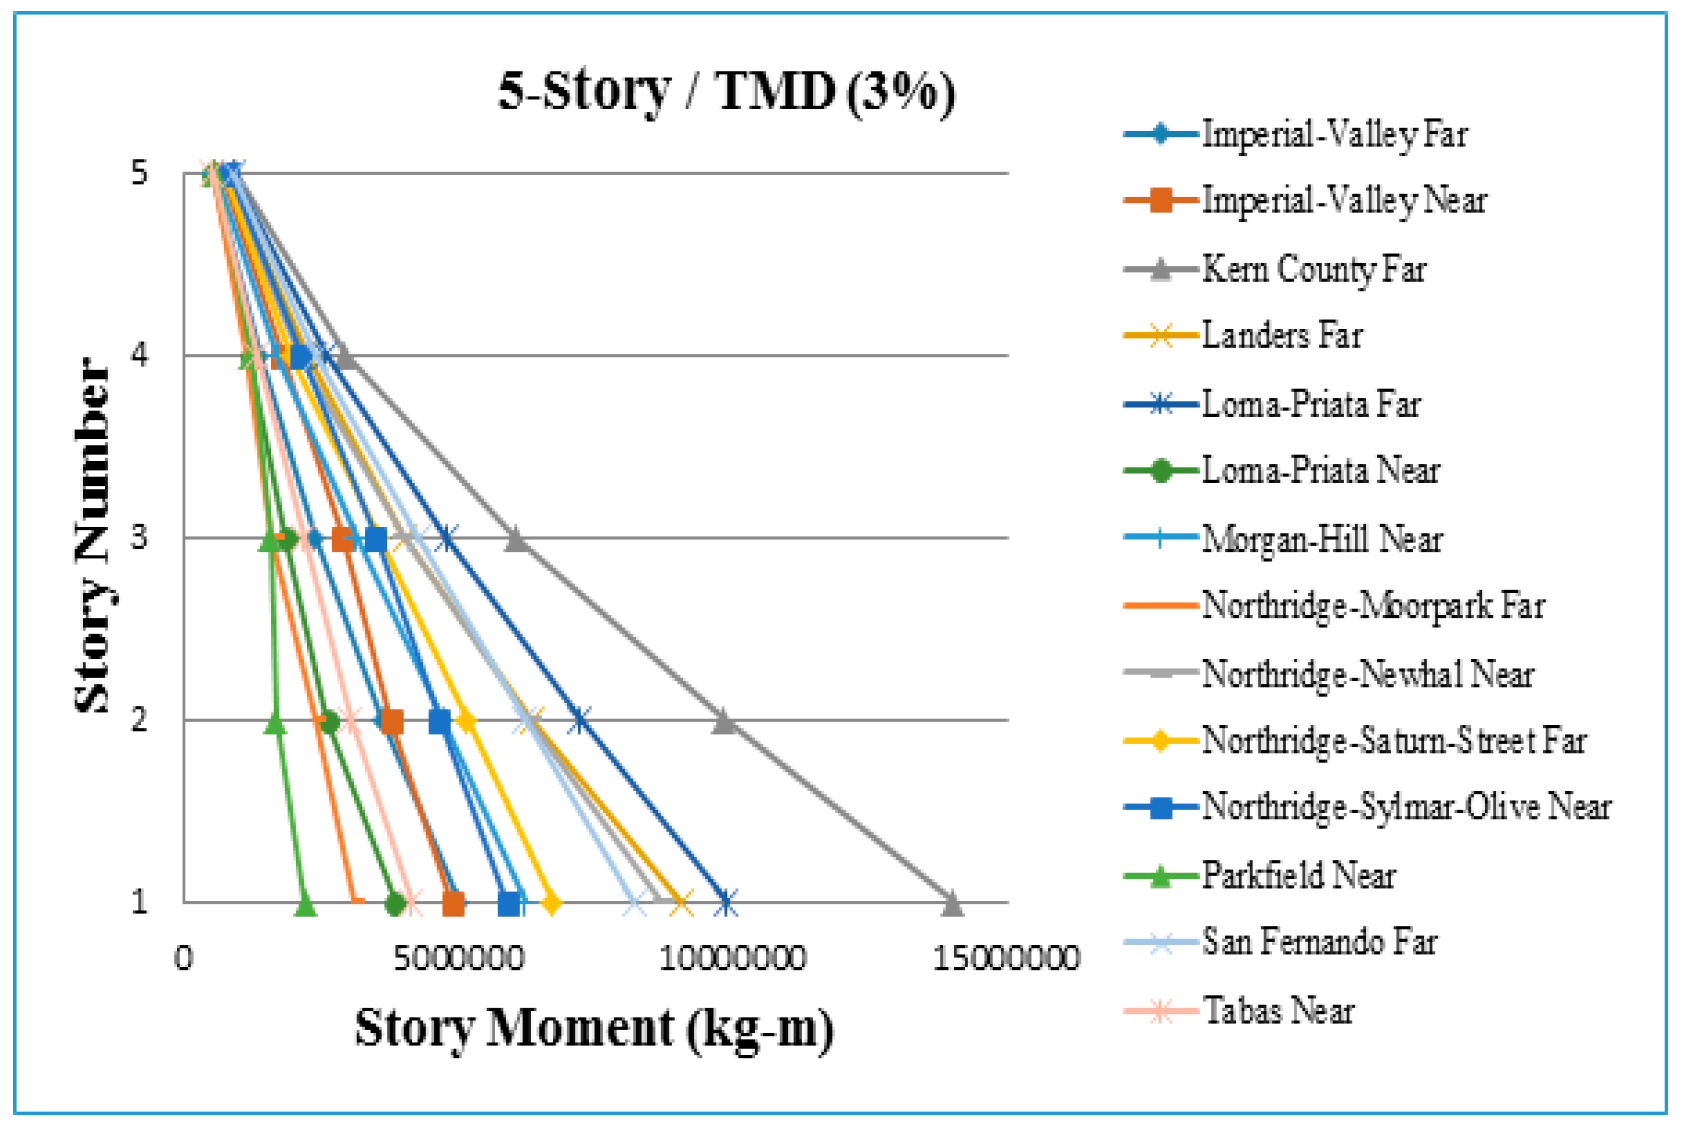
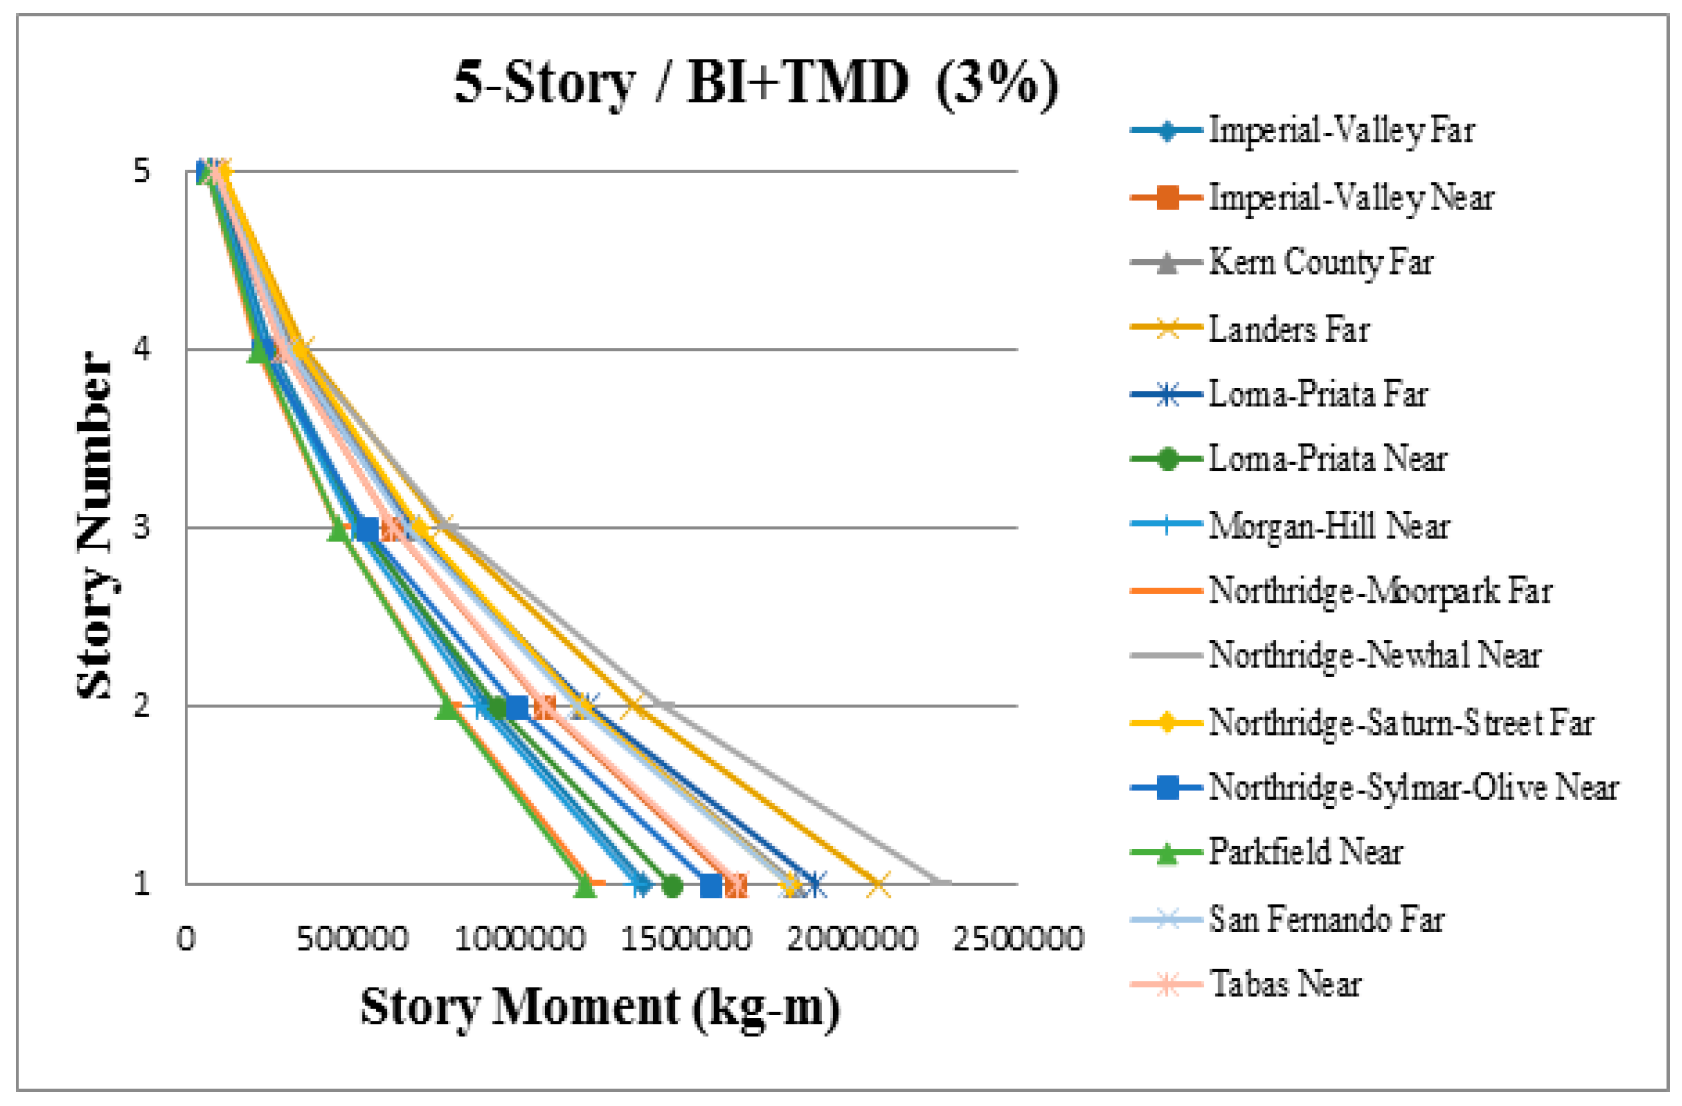
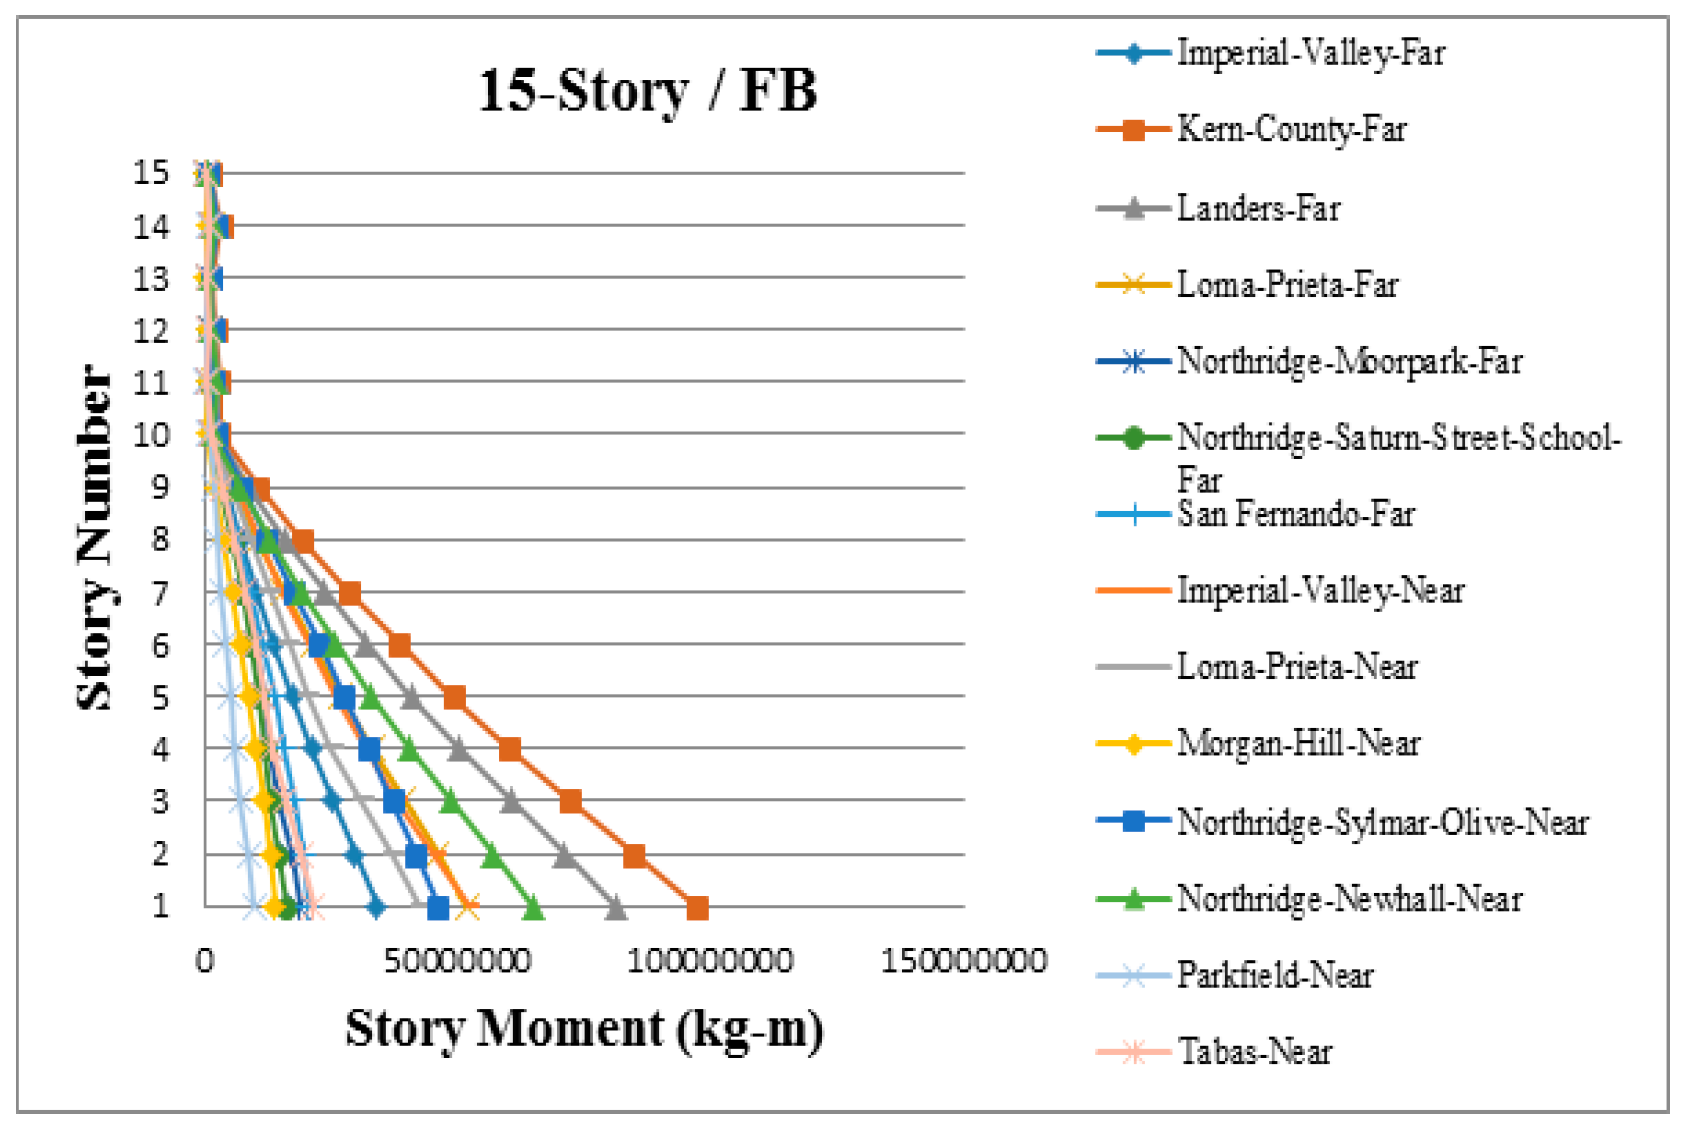
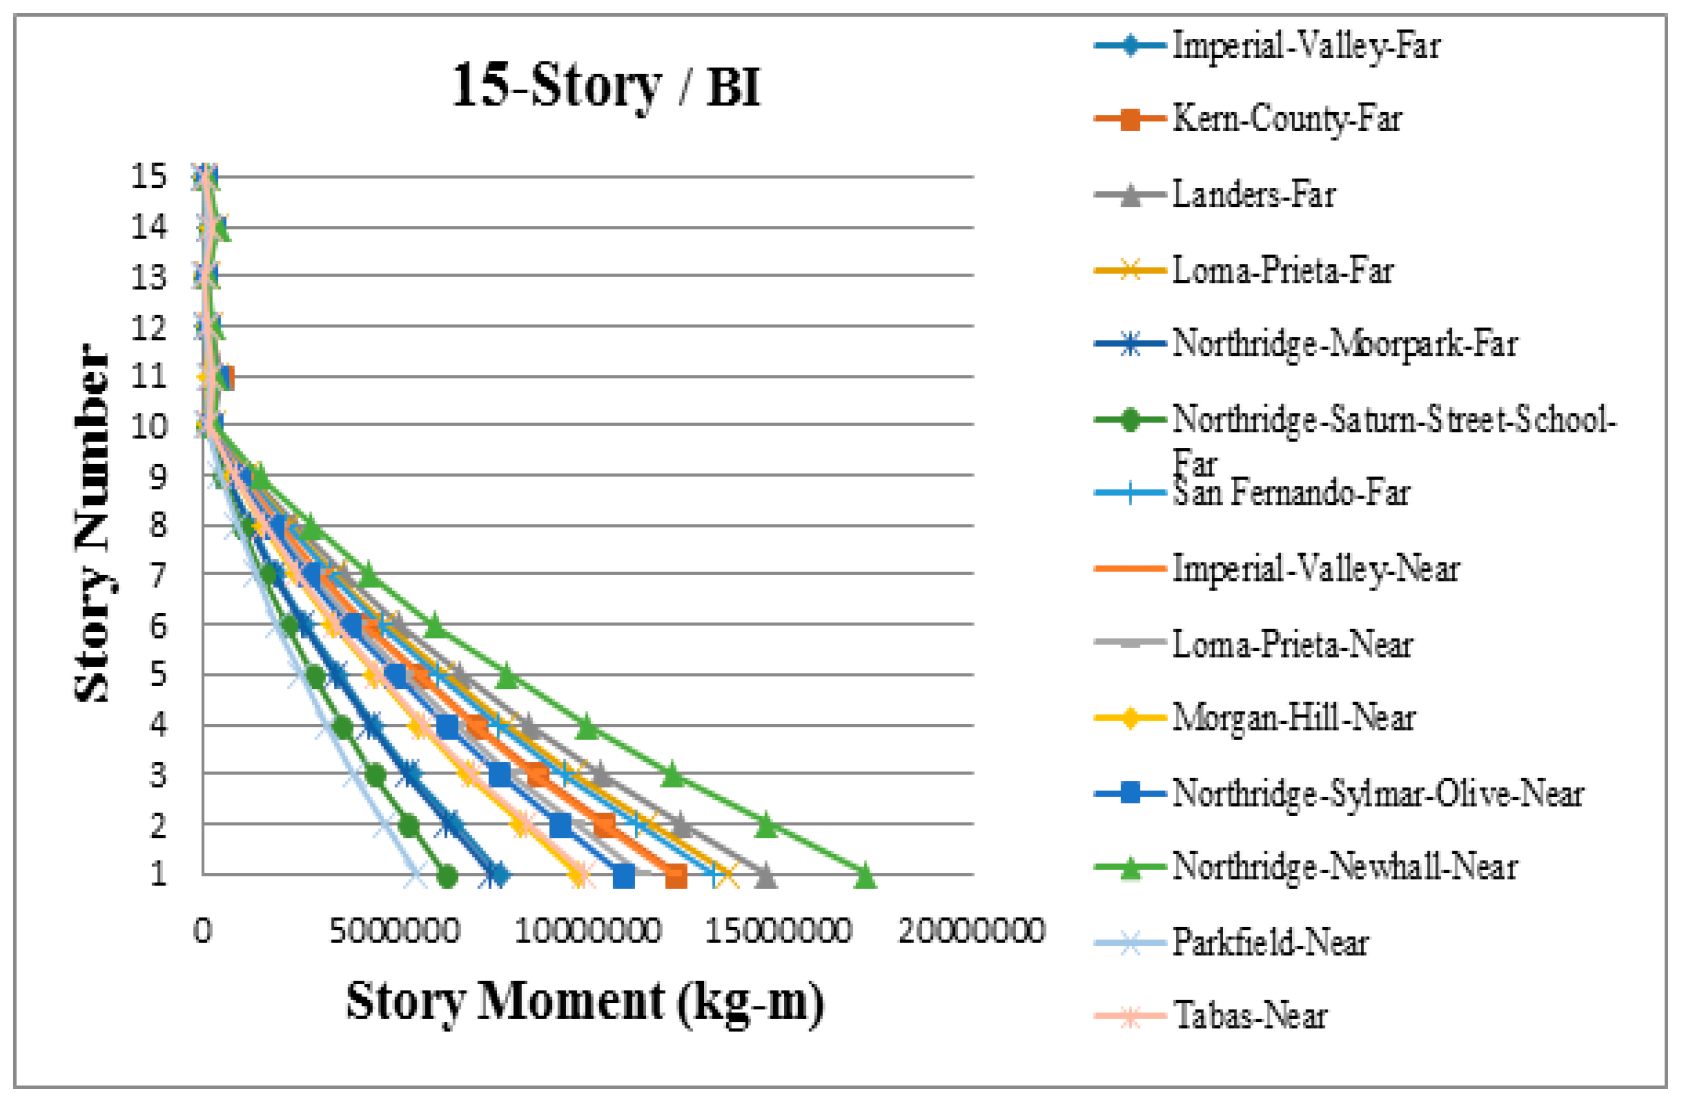
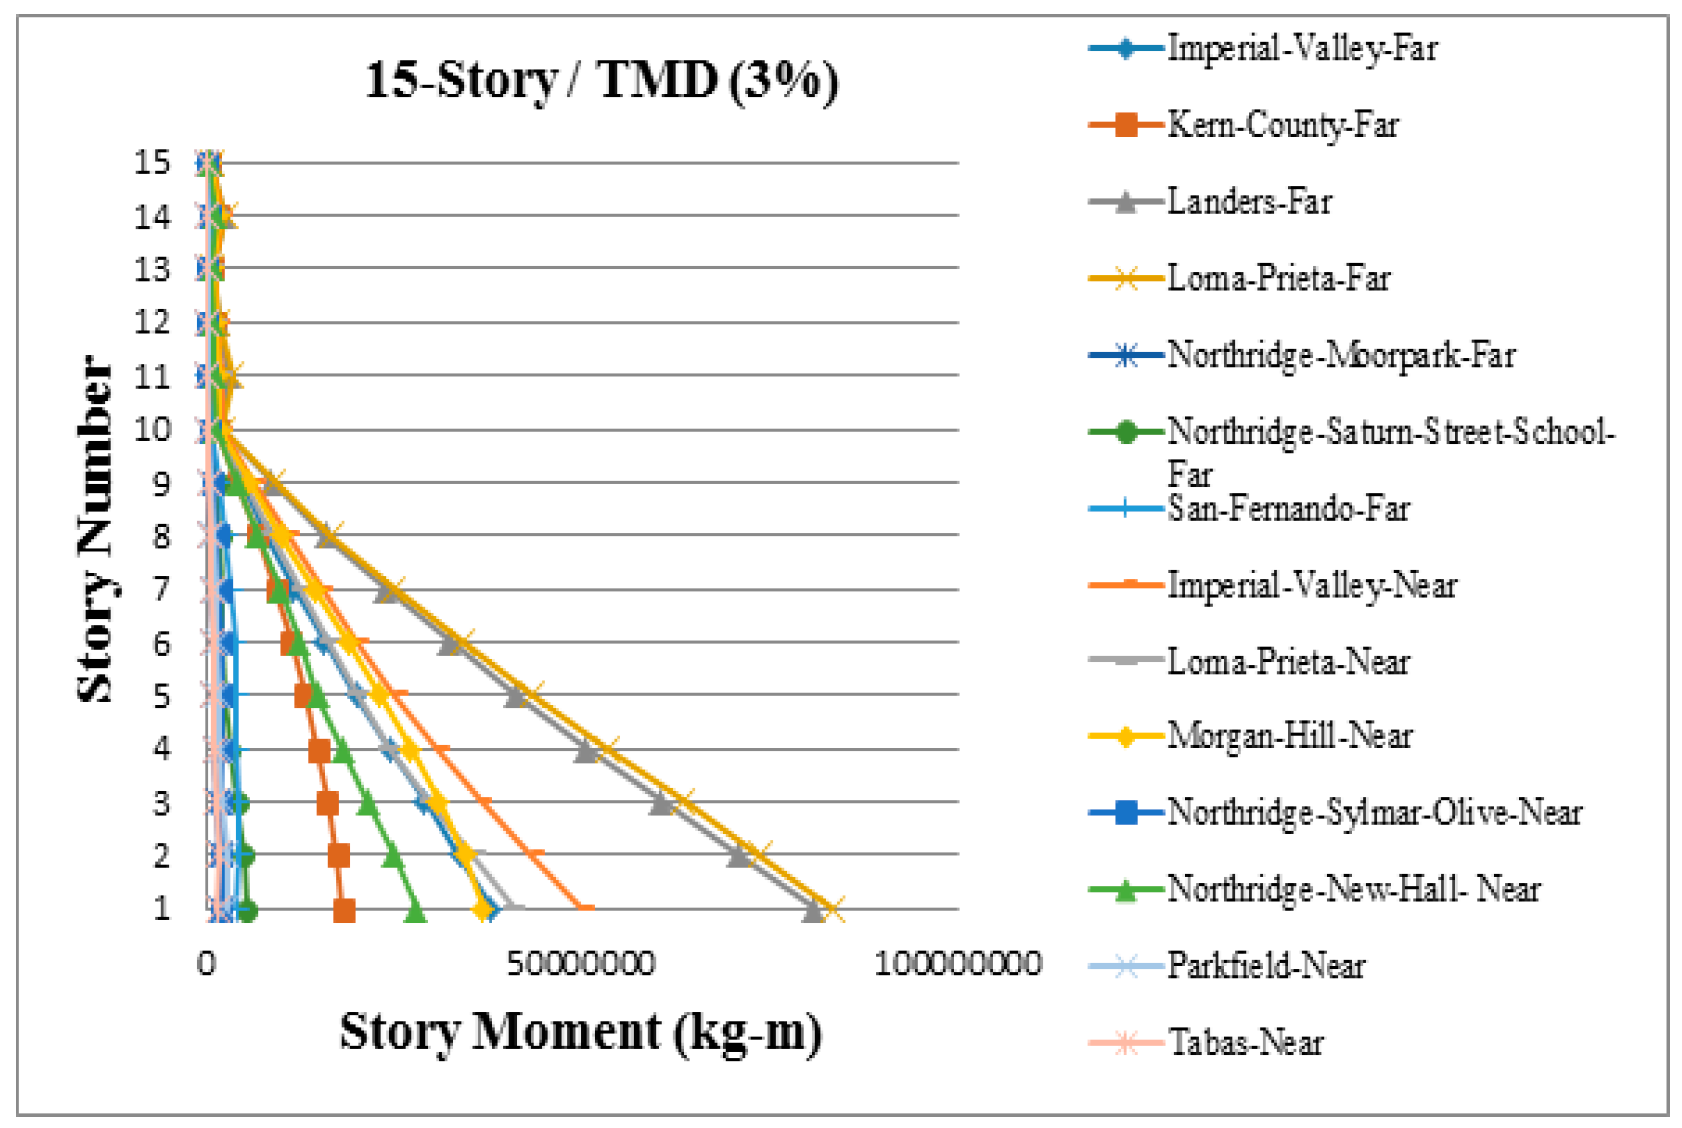
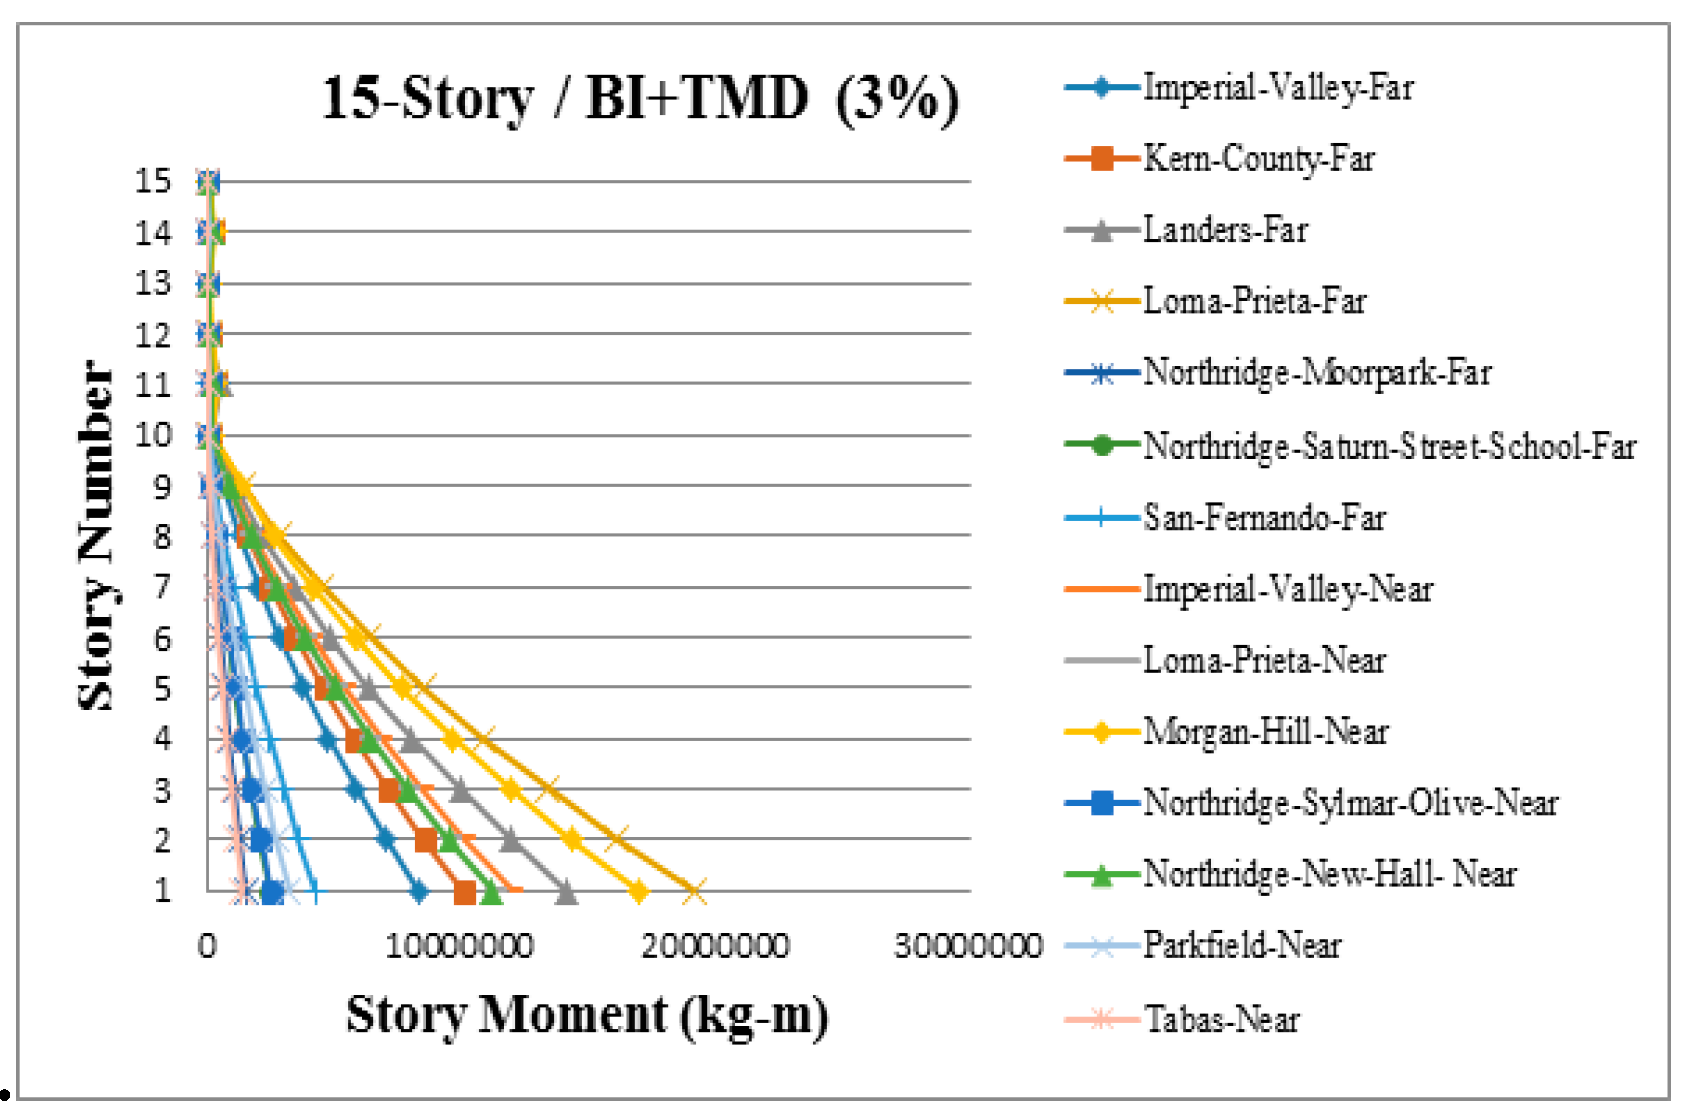
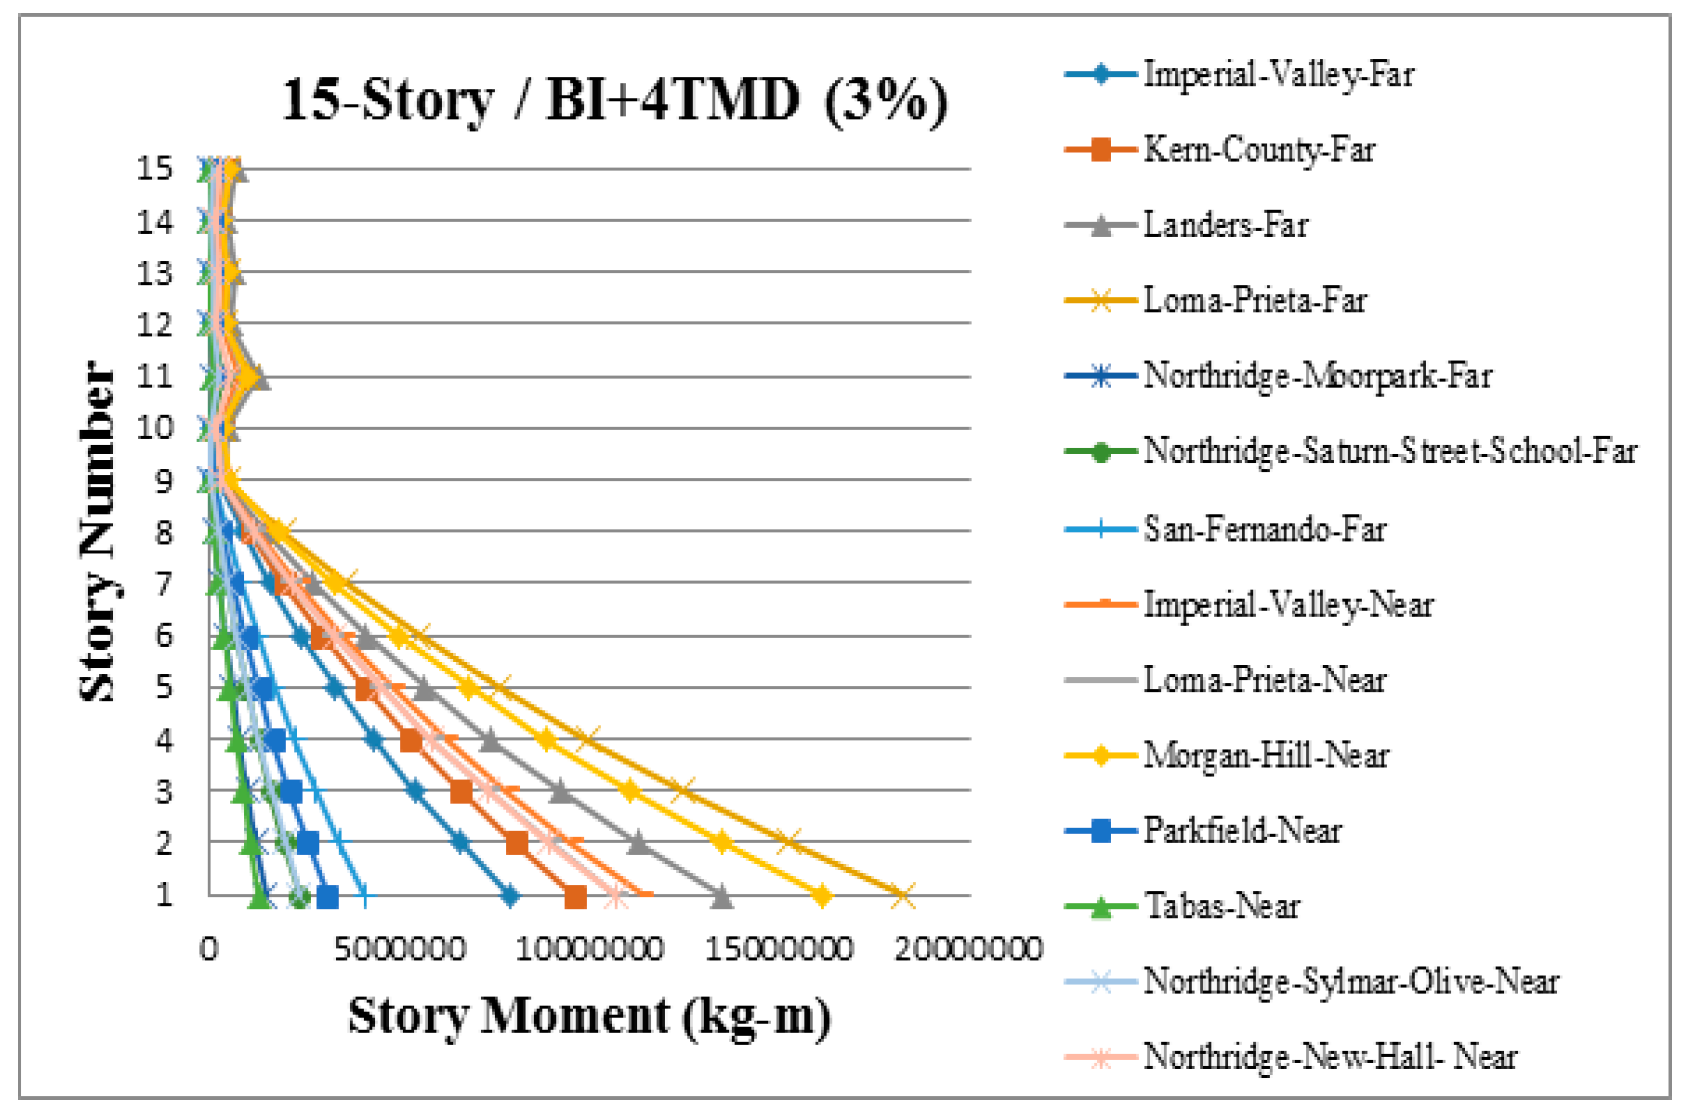
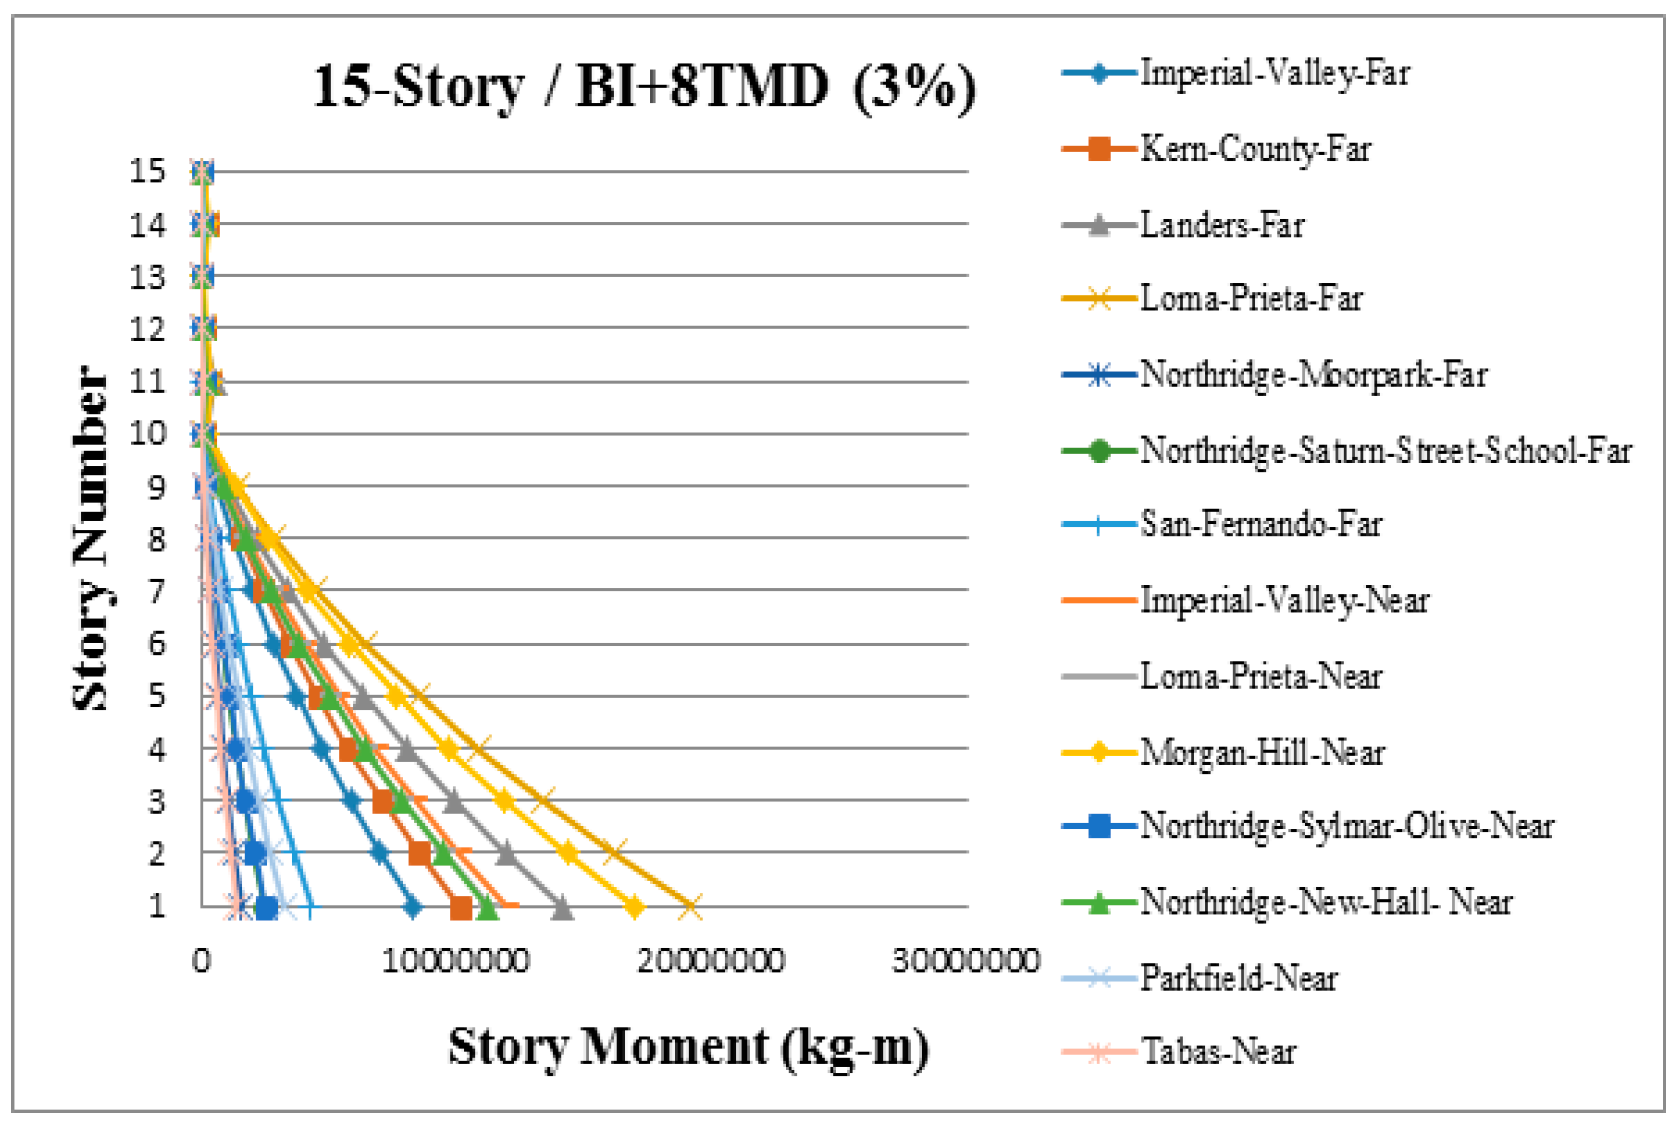
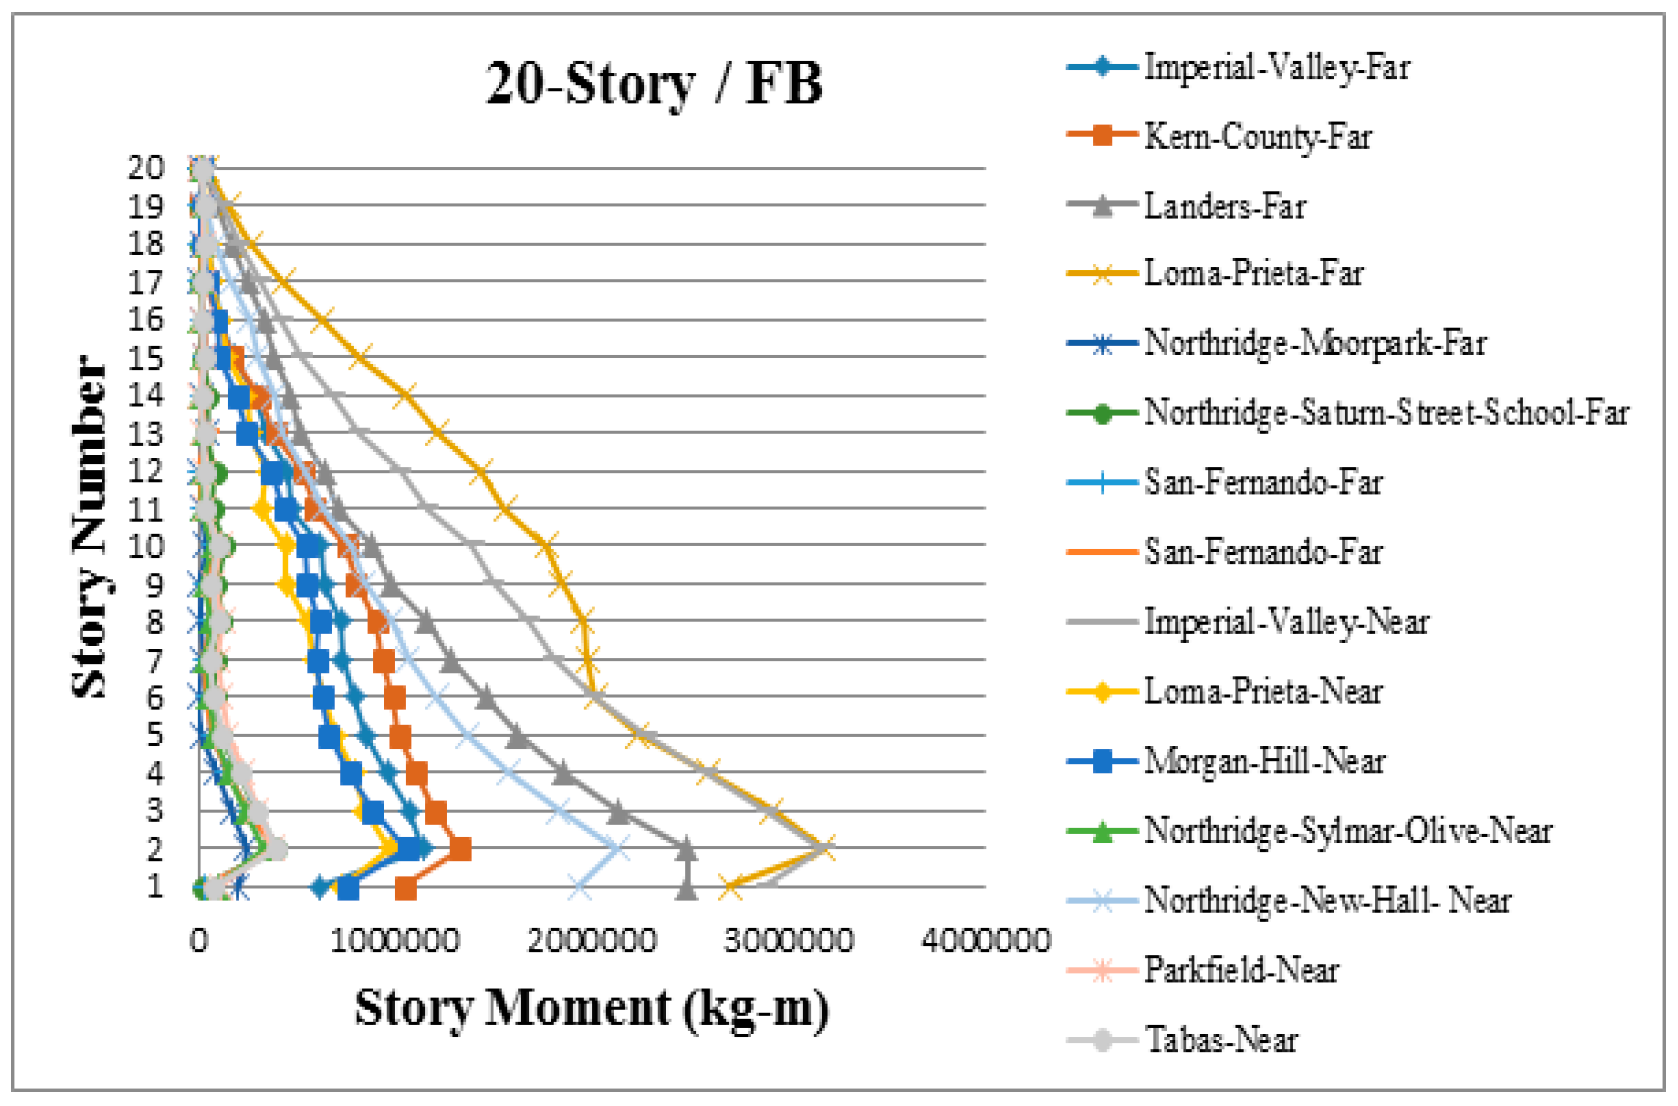
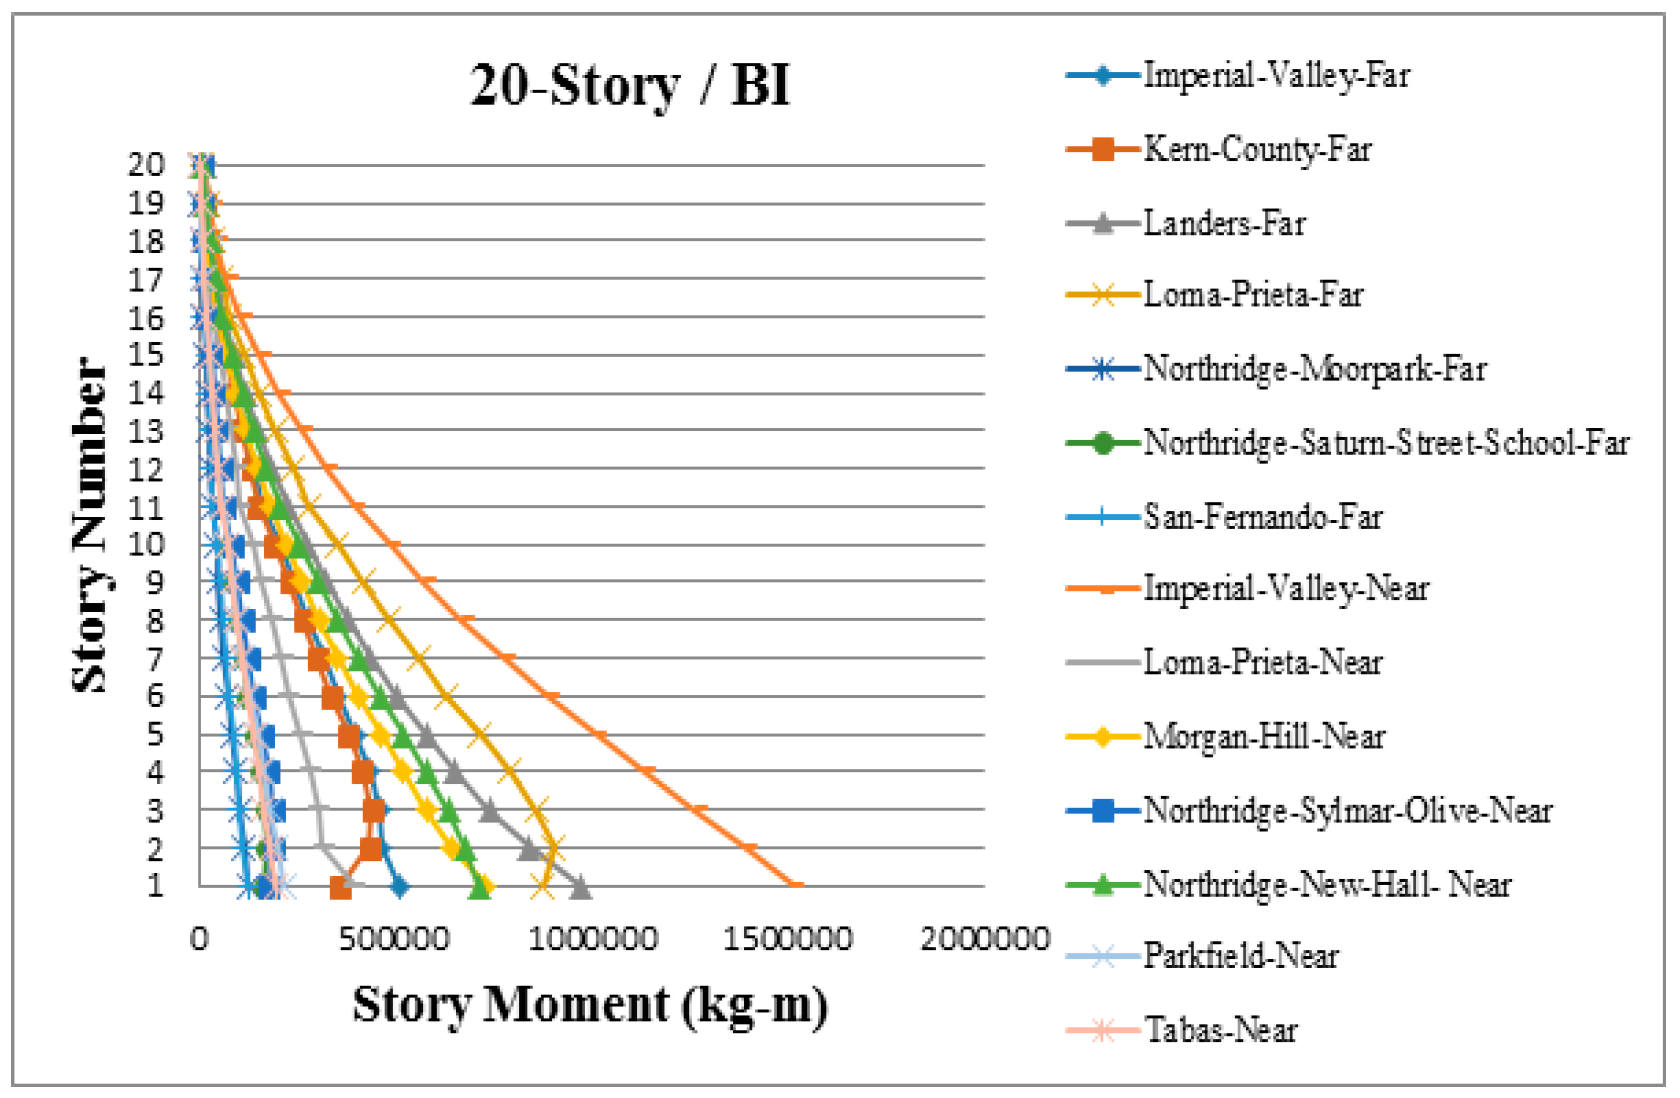
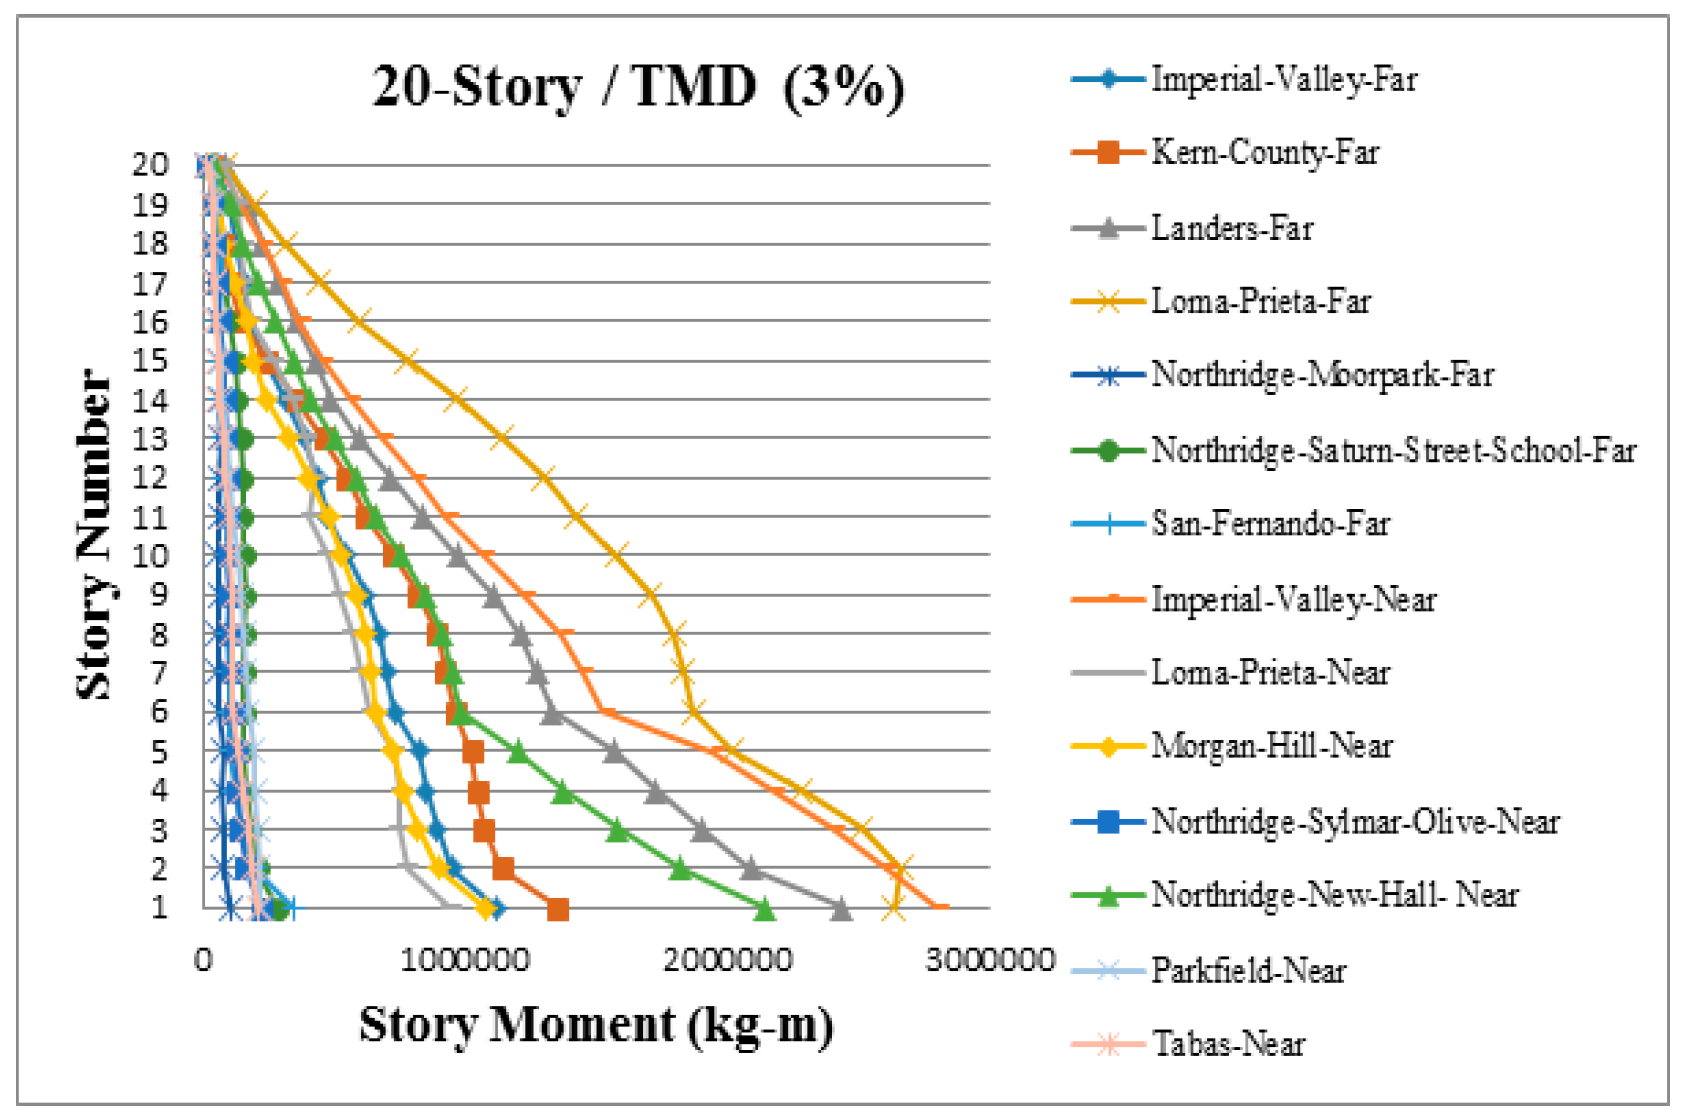
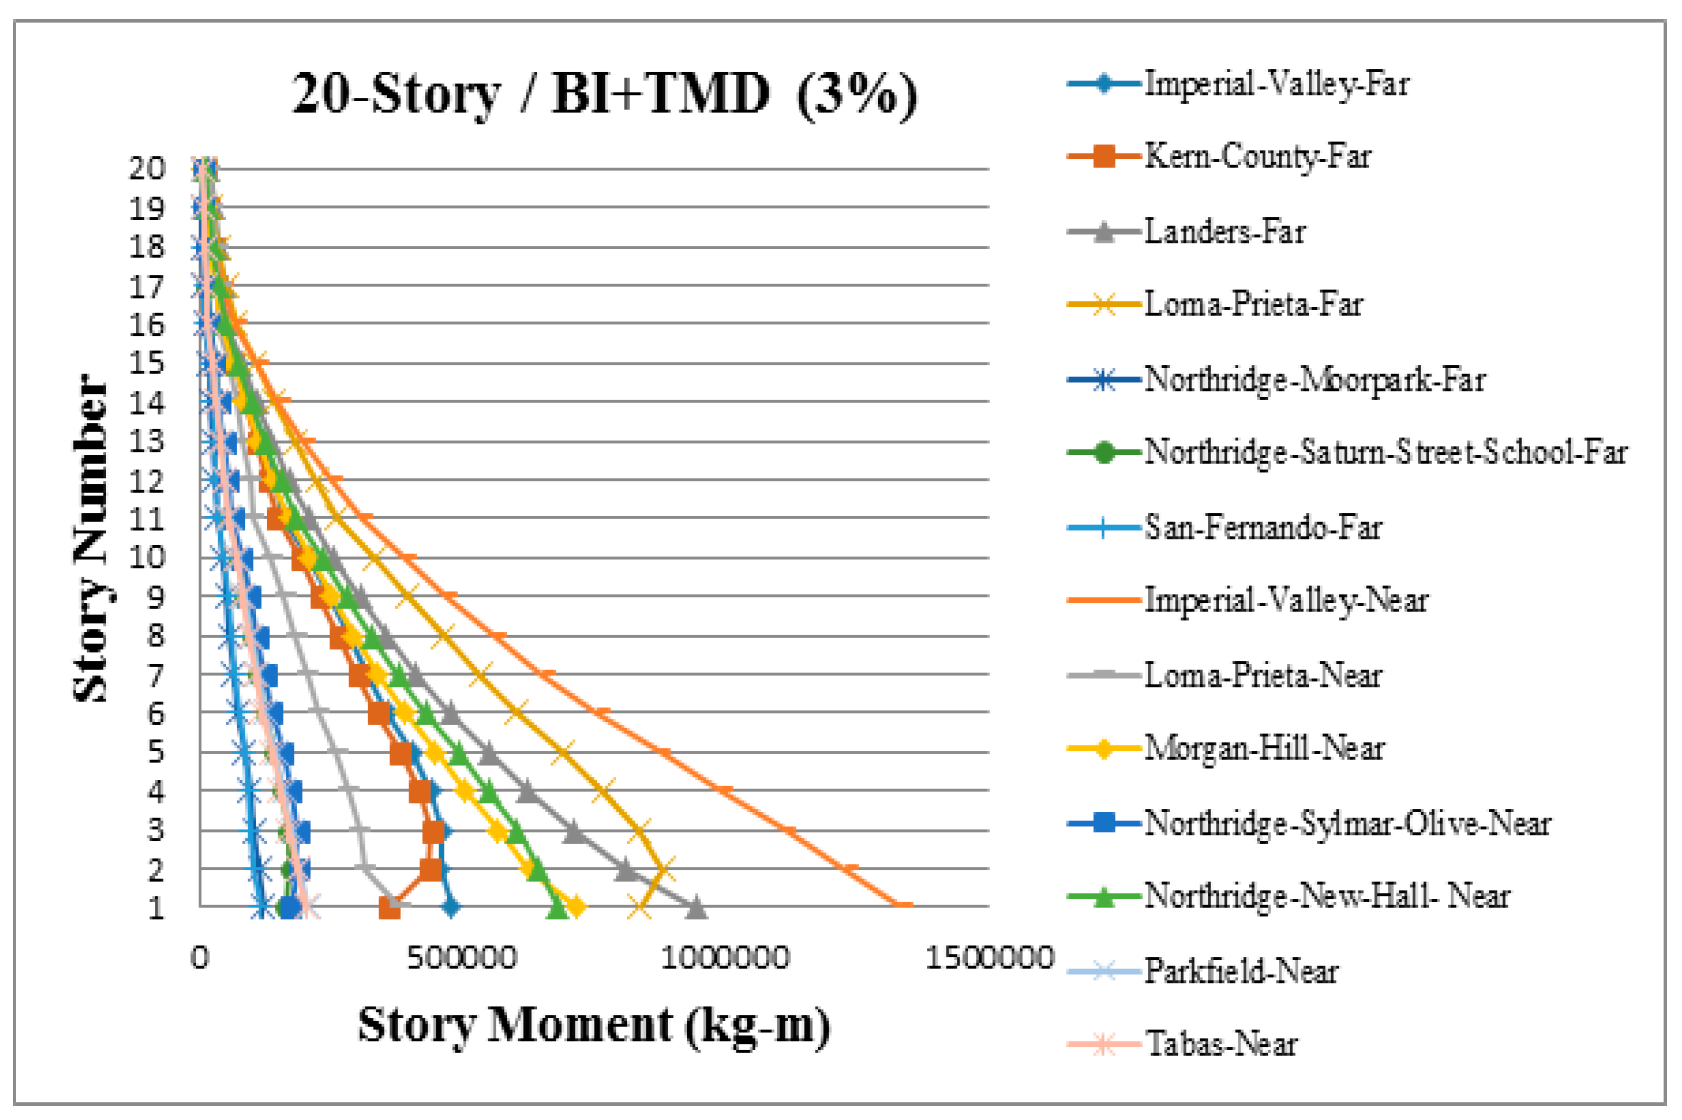
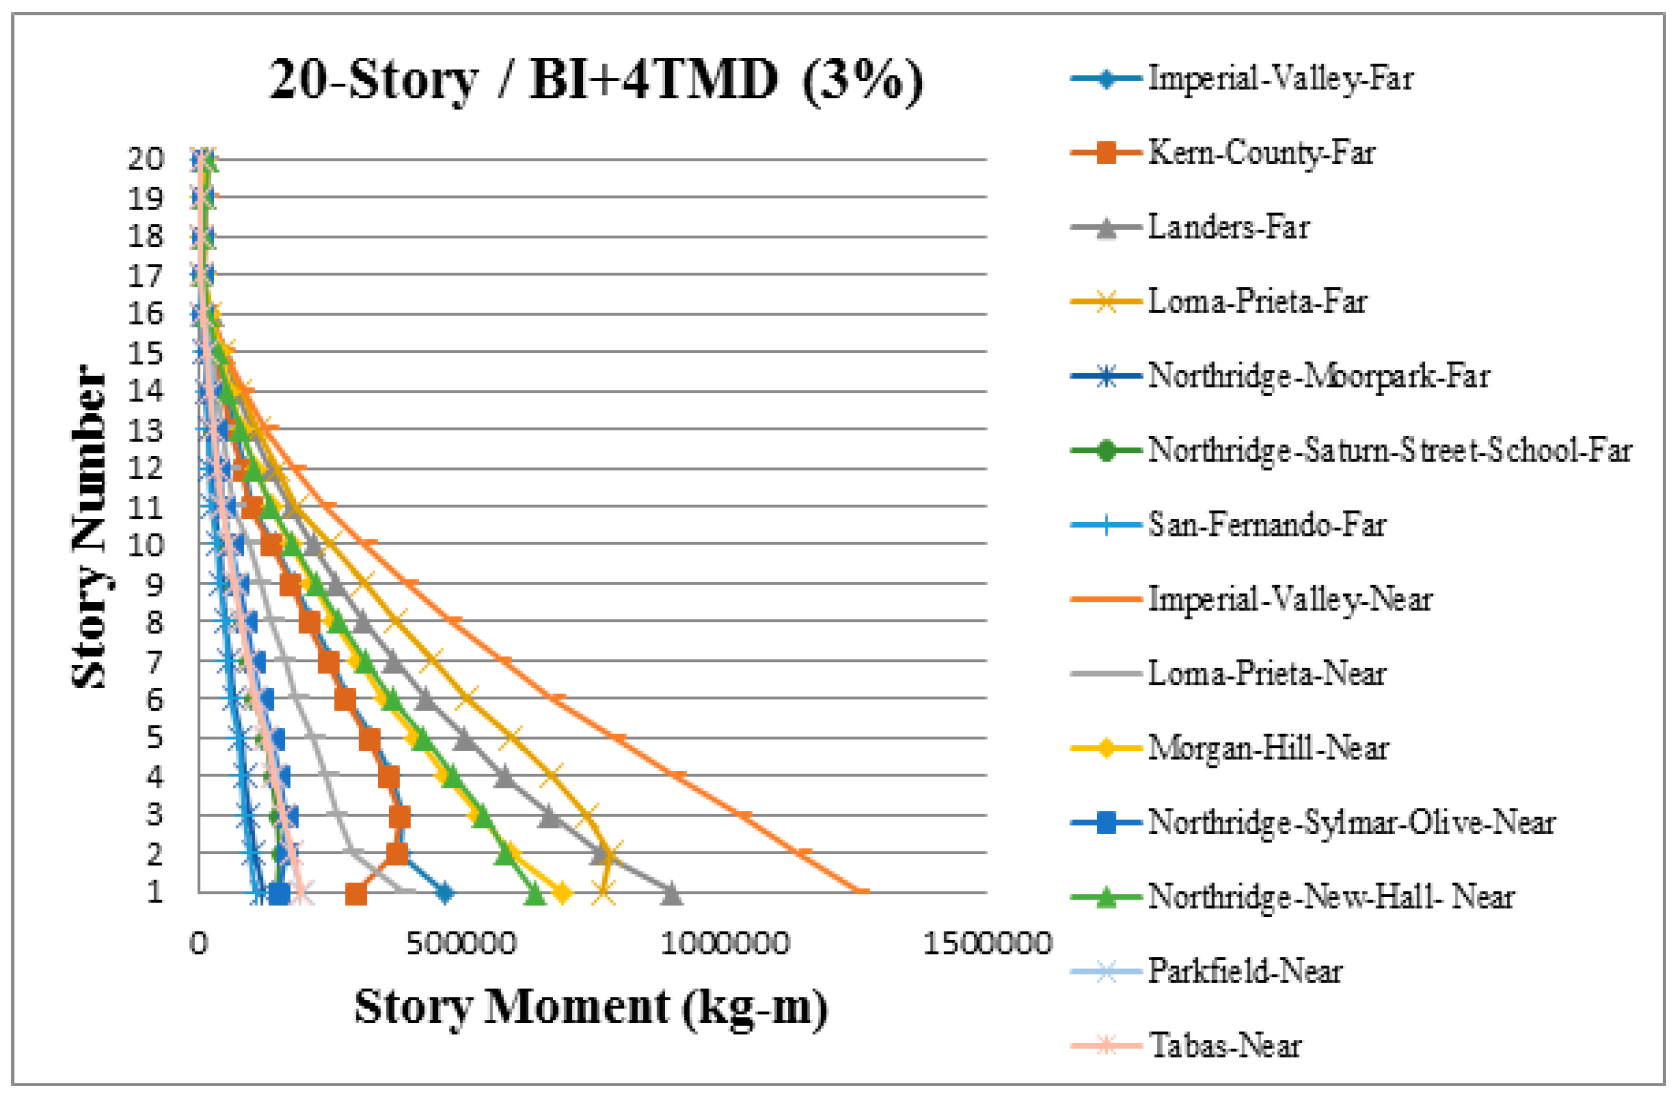
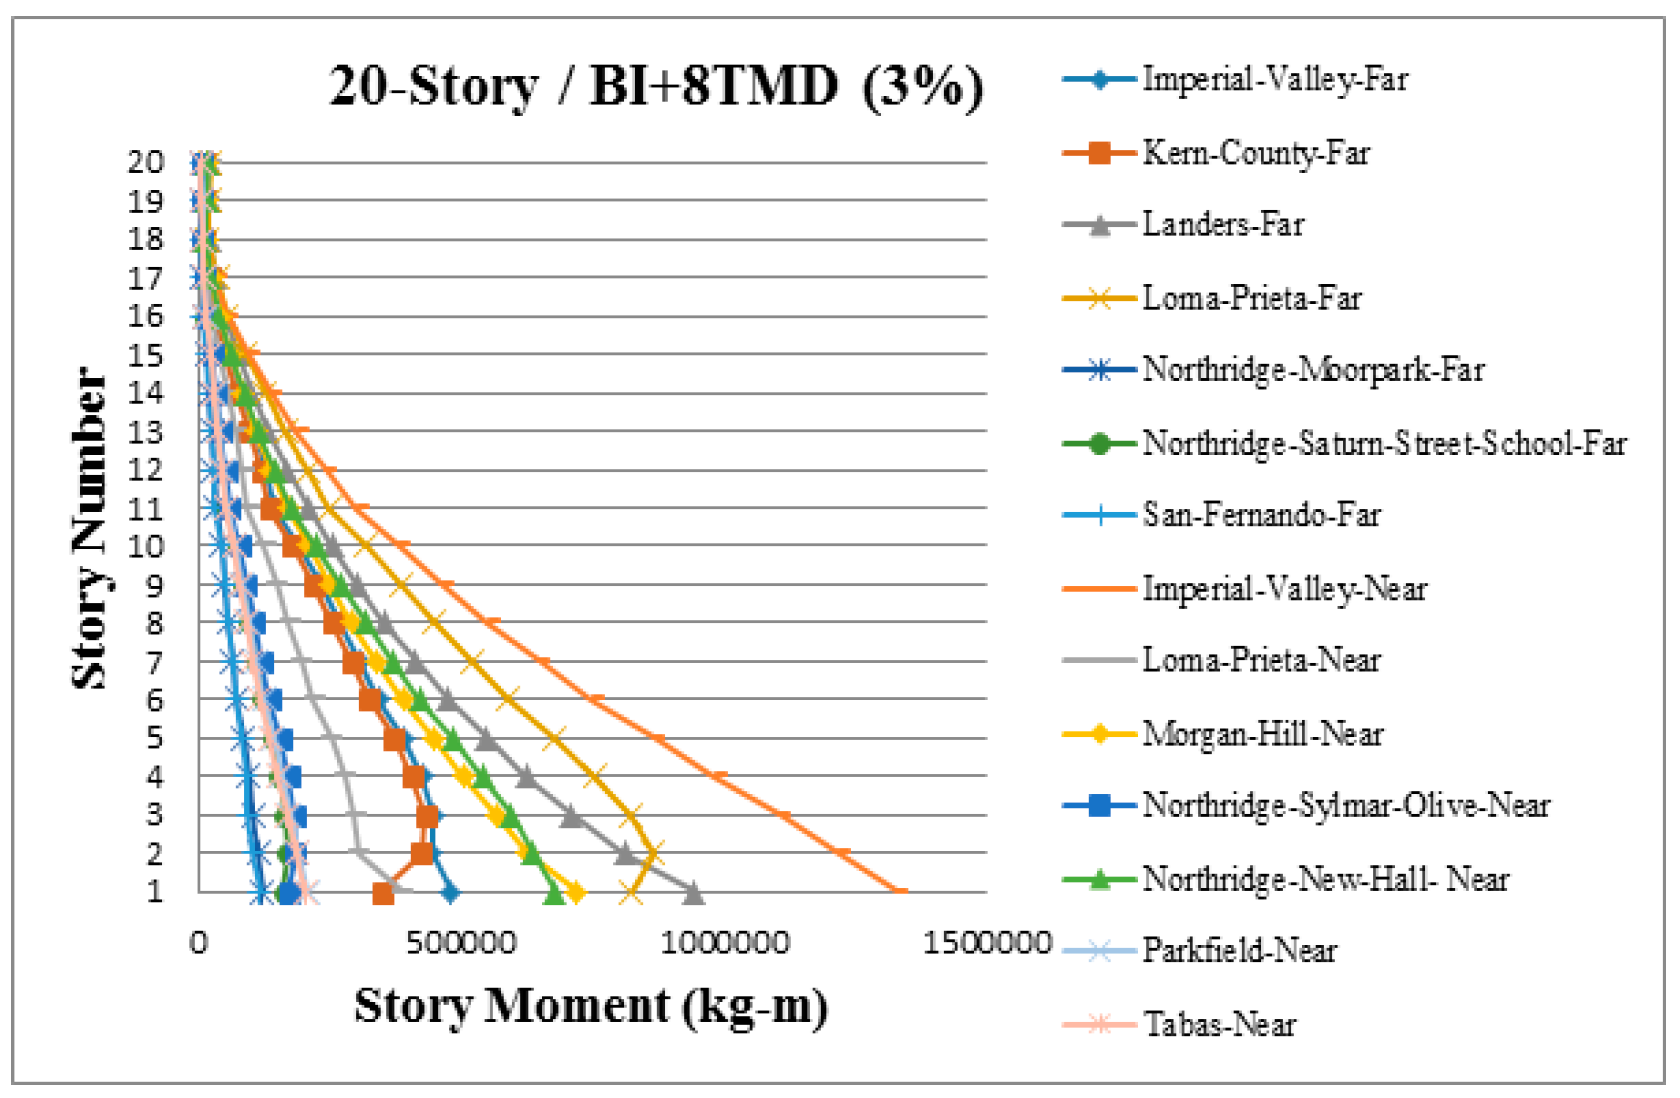
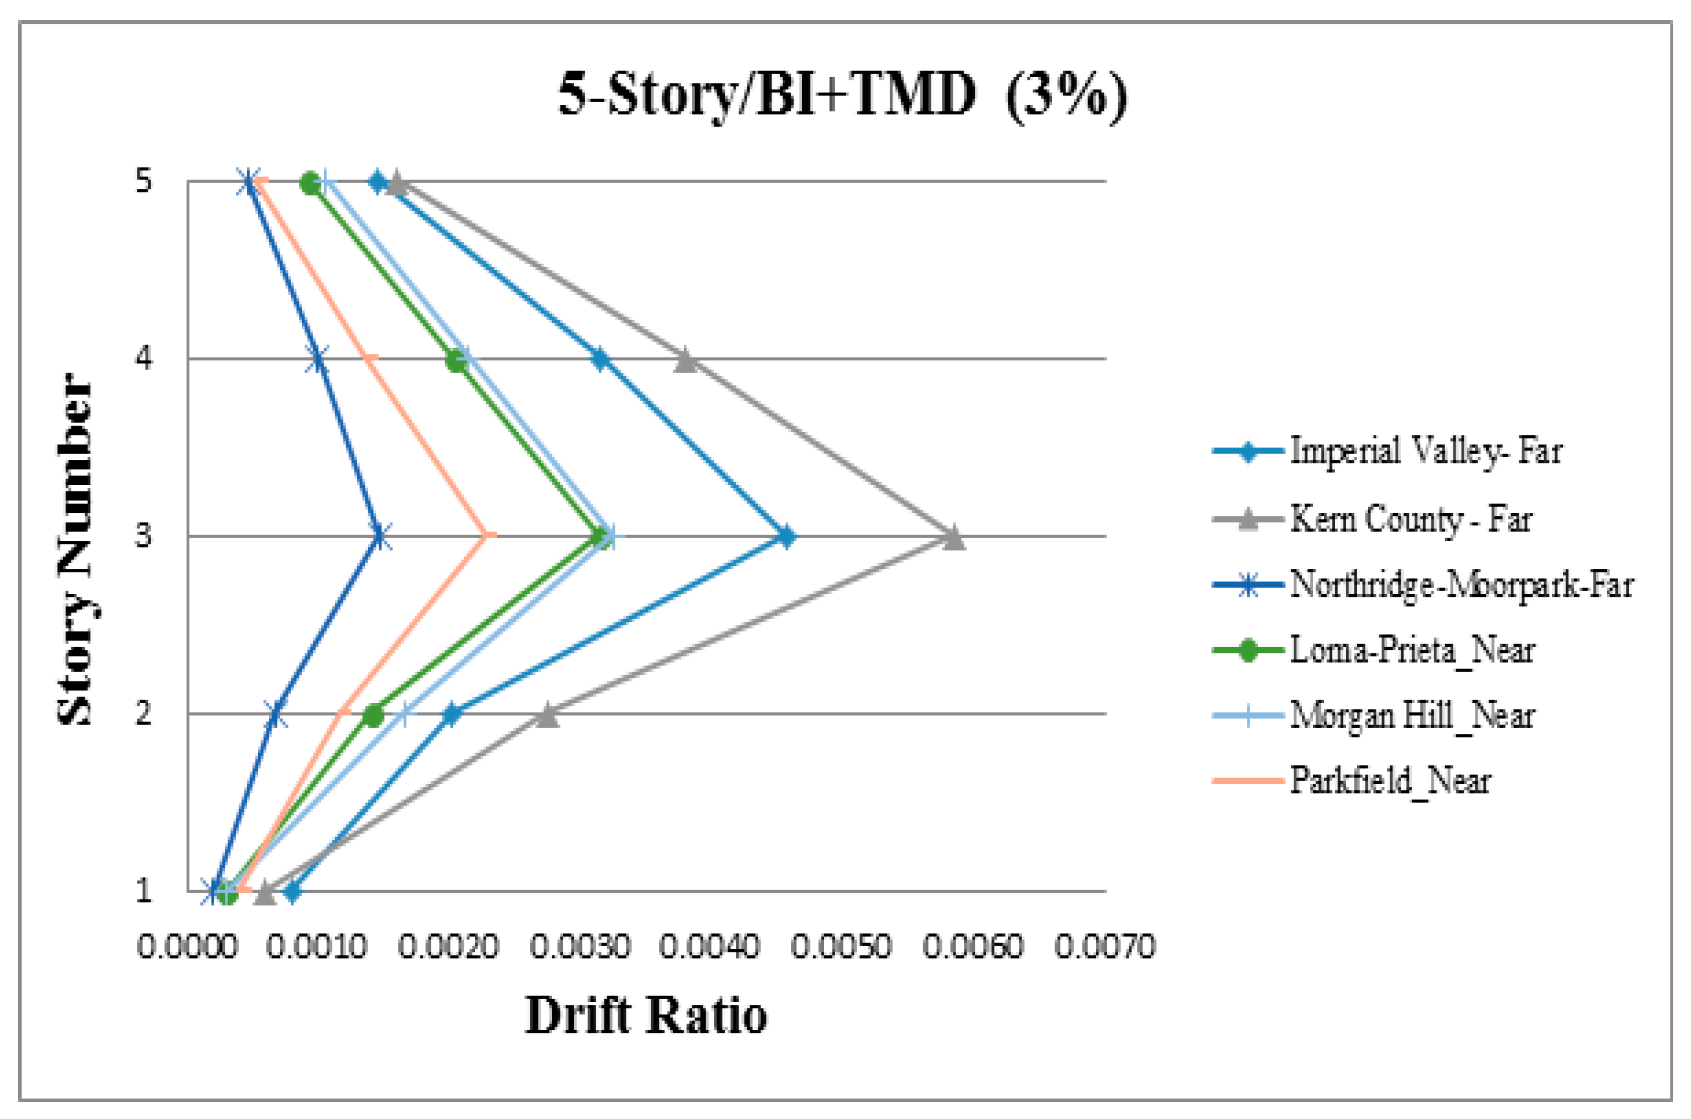
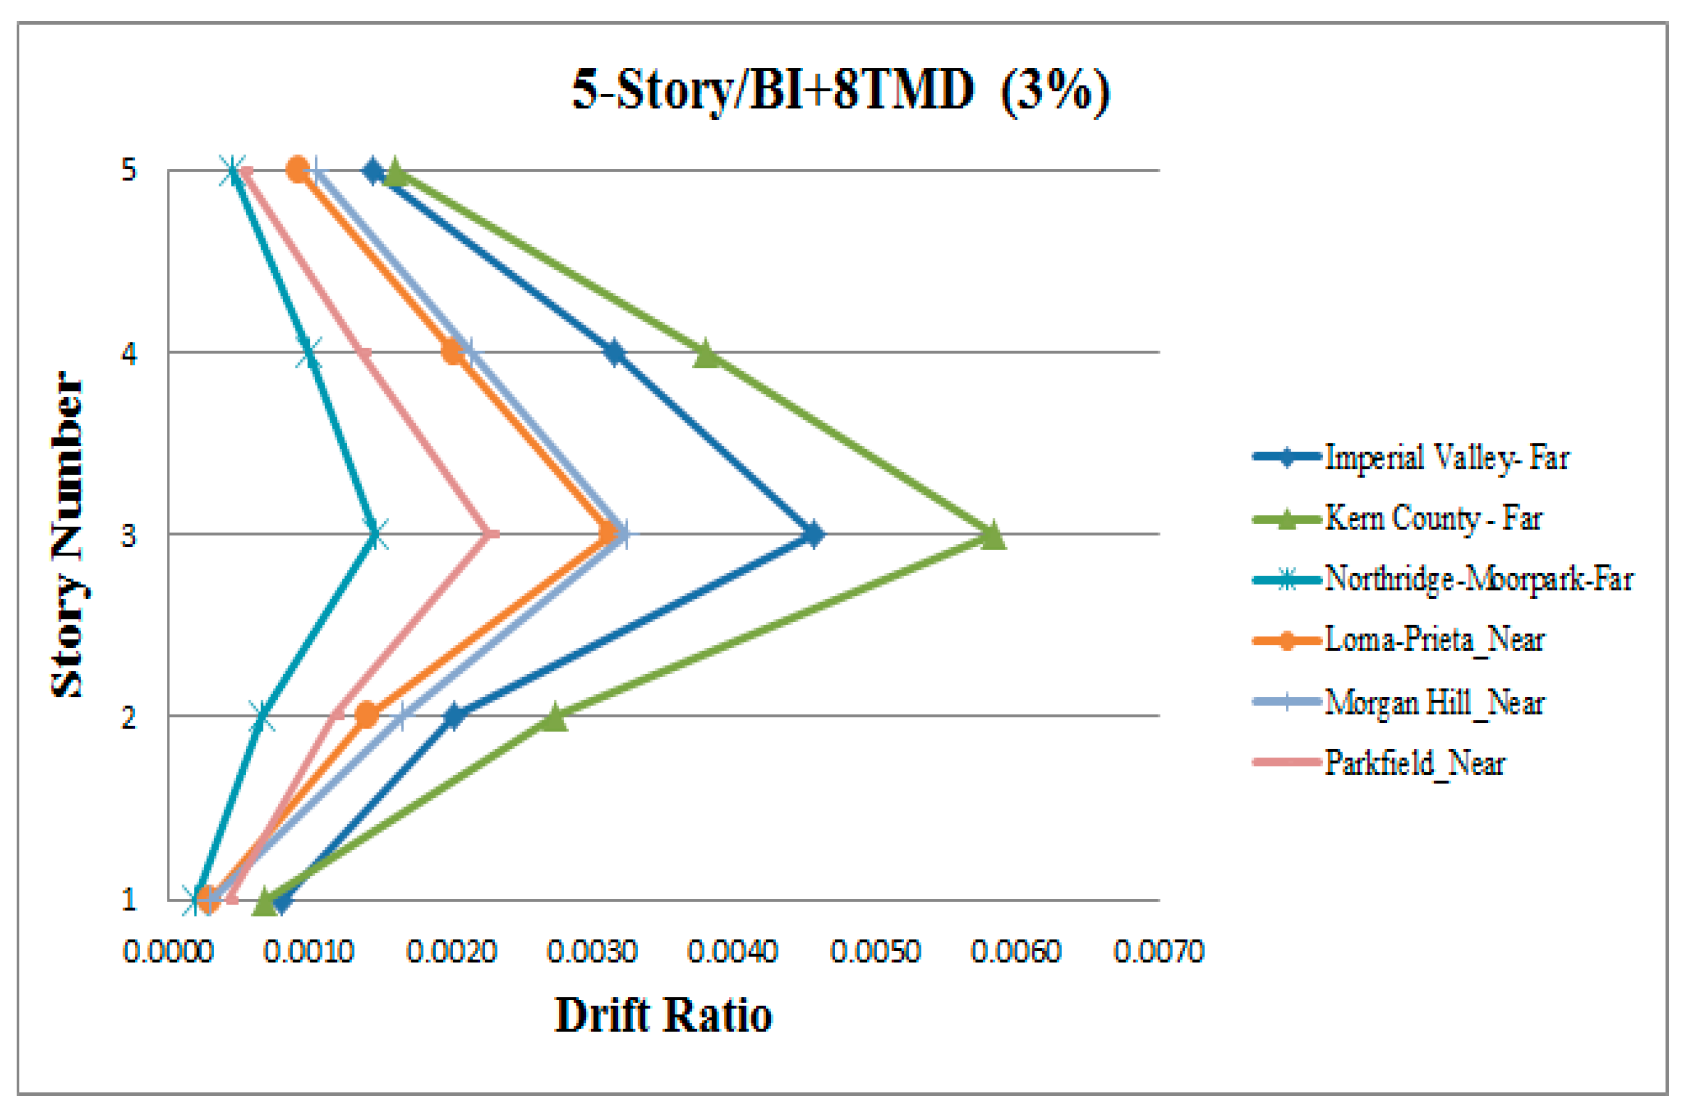
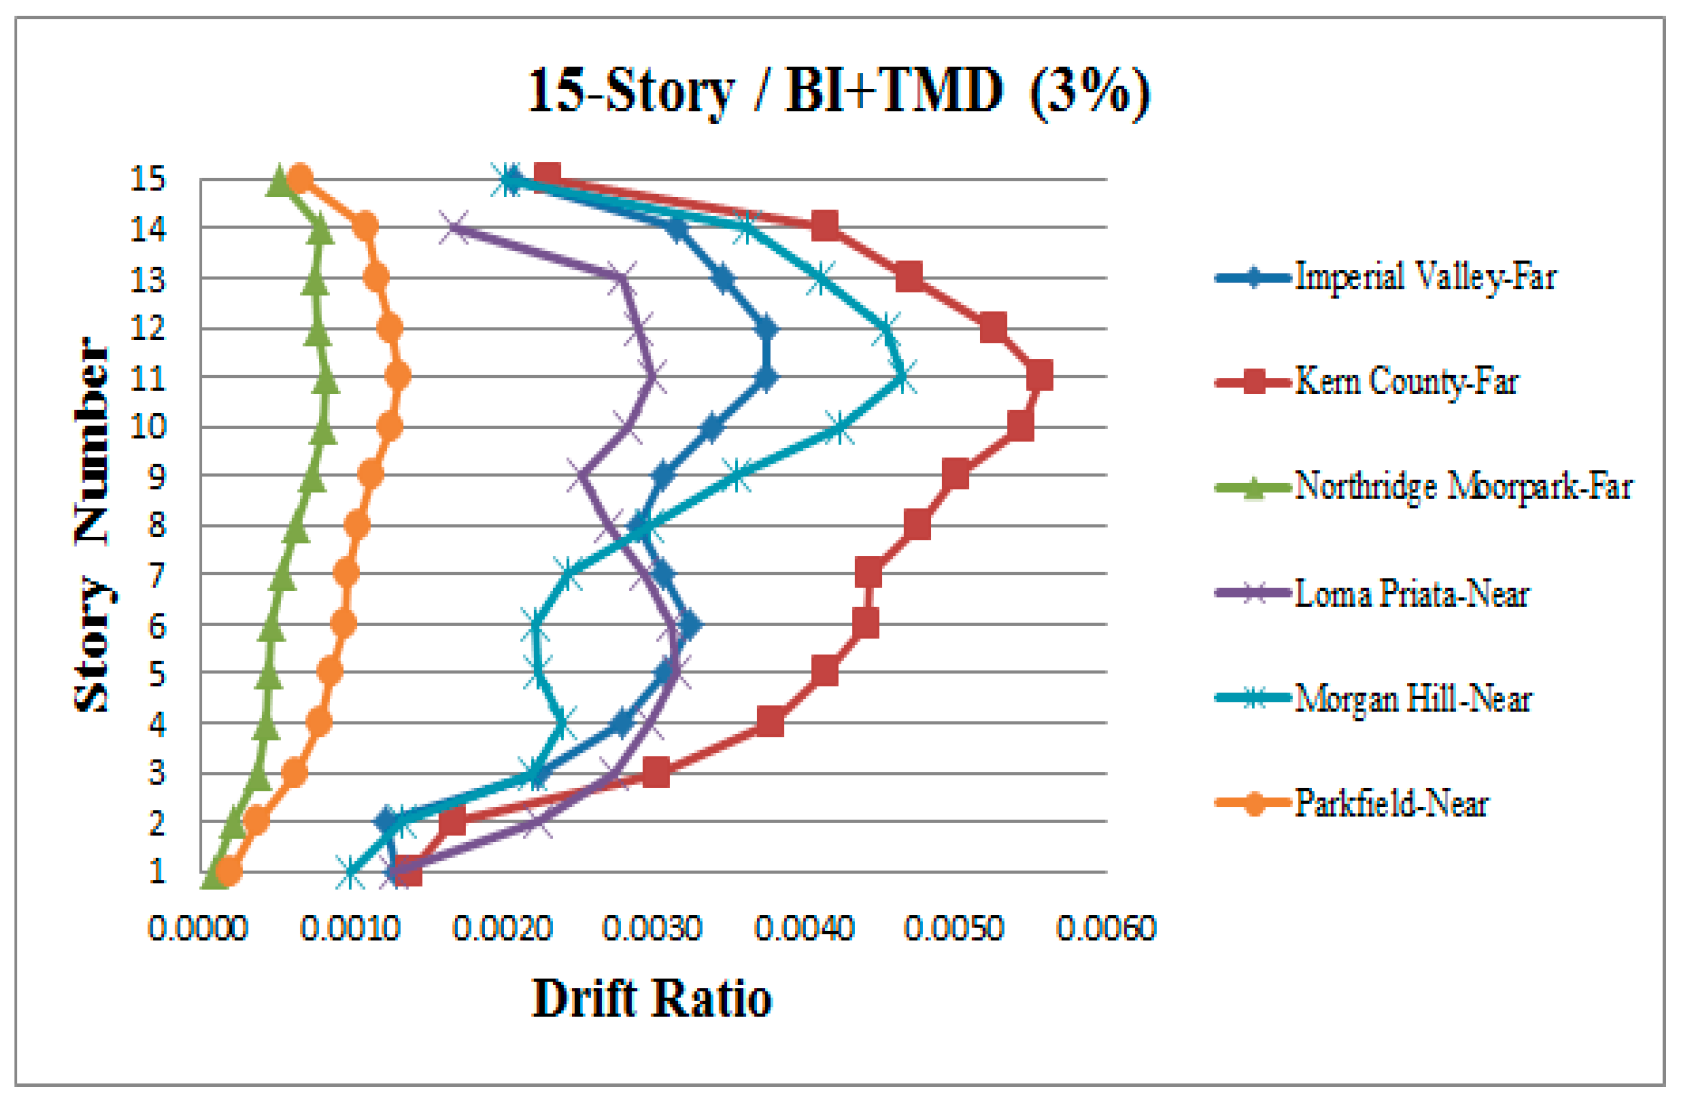
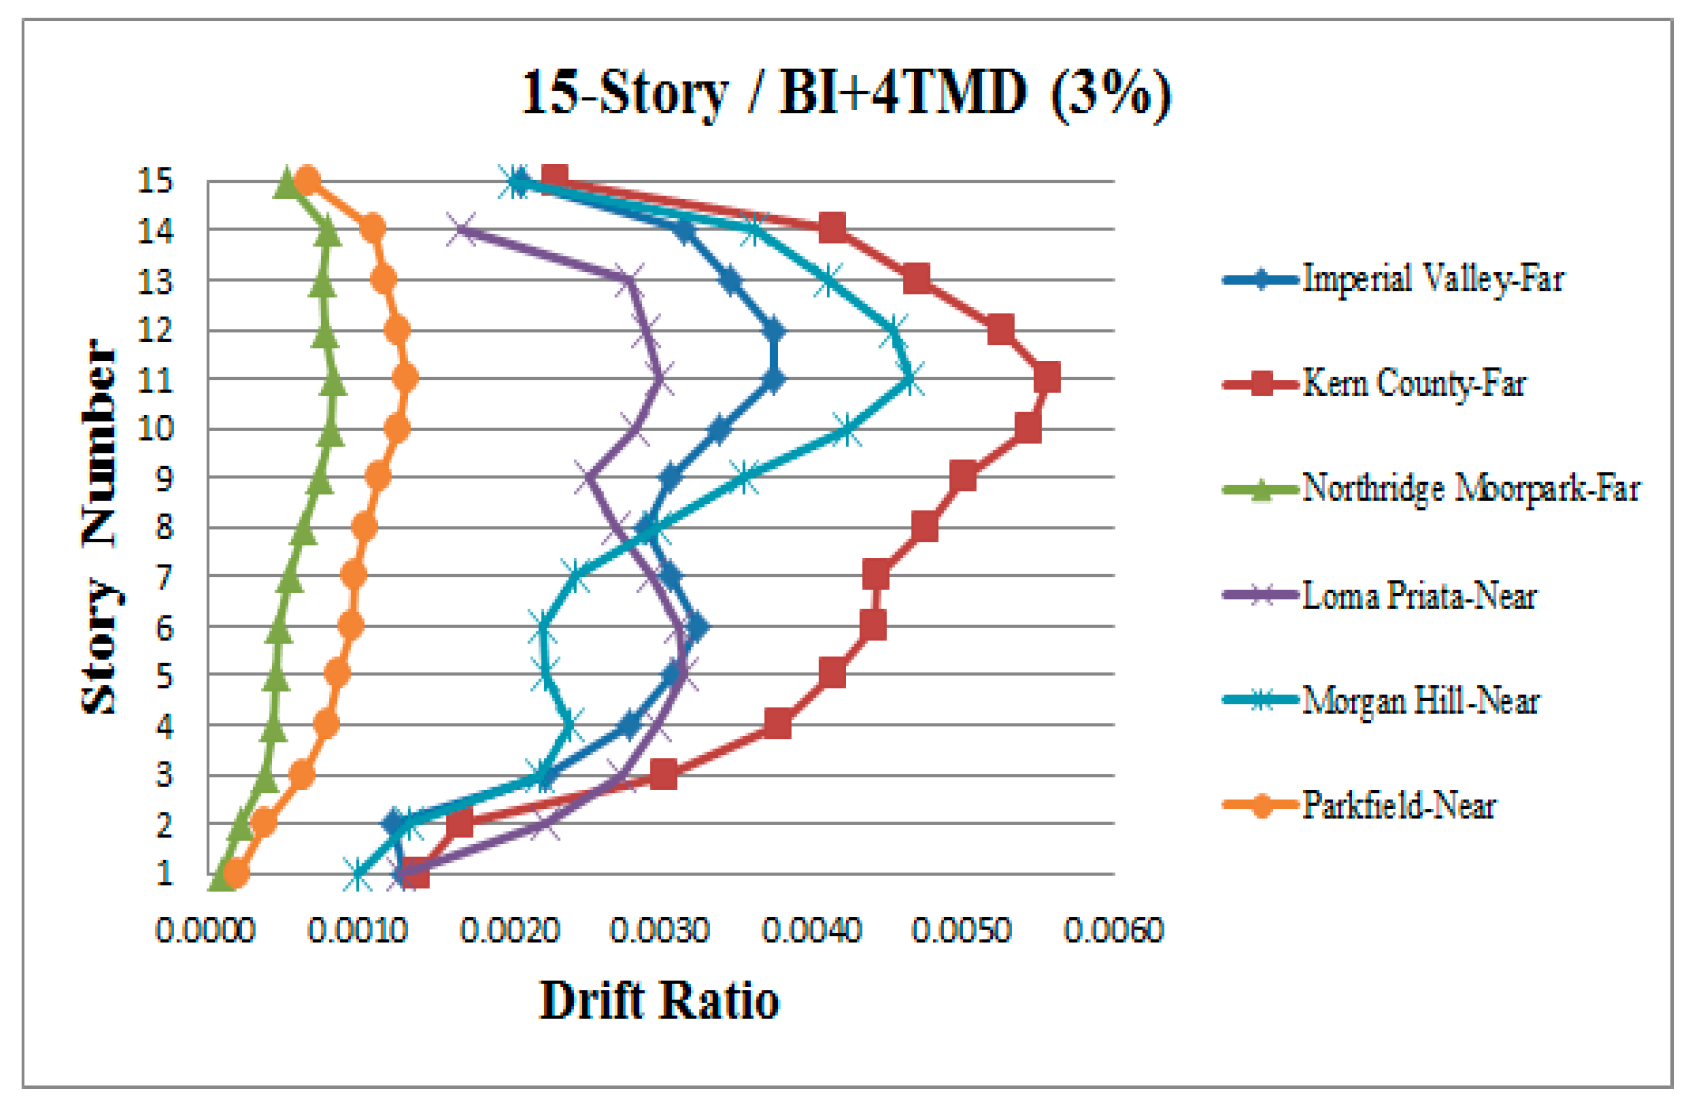
It can also be seen from Figure 8, Figure 9, Figure 10, Figure 11, Figure 12 and Figure 13 and Figure A13, Figure A14, Figure A15, Figure A16, Figure A17, Figure A18, Figure A19, Figure A20, Figure A21, Figure A22, Figure A23, Figure A24, Figure A25, Figure A26, Figure A27 and Figure A28 that the application of TMDs alone leads to a slight reduction in the story moments, as compared to the response without any system. For example, the use of 1 TMD installed in the 10-story building results in the decrease in the peak story moments by 9% and 17% for near-fault and far-fault earthquake records, respectively (compare Figure 10 with Figure 8). On the other hand, the application of the base isolation system alone leads to much larger reductions in the response of the high-rise buildings during earthquakes. For example, the use of seismic isolators installed in the 10-story building results in the decrease in the story moments by as much as 73% and 75% for near-fault and far-fault earthquake records, respectively (compare Figure 9 with Figure 8). However, the largest reductions (even up to 84%) in the peak story moments are obtained for the cases when both control systems (base isolation and non-traditional TMDs) are used simultaneously (Figure 11, Figure 12 and Figure 13). Similar effects can be observed in the case of the 5, 15, and 20-story buildings equipped with seismic isolation and TMDs. In the case of the 15-story structure, the largest reduction in the peak story moments is equal to 73% for the far-fault acceleration records and 81% for the near-fault acceleration records, as compared to the response without any system (Figure A17, Figure A18, Figure A19, Figure A20, Figure A21 and Figure A22). Moreover, Figure A23, Figure A24, Figure A25, Figure A26, Figure A27 and Figure A28 indicate that the reduction in the peak acceleration of the 20-story building is as large as 68% for the far-fault acceleration records and 63% for the near-fault acceleration records. Very similar results are obtained in the case of the response of the high-rise buildings in the form of drift ratios (Figure 14, Figure 15 and Figure 16 and Figure A29, Figure A30, Figure A31, Figure A32, Figure A33 and Figure A34).
4. Conclusions
The effectiveness of the hybrid control strategy, by combining base isolation and non-traditional TMDs, in suppressing structural vibrations of high-rise buildings under earthquakes was investigated in this paper. The study was conducted for structures with a different number of stories exposed to various far-field and near-field earthquake records. Multi degree-of-freedom models of buildings as well as the non-linear model of the base isolation system were employed in the analysis.
The results of the study clearly confirmed that the response of high-rise buildings during earthquakes could be significantly reduced using base isolation devices and non-traditional TMDs. They showed also that the effectiveness in suppressing structural vibrations substantially depends on the type of the control system used. It should be underlined that the influence of the base isolation in the reduction of the structural response under different far-field and near-field earthquake records is much larger than the influence of non-traditional TMDs. In the case of the 5, 10, 15, and 20-story buildings analyzed in the study, the application of TMDs alone resulted in a reduction not larger than 20%, as compared to the response without any system. On the other hand, the response of buildings equipped with only base isolation devices was reduced by more than 70% under different ground motions. However, the largest reductions (larger than 80%) was obtained for the cases when both control systems (base isolation and non-traditional TMDs) were used simultaneously. The influence of non-traditional TMDs in reducing the response of buildings under earthquake excitation is much lower compared to the influence of seismic isolation itself. However, it should be underlined that the application of TMDs does not require any special arrangements [33], whereas the installation of base isolation systems needs major interventions. From this point of view, about 20% of the improvement in structural behavior obtained in the case of TMDs alone can be considered as having a relatively good effect.
The application of multi degree-of-freedom numerical models of high-rise buildings allowed us to investigate not only the general response of the whole structure during earthquakes but also the specific response of each story separately. Moreover, the non-linear model of the base isolation system allowed us to simulate the dynamic behavior of the base-isolated structures more precisely. Both approaches are therefore recommended for the purposes of studies focused on the seismic response of high-rise buildings equipped with base isolation devices and non-traditional TMDs.
Author Contributions
Conceptualization, H.N.; Data curation, N.N.; Formal analysis, H.N., N.N., D.B., and R.J.; Methodology, H.N. and R.J.; Writing – original draft, H.N. and N.N.; Writing – review and editing, D.B. and R.J.
Funding
This research received no external funding.
Conflicts of Interest
The authors declare no conflict of interest.
Appendix A
The representative results of the numerical investigations, for the cases of the 5, 15, and 20-story buildings, are presented in Figure A1, Figure A2, Figure A3, Figure A4, Figure A5, Figure A6, Figure A7, Figure A8, Figure A9, Figure A10, Figure A11, Figure A12, Figure A13, Figure A14, Figure A15, Figure A16, Figure A17, Figure A18, Figure A19, Figure A20, Figure A21, Figure A22, Figure A23, Figure A24, Figure A25, Figure A26, Figure A27, Figure A28, Figure A29, Figure A30, Figure A31, Figure A32, Figure A33 and Figure A34.
Figure A1.
Acceleration time histories for top story of 15-story building under the Imperial Valley (far-fault) earthquake.
Figure A1.
Acceleration time histories for top story of 15-story building under the Imperial Valley (far-fault) earthquake.
Figure A2.
Acceleration time histories for top story of 15-story building under the Loma Prieta (far-fault) earthquake.
Figure A2.
Acceleration time histories for top story of 15-story building under the Loma Prieta (far-fault) earthquake.
Figure A3.
Acceleration time histories for top story of 15-story building under the Kern County (far-fault) earthquake.
Figure A3.
Acceleration time histories for top story of 15-story building under the Kern County (far-fault) earthquake.

Figure A4.
Acceleration time histories for top story of 15-story building under the Imperial Valley (near-fault) earthquake.
Figure A4.
Acceleration time histories for top story of 15-story building under the Imperial Valley (near-fault) earthquake.
Figure A5.
Acceleration time histories for top story of 15-story building under the Loma Prieta (near-fault) earthquake.
Figure A5.
Acceleration time histories for top story of 15-story building under the Loma Prieta (near-fault) earthquake.

Figure A6.
Acceleration time histories for top story of 15-story building under the Morgan Hill (near-fault) earthquake.
Figure A6.
Acceleration time histories for top story of 15-story building under the Morgan Hill (near-fault) earthquake.
Figure A7.
Acceleration time histories for top story of 20-story building under the Imperial Valley (far-fault) earthquake.
Figure A7.
Acceleration time histories for top story of 20-story building under the Imperial Valley (far-fault) earthquake.
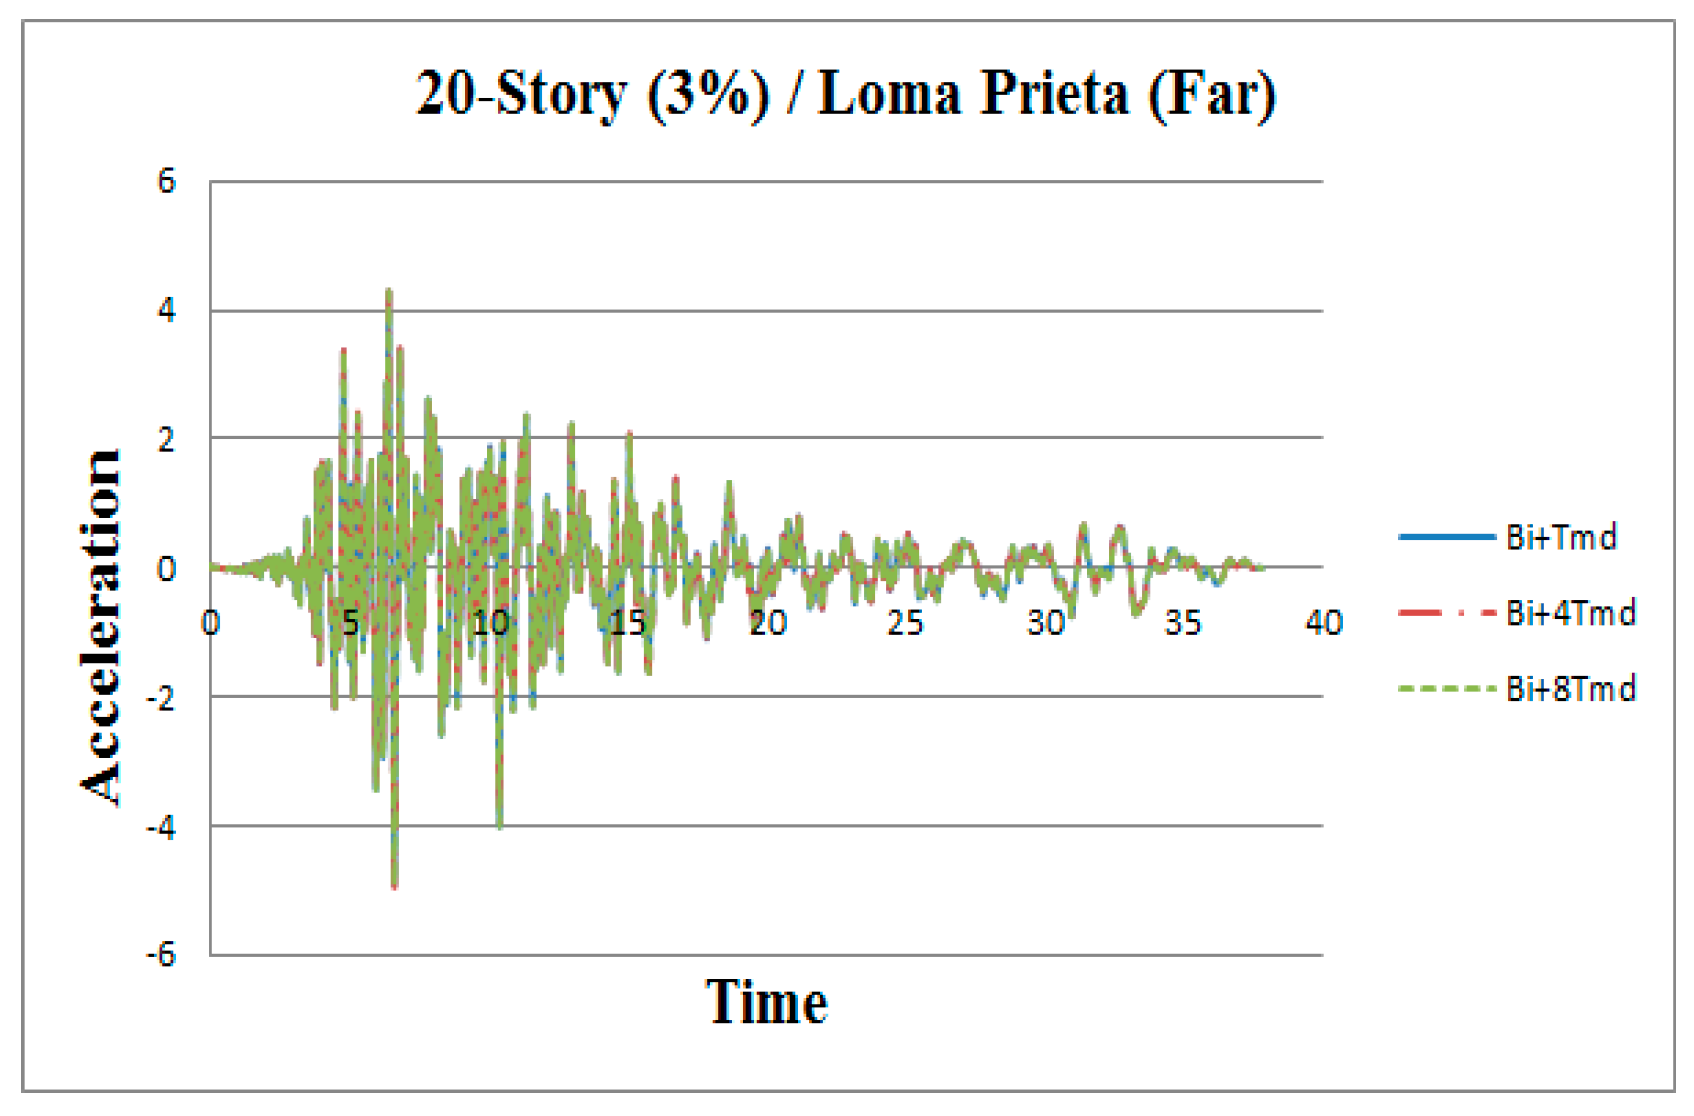
Figure A8.
Acceleration time histories for top story of 20-story building under the Loma Prieta (far-fault) earthquake.
Figure A8.
Acceleration time histories for top story of 20-story building under the Loma Prieta (far-fault) earthquake.
Figure A9.
Acceleration time histories for top story of 20-story building under the Kern County (far-fault) earthquake.
Figure A9.
Acceleration time histories for top story of 20-story building under the Kern County (far-fault) earthquake.
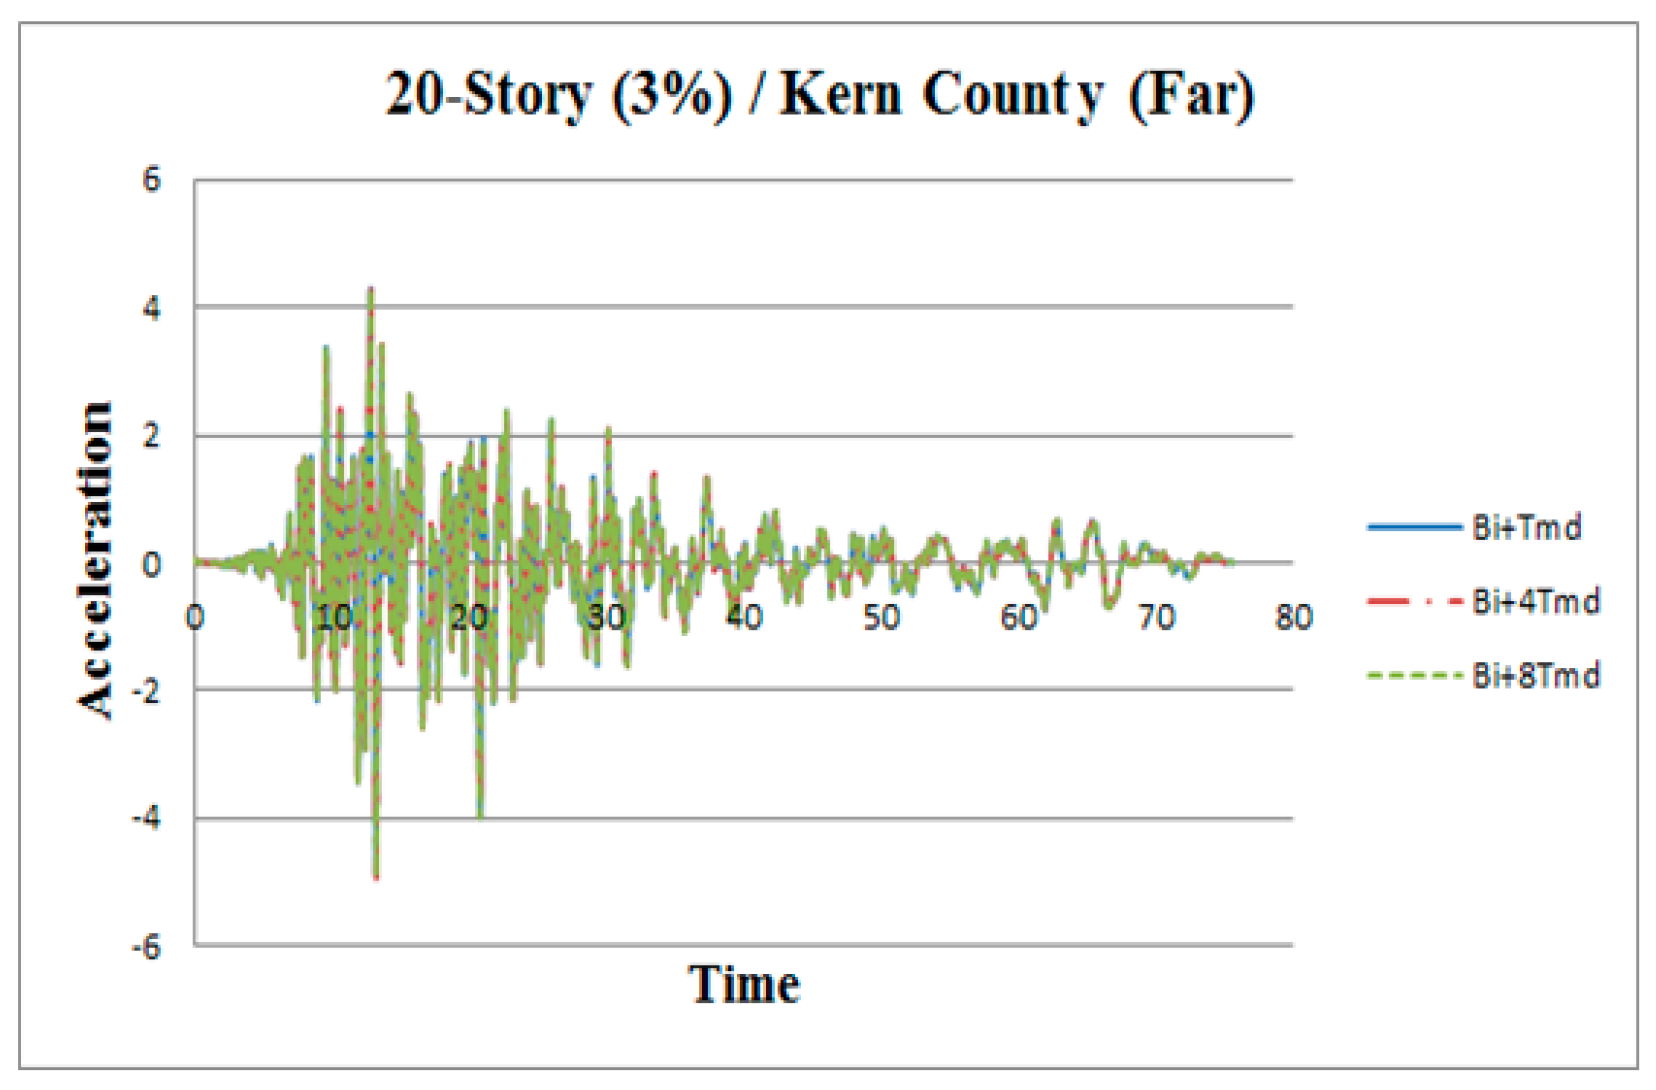
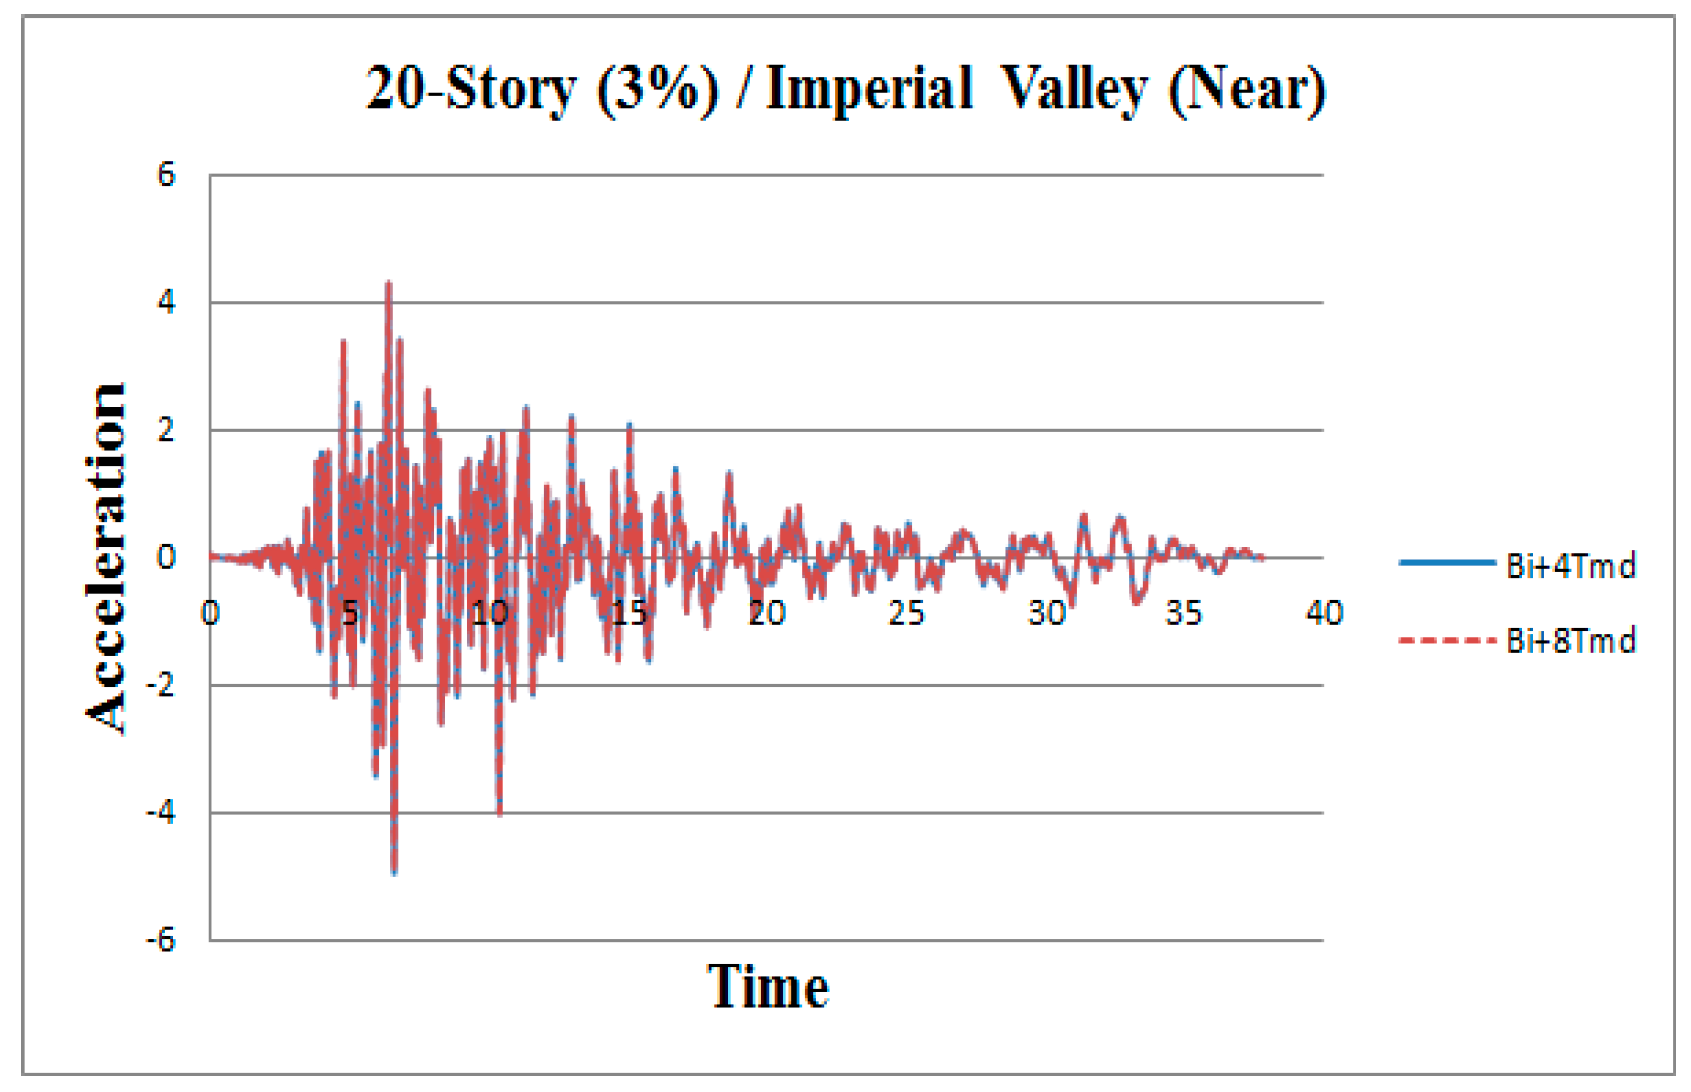
Figure A10.
Acceleration time histories for top story of 20-story building under the Imperial Valley (near-fault) earthquake.
Figure A10.
Acceleration time histories for top story of 20-story building under the Imperial Valley (near-fault) earthquake.
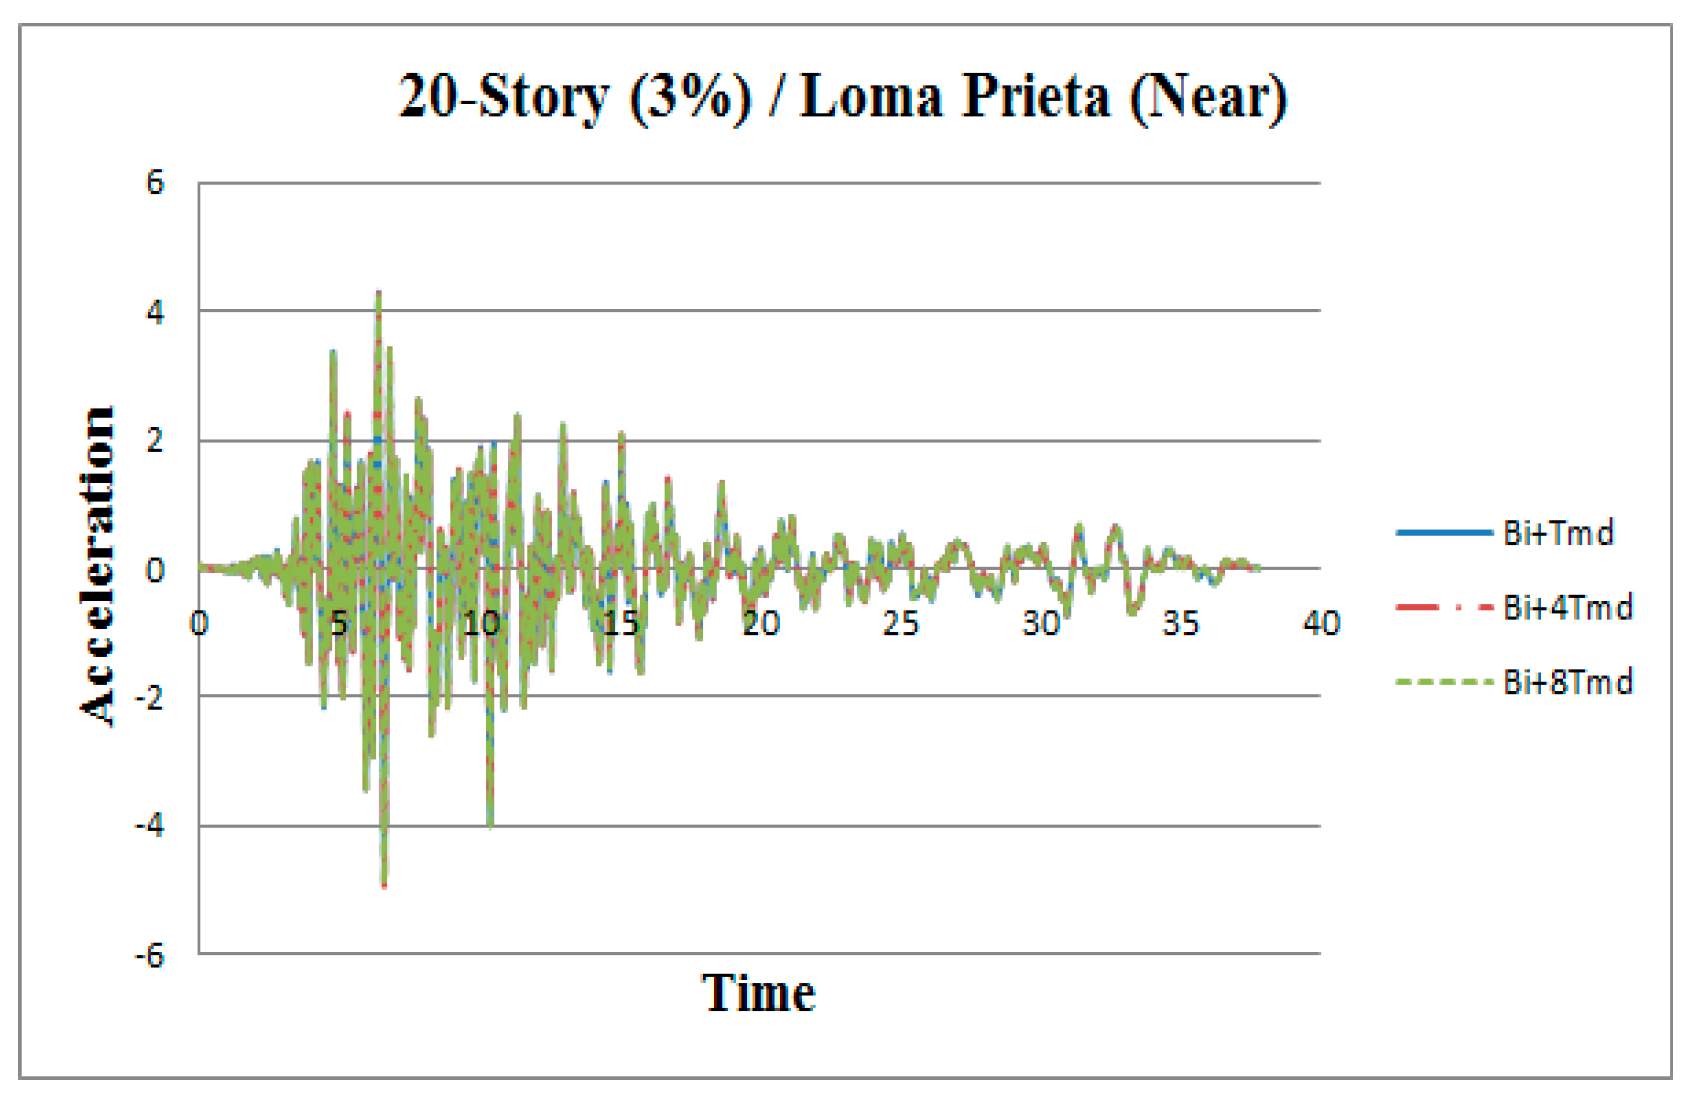
Figure A11.
Acceleration time histories for top story of 20-story building under the Loma Prieta (near-fault) earthquake.
Figure A11.
Acceleration time histories for top story of 20-story building under the Loma Prieta (near-fault) earthquake.

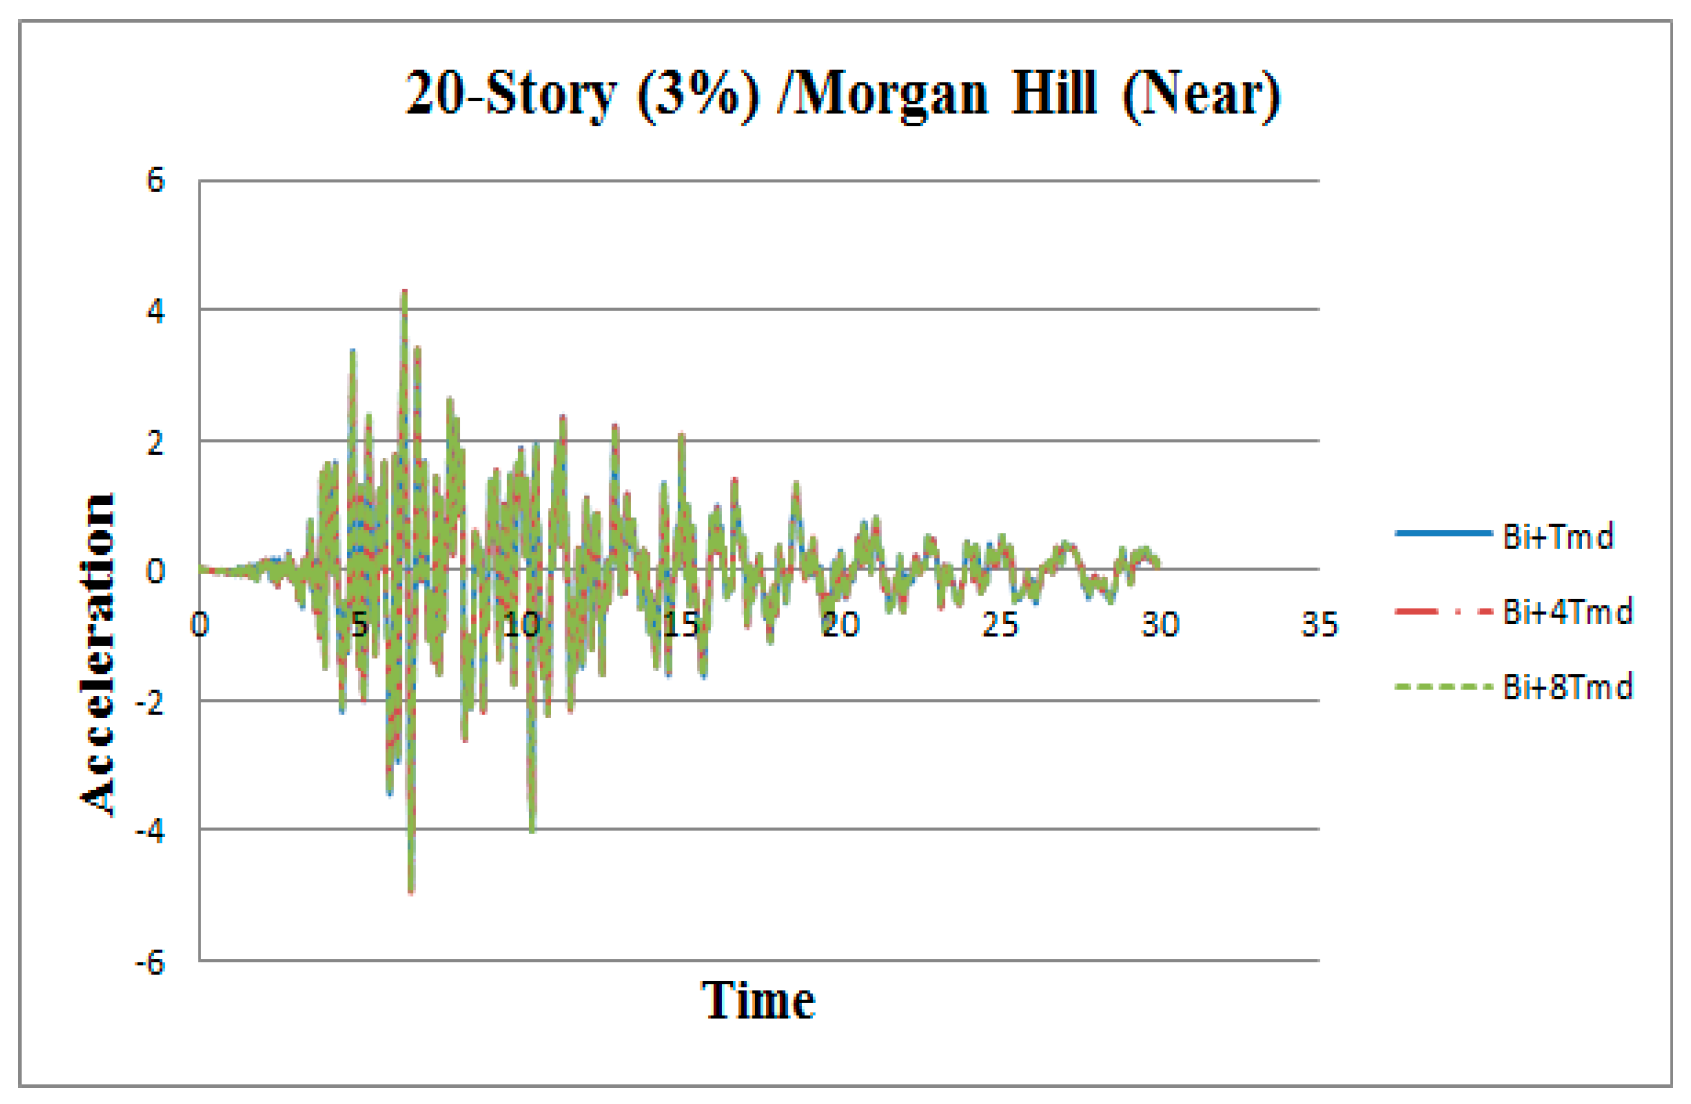
Figure A12.
Acceleration time histories for top story of 20-story building under the Morgan Hill (near-fault) earthquake.
Figure A12.
Acceleration time histories for top story of 20-story building under the Morgan Hill (near-fault) earthquake.
Figure A13.
Peak story moments for 5-story fixed-base building.
Figure A14.
Peak story moments for 5-story base-isolated building.
Figure A15.
Peak story moments for 5-story fixed-base building with 1 TMD.

Figure A16.
Peak story moments for 5-story base-isolated building with 1 TMD.
Figure A17.
Peak story moments for 15-story fixed-base building.
Figure A18.
Peak story moments for 15-story base-isolated building.
Figure A19.
Peak story moments for 15-story fixed-base building with 1 TMD.
Figure A20.
Peak story moments for 15-story base-isolated building with 1 TMD.
Figure A21.
Peak story moments for 15-story base-isolated building with 4 TMDs.
Figure A22.
Peak story moments for 15-story base-isolated building with 8 TMDs.
Figure A23.
Peak story moments for 20-story fixed-base building.
Figure A24.
Peak story moments for 20-story base-isolated building.
Figure A25.
Peak story moments for 20-story fixed-base building with 1 TMD.

Figure A26.
Peak story moments for 20-story base-isolated building with 1 TMD.
Figure A27.
Peak story moments for 20-story base-isolated building with 4 TMDs.
Figure A28.
Peak story moments for 20-story base-isolated building with 8 TMDs.

Figure A29.
Drift ratios for 5-story base-isolated building with 1 TMD.
Figure A30.
Drift ratios for 5-story base-isolated building with 4 TMDs.
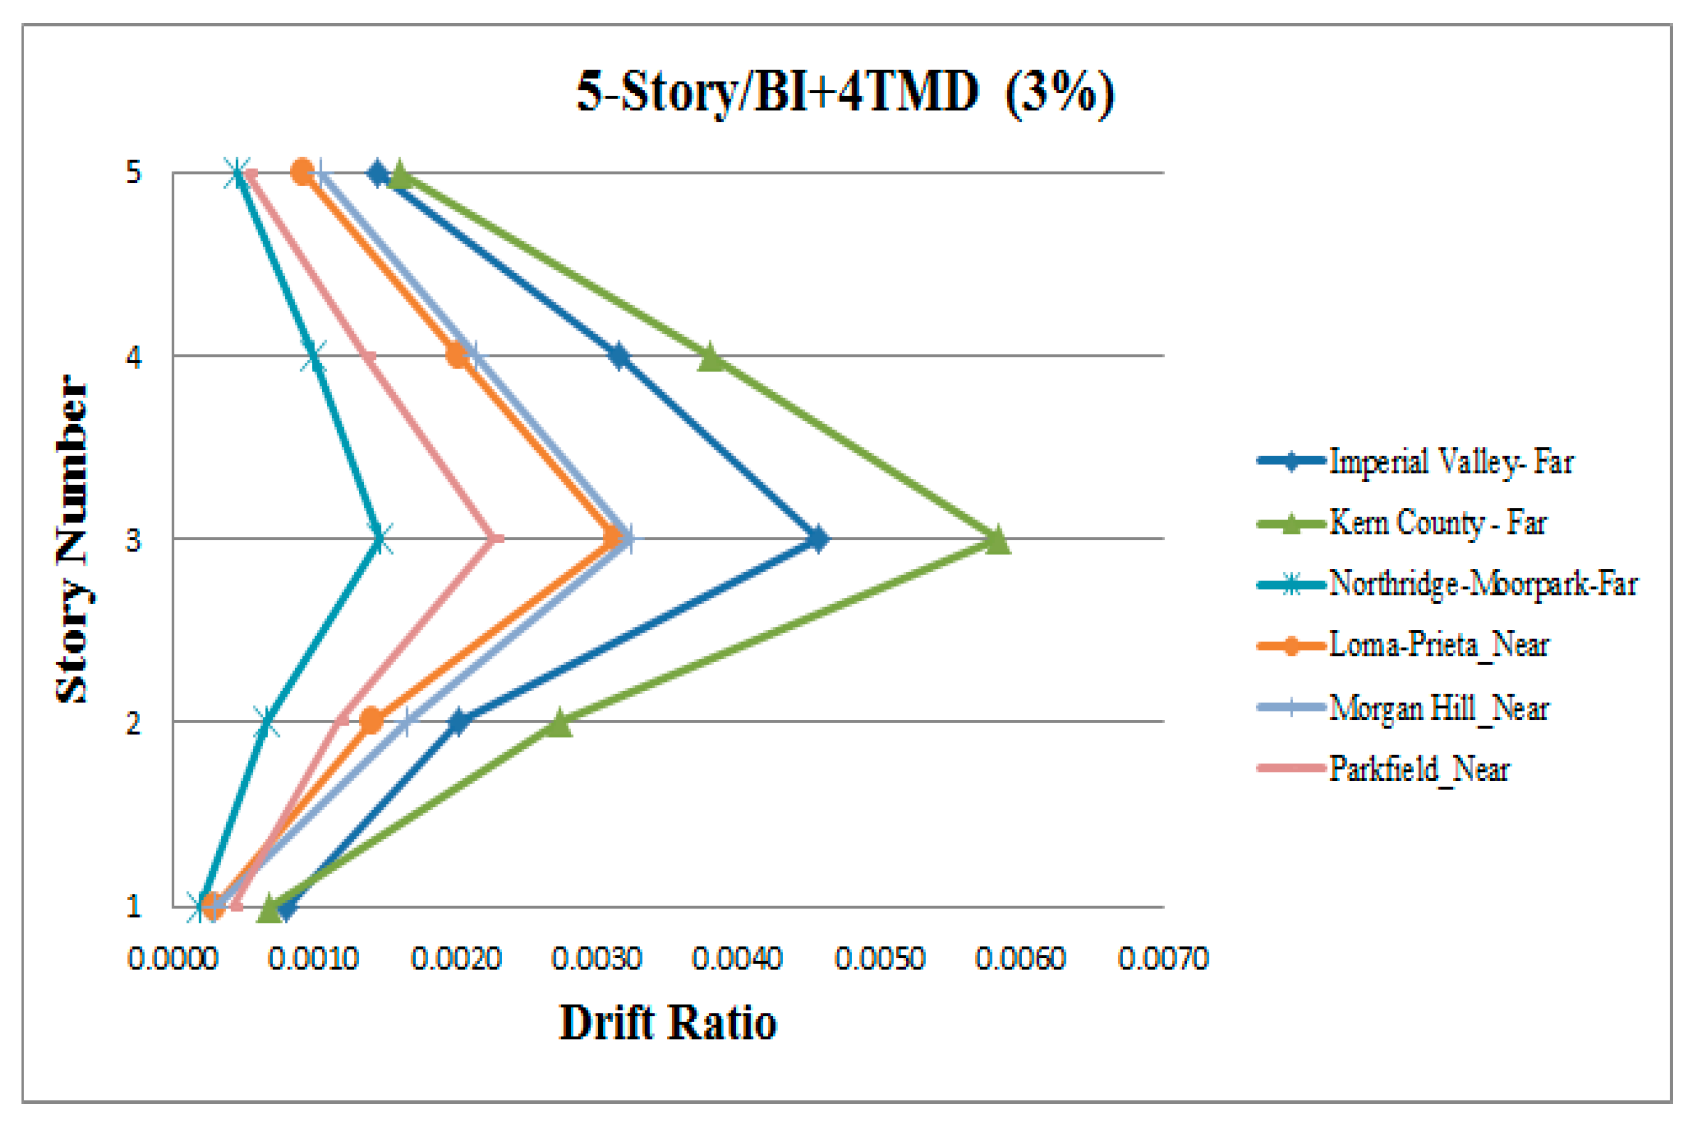
Figure A31.
Drift ratios for 5-story base-isolated building with 8 TMDs.
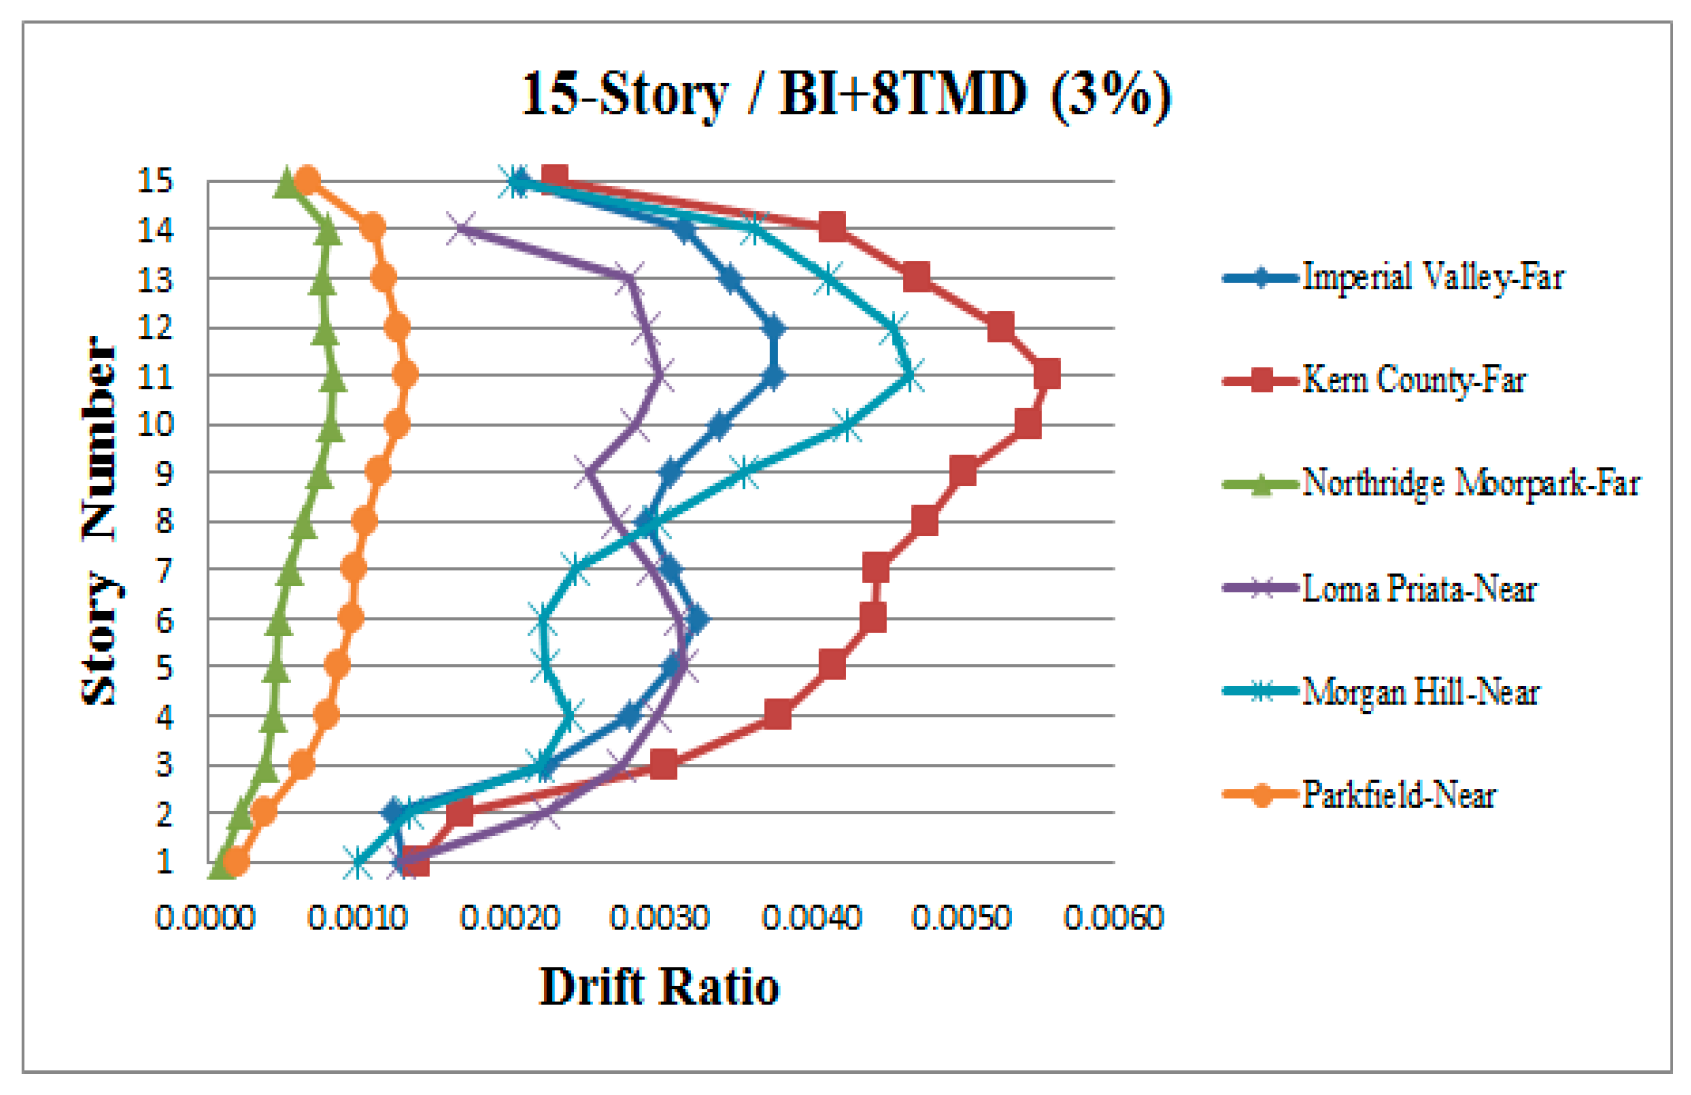
Figure A32.
Drift ratios for 15-story base-isolated building with 1 TMD.
Figure A33.
Drift ratios for 15-story base-isolated building with 4 TMDs.
Figure A34.
Drift ratios for 15-story base-isolated building with 8 TMDs.
References
- Naeim, F. The Seismic Design Handbook; Springer: Boston, MA, USA, 2001. [Google Scholar]
- Jankowski, R. Theoretical and experimental assessment of parameters for the non-linear viscoelastic model of structural pounding. J. Theor. Appl. Mech. 2007, 45, 931–942. [Google Scholar]
- Jankowski, R. Pounding between superstructure segments in multi-supported elevated bridge with three-span continuous deck under 3D non-uniform earthquake excitation. J. Earthq. Tsunami 2015, 9, 1550012. [Google Scholar] [CrossRef]
- Falborski, T.; Jankowski, R. Polymeric bearings - a new base isolation system to reduce structural damage during earthquakes. Key Eng. Mater. 2013, 569–570, 143–150. [Google Scholar] [CrossRef]
- Jankowski, R.; Mahmoud, S. Linking of adjacent three-storey buildings for mitigation of structural pounding during earthquakes. Bull. Earthq. Eng. 2016, 14, 3075–3097. [Google Scholar] [CrossRef]
- Kelly, J.M. Earthquake-Resistant Design with Rubber; Springer: London, UK, 1993. [Google Scholar]
- Soong, T.T.; Dargush, G.F. Passive Energy Dissipation Systems in Structural Engineering; John Wiley & Sons: London, UK, 1997. [Google Scholar]
- Komodromos, P. Seismic Isolation of Earthquake-Resistant Structures; WIT Press: Southampton, UK, 2000. [Google Scholar]
- Den Hartog, J.P. Mechanical Vibrations; Crastre Press: New York, NY, USA, 2008. [Google Scholar]
- Skinner, R.I.; McVerry, G.H. Base isolation for increased earthquake resistance of buildings. Bull. N. Z. Soc. Earthq. Eng. 1975, 8, 93–101. [Google Scholar]
- Kelly, J.M. Base isolation: Linear theory and design. Earthq. Spectra 1990, 6, 223–244. [Google Scholar] [CrossRef]
- Mahmoud, S.; Jankowski, R. Pounding-involved response of isolated and non-isolated buildings under earthquake excitation. Earthq. Struct. 2010, 1, 231–252. [Google Scholar] [CrossRef]
- Buckle, I.G.; Mayes, R.L. Seismic isolation: History, application, and performance—A world view. Earthq. Spectra 1990, 6, 161–201. [Google Scholar] [CrossRef]
- Skinner, R.I.; Robinson, W.H.; McVerry, G.H. An Introduction to Seismic Isolation; John Wiley & Sons: New York, NY, USA, 1993. [Google Scholar]
- Naeim, F.; Kelly, J.M. Design of Seismic Isolated Structures: From Theory to Practice; John Wiley & Sons: New York, NY, USA, 1999. [Google Scholar]
- Lashkari, B.; Kircher, C.A. Evaluation of SEAOC/UBC analysis procedures, Part 1: Stiff superstructure. Proceedings of a Seminar on Seismic Isolation, Passive Energy Dissipation and Active Control, Redwood, CA, USA, 11–12 March 1993. [Google Scholar]
- Constantinou, M.C.; Winters, C.W.; Theodossiou, D. Evaluation of SEAOC and UBC analysis procedures, Part 2: Flexible Superstructure. Proceedings of a Seminar on Seismic Isolation, Passive Energy Dissipation and Active Control, Redwood, CA, USA, 11–12 March 1993; Applied Technology Council: Redwood City, CA, USA, 1993. [Google Scholar]
- Kelly, J.M. The role of damping in seismic isolation. Earthq. Eng. Struct. Dyn. 1999, 28, 3–20. [Google Scholar] [CrossRef]
- Lin, G.L.; Kuo, T.C.; Lu, L.Y. Stiffness controllable isolation system for near-fault seismic isolation. Eng. Struct. 2008, 30, 747–765. [Google Scholar]
- Falborski, T.; Jankowski, R. Experimental study on effectiveness of a prototype seismic isolation system made of polymeric bearings. Appl. Sci. 2017, 7, 808. [Google Scholar] [CrossRef]
- Falborski, T.; Jankowski, R. Advanced hysteretic model of a prototype seismic isolation system made of polymeric bearings. Appl. Sci. 2018, 8, 400. [Google Scholar] [CrossRef]
- Falborski, T.; Jankowski, R.; Kwiecień, A. Experimental study on polymer mass used to repair damaged structures. Key Eng. Mater. 2012, 488–489, 347–350. [Google Scholar] [CrossRef]
- Rezaei Rad, A.; Banazadeh, M. Probabilistic risk-based performance evaluation of seismically base-isolated steel structures subjected to far-field earthquakes. Buildings 2018, 8, 128. [Google Scholar] [CrossRef]
- Nakai, A.; Sato, D.; Murakami, T.; Kasai, K. Evaluation of stiffness of base-isolation layer and superstructure of high-rise baseisolated building based on seismic observation recording. AIJ J. Technol. Des. 2018, 24, 571–576. [Google Scholar] [CrossRef]
- Du, D.; Wang, S.; Liu, W.; Shi, S.; Lee, C.; Xu, J. Modal property of base-isolated high-rise structure considering soil-structure interaction effect. Adv. Mech. Eng. 2018, 10, 1–9. [Google Scholar] [CrossRef]
- Wang, J.F.; Lin, C.C. Seismic performance of multiple tuned mass dampers for soil-irregular building interaction systems. Int. J. Solids Struct. 2005, 42, 5536–5554. [Google Scholar] [CrossRef]
- Loh, C.H.; Chao, C.H. Effectiveness of active tuned mass damper and seismic isolation on vibration control of multi-story building. J. Sound Vib. 1996, 193, 773–792. [Google Scholar] [CrossRef]
- Lin, C.C.; Ueng, J.M.; Huang, T.C. Seismic response reduction of irregular buildings using passive tuned mass dampers. Eng. Struct. 2000, 22, 513–524. [Google Scholar] [CrossRef]
- Pinkaew, T.; Lukkunaprasit, P.; Chatupote, P. Seismic effectiveness of tuned mass dampers for damage reduction of structures. Eng. Struct. 2003, 25, 39–46. [Google Scholar] [CrossRef]
- Ahlawat, A.S.; Ramaswamy, A. Multiobjective optimal absorber system for torsionally coupled seismically excited structures. Eng. Struct. 2003, 25, 941–950. [Google Scholar] [CrossRef]
- Sladek, J.E.; Klingner, R.E. Effect of tuned-mass dampers on seismic response. J. Struct. Eng. 1983, 109, 2004–2009. [Google Scholar] [CrossRef]
- Bernal, D. Influence of ground motion characteristics on the effectiveness of tuned mass dampers. In Proceedings of the Eleventh World Conference on Earthquake Engineering, Acapulco, Mexico, 23–28 June 1996. [Google Scholar]
- Xiang, P.; Nishitani, A. Optimum design for more effective tuned mass damper system and its application to base-isolated buildings. Struct. Control Health Monit. 2014, 21, 98–114. [Google Scholar] [CrossRef]
- Alhan, C.; Altun, M. Performance of non-linear base isolation systems designed according to uniform building code. In Proceedings of the 5th International Advanced Technologies Symposium, Karabuk, Turkey, 13–15 May 2009; pp. 1–6. [Google Scholar]
- MHUD. Iranian National Building Code (Part 6): Loading; Ministry of Housing and Urban Development: Tehran, Iran, 2009.
- Building and Housing Research Center. Iranian Code of Practice for Seismic Resistance Design of Buildings, Standard No. 2800, 3rd ed.; BHRC: Tehran, Iran, 2005. [Google Scholar]
- Uniform Building Code; International Conference of Building Officials: Whittier, CA, USA, 1994.
- IBC. International Building Code; International Code Council: Illinois, IL, USA, 2006. [Google Scholar]
- Chopra, A.K. Dynamics of Structures: Theory and Applications to Earthquake Engineering; Prentice-Hall: Englewood Cliffs, NJ, USA, 1995. [Google Scholar]
- PEER Ground Motion Database; Pacific Earthquake Engineering Research Center, University of California: Berkeley, CA, USA, 2019. Available online: https://ngawest2.berkeley.edu (accessed on February 2019).
Figure 1.
Schematic model of a building with a hybrid control system (left) and the bi-linear force–displacement relationship of the high-damping rubber bearing [34] (right).
Figure 1.
Schematic model of a building with a hybrid control system (left) and the bi-linear force–displacement relationship of the high-damping rubber bearing [34] (right).
Figure 2.
Acceleration time histories for top story of 10-story building under the Imperial Valley (far-fault) earthquake.
Figure 2.
Acceleration time histories for top story of 10-story building under the Imperial Valley (far-fault) earthquake.

Figure 3.
Acceleration time histories for top story of 10-story building under the Loma Prieta (far-fault) earthquake.
Figure 3.
Acceleration time histories for top story of 10-story building under the Loma Prieta (far-fault) earthquake.
Figure 4.
Acceleration time histories for top story of 10-story building under the Kern County (far-fault) earthquake.
Figure 4.
Acceleration time histories for top story of 10-story building under the Kern County (far-fault) earthquake.
Figure 5.
Acceleration time histories for top story of 10-story building under the Imperial Valley (near-fault) earthquake.
Figure 5.
Acceleration time histories for top story of 10-story building under the Imperial Valley (near-fault) earthquake.
Figure 6.
Acceleration time histories for top story of 10-story building under the Loma Prieta (near-fault) earthquake.
Figure 6.
Acceleration time histories for top story of 10-story building under the Loma Prieta (near-fault) earthquake.
Figure 7.
Acceleration time histories for top story of 10-story building under the Morgan Hill (near-fault) earthquake.
Figure 7.
Acceleration time histories for top story of 10-story building under the Morgan Hill (near-fault) earthquake.
Figure 8.
Peak story moments for 10-story fixed-base building.
Figure 9.
Peak story moments for 10-story base-isolated building.
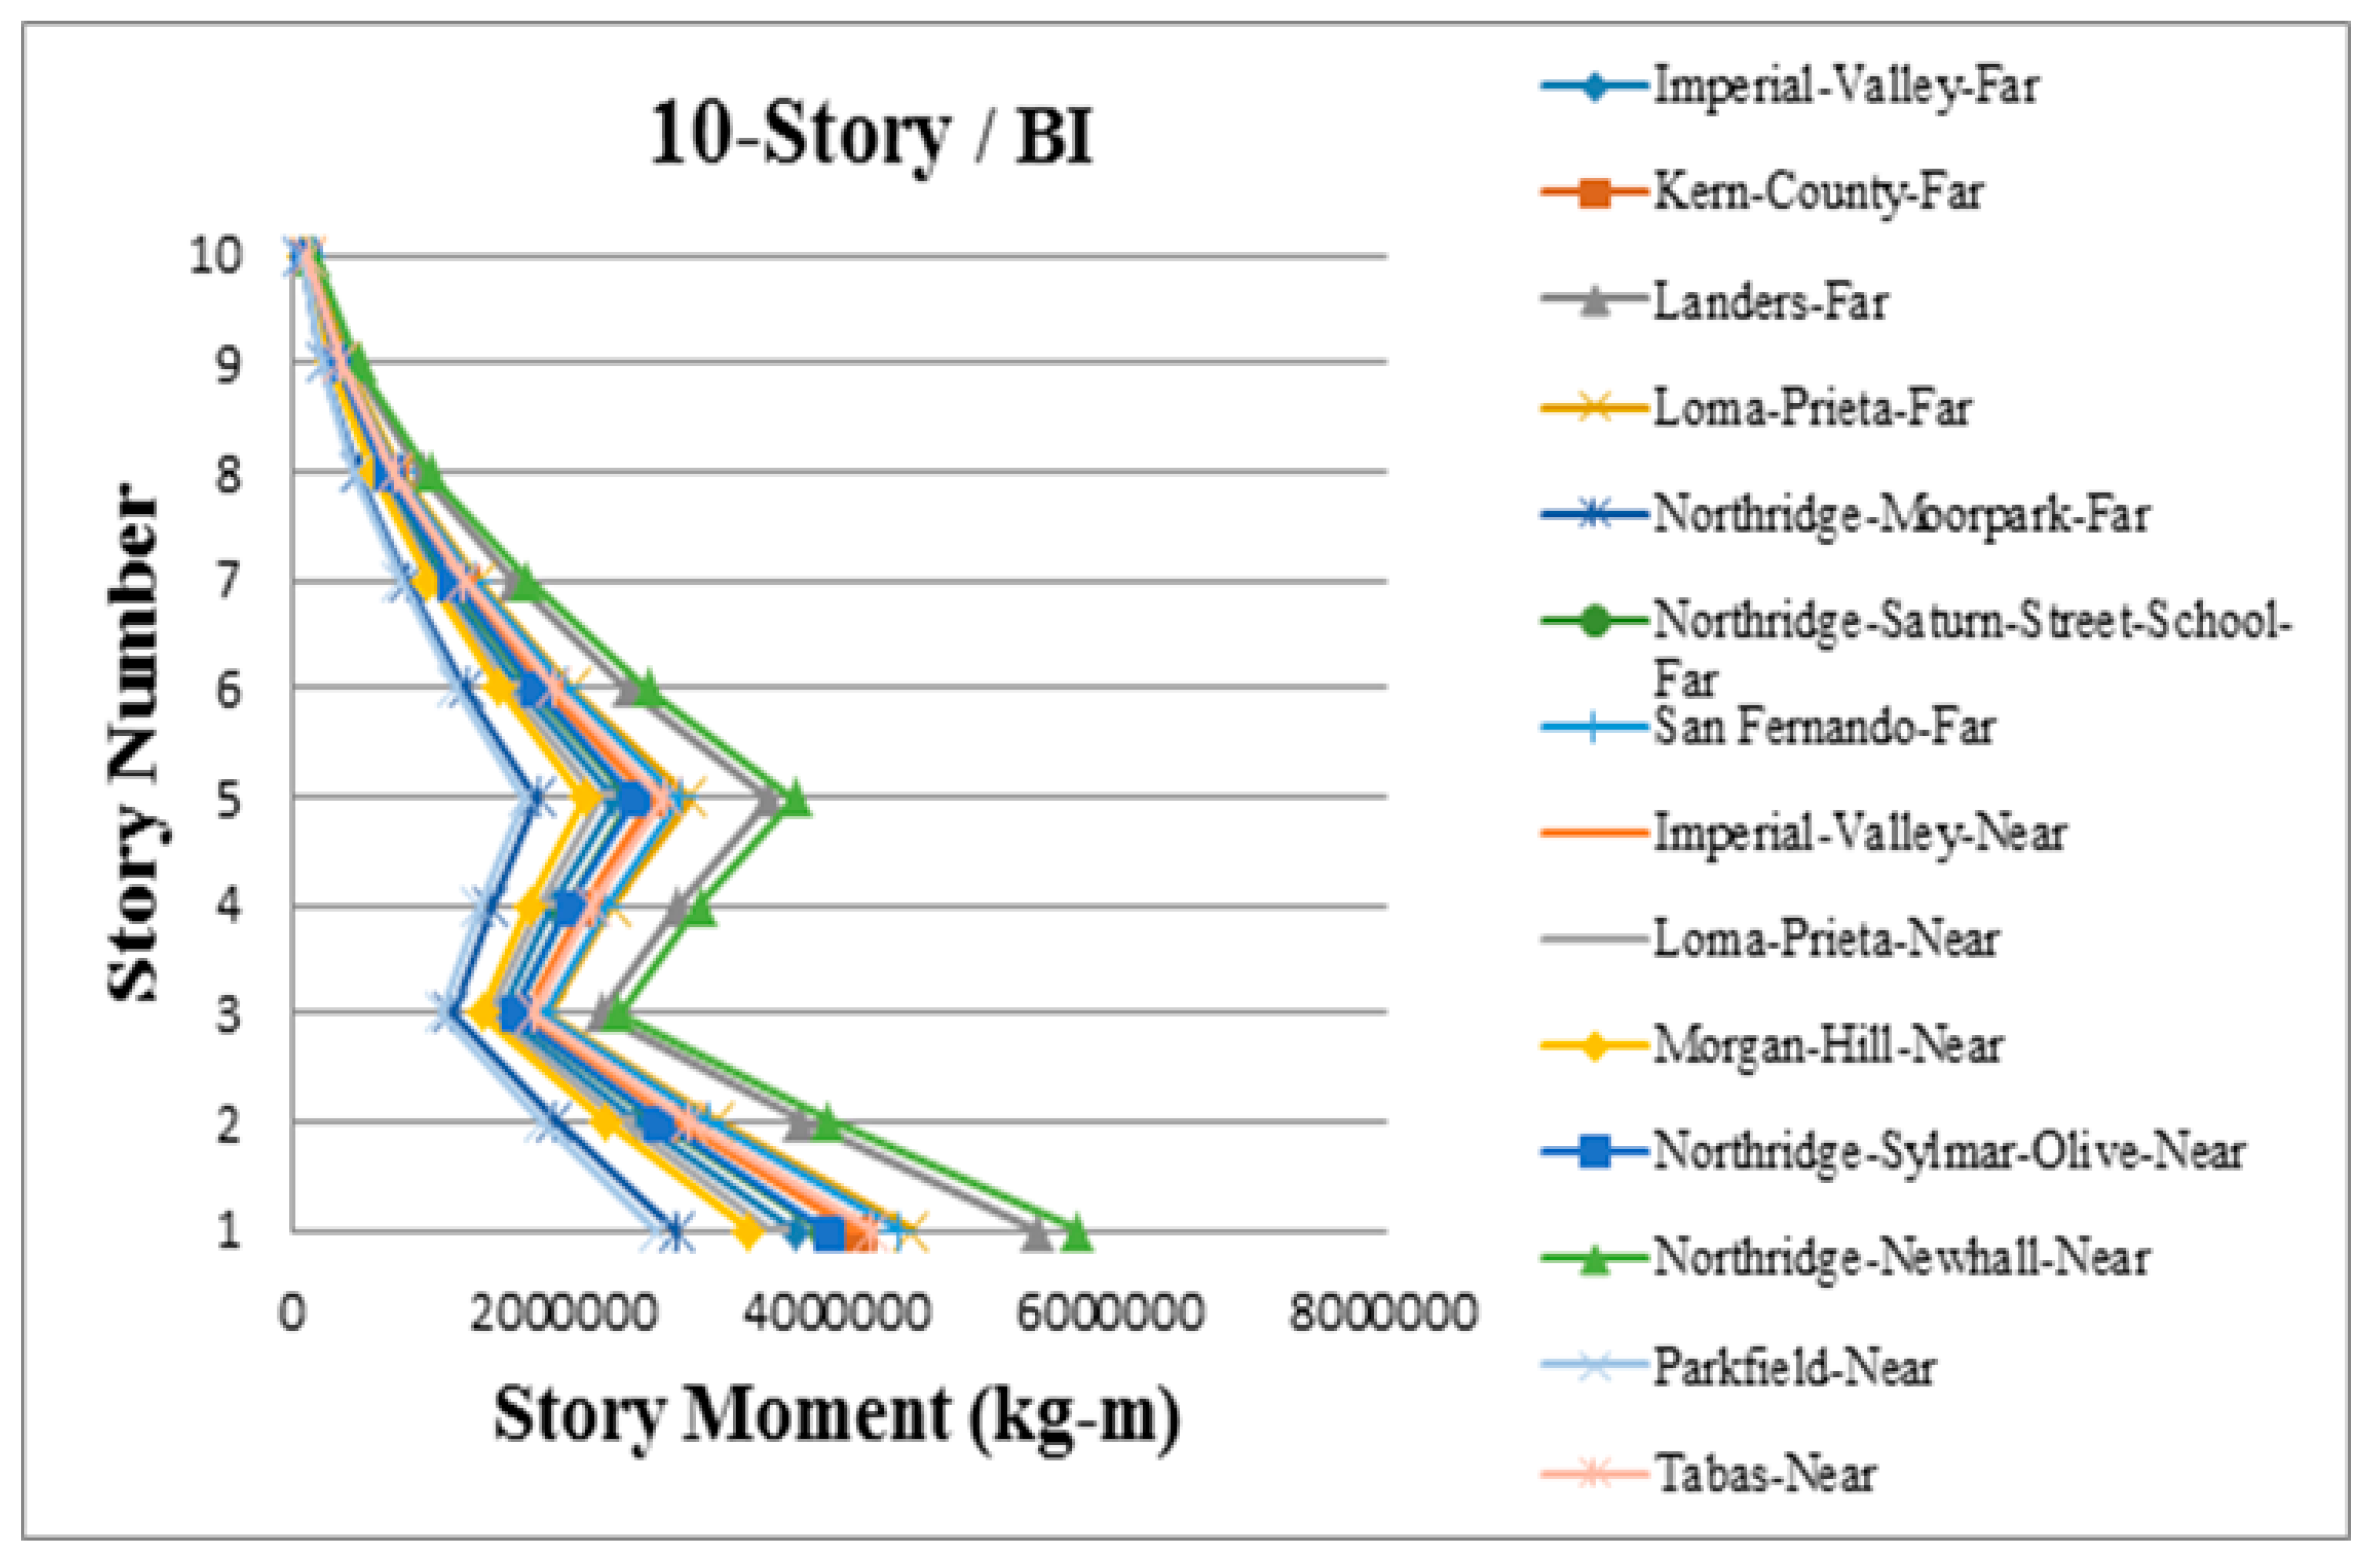
Figure 10.
Peak story moments for 10-story fixed-base building with 1 tuned mass damper (TMD).
Figure 11.
Peak story moments for 10-story base-isolated building with 1 TMD.

Figure 12.
Peak story moments for 10-story base-isolated building with 4 TMDs.
Figure 13.
Peak story moments for 10-story base-isolated building with 8 TMDs.

Figure 14.
Drift ratios for 10-story base-isolated building with 1 TMD.

Figure 15.
Drift ratios for 10-story base-isolated building with 4 TMDs.

Figure 16.
Drift ratios for 10-story base-isolated building with 8 TMDs.

Table 1.
Specifications of models of buildings equipped with seismic isolation devices.
| Building | (ton) | |||||||
|---|---|---|---|---|---|---|---|---|
| 5-story | 184.075 | 29.10 | 7.0 | 189.0 | 3.29 | 0.229 | 0.017 | 0.5 |
| 10-story | 335.348 | 53.59 | 12.8 | 348.1 | 6.06 | 0.215 | 0.017 | 1 |
| 15-story | 460.916 | 78.08 | 18.6 | 507.2 | 8.84 | 0.200 | 0.017 | 2 |
| 20-story | 596.275 | 102.57 | 24.5 | 666.3 | 11.61 | 0.206 | 0.017 | 3 |
—mass of building; —initial stiffness of isolation system; —effective stiffness of isolation system; —effective damping of isolation system; —yielding force of isolation system; —project displacement of isolation system; —yielding displacement of isolation system; —effective period of building.
Table 2.
Specifications of non-traditional tuned mass dampers (TMDs).
| Building | |||
|---|---|---|---|
| 5-story with 1 TMD | 0.6903 | 12.3291 | 0.6144 |
| 5-story with 4 TMDs | 2.7612 | 49.3162 | 2.4575 |
| 5-story with 8 TMDs | 5.5223 | 98.6324 | 4.9150 |
| 10-story with 1 TMD | 1.2576 | 21.5204 | 1.0956 |
| 10-story with 4 TMDs | 5.0302 | 86.0816 | 4.3824 |
| 10-story with 8 TMDs | 10.0604 | 172.1632 | 8.7647 |
| 15-story with 1 TMD | 1.7284 | 13.5266 | 1.0183 |
| 15-story with 4 TMDs | 6.9138 | 54.1063 | 4.0733 |
| 15-story with 8 TMDs | 13.8275 | 108.2126 | 8.1465 |
| 20-story with 1 TMD | 2.2360 | 15.0643 | 1.2223 |
| 20-story with 4 TMDs | 8.9442 | 60.2573 | 4.8892 |
| 20-story with 8 TMDs | 17.8883 | 120.5145 | 9.7783 |
—mass of TMDs; —stiffness of TMDs; —damping of TMDs.
Table 3.
Earthquake records considered in the study [40].
Table 3.
Earthquake records considered in the study [40].
| Earthquake | Year | Magnitude | Station | Characteristics | PGA-X (g) | PGA-Y (g) | PGV (cm/s) | PGD (cm) |
|---|---|---|---|---|---|---|---|---|
| Imperial Valley | 1979 | 6.5 | El Centro Diff. Array | Near-fault | 0.3521 | 0.4798 | 55.32 | 33.04 |
| Tabas | 1978 | 7.4 | 9102 Dyhook | Near-fault | 0.3279 | 0.4061 | 28.24 | 9.03 |
| Loma Prieta | 1989 | 7.0 | Gilroy Array #3 | Near-fault | 0.5550 | 0.3674 | 43.11 | 11.83 |
| Morgan Hill | 1984 | 6.1 | Coyote Lake Dam | Near-fault | 0.7109 | 1.2982 | 68.35 | 10.21 |
| Northridge | 1994 | 6.7 | Sylmar Olive View Hospital | Near-fault | 0.6045 | 0.8433 | 95.38 | 21.94 |
| Northridge | 1994 | 6.7 | Newhall Pico Canyon | Near-fault | 0.4549 | 0.3254 | 79.07 | 30.21 |
| Parkfield | 2004 | 6.4 | Cholame #5 | Near-fault | 0.4416 | 0.3670 | 23.92 | 3.85 |
| Northridge | 1994 | 6.7 | Moorpark (Ventura Fire Station) | Far-fault | 0.1931 | 0.2919 | 22.31 | 4.13 |
| Northridge | 1994 | 6.7 | Saturn Street School | Far-fault | 0.4745 | 0.4386 | 35.34 | 5.96 |
| San Fernando | 1971 | 6.6 | Castaic. Old Ridge Route | Far-fault | 0.3239 | 0.2681 | 19.83 | 3.29 |
| Imperial Valley | 1979 | 6.5 | Calexico Fire Station | Far-fault | 0.2748 | 0.2019 | 18.52 | 9.2 |
| Landers | 1992 | 7.3 | Morango Valley | Far-fault | 0.1879 | 0.1405 | 18.63 | 8.04 |
| Kern County | 1952 | 7.5 | Santa Barbara Courthouse | Far-fault | 0.0871 | 0.1267 | 13.67 | 3.08 |
| Loma Prieta | 1989 | 7.0 | Presidio | Far-fault | 0.0995 | 0.1999 | 20.33 | 4.98 |
PGA—peak ground acceleration; PGV—peak ground velocity; PGD—peak ground displacement; g—acceleration of gravity.
© 2019 by the authors. Licensee MDPI, Basel, Switzerland. This article is an open access article distributed under the terms and conditions of the Creative Commons Attribution (CC BY) license (http://creativecommons.org/licenses/by/4.0/).
Share and Cite
MDPI and ACS Style
Naderpour, H.; Naji, N.; Burkacki, D.; Jankowski, R. Seismic Response of High-Rise Buildings Equipped with Base Isolation and Non-Traditional Tuned Mass Dampers. Appl. Sci. 2019, 9, 1201. https://doi.org/10.3390/app9061201
AMA Style
Naderpour H, Naji N, Burkacki D, Jankowski R. Seismic Response of High-Rise Buildings Equipped with Base Isolation and Non-Traditional Tuned Mass Dampers. Applied Sciences. 2019; 9(6):1201. https://doi.org/10.3390/app9061201
Chicago/Turabian StyleNaderpour, Hosein, Naghmeh Naji, Daniel Burkacki, and Robert Jankowski. 2019. "Seismic Response of High-Rise Buildings Equipped with Base Isolation and Non-Traditional Tuned Mass Dampers" Applied Sciences 9, no. 6: 1201. https://doi.org/10.3390/app9061201
Note that from the first issue of 2016, this journal uses article numbers instead of page numbers. See further details here.