Vibro-Acoustic Characterization of a Composite Structure Featuring an Innovative Phenolic Foam Core


1
Department of Architecture, Built Environment and Construction Engineering; Politecnico di Milano, 20133 Milano, Italy
2
Department of Mechanical and Industrial Engineering, University of Brescia, 25128 Brescia, Italy
*
Author to whom correspondence should be addressed.
Appl. Sci. 2019, 9(7), 1276; https://doi.org/10.3390/app9071276
Submission received: 2 March 2019
/
Revised: 24 March 2019
/
Accepted: 25 March 2019
/
Published: 27 March 2019
(This article belongs to the Special Issue State-of-the-Art on Vibroacoustics and Sound Radiation Control of Structures)
Abstract
:Featured Application
Evaluation and design of foam-core sandwich structures with enhanced acoustic and dynamic properties.
Abstract
Composite panels are being increasingly used in many applications because they can combine several interesting properties, such as high load-bearing capacity, low weight, and excellent thermal insulation. Different core materials can be used for composite sandwich panels, like polystyrene, mineral wool, polyurethane, glass wool, or rigid phenolic foam, which is considered the rigid plastic foam with the best fire-proof properties. During the research and development phase, the use of simulation tools is often required for the improvement of the mechanical behavior of the material. The aim of the paper is to characterize some vibro-acoustic parameters of a sandwich material with phenolic open-cell foam core. The sound transmission loss of the structure is calculated based on its flexural behavior, represented through a frequency-dependent “apparent” bending stiffness which is estimated by natural frequency vibration tests on beam specimens. The comparison between sound transmission loss predictions and measurements in sound transmission suites according to ISO 10140-2 is presented and discussed. Finally, the early-stage prediction potentiality of the mathematical model is investigated when only nominal information is available on the constituent layers, showing that particular attention should be paid to the modifications introduced by the manufacturing process.
1. Introduction
In recent decades, various types of composite structures have been introduced in several areas because of their versatility and tunable properties. In aeronautics and aerospace engineering the use of these structures dates back to 1960s when they gained popularity due to the possibility of reducing weight without sacrificing strength and, in general, of finding satisfactory balance among different required functions, such as load-bearing, heat insulation, and thermal protection [1]. Combining different materials can also be used to enhance a single specific property, such as the capability of absorbing energy during ship [2] or train [3] collisions. In transportation, studies are constantly carried out to engineer new parts, such as roofs and floors of trains [4]; hoods, bumpers, engine compartments and body structures of cars [5]; and hulls, decks or bulkheads of ships [6], where noise, vibration and harshness (NVH) issues are particularly relevant. Surpassing conventional materials is a key topic even in the building sector, where steel reinforcements are more and more replaced by glass or carbon fibers to eliminate the risk of corrosion, and thick, load-bearing concrete structures are substituted by more slender sandwich panels fulfilling both structural and sound/heat insulation requirements [7]. In this field, often diverging characteristics must be taken into account: for example, some structural elements, such as solid concrete ribs, may have a negative effect on the insulation performances of the building [8], whereas thermal insulation and acoustic insulation may need to be considered separately [9]. Similar to the building sector, the infrastructure field is concerned with the longevity of constructions made of steel-reinforced concrete. In this case, several alternatives are usually considered and the choice of the most convenient solution requires experimentally-validated models, development of reliable characterization methods and optimization of the manufacturing process [10].
Sandwich materials, consisting of external laminates with high strength, bonded to a usually lightweight, thicker core whose function is to resist the shear forces and increase the bending stiffness of the whole structure, have grown popular in the last century. Although extensively addressed in the scientific literature, the questions raised by the virtually unlimited combination possibilities offered by sandwiching techniques, by the new manufacturing processes involved and by the ever-increasing number of applications make the research of applicable theories and models vast and diverse [11]. The experimental characterization of sandwich structures, as well as the evaluation of suitable test methods and the investigation of sandwich-specific effects, are an interesting research topic. Roozen et al. [12] experimentally measured the vibrational field of a sandwich panel used in vehicle industry and projected the data to an analytical image source model to obtain the Young’s modulus of an “equivalent” Kirchhoff plate. Shahdin et al. [13] studied the behavior of a sandwich material with carbon-fiber-network core. It is worth noting how different specimens for two static tests (compression and three-point bending) and one dynamic test (vibration test by Oberst method) were needed, to the purpose of assessing the damping behavior of the material, which was the primary requirement in this case, and check that the modest structural strength was anyway acceptable. Mohamed et al. [10] manufactured and tested three types of structures with glass-fiber reinforced polymer laminates and polyurethane foam-based core, with the aim of identifying the most suitable design for bridge decks. In their analysis, the authors performed flexure and compression tests according to ASTM relevant standards, and not only did they provide numerical results, but they also examined the failure mechanisms associated to each structure shape and composition. Tang et al. [14] investigated the properties of sandwich panels with two steel laminates and a phenolic foam core under uniformly distributed load, by testing full specimens according to vacuum chamber loading method and examining the failure mechanisms step-by-step. A simplified theoretical model, based on Timoshenko composite beam theory and validated by the experimental tests and by finite-element analysis, was given for the calculation of bending moment, shear force, deformation, load-bearing capacity and local buckling at a design stage. Neri et al. [15] investigated the heat transfer in wooden layered roofs in relation to the fire hazard when exposed to a heat source, showing that the position of the layers affects the temperature distribution.
The vibro-acoustic analysis of a sandwich structure can encompass different theoretical, experimental, and numerical aspects and methodologies, some of which were described by D’Alessandro et al. in their review [16]. Sound transmission loss STL and radiation efficiency σ are commonly used indicators of the coupling between vibrating structures and a surrounding fluid. Other parameters, such as the group velocity, the wavenumber and the modal density, are the subject of dedicated studies because they allow to derive STL and σ and they carry additional information on the vibrational field. These parameters can be obtained through mathematical models, as in Ghinet and Atalla [17], but also experimentally measured with contact methods based on accelerometers (see for instance Tronchin [18]) or non-contact techniques as in Roozen et al. [19]. Finally, the study of the point and transfer mobility to predict the structure-borne sound power is of practical interest when vibrations are transmitted by a mechanical vibrating source, causing noise [20].
Common types of core are honeycomb structures, made of aluminum, paper, or plastic. Foam cores are another frequent choice due to their low weight and good insulation properties, and they can be realized in several different materials, including metal and polymer-based compounds. Polyurethane (PUR), polyethylene (PE), and polystyrene (PS) are widely used as core materials, but they have limited high-temperature resistance [21] and, when exposed to fire, they deteriorate, ignite, and release toxic gases. A valid alternative in this respect is represented by phenolic resins, which show excellent fire properties [22] including low, non-toxic fume generation. Phenolic foam (PF) is a thermosetting cellular material that is widely used in the construction industry. The environmental life-cycle impact of phenolic foam items is to be considered, especially because of its potential scale of application [23]. As all conventional foams, phenolic foams are obtained by mixing a liquid resin, a blowing agent and an acid catalyst, with further additives that can be added to the mixture to provide the material with certain desired characteristics. Very common blowing agents used to be volatile organic compounds (VOCs) or chlorofluorocarbons (CFCs) like trichlorofluoromethane, also known as CFC-11. In the late 1980s, following the Montreal Protocol, CFCs and HCFCs were phased out because proven ozone-depleting substances, thus they were partially replaced by hydrofluorocarbons (HFCs) like HFC 365mfc/227ea blends. Recently, HFCs have also been phased down after the Kigali Amendment to the Montreal Protocol and the European F-gas regulation, due to their relatively high global warming potential (GWP) [24]. PFs can be manufactured in either closed-cell or open-cell structures. In closed-cell PFs, the cells that form the structure of the material are sealed from each other and contain the blowing agent on a long-term basis (Figure 1a), thus, they are widely used for insulation purposes, especially in external wall, pipework and equipment insulation systems, for their good thermal properties and moisture resistance. On the other hand, in open-cell PFs (Figure 1b) the cells are interconnected to each other and the blowing agent escapes during the manufacturing process, leaving air instead. The latter structure can be chosen over the former one for its lower density, higher transpiration capability and lower thermal expansion.
In this work, a vibro-acoustic analysis focusing on the estimation of the bending stiffness and sound transmission loss of a sandwich structure through the wave propagation approach is presented. The structure is made of two sheet molding compound (SMC) leaves sandwiching a layer of “Acell 150 Foam”, an open-cell phenolic foam specifically designed for fire-resistant applications obtained through a proprietary process which allows to overcome the natural friability of the basic phenolic resin, making it suitable to machining and coupling with other materials. The manufacturing process does not use CFC, HCFC, VOC, or HFC blowing agents and the material can be recycled as a filler. The foam is currently undergoing a process of optimization by the manufacturing company, willing to improve its sound insulation capabilities while preserving its fire-resistance properties, to the aim of expanding its application in the shipbuilding industry. However, the mechanical and morphological characteristics of the structure, and of the core in particular, are difficult to know in advance, due to the modifications induced by the production process, which cannot ensure a perfectly uniform density across the planar direction of the foam panel. Moreover, one of the main uncertainties when dealing with open-cell foams is that it is impossible to create a controlled interface between the core and the laminates, and to guarantee an even distribution of the glue. The aim of the work is two-fold: on the one hand, the prediction capabilities of a parametric literature model is evaluated when vibrational data measured on beam specimens are passed as input; on the other hand, the evaluation is repeated by feeding the model with the nominal data of the materials constituting the layers, so to highlight the effects of the manufacturing process on the sound insulation properties of the final product.
The paper is organized as follows. Section 2 summarizes the mathematical model first proposed by Nilsson in the early 1990s to describe the bending of sandwich beams and predict the sound transmission loss of sandwich plates. Section 3 describes the experimental techniques, the equipment, and the test specimens used in the measurement campaigns. In particular, a frequency-dependent bending stiffness of the sandwich panel is estimated by means of dynamic tests performed on two sandwich beams cut from the panel in orthogonal directions. Section 4 presents the results of the investigation, in terms of estimated bending stiffness, loss factor and sound transmission loss. The latter is compared with measurements in sound transmission suites performed according to ISO 10140-2. In Section 5, the use of the model with nominal data relative to the constituting materials instead of experimental measurements and the influence of the manufacturing process on its predictive capabilities are discussed.
2. Theoretical Background
2.1. Propagation of Bending Waves
In the present paper, the wave propagation approach, as presented in the work by Nilsson and Nilsson [25] is used as a theoretical background for defining a test method to obtain the mechanical and dynamic properties of a sandwich material. The symmetry of the structure is assumed in obtaining the equations governing its transverse displacement (Figure 2), whose derivation is summarized in [26].
The external laminates have thickness hl. The effective shear stiffness of the core is Gc, and its thickness hc. The Young’s modulus of the laminates, El, is usually much greater than the Young’s modulus of the core, Ec. The core is generally stiff in the z-direction perpendicular to the laminates, which therefore can be assumed to move in-phase within the frequency range used for the acoustic predictions.
The bending stiffness of the entire structure can be computed as:
Hamilton’s principle states that the action integral of a mechanical system is stationary. The action is the difference between the total potential energy, which for a sandwich beam is due to pure bending of the beam, bending of both laminates and shear in the core, and its total kinetic energy, due to the vertical motion of the beam and to the rotation of one of its sections. This formulation is used to derive the system of equations that governs the flexural behavior of the structure. A sixth-order differential equation is obtained, whose solution shows that the sandwich material behaves like a simple homogeneous beam whose bending stiffness depends upon frequency. An “apparent”, frequency-dependent bending stiffness D′a can therefore be obtained as the solution to the equation:
where D′2 is the bending stiffness of one laminate and ω is the angular frequency, 2πf. In the expression, m′ is the mass per unit length of the beam, calculated with respect to the beam cross section.
This equation can be written in a more general way as:
provided that A, B and C coefficients are defined as follows:
For a beam made by a non-metallic material, the Young’s modulus can be frequency-dependent as well [27]. However, within the frequency range of interest the parameters D′1, D′2, and Gc in Equation (4) can be reasonably assumed to have constant values for the structure under investigation.
The literature presents many examples of successful use of this theory for different purposes, like estimating the sound transmission loss of a structure, as described in Section 2.2, evaluating new materials, and performing optimization analyses. The definition of “sandwich” is here quite broad. For example, Scamoni et al. [28] use this approach to estimate the sound insulation performances of a coated brick wall, while Santoni et al. [29] study the vibro-acoustic behavior of wood plastic composite panels, which, given their inner structure, are treated as orthotropic sandwich elements with lightweight core, obtaining the bending stiffness according to the Nilsson and Nilsson’s model and feeding it to the transfer matrix method to optimize the structure in terms of sound transmission loss. Piana and Marchesini [30] investigate how to improve the comfort in the owner’s cabin of a yacht by examining possible materials to build the bulkhead separating it from the crew cabin. They test several sandwich specimens with different core materials according to Nilsson and Nilsson’s method, and use the results to select the best available alternative on which to perform in-field sound intensity measurements. Nilsson and Nilsson’s model has also been used to validate new theoretical approaches, as in Ichchou et al. [31]. For example, de Rijk and Nijman [32] use the governing equations developed in [25] as the reference theory to build a model representing a sandwich beam with a homogeneous equivalent Timoshenko beam.
The flexibility of the method lies in the combination of an analytical model, which, although simplified, is valid in many practical circumstances, and of relatively simple experimental tests, which allow to encompass the actual vibrational behavior of the material through its apparent bending stiffness. A particularly promising application is the design of new products with specific sound insulation properties, as shown by Piana et al. [26], where the same approach is used to model the vibro-acoustic properties of aluminum honeycomb sandwich panels and to identify the most sensitive parameters in the development of new configurations. In this case, A, B, and C coefficients are calculated directly from the properties of the constituent layers, which can, in principle, be used to design new structures at an early stage, trying to optimize their acoustic behavior whilst keeping an eye on production constraints. To follow this approach, the geometrical information and the mechanical characteristics of the laminates are generally available. However, the core’s moduli Ec and Gc are usually more difficult to obtain and are often peculiar to the specific production batch, which raises the need for mechanical tests on core samples.
2.2. Sound Transmission Loss
The sound transmission loss of a single leaf panel depends on the bending stiffness of the structure and on several other parameters [33]. It is convenient to define the critical frequency, fc, for which the propagation speed of bending waves equates the propagation speed of acoustic wave in the surrounding medium:
where c is the speed of sound in air, μ is the mass per unit area and D the bending stiffness per unit width of the homogeneous structure. The transmission coefficient τ(φ) is, for a given angle of incidence φ and for the entire frequency range of interest:
Z = ρ0 c is the impedance of the medium and η is the loss factor of the structure. The sound transmission loss, STL, in decibels is:
where τd is the sound transmission coefficient for diffuse incidence, defined, for a perfectly diffuse field, as:
Assuming that all the angles of incidence are equally probable, the integration range is 0 to π/2. However, it is known [34] that the STL obtained in this way overestimates the values found in reverberation rooms, thus, an arbitrary limitation of the integration range is often introduced, with φlim usually restricted between 78° and 85°. It has been shown [25] that the sound transmission loss of a sandwich panel can be predicted fairly well by using the same theory, once the apparent bending stiffness per unit width Da = D′a/b of the composite structure is considered in Equation (5) in place of the constant D value used for the homogeneous panel. As a result, a frequency-dependent parameter f′c = (c2/2π) (μ/Da)1/2 is defined and used in Equation (6) to calculate the transmission coefficient.
3. Materials and Methods
3.1. Experimental Determination of the Apparent Bending Stiffness of the Sandwich Panel
One of the key elements in using the wave propagation approach to estimate vibro-acoustic properties is the determination of the apparent bending stiffness, which can be carried out in different ways according to the type of structure at hand.
For a beam characterized by free-free boundary conditions, the bending stiffness can be experimentally derived by means of some simple measurements on specimens cut from the panel. For a beam of length L, the apparent bending stiffness D′a,n for mode n having the eigen-frequency fn is given by:
where the values of the αn coefficients, specific for free-free boundary conditions, are reported in Table 1. In case of a homogeneous beam, the bending stiffness is constant, and the values calculated for the different eigen-frequencies are expected to be close to each other.
To determine its apparent bending stiffness, the beam is suspended by strings as shown in Figure 3. The test procedure is described in [25] and requires the use of an impact hammer and an accelerometer connected to a dual channel real-time analyzer. The output is the frequency response function H1, defined as H1(f) = ΦFa(f)/ΦFF(f), where ΦFa(f) is the cross-spectrum between force and acceleration signals, and ΦFF(f) is the auto-spectrum of the force signal [35]. One of the main advantages of experimentally obtaining the bending stiffness through dynamic tests is that this kind of measurements automatically capture the possible inhomogeneity and variations with respect to the original constituent materials deriving from the manufacturing processes involved [13], which would be difficult to include by means of a pure theoretical approach or a finite-element-based analysis.
After this test, several modes can be identified as the peaks of the frequency response function and using Equation (9) it is possible to estimate the apparent bending stiffness at each natural frequency. The least-square method can now be used to perform the bending stiffness curve fitting, by substituting the measured data (fn, D′a,n) in the following equation:
Choosing A, B, and C as the values that minimize Q. The solution procedure described in detail in [36] uses three equations to determine the dynamic parameters of the beam along the entire frequency range, but other fitting approaches have been explored in the literature, such as writing frequency as an explicit function of the bending stiffness and minimizing the error in frequency [37]. As pointed out in Ege et al. [38], at increasing frequencies the damping increases, resonances are less pronounced, the modes overlap and the frequency response tends to smooth out, thus, this modal identification method can normally be used in a limited frequency range depending on the material. In case of extremely flexible or small specimens, this range could be rather short and other identification methods should be considered.
In the case at hand, where the laminates are SMC leaves, the orthotropicity assumption has been made [39]. Two beams have been cut in orthogonal directions and a bending stiffness function relative to each of them has been determined. To obtain the composed bending stiffness, D′a,avg, the apparent bending stiffness functions derived for the x- and y-direction can, therefore, be composed according to the following equation [40]:
where G J is the effective torsional rigidity of the structure, which can be simplified as (Da,x′Da,y′)1/2 once the in-plane shear modulus is approximated as (Ex Ey)1/2/[2 + 2(νxy νyx)1/2] [41], νij indicating the Poisson’s ratio of relative contraction in direction j to relative expansion in direction i. In case of orthotropic structures, the diffuse field transmission coefficient τd is the weighted average for τ(φ,θ) over all the angles of incidence, and the right side of Equation (8) becomes a double integral [42].
When it is not possible to cut beams from the panel, like in the event of already mounted partitions [43] or particularly bulky structures [44], the bending stiffness can be determined through point mobility measurements. This method has the advantage of taking into account the actual boundary conditions, which, as pointed out in [45], influence the bending stiffness of the structure.
3.2. Experimental Determination of Elastic Modulus of the Phenolic Core
As mentioned in Section 2.1, A, B, and C coefficients in Equation (3) and, as a consequence, the apparent bending stiffness function can be calculated directly from the properties of the constituent layers. In the case at hand, the mechanical characteristics of the laminates are available from technical datasheets. However, the mechanical characteristics of the core are not known. In order to explore the design capabilities of the method, the Young’s modulus and the shear modulus of the phenolic foam must be found.
The Euler-Bernoulli bending theory is used to estimate the Young’s modulus of a phenolic foam beam. For a homogeneous beam for which the conditions of the Euler beam equation are satisfied [46], D′ = E I, where D′ is the bending stiffness, E the Young’s modulus and I the area moment of inertia of the beam’s cross section. In free-free conditions, D′ can be estimated with a similar procedure as the one described in Section 3.1 on a foam beam suspended by strings and, from the identified natural frequencies, the Young’s modulus can be determined as:
where the values of the αn coefficients are reported in Table 1, and I = b h3/12 for a beam with a rectangular cross-section of thickness h and width b.
The experimental evidence (see Section 5) shows that the resulting En values do not depend significantly on frequency, as expected: the zero-frequency value E has therefore been obtained by averaging the En values calculated for the first eleven eigen-frequencies.
Finally, the shear modulus G is obtained as:
with the Poisson’s ratio ν = 0.3 [47], assuming that the core behaves like a homogeneous material before and after the sandwiching process.
3.3. Specimens and Equipment for Dynamic Tests
The dynamic test method described above has been applied to two different specimen types:
- two sandwich beams, cut in orthogonal directions from a panel made by a 17-mm open-cell phenolic foam core sandwiched between two identical 1.5-mm SMC leaves (Figure 4); and
- a homogenous 17-mm phenolic foam beam.
In particular, the bending stiffness of the complete sandwich structure has been obtained for the calculation of the STL according to the theory, while the bending stiffness of the homogeneous beam was used to estimate the Young’s modulus of the phenolic foam alone (see Section 3.2).
The geometric and physical properties of the three specimens can be found in Table 2. In particular, the mass per unit area, length, width, and thicknesses of the beams have been measured, while the Young’s modulus of the laminates has been assumed from the technical datasheet of the material.
For the dynamic tests, a PCB accelerometer, type 352A24, and a PCB impedance hammer, type 086C03, with a nylon tip have been used. The time signals coming from the transducers have been recorded by a multichannel analyzer OROS type OR36 and post-processed through different self-developed codes.
3.4. Measurements in Sound Transmission Suites
Sound transmission loss predictions have been validated by reverberation rooms tests according to ISO 10140-2:2010, performed on a panel cut from the same production batch as the sandwich beams described in the previous section (see Table 3). The panel under test is placed in an opening obtained in the wall dividing two reverberation rooms, a “source room” and a “receiving room”. An omnidirectional sound source is placed in the source room, and the test is repeated for two source positions. With the source turned on, the sound pressure levels are measured in six positions of the source room and in six positions of the receiving room. Finally, the sound pressure levels in the source room, L1, and in the receiving room, L2, are evaluated as the energetic average of the measurements performed in the source room and in the receiving room respectively. The sound transmission loss STL is given by:
where S is the area of the free test opening, and A2 is the equivalent sound absorption area in the receiving room.
The panel under test consists of three sub panels (parts). In Figure 5, the boundary of each part is marked with a yellow line. The two slices placed in the upper part have a height of 600 mm, while the slice placed at the bottom of the panel is 290-mm high. The different parts are coupled to each other with a layer of plastic-reinforced glass (PRG).
The air gap between the panel and the wall dividing the two rooms has been filled with silicone and backed up with wooden studs.
4. Results and Discussion
4.1. Bending Stiffness of the Sandwich Structure
The natural frequencies of the beams cut in the x-direction and in the y-direction have been identified as the peaks in the frequency response functions between the accelerometer and the impact hammer. The corresponding apparent bending stiffness values have been calculated through Equations (9)–(11) have been used to reconstruct the average bending stiffness per unit width curve represented in Figure 6.
4.2. Sound Transmission Loss Predictions and Measurements
For the prediction of the transmission coefficient τ(φ) through Equation (6), the loss factor must be determined. To this aim, structural reverberation time measurements have been carried out in twelve measurement positions (Figure 7a) while the panel was mounted in the opening dividing the two reverberation rooms. The loss factor has been computed by the formula [33]:
Once the average of the structural reverberation time (TR) for each one-third octave band of interest (f1/3) was computed it was possible to estimate the loss factor for the mounting conditions adopted during the measurements. The resulting loss factor is shown in Figure 7b.
Figure 8 shows the comparison between the sound transmission loss based on the orthotropic bending stiffness function in Equation (7) (solid line) and the result of reverberation rooms measurements according to ISO 10140-2 (dotted line). It can be observed that the agreement at and around the critical region is good, since both the location of the coincidence frequency and the STL value are predicted correctly. However, at lower frequencies, the measured STL values are considerably higher than the STL resulting from the transmission coefficient computed according to Equation (6). This is due to the fact that the latter describes the behavior of an infinite panel, while the panel measured in the reverberation rooms has finite dimensions. In the case of an infinite panel, the bending waves propagate in every direction without being reflected by the boundaries. In real, finite-size panels, the bending waves are reflected at the boundary and give rise to a sound radiation which can be considered the sum of a resonant and a non-resonant behavior. The resonant behavior takes place at frequencies above the critical region, where the entire plate radiates, and the contribution of the non-resonant field is negligible compared to that of the resonant modes. The non-resonant radiation of the plate is only significant at frequencies below the coincidence, at which sound is radiated by areas where cancellation between nodes and anti-nodes arising from standing waves is ineffective. The non-resonant transmission coefficient τNR according to Leppington et al. [48] can be computed as:
where F = (fc/f)1/2, kair is the frequency-dependent wavenumber in air, and U, which is a function of the panel’s aspect ratio (L/H), is ignored when (L/H) is between 1/3 and 3 [49], as in the case at hand.
The dashed line in Figure 8 represents the sound transmission loss calculated from the non-resonant transmission coefficient τNR. The agreement with the results from the measurement carried out in reverberant rooms is fair.
5. Influence of the Manufacturing Process on the Insulation Properties of the Product
The dynamic tests proved to be a good experimental basis to estimate the sound transmission loss of a sandwich structure. In this section, the capabilities of the model are discussed when the apparent bending stiffness function is evaluated directly from the nominal properties of the layers. Although the manufacturing process of sandwich structure like the one at hand is known to modify the characteristics of the original layers, not much information about the final configuration is available when designing a new material from scratch. Therefore, predictions have been made by using the nominal characteristics of the layers, before undergoing the modifications induced by the manufacturing process. This investigation is believed to be useful to understand to which extent the model can be employed and what points of attention need to be considered.
The mechanical properties of the phenolic foam layer have been determined according to the method outlined in Section 3.2. Figure 9a shows the measured transfer function, the natural frequencies being in correspondence of the peaks. The resulting Young’s modulus values, calculated according to Equation (13), are reported in Figure 9b. It can be observed that they do not vary significantly with frequency, which is the expected behavior in the case of a homogeneous beam.
The average value of E = 108 MPa is inserted into Equation (14) to compute the shear modulus, which, together with the characteristics reported in Table 3, is used to calculate coefficients A, B and C through Equations (4). Finally, the sound transmission loss for an infinite, isotropic structure has been obtained by means of Equations (3) and (5)–(8). The resulting curve can now be compared to the STL predicted from dynamic natural-frequency tests. To isolate the influence of the mechanical characteristics of the layers, the same limit angle of integration and loss factor have been used in the two cases. The comparison is shown in Figure 10.
Contrary to the expectations, the critical zone as predicted by the new simulation (solid line in Figure 10) is completely wide of the mark. To understand the reasons for such a poor agreement, some considerations about the actual sandwich structure must be made. In particular, the manufacturing process consists in applying a layer of glue to both sides of the foam core, collating the constituent layers and joining them together under pressure. During the process, the interfaces between laminates and core get blurred due to the glue, which makes the involved portion of the core stiffer. The presence of the glue results in an additional rigid “layer”, which reduces the actual thickness of the core (Figure 11). Moreover, the core is compressed, which leads to believe that its actual Young’s modulus is higher than that of the original homogeneous phenolic foam layer.
By visual inspection, the actual laminate thickness after the sandwiching process is about 3.5 mm on average, and the actual compressed sandwich structure is approximately 15 mm thick. As concerns the stiffened core, the increase in the Young’s modulus is difficult to quantify. However, if the second formula in Equation (4) is used to compute Gc with the coefficient B obtained through the best-fitting of dynamic test data, the resulting Young’s modulus Ec = 2 Gc × (1 + ν) is greater than 300 MPa, that is, three times the Young’s modulus measured on the phenolic foam alone. Figure 12 shows the result of a second simulation performed by using the above-mentioned corrections to the thicknesses of the layers and to the Young’s modulus of the core: the agreement between the curves, although still not perfect, has been considerably improved by the simple, visual-inspection-based corrections applied.
From the results of the analysis, it can be concluded that the method based on the direct calculation of the bending stiffness curve from the original layer characteristics should be used with caution at the design stage, since the manufacturing process can considerably alter the structure of the panel and the properties of the final product. This approach is, however, suitable to compare, evaluate, and choose among alternative configurations, and to analyze the impact of individual changes in the properties of the material.
6. Conclusions
In this paper, a sandwich structure with an innovative phenolic foam core has been characterized. The wave propagation approach has been used to determine its dynamic and vibro-acoustic properties based on the frequency-dependent bending stiffness of the structure. First of all, dynamic tests have been performed to find the natural frequencies and the apparent bending stiffness, which was used to estimate the sound transmission loss of the structure based on the Cremer theory for infinite plates. The results have been compared to measurements in reverberation rooms, showing good agreement once the effect of the finite size of the panel is included in the simulation. Moreover, the possibility to use the method as a tool to design new structures has been explored by calculating the bending stiffness function directly from the geometrical, physical, and mechanical properties of the constituent layers. It has been found that the manufacturing process has a strong influence on the quality of the results any time it considerably modifies the layers through the effect of additional materials, such as the glue, or compressive actions. Such changes are difficult to quantify, especially at a preliminary stage. The direct calculation of the bending stiffness can more effectively be used to perform comparative analyses and identify the key parameters to improve the performance of the structure.
Author Contributions
M.F. conceived the work, managed the experimental campaigns and wrote the paper. N.G. performed the tests in reverberation rooms and provided the theoretical support for the interpretation of the results. E.A.P. finalized the bibliographic research, performed the simulations, reviewed, and edited the paper.
Funding
This research received no external funding.
Acknowledgments
The authors would like to thank Acell Tech S.r.l. for the technical support and for donating the material used for the tests.
Conflicts of Interest
The authors declare no conflict of interest.
References
- Yin, C.; Zheng, Q.; Zeng, J.; Yang, J.; Xiao, J. Composite sandwich panel with multifunction of load bearing, heat insulation, and thermal protection. J. Compos. Mater. 2015, 49, 3077–3087. [Google Scholar] [CrossRef]
- Zhu, L.; Liu, W.; Fang, H.; Chen, J.; Zhuang, Y.; Han, J. Design and simulation of innovative foam-filled Lattice Composite Bumper System for bridge protection in ship collisions. Compos. Part B-Eng. 2019, 157, 24–35. [Google Scholar] [CrossRef]
- Amraei, M.; Shahravi, M.; Noori, Z.; Lenjani, A. Application of aluminium honeycomb sandwich panel as an energy absorber of high-speed train nose. J. Compos. Mater. 2014, 48, 1027–1037. [Google Scholar] [CrossRef]
- Mozafari, H.; Khatami, S.; Molatefi, H. Out of plane crushing and local stiffness determination of proposed foam filled sandwich panel for Korean Tilting Train eXpress—Numerical study. Mater. Des. 2015, 66, 400–411. [Google Scholar] [CrossRef]
- Helps, I.G. Plastics in European Cars, 2000–2008; iSmithers Rapra Publishing: Shrewsbury, UK, 2001; ISBN 978-1-85957-234-4. [Google Scholar]
- SAND CORe Co-ordination Action on Advanced Sandwich Structures in the Transport Industries. Best Practice Guide for Sandwich Structures in Marine Applications; NewRail, University of Newcastle: Tyne, UK, 2013. [Google Scholar]
- Shams, A.; Stark, A.; Hoogen, F.; Hegger, J.; Schneider, H. Innovative sandwich structures made of high performance concrete and foamed polyurethane. Compos. Struct. 2015, 121, 271–279. [Google Scholar] [CrossRef]
- Benedetti, M.; Gervasio, P.; Luscietti, D.; Pilotelli, M.; Lezzi, A.M. Point thermal transmittance of rib intersections in concrete sandwich wall panels. Heat Transf. Eng. 2018. [Google Scholar] [CrossRef]
- Di Bella, A.; Granzotto, N.; Elarga, H.; Semprini, G.; Barbaresi, L.; Marinosci, C. Balancing of thermal and acoustic insulation performances in building envelope design. In Proceedings of the INTER-NOISE 2015—44th International Congress and Exposition on Noise Control Engineering, San Francisco, CA, USA, 9–12 August 2015; Maling, G., Burroughs, C., Eds.; The Institute of Noise Control Engineering of the USA, Inc.: San Francisco, CA, USA, 2015. [Google Scholar]
- Mohamed, M.; Anandan, S.; Huo, Z.; Birman, V.; Volz, J.; Chandrashekhara, K. Manufacturing and characterization of polyurethane based sandwich composite structures. Compos. Struct. 2015, 123, 169–179. [Google Scholar] [CrossRef]
- Altenbach, H. Mechanics of advanced materials for lightweight structures. J. Mech. Eng. Sci. 2011, 225, 2481–2496. [Google Scholar] [CrossRef]
- Roozen, N.B.; Leclère, Q.; Ege, K.; Gerges, Y. Estimation of plate material properties by means of a complex wavenumber fit using Hankel’s functions and the image source method. J. Sound Vib. 2017, 390, 257–271. [Google Scholar] [CrossRef]
- Shahdin, A.; Morlier, J.; Gourinat, Y.; Mezeix, L.; Bouvet, C. Fabrication and Mechanical Testing of a New Sandwich Structure with Carbon Fiber Network Core. J. Sandw. Struct. Mater. 2010, 12, 569–589. [Google Scholar] [CrossRef]
- Tang, Z.; Zha, X.; Zu, D. Bending properties of steel faced sandwich composite panels with phenolic foam cores. J. Reinf. Plast. Comp. 2016, 35, 834–852. [Google Scholar] [CrossRef]
- Neri, M.; Pilotelli, M. Data on temperature-time curves measured at chimney-roof penetration. Data Brief 2018, 20, 306–315. [Google Scholar] [CrossRef] [PubMed]
- D’Alessandro, V.; Petrone, G.; Franco, F.; De Rosa, S. A review of the vibroacoustics of sandwich panels: Models and experiments. J. Sandw. Struct. Mater. 2013, 15, 541–582. [Google Scholar] [CrossRef]
- Ghinet, S.; Atalla, N. Vibro-acoustic behaviors of flat sandwich composite panels. Trans. Can. Soc. Mech. Eng. 2006, 30, 473–493. [Google Scholar] [CrossRef]
- Tronchin, L. Modal analysis and intensity of acoustic radiation of the kettledrum. J. Acoust. Soc. Am. 2005, 117, 926–933. [Google Scholar] [CrossRef] [PubMed]
- Roozen, N.B.; Labelle, L.; Leclère, Q.; Ege, K.; Alvarado, S. Non-contact experimental assessment of apparent dynamic stiffness of constrained-layer damping sandwich plates in a broad frequency range using a Nd:YAG pump laser and a laser Doppler vibrometer. J. Sound Vib. 2017, 395, 90–101. [Google Scholar] [CrossRef] [Green Version]
- Mayr, A.R.; Gibbs, B.M. Point and transfer mobility of point-connected ribbed plates. J. Sound Vib. 2011, 330, 4798–4812. [Google Scholar] [CrossRef]
- Garrido, M.; Correia, J.R.; Keller, T. Effects of elevated temperature on the shear response of PET and PUR foams used in composite sandwich panels. Constr. Build. Mater. 2015, 76, 150–157. [Google Scholar] [CrossRef]
- Kim, M.; Choe, J.; Lee, D.G. Development of the fire-retardant sandwich structure using an aramid/glass hybrid composite and a phenolic foam-filled honeycomb. Compos. Struct. 2016, 158, 227–234. [Google Scholar] [CrossRef]
- Densley Tingley, D.; Hathway, A.; Davison, B.; Allwood, D. The environmental impact of phenolic foam insulation boards. Proc. Inst. Civ. Eng. Constr. Mater. 2017, 170, 91–103. [Google Scholar] [CrossRef]
- Roberts, M.W. Finishing the job: The Montreal Protocol moves to phase down hydrofluorocarbons. Rev. Eur. Compar. Int. Environ. Law 2017, 26, 220–230. [Google Scholar] [CrossRef]
- Nilsson, E.; Nilsson, A.C. Prediction and measurement of some dynamic properties of sandwich structures with honeycomb and foam cores. J. Sound Vib. 2002, 251, 409–430. [Google Scholar] [CrossRef]
- Piana, E.A.; Petrogalli, C.; Paderno, D.; Carlsson, U. Application of the wave propagation approach to sandwich structures: Vibro-acoustic properties of aluminum honeycomb materials. Appl. Sci. Basel 2018, 8, 45. [Google Scholar] [CrossRef]
- Ruggeri, P.; Peron, F.; Granzotto, N.; Bonfiglio, P. A Combined Experimental and Analytical Approach for the Simulation of the Sound Transmission Loss of Multilayer Glazing Systems. Build. Acoust. 2015, 22, 16. [Google Scholar] [CrossRef]
- Scamoni, F.; Piana, E.A.; Scrosati, C. Experimental evaluation of the sound absorption and insulation of an innovative coating through different testing methods. Build. Acoust. 2017, 24, 173–191. [Google Scholar] [CrossRef] [Green Version]
- Santoni, A.; Bonfiglio, P.; Mollica, F.; Fausti, P.; Pompoli, F.; Mazzanti, V. Vibro-acoustic optimisation of Wood Plastic Composite systems. Constr. Build. Mater. 2018, 174, 730–740. [Google Scholar] [CrossRef]
- Piana, E.A.; Marchesini, A. How to lower the noise level in the owner’s cabin of a yacht through the improvement of bulkhead and floor. In Proceedings of the 21st International Congress on Sound and Vibration, Beijing, China, 13–17 July 2014; IIAV: Beijing, China, 2014; Volume 5, pp. 3692–3699. [Google Scholar]
- Ichchou, M.N.; Bareille, O.; Berthaut, J. Identification of effective sandwich structural properties via an inverse wave approach. Eng. Struct. 2008, 30, 2591–2604. [Google Scholar] [CrossRef]
- de Rijk, S.; Nijman, E. Equivalent material modelling of sandwich beams, evanescent solutions and damping investigations. J. Sound Vib. 2016, 382, 291–309. [Google Scholar] [CrossRef]
- Cremer, L.; Heckl, M.; Petersson, B.A.T. Structure-Borne Sound: Structural Vibrations and Sound Radiation at Audio Frequencies, 3rd ed.; Springer: Berlin/Heidelberg, Germany, 2005; ISBN 978-3-540-22696-3. [Google Scholar]
- Sharp, B.H. Prediction methods for the sound transmission of building elements. Noise Control Eng. 1978, 11, 53–63. [Google Scholar] [CrossRef]
- Leclère, Q.; Roozen, N.B.; Sandier, C. On the use of the Hs estimator for the experimental assessment of transmissibility matrices. Mech. Syst. Signal P Process. 2014, 43, 237–245. [Google Scholar] [CrossRef] [Green Version]
- Nilsson, A.; Liu, B. Vibro-Acoustics, Volume 2, 2nd ed.; Springer: Berlin/Heidelberg, Germany, 2016; ISBN 978-3-662-47933-9. [Google Scholar]
- Nentwich, F.; Fuchs, A. Acoustic behavior of sandwich plates. J. Sandw. Struct. Mater. 2015, 17, 183–213. [Google Scholar] [CrossRef]
- Ege, K.; Roozen, N.B.; Leclère, Q.; Rinaldi, R.G. Assessment of the apparent bending stiffness and damping of multilayer plates; modelling and experiment. J. Sound Vib. 2018, 426, 129–149. [Google Scholar] [CrossRef] [Green Version]
- Oldenbo, M.; Mattsson, D.; Varna, J.; Berglund, L.A. Global Stiffness of a SMC Panel Considering Process Induced Fiber Orientation. J. Reinf. Plast. Comp. 2004, 23, 37–49. [Google Scholar] [CrossRef] [Green Version]
- Piana, E.A.; Milani, P.; Granzotto, N. Simple method to determine the transmission loss of gypsum panels. In Proceedings of the 21st International Congress on Sound and Vibration, Beijing, China, 13–17 July 2014; IIAV: Beijing, China, 2014; Volume 5, pp. 3700–3706. [Google Scholar]
- Santoni, A.; Schoenwald, S.; Van Damme, B.; Fausti, P. Determination of the elastic and stiffness characteristics of cross-laminated timber plates from flexural wave velocity measurements. J. Sound Vib. 2017, 400, 387–401. [Google Scholar] [CrossRef]
- Bies, D.A.; Hansen, C.H. Engineering Noise Control: Theory and Practice, 4th ed.; CRC Press: London, UK; New York, NY, USA, 2009; ISBN 978-0-415-48706-1. [Google Scholar]
- Piana, E.A.; Petrogalli, C.; Solazzi, L. Dynamic and acoustic properties of a joisted floor. In Proceedings of the SIMULTECH 2016—6th International Conference on Simulation and Modeling Methodologies, Technologies and Applications, Lisbon, Portugal, 29–31 July 2016; Obaidat, M.S., Merkuryev, Y., Oren, T., Eds.; SciTePress: Lisbon, Portugal, 2016; pp. 277–282. [Google Scholar]
- Piana, E.A. A method for determining the sound reduction index of precast panels based on point mobility measurements. Appl. Acoust. 2016, 110, 72–80. [Google Scholar] [CrossRef]
- Nilsson, A.; Baro, S.; Piana, E.A. Vibro-acoustic properties of sandwich structures. Appl. Acoust. 2018, 139, 259–266. [Google Scholar] [CrossRef] [Green Version]
- Nilsson, A.; Liu, B. Vibro-Acoustics, Volume 1, 2nd ed.; Springer: Berlin/Heidelberg, Germany, 2015; ISBN 978-3-662-47806-6. [Google Scholar]
- Santoni, A.; Schoenwald, S.; Fausti, P.; Tröbs, H.-M. Modelling the radiation efficiency of orthotropic cross-laminated timber plates with simply-supported boundaries. Appl. Acoust. 2019, 143, 112–124. [Google Scholar] [CrossRef]
- Leppington, F.G.; Heron, K.H.; Broadbent, E.G.; Mead, S.M. Resonant and Non-Resonant Acoustic Properties of Elastic Panels. II. The Transmission Problem. Proc. R. Soc. A-Math. Phsy. 1987, 412, 309–337. [Google Scholar] [CrossRef]
- Hopkins, C. Sound Insulation, 1st ed.; A Butterworth-Heinemann Title: Amsterdam, The Netherlands, 2007; ISBN 978-0-7506-6526-1. [Google Scholar]
Figure 1.
(a) Example of a standard closed-cell phenolic foam. (b) Sample of the investigated open-cell phenolic foam.
Figure 1.
(a) Example of a standard closed-cell phenolic foam. (b) Sample of the investigated open-cell phenolic foam.

Figure 2.
Sandwich beam with foam core: geometric and mechanical characteristics.
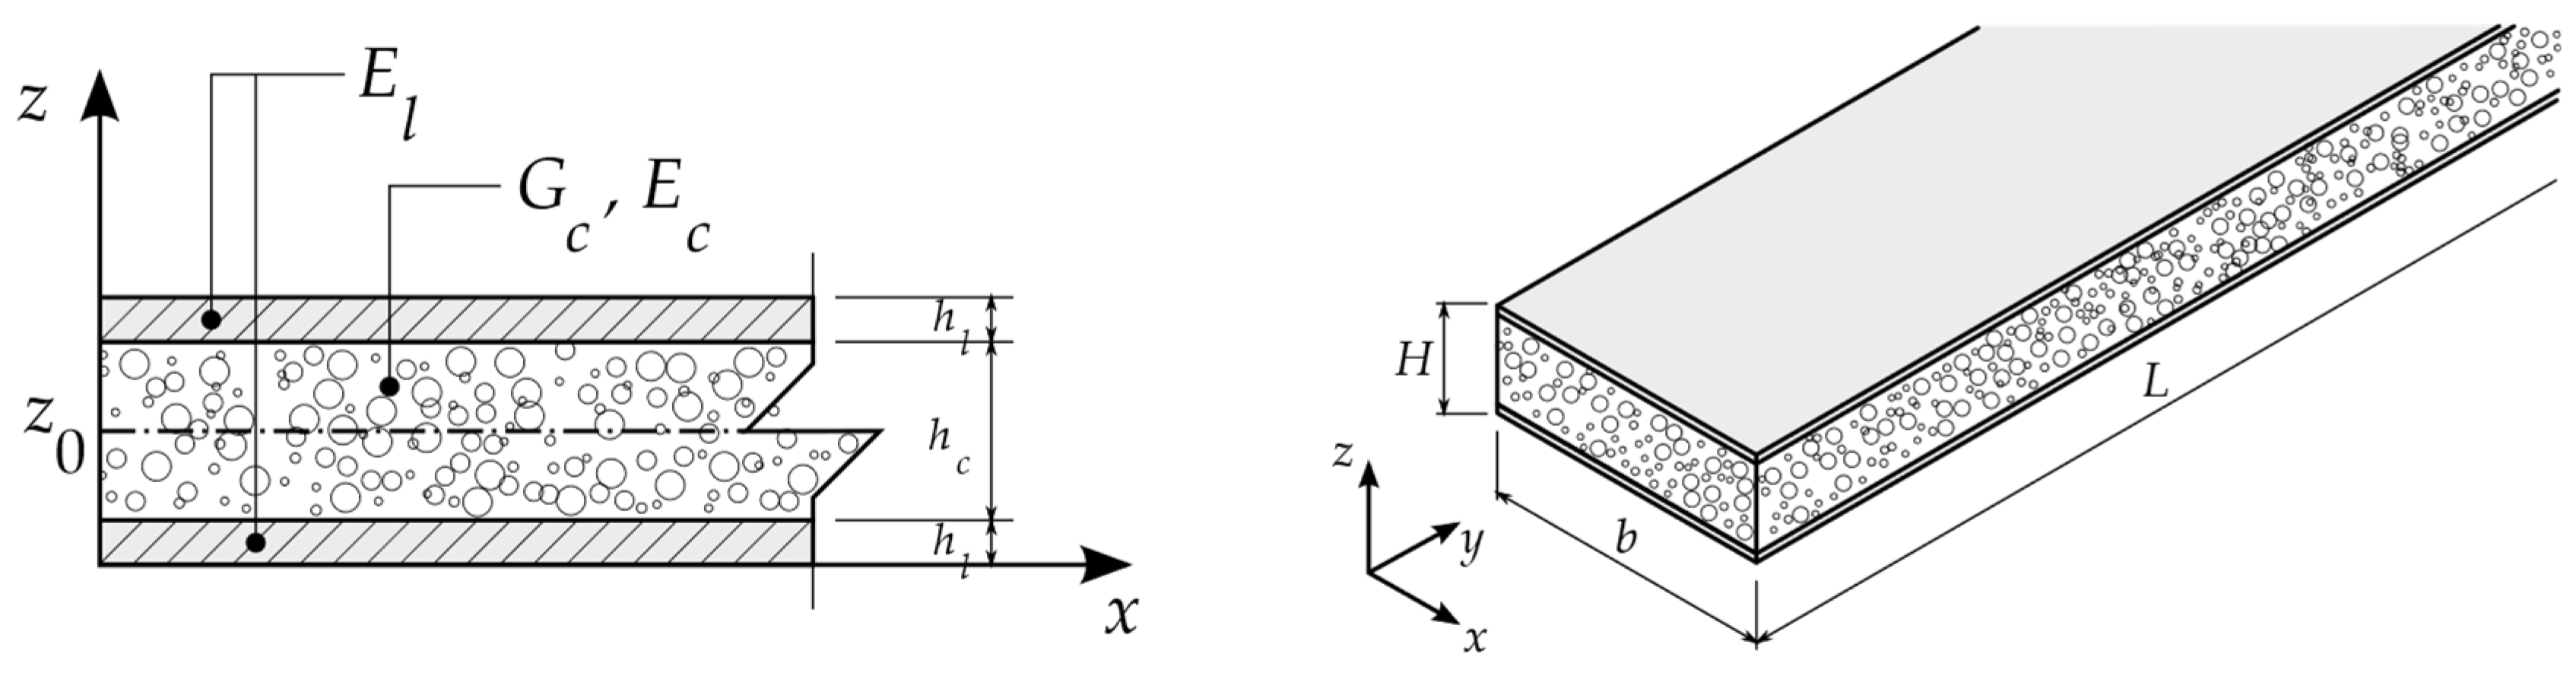
Figure 3.
Setup of the beam and sensors required for the determination of the natural frequencies.

Figure 4.
Outline of the beams cut from a sandwich panel in orthogonal directions.

Figure 5.
Size of the panel mounted in the opening dividing the two reverberation rooms. The yellow dashed lines indicate the PRG layers used to assemble the panel. All dimensions in millimeters.
Figure 5.
Size of the panel mounted in the opening dividing the two reverberation rooms. The yellow dashed lines indicate the PRG layers used to assemble the panel. All dimensions in millimeters.
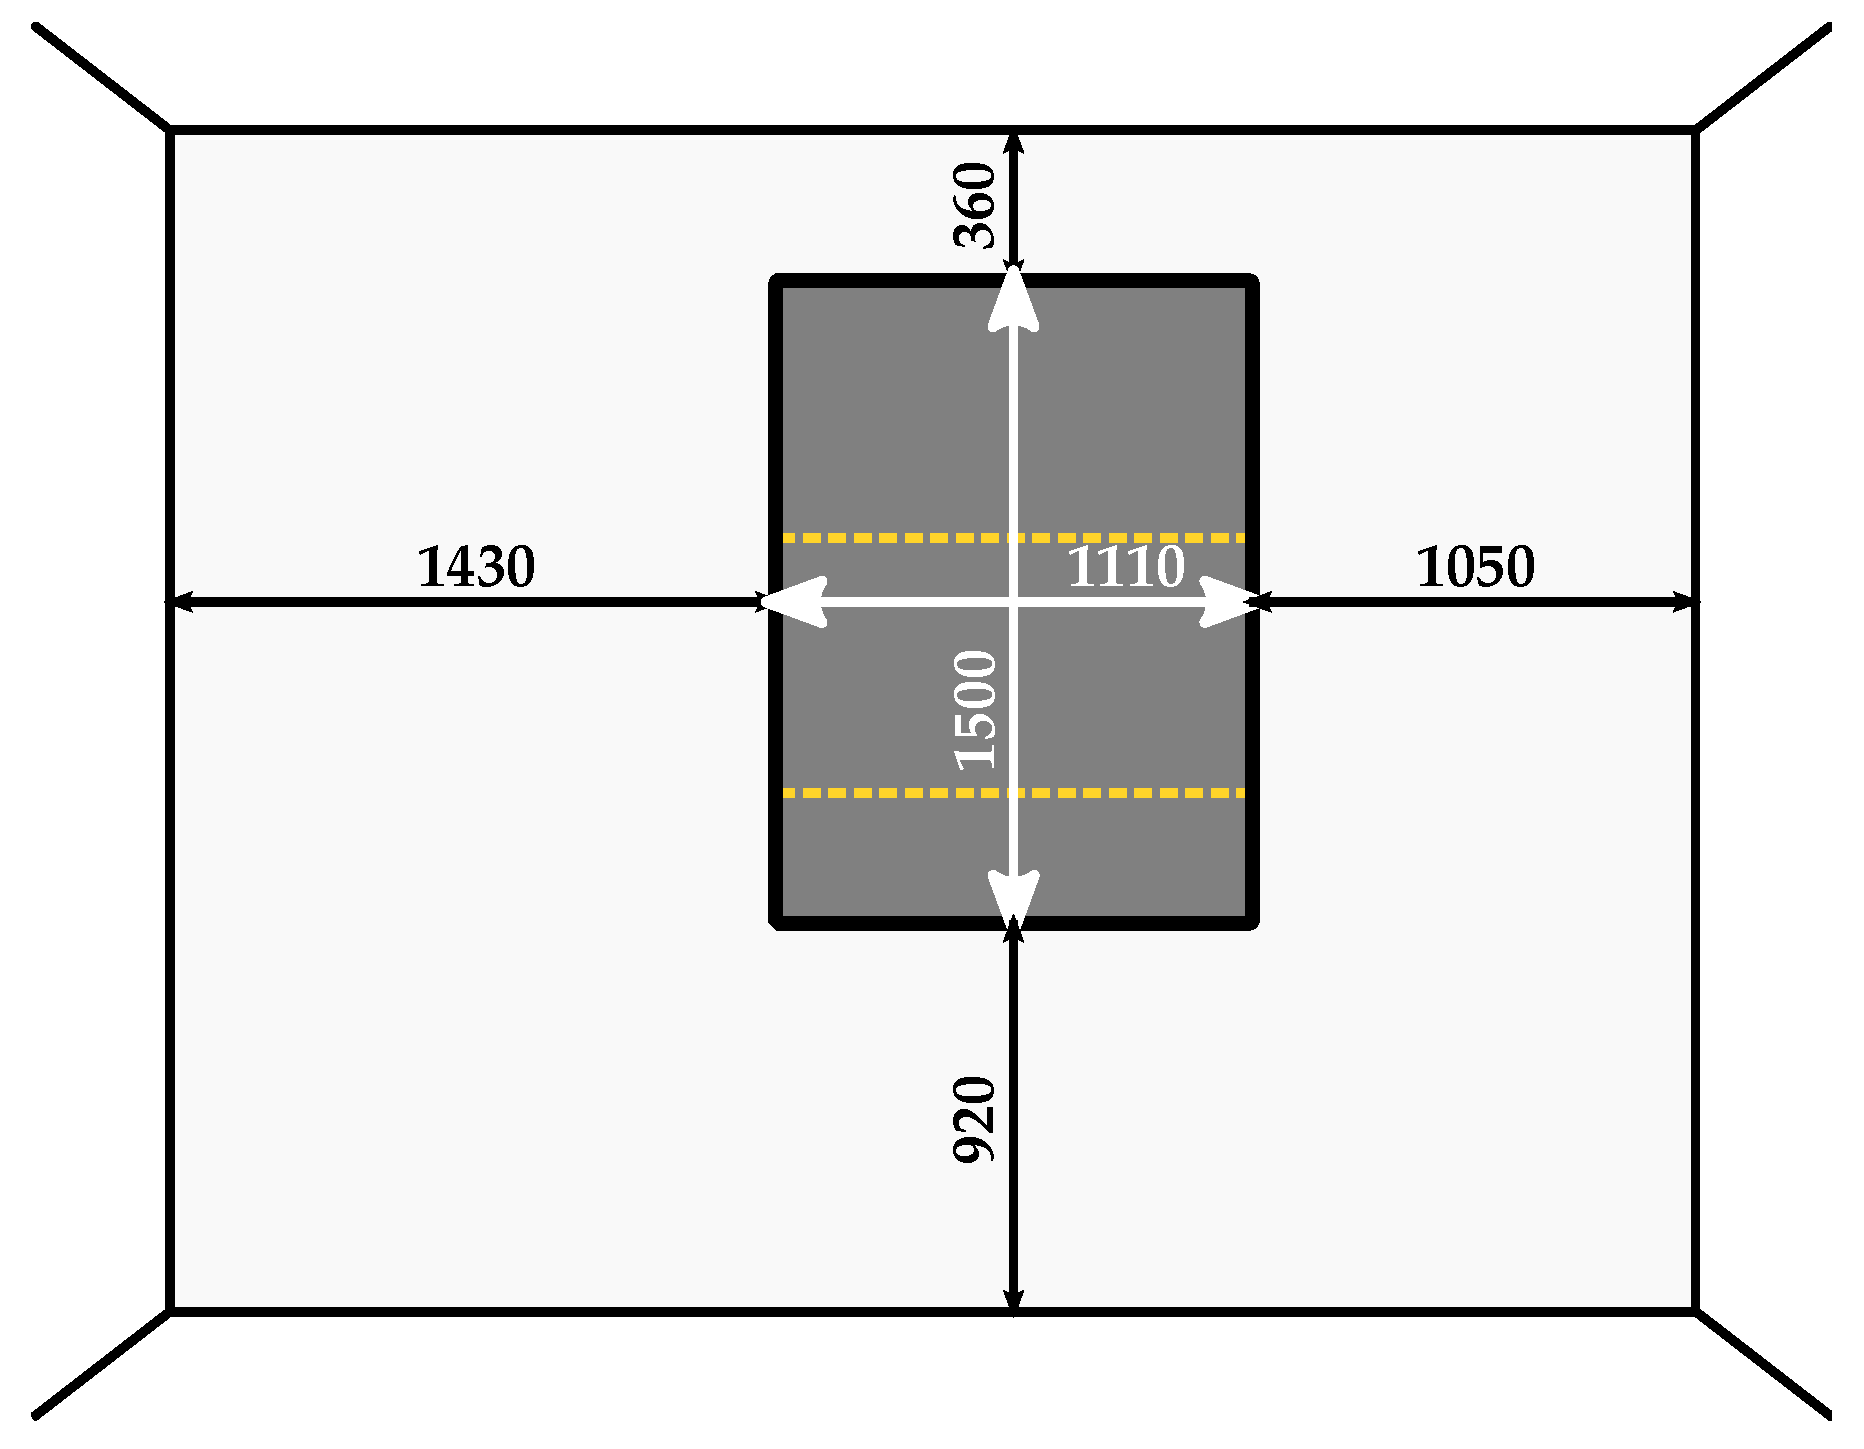
Figure 6.
Apparent bending stiffness per unit width of the sandwich panel (solid line) obtained from the experimentally-determined bending stiffnesses in the x-direction (circle markers) and in the y-direction (asterisk markers).
Figure 6.
Apparent bending stiffness per unit width of the sandwich panel (solid line) obtained from the experimentally-determined bending stiffnesses in the x-direction (circle markers) and in the y-direction (asterisk markers).
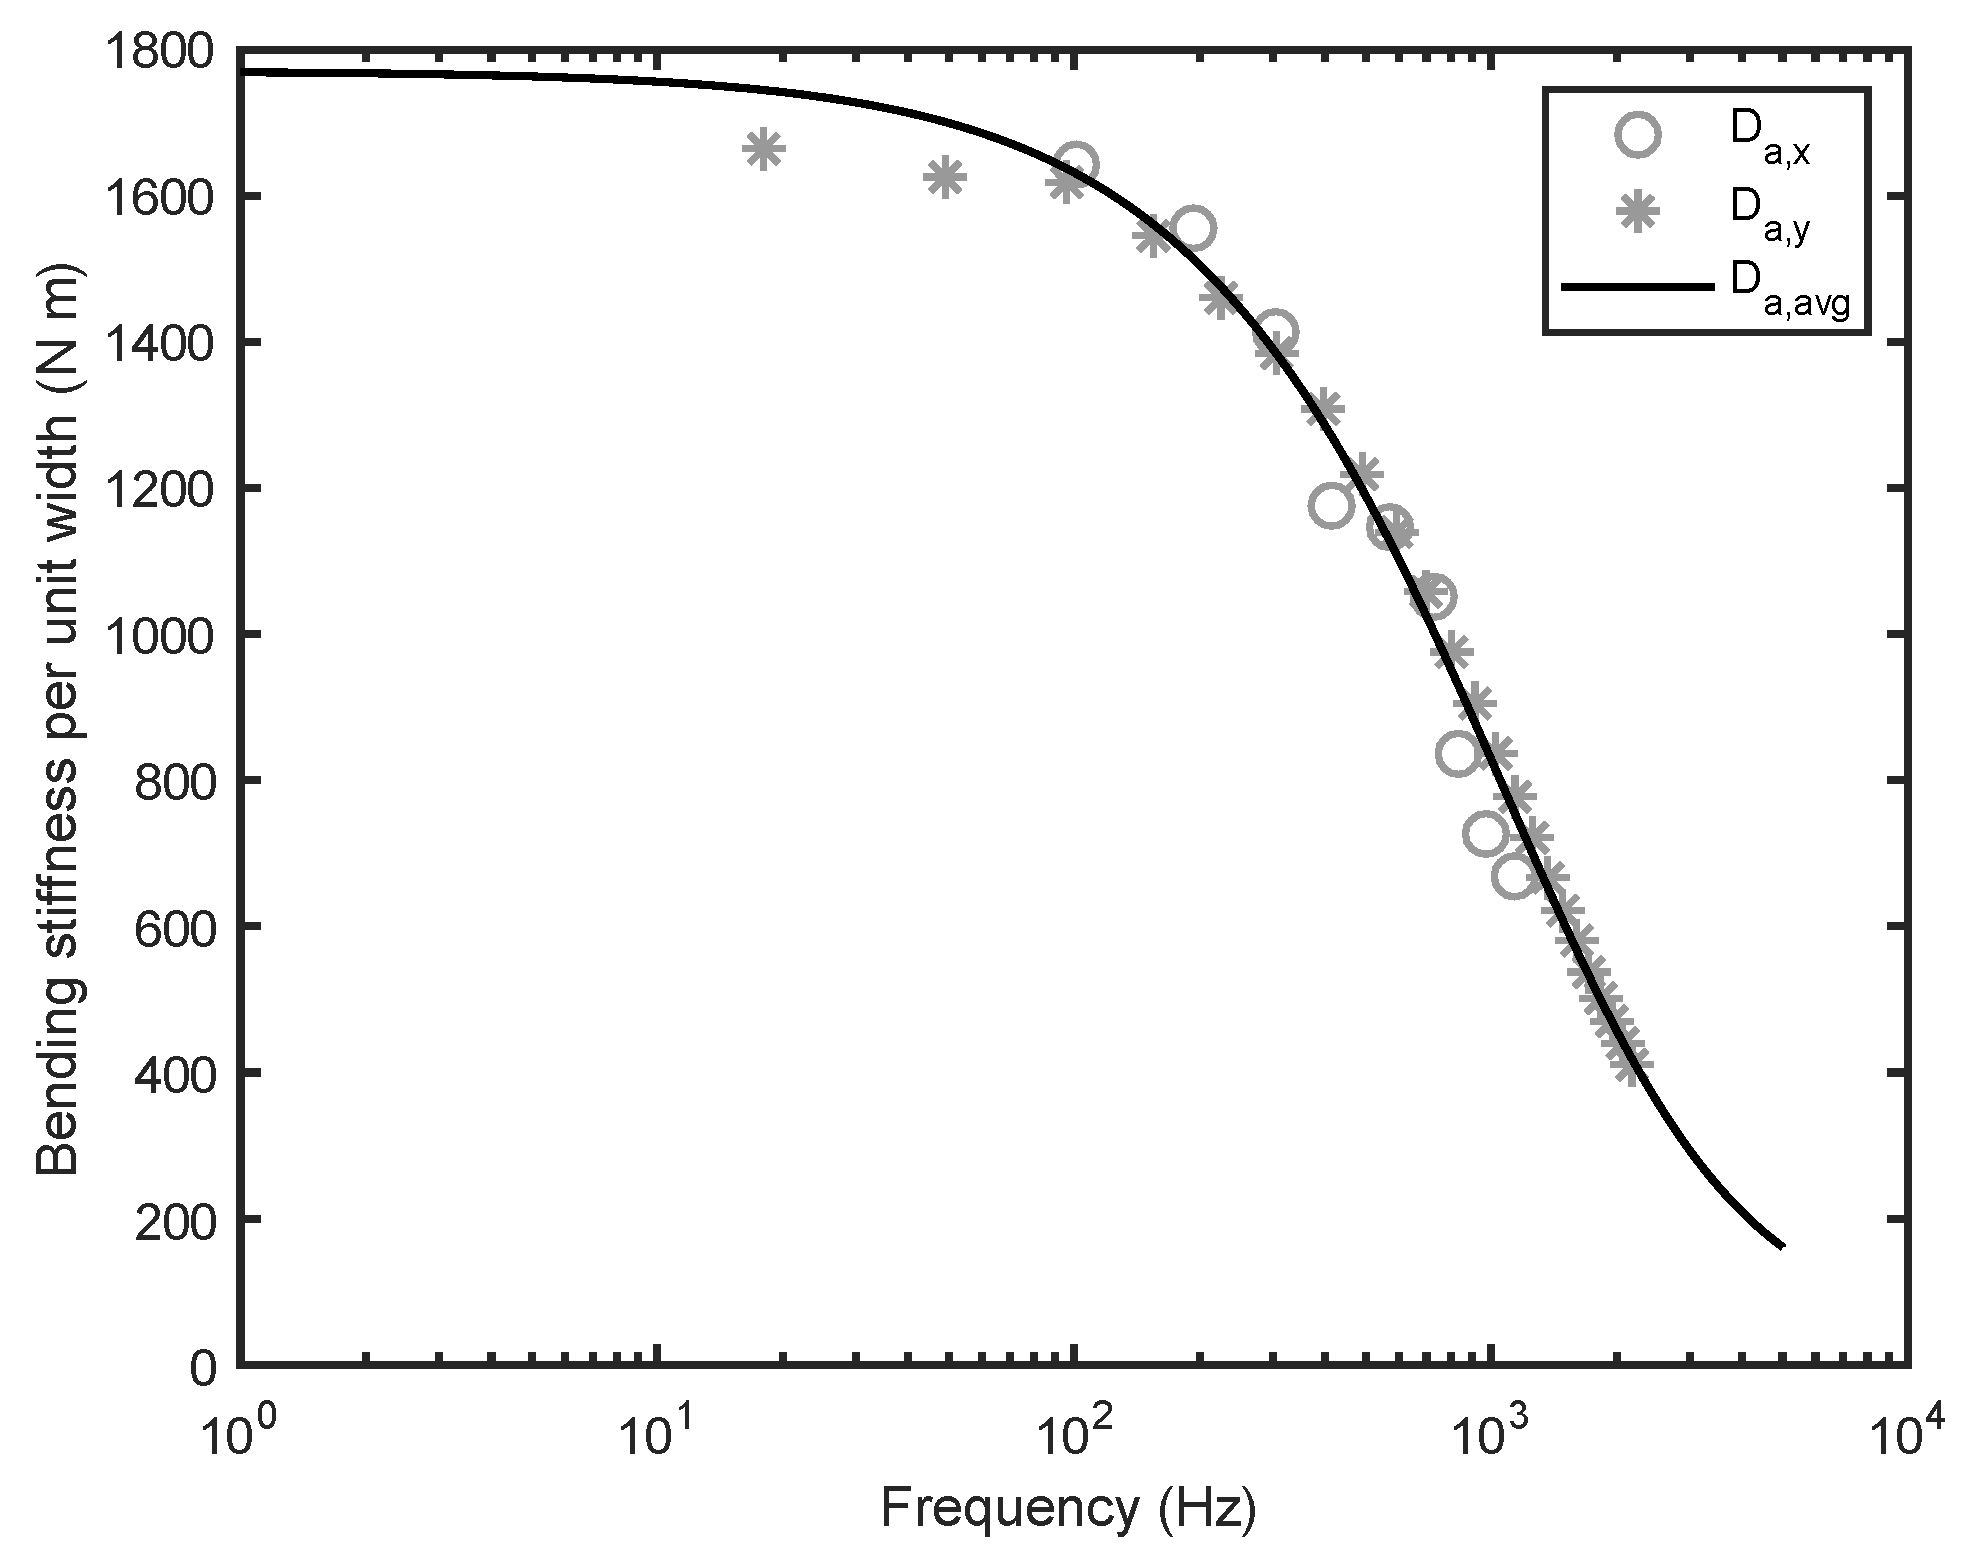
Figure 7.
Determination of the loss factor. (a) Measurement positions over the panel tested in reverberation rooms. (b) Resulting loss factor as a function of frequency.
Figure 7.
Determination of the loss factor. (a) Measurement positions over the panel tested in reverberation rooms. (b) Resulting loss factor as a function of frequency.
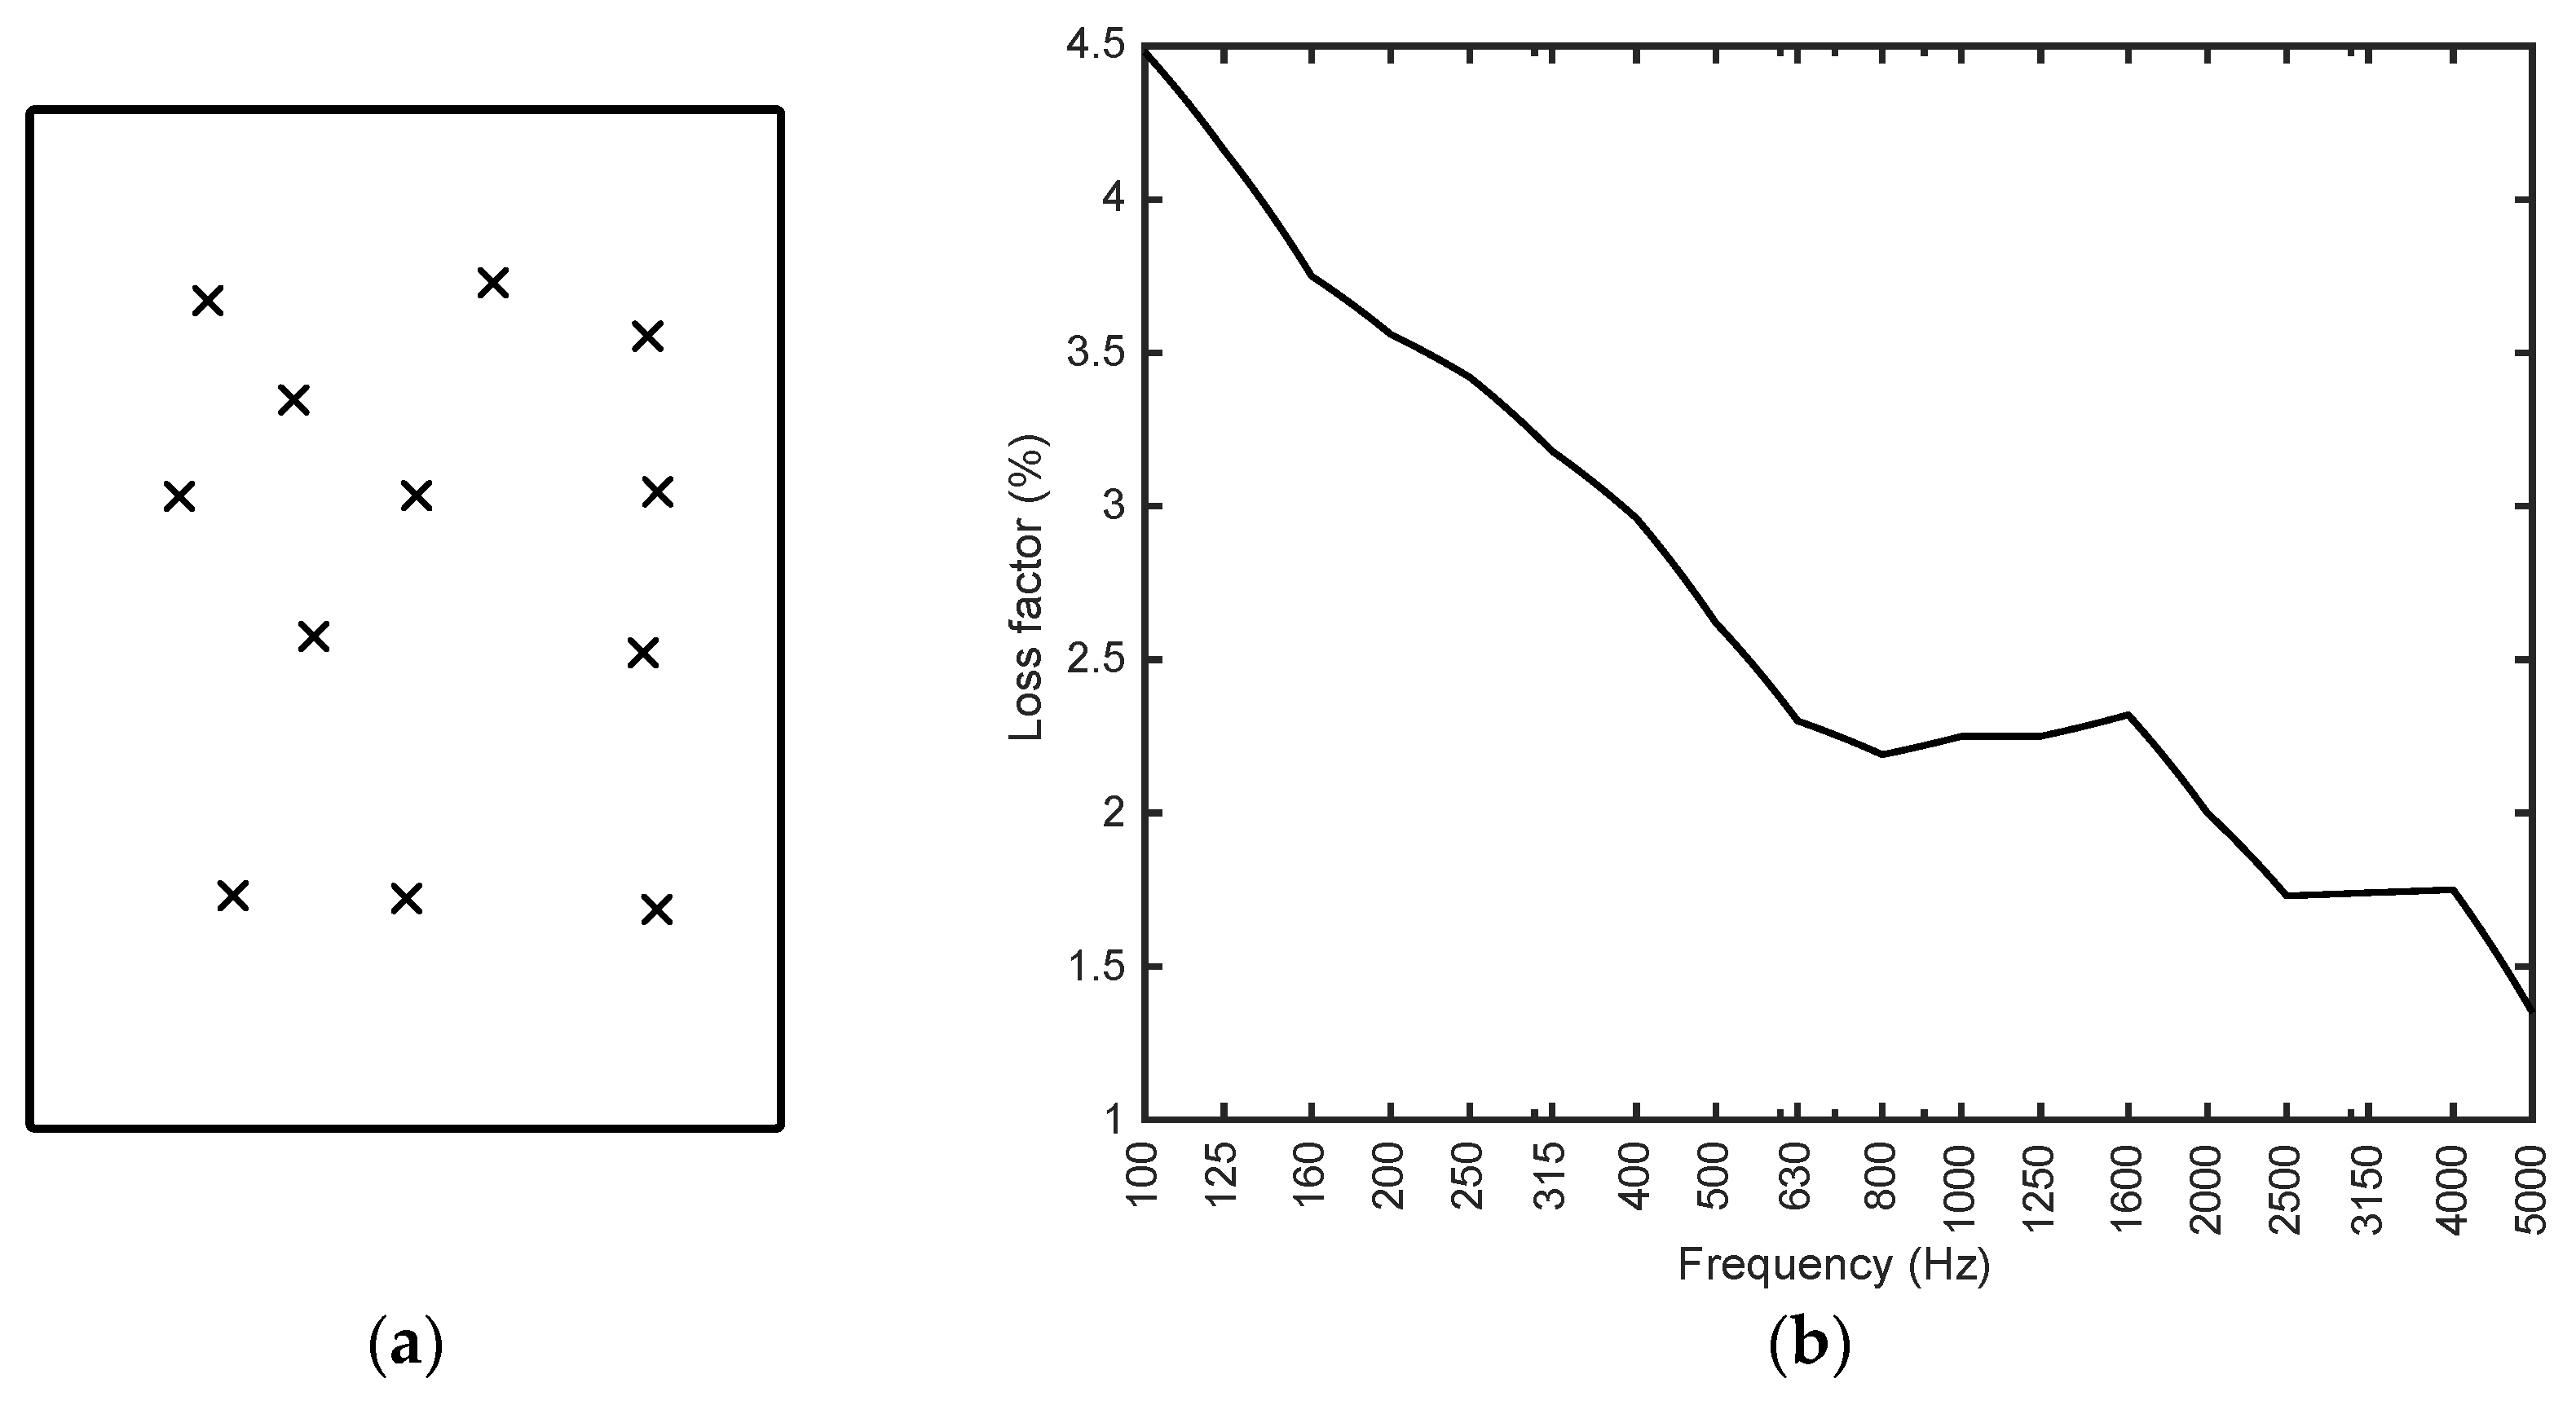
Figure 8.
Comparison of one-third octave bands STL curves. Solid line: predicted values. Dotted line: measurements to ISO 10140-2. Dashed line: STL calculated from non-resonant sound transmission coefficient, limit integration angle = 84°.
Figure 8.
Comparison of one-third octave bands STL curves. Solid line: predicted values. Dotted line: measurements to ISO 10140-2. Dashed line: STL calculated from non-resonant sound transmission coefficient, limit integration angle = 84°.

Figure 9.
(a) Measured frequency response function for the homogeneous phenolic foam beam. (b) Resulting Young’s modulus (circle markers: results from Equation (13); solid line: average value).
Figure 9.
(a) Measured frequency response function for the homogeneous phenolic foam beam. (b) Resulting Young’s modulus (circle markers: results from Equation (13); solid line: average value).

Figure 10.
STL predicted by calculating A, B and C coefficients from the nominal characteristics of the sandwich constituent layers (solid line). Dashed line: STL predicted by dynamic tests (A, B, and C obtained by the least squares method).
Figure 10.
STL predicted by calculating A, B and C coefficients from the nominal characteristics of the sandwich constituent layers (solid line). Dashed line: STL predicted by dynamic tests (A, B, and C obtained by the least squares method).

Figure 11.
Sandwich materials samples. In the sandwich structure, the additional glue “layer” at the interface between each laminate and the core is visible.
Figure 11.
Sandwich materials samples. In the sandwich structure, the additional glue “layer” at the interface between each laminate and the core is visible.
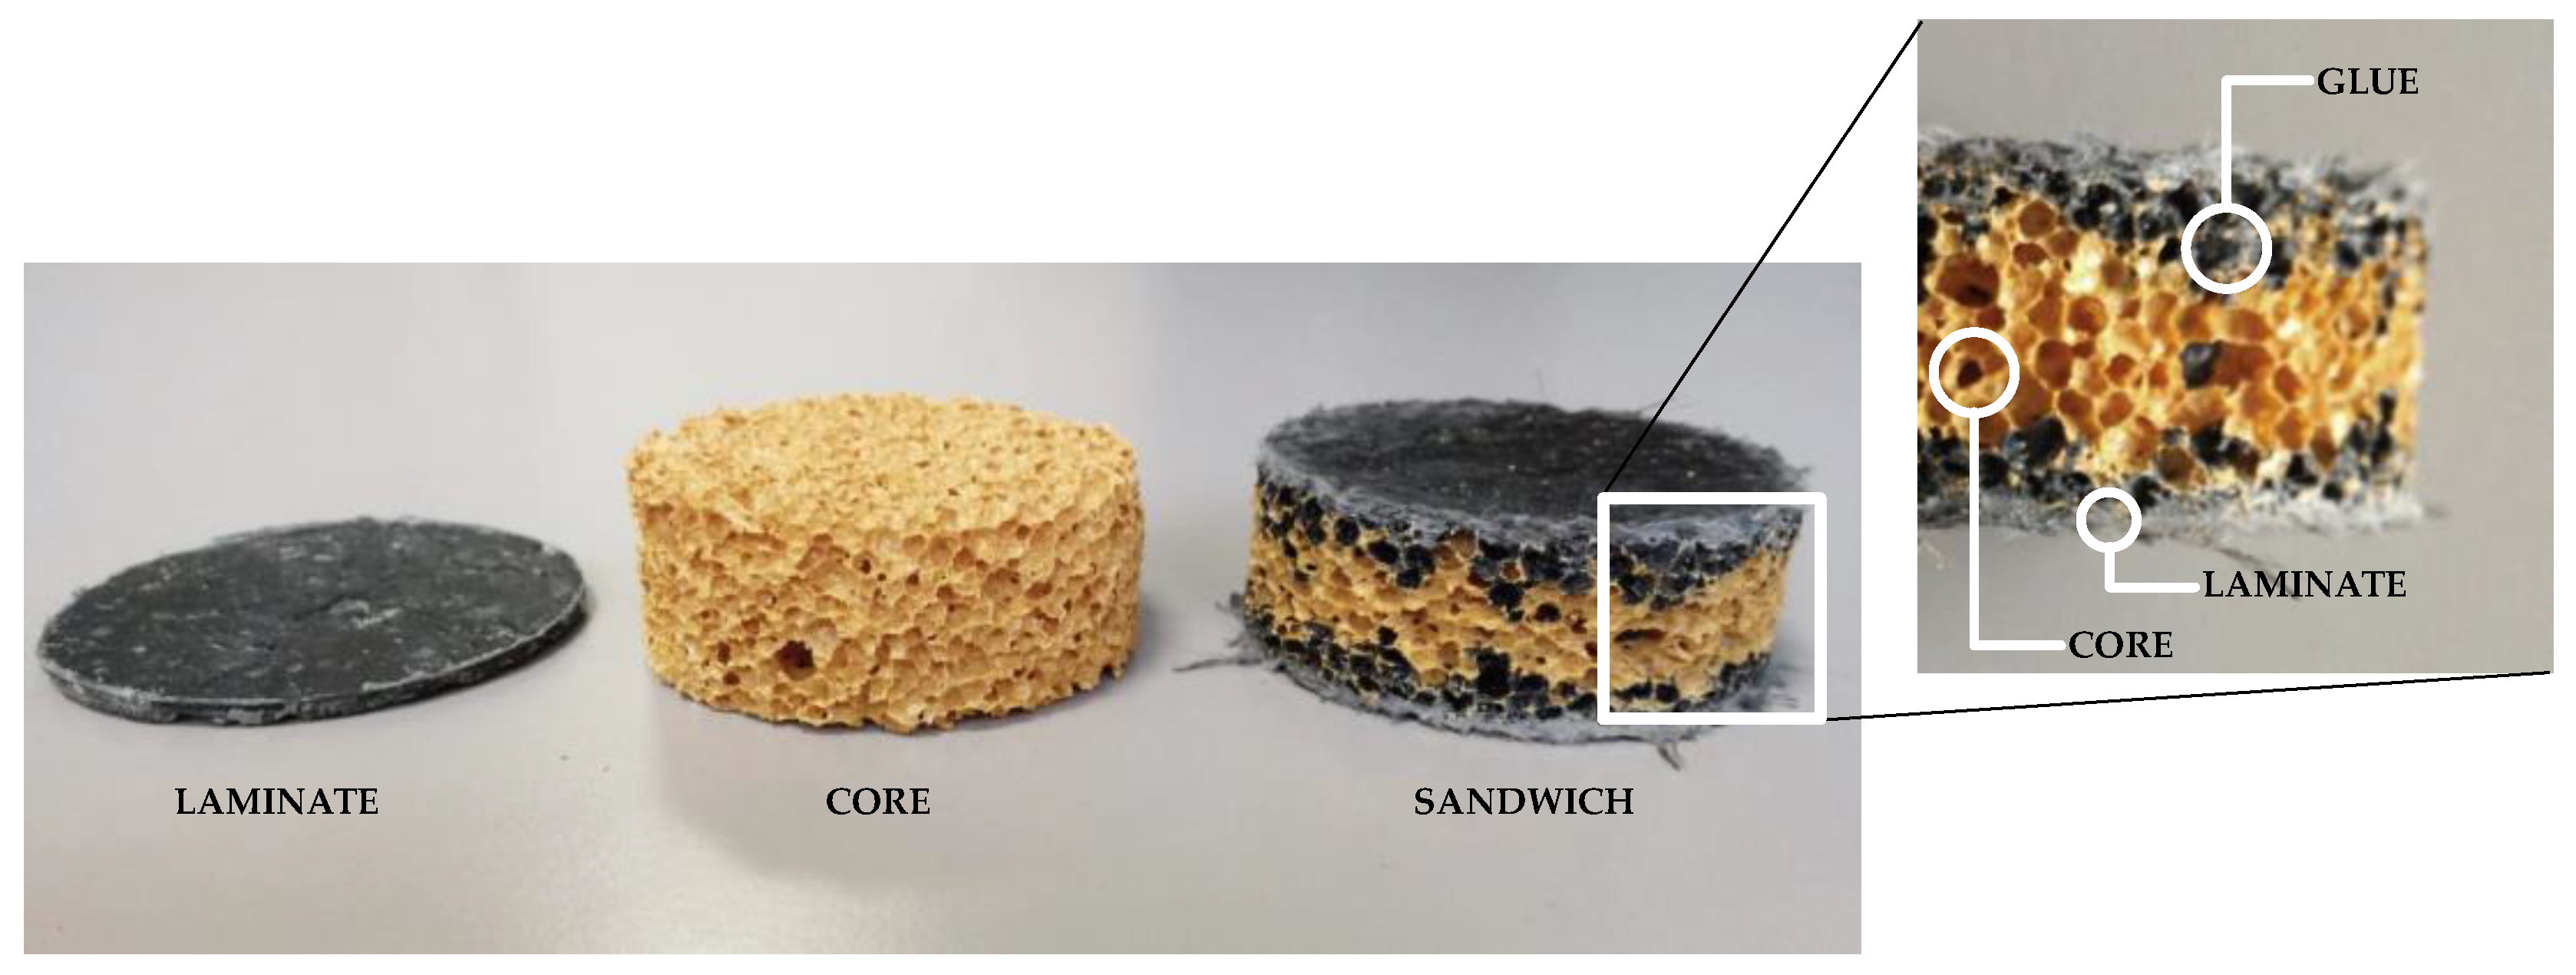
Figure 12.
STL predicted by calculating A, B, and C coefficients from the corrected characteristics of the sandwich constituent layers (solid line). Dashed line: STL predicted by dynamic tests (A, B, and C obtained by the least squares method).
Figure 12.
STL predicted by calculating A, B, and C coefficients from the corrected characteristics of the sandwich constituent layers (solid line). Dashed line: STL predicted by dynamic tests (A, B, and C obtained by the least squares method).


Table 1.
Values of αn for the nth mode–free-free boundary conditions.
| n | 1 | 2 | 3 | 4 | ≥5 |
|---|---|---|---|---|---|
| αn | 4.73 | 7.85 | 11.0 | 14.14 | nπ + π/2 |
Table 2.
Characteristics of the beams used for the dynamic tests.
| Characteristic | Homogeneous Beam | Sandwich Beam, x Direction | Sandwich Beam, y Direction |
|---|---|---|---|
| Length L (m) | 1.176 | 1.166 | 1.666 |
| Core thickness hc (m) | 0.017 | 0.017 | 0.017 |
| Laminate thickness hl (m) | - | 0.0015 | 0.0015 |
| Width b (m) | 0.05 | 0.05 | 0.05 |
| Mass per unit area μ (kg m−2) | 3.02 | 8.38 | 8.45 |
| Young’s modulus of the laminates El (MPa) | - | 9000 | 9000 |
Table 3.
Characteristics of the panel tested in reverberation rooms.
| Characteristic | Value |
|---|---|
| Free test opening H × L (m) | 1.500 × 1.110 |
| Panel size H × L (m) | 1.490 × 1.110 |
| Core thickness hc (m) | 0.017 |
| Laminate thickness hl (m) | 0.0015 |
| Mass per unit area μ (kg m−2) | 8.45 |
| Young’s modulus of the laminates El (MPa) | 9000 |
© 2019 by the authors. Licensee MDPI, Basel, Switzerland. This article is an open access article distributed under the terms and conditions of the Creative Commons Attribution (CC BY) license (http://creativecommons.org/licenses/by/4.0/).
Share and Cite
MDPI and ACS Style
Fortini, M.; Granzotto, N.; Piana, E.A. Vibro-Acoustic Characterization of a Composite Structure Featuring an Innovative Phenolic Foam Core. Appl. Sci. 2019, 9, 1276. https://doi.org/10.3390/app9071276
AMA Style
Fortini M, Granzotto N, Piana EA. Vibro-Acoustic Characterization of a Composite Structure Featuring an Innovative Phenolic Foam Core. Applied Sciences. 2019; 9(7):1276. https://doi.org/10.3390/app9071276
Chicago/Turabian StyleFortini, Massimo, Nicola Granzotto, and Edoardo Alessio Piana. 2019. "Vibro-Acoustic Characterization of a Composite Structure Featuring an Innovative Phenolic Foam Core" Applied Sciences 9, no. 7: 1276. https://doi.org/10.3390/app9071276
Note that from the first issue of 2016, this journal uses article numbers instead of page numbers. See further details here.