Signal Strength Enhancement of Magnetostrictive Patch Transducers for Guided Wave Inspection by Magnetic Circuit Optimization


1
State Key Laboratory of Fluid Power and Mechatronic Systems, School of Mechanical Engineering, Zhejiang University, 38 Zheda Road, Hangzhou 310027, China
2
Institute of Advanced Digital Technologies and Instrumentation, School of Biomedical Engineering and Instrument Science, Zhejiang University, 38 Zheda Road, Hangzhou 310027, China
*
Author to whom correspondence should be addressed.
Appl. Sci. 2019, 9(7), 1477; https://doi.org/10.3390/app9071477
Submission received: 16 March 2019
/
Revised: 2 April 2019
/
Accepted: 4 April 2019
/
Published: 9 April 2019
(This article belongs to the Special Issue Ultrasonic Guided Waves)
Abstract
:Featured Application
Signal strength enhancement of the magnetostrictive patch transducer, which can be used as an element of a phase array or scanner in pipe and plate inspection.
Abstract
Magnetostrictive patch transducers (MPT) with planar coils are ideal candidates for shear mode generation and detection in pipe and plate inspection with the advantages of flexibility, lightness and good directivity. However, the low energy conversion efficiency limits the application of the MPT in long distance inspection. In this article, a method for the enhancement of the MPT was proposed by dynamic magnetic field optimization using a soft magnetic patch (SMP). The SMP can reduce the magnetic resistance of the magnetic circuit, which increases the dynamic magnetic field intensity in the magnetostrictive patch during wave generation and restricts the induced dynamic magnetic field within the area around the coils for sensing during wave detection. Numerical simulations carried out at different frequencies verified the improvement of the dynamic magnetic fields by the SMP and influence of different affecting factors. The experimental validations of the signal enhancement in wave generation and detection were performed in an aluminum plate. The amplitude magnification could reach 12.7 dB when the MPTs were covered by the SMPs. Based on the numerical and experimental results, the SMP with a large relative permeability and thickness and close fitting between the SMP and coils were recommended when other application conditions were met.
1. Introduction
Guided waves, which are ultrasonic waves restricted by the boundaries of the solid waveguide during propagation [1], have been applied in the inspection of many industrial structures, such as pipes [2,3], rods [4], plates [5,6,7] and rails [8,9,10] with the advantages of long distance, full coverage and low cost [11]. The conversions between the electrical energy and mechanical energy are mainly involved in guide wave inspection, which are accomplished by the transducers as the key parts in the inspection system. Transducers with various characteristics, including vibration directions, frequency bandwidths and sizes, are generally customized to satisfy the demands under different conditions. Based on the physical effects, the guided wave transducers can be categorized into different types, including electromagnetic acoustic transducers (EMAT), laser transducers, piezoelectric transducers (PZT) and magnetostrictive transducers. The EMATs are able to work without contacting the waveguide using the Lorentz force [11,12] although their applications are limited due to the low conversion efficiency, inapplicability for non-metal waveguides and signal instability caused by the coil vibration. The laser can be used to generate guided waves in a contactless manner based on the thermoelastic effect. However, the high power laser may burn the spot in the waveguide and the generated waves normally have very high frequencies (several MHz). With the high price, the inspection system with laser transducers still remain in laboratories without being widely used so far [13,14]. The magnetostrictive transducers and PZTs are widely used at a low cost and with satisfactory performance [15]. The magnetostrictive transducers can be made into small patches, which are flexible and light for different conditions [16]. Compared with the PZTs, they have the advantages of good durability, low requirement in coupling, low cost and superiority in shear vibration generation. For the inspection of ferromagnetic materials, the magnetostrictive transducers can also be used without contact [17].
The dimensions of the ferromagnetic materials change during the process of magnetization and their magnetic state varies when external stress is applied to them. These effects are from the properties of ferromagnetic materials, which are called the magnetostrictive effect (Joule effect) and inverse magnetostrictive effect (Villari effect), respectively. These effects can be explained with magnetic domain theory [18]. The magnetostrictive effect works in the generation of guided waves while the inverse effect accounts for the measurement [19]. Many studies have been carried out for the improvement of energy conversion, directivity and mode selection since the first application of the magnetostriction in guided wave inspection. In early studies, the magnetostriction () of the ferromagnetic waveguide was used to generate guided waves [20]. This method still works in cable inspections [21,22]. However, the magnetostriction of these ferromagnetic waveguides, which are commonly made of iron ( = 14 ppm), are very small and thus, the patches and strips made of materials with a large magnetostriction, such as Ni ( = −50 ppm), Co ( = −93 ppm) and Hiperco ( = 60~100 ppm), are coupled with the waveguide for wave generation and detection [23,24,25], which can also be used for non-ferromagnetic waveguides [26]. There has been research carried out on the application of giant magnetostrictive materials, such as Galfenol ( = 200~400 ppm) and Terfenol-D ( = 1500~2000 ppm) in guided wave inspection [27,28]. These materials have poor machinability and need large driving magnetic fields for an ideal performance. The undesirable temperature adaptability and high cost also restricts their applications in field tests. There are two magnetic fields named the static bias magnetic field and dynamic alternating field, which should be applied into the magnetostrictive patches during the wave generation. The bias magnetic field for the elimination of the frequency doubling effect can be provided by permanent magnets [29]. For pipe inspection, the bias magnetic field may be more utilized when the magnetostrictive patches are bonded with an angle of 45° to the longitudinal axis of the pipes, which can be improved further with the patches in the Z-shape or with V-shaped yokes [30,31]. For magnetostrictive materials with certain coercive forces (e.g., Hiperco), the bias magnetic field should be more uniform, which can be achieved by pre-magnetization [32]. A solenoid coil can also provide a strong bias magnetic field, but a large direct current is needed and the magnetostrictive strip needs to be manufactured with grooves for solenoid coils [33]. The dynamic magnetic field is normally provided by the coils. Figure 1 shows the common coils used in transducers with directivity. The figure of eight coil has a large energy conversion efficiency with multiple turns as well as the coil with a core [34]. However, a high system power is needed to drive these coils with large resistances and the directivities are not satisfactory. The transducers with these coils are too large for narrow spaces and cannot be deformed to match curving surfaces. Planar coils in the shape of meanders or racetracks have good directivities. They can be manufactured as flexible printed circuits (FPC), which are small, light and flexible. As a result, they can be used as scanners in pipe and plate inspections or elements in phased arrays. The distance between the adjacent wires in planar coils depends on the generation of the wavelength from the mode, resulting in the sparse arrangement of the wires. Furthermore, these coils work in open magnetic circuits with dynamic magnetic fields dispersed in the air [19]. These characteristics result in the relative low energy conversion efficiency of the MPT with planar coils, limiting their applications in long distance inspection.
In this paper, a method for the enhancement of the magnetostrictive patch transducer (MPT) with planar coils was proposed by the dynamic magnetic field optimization using a soft magnetic patch (SMP). In Section 2, the relationship between the magnetic fields and mechanical properties of the magnetostrictive materials is illustrated and the theoretical explanations of the improvement for the dynamic magnetic field are given based on the magnetic Ohm’s law. As described in Section 3, a 2D model of the transducer was built to verify the dynamic magnetic field improvement and to study the effect of different affecting factors, including the thickness, magnetic conductivity, lift-off distance of the SMP with the excitation currents and induced magnetic fields at different frequencies. Experimental investigations were carried out in an aluminum plate as described in Section 4 and the conclusions follow in Section 5.
2. Theory
2.1. Magnetostrictive Equation
In ferromagnetic materials, adjacent atoms construct magnetic domains spontaneously because of the forces caused by electron spins [18]. As shown in Figure 2, without external magnetic fields, the magnetic domains distribute randomly, which results in the material having a total magnetic intensity of zero. When the external magnetic field is nonzero, the magnetic domains will move and spin to be parallel to it, changing the length of the object along the same direction. The magnetic domain theory gives a qualitative explanation of the magnetostrictive effect. The constitutive equations of magnetic and elastic properties in ferromagnetic materials are provided as follows [35]:
where the superscript denotes the transposition; and are the strain and stress, respectively; is the magnetic field intensity; is the magnetic flux density; and are the elastic compliance matrix and stiffness matrix, respectively; is the piezomagnetic matrix; is the inverse matrix; and is the permeability. Equations (1) and (2) account for the magnetostrictive effect while Equation (3) contributes to the inverse magnetostrictive effect. Figure 3 shows the diagram of a MPT with planar coils. The static bias magnetic field in the magnetostrictive patch was provided by pre-magnetization, making the structure of the MPT thin and flexible without permanent magnets. The dynamic magnetic field was supplied by the coils sealed in the FPC, which sensed induced dynamic magnetic fields during the wave detection. In this paper, the model of the MPT was considered for the generation and detection of wave modes with shear vibrations in plates (shear horizontal waves) and pipes (torsional waves), which had the advantage of non-dispersion at low frequencies for inspection. The models for the longitudinal wave MPTs can be found in [36]. In shear mode generation, the dynamic magnetic field is perpendicular to the static magnetic field, of which the intensity is much smaller than that of the static magnetic field. The total strain is caused by the field superposition:
where
is the applied stress; and denote the intensities of the dynamic and static magnetic fields, respectively; is the gradient of the magnetostrictive curve of the material at ; and is the total magnetostrictive strain, which mostly depends on the static magnetic field since the dynamic field is much smaller. Considering that the wave amplitude is correlated with the dynamic shear strain , Equation (4) can be simplified as:
It can be concluded from Equation (6) that the dynamic shear strain is proportional to the amplitude of the dynamic magnetic field. Thus, it may be an effective way to raise the wave energy by enhancing the dynamic magnetic field.
2.2. Enhancement with a Soft Magnetic Patch
In wave generation, the dynamic magnetic field in the magnetostrictive patch is supplied by the coils loaded with sinusoidal pulses. It can be described with the magnetic Ohm’s law qualitatively. As shown in Figure 4, the coils in the middle were the magnetic source, which supplied a constant magnetomotive force when the input power of the equipment stayed unchanged. The magnetic flux circulated around the coils constructing a space named the magnetic circuit. According to the magnetic Ohm’s law, the relation between the magnetomotive force and the magnetic flux is as follows:
where
is the magnetic resistance of part in the magnetic circuit as marked in Figure 4; and is the length and sectional area, respectively; and is the relative permeability. Furthermore, is the permeability of the vacuum. Part 1 denotes the magnetostrictive patch. Parts 2, 3 and 4 were full of air. The magnetostrictive patch was not magnetized along the direction of the dynamic magnetic field and thus, the magnetic intensity in part 1 could be calculated as:
The magnetic resistance of parts 2 and 4 were the same (i.e., ). Combined with Equations (7) and (8), Equation (9) can be written as follows:
It could be found that without changing the material property () and sizes ( and ) of the magnetostrictive patch (part 1), the magnetic intensity could be improved with an increase in the relative permeability of part 3 (). It could be achieved by covering a soft magnetic patch (SMP) over the coils. could be improved further by increasing the thickness of the SMP (related to ) and decreasing the gap () between the SMP and magnetostrictive patch. It should be noted that Equation (10) qualitatively explains the improvement by the SMP in wave generation. The magnetic flux was distributed unevenly in the magnetic circuit, which also does not hold a regular geometric structure.
In wave detection, the magnetostrictive patch becomes a magnetic source because of the inverse magnetostrictive effect. The magnetic field induced by the magnetostrictive patch was proportional to the wave strength without additional magnetic fields. With the SMP above the coils, the induced magnetic field may have been restricted within the area around the coils and the induced current in the coils would be larger with an amplitude increase in the induced dynamic magnetic field. The improvement of the SMP can affect both processes when a MPT is used as an actuator and sensor at the same time. Furthermore, the electromagnetic interference, which are ubiquitous in the testing field, can be blocked by the SMP, improving the signal-to-noise ratio (SNR) of the detection signals.
3. Numerical Simulation
3.1. Simulation Setup
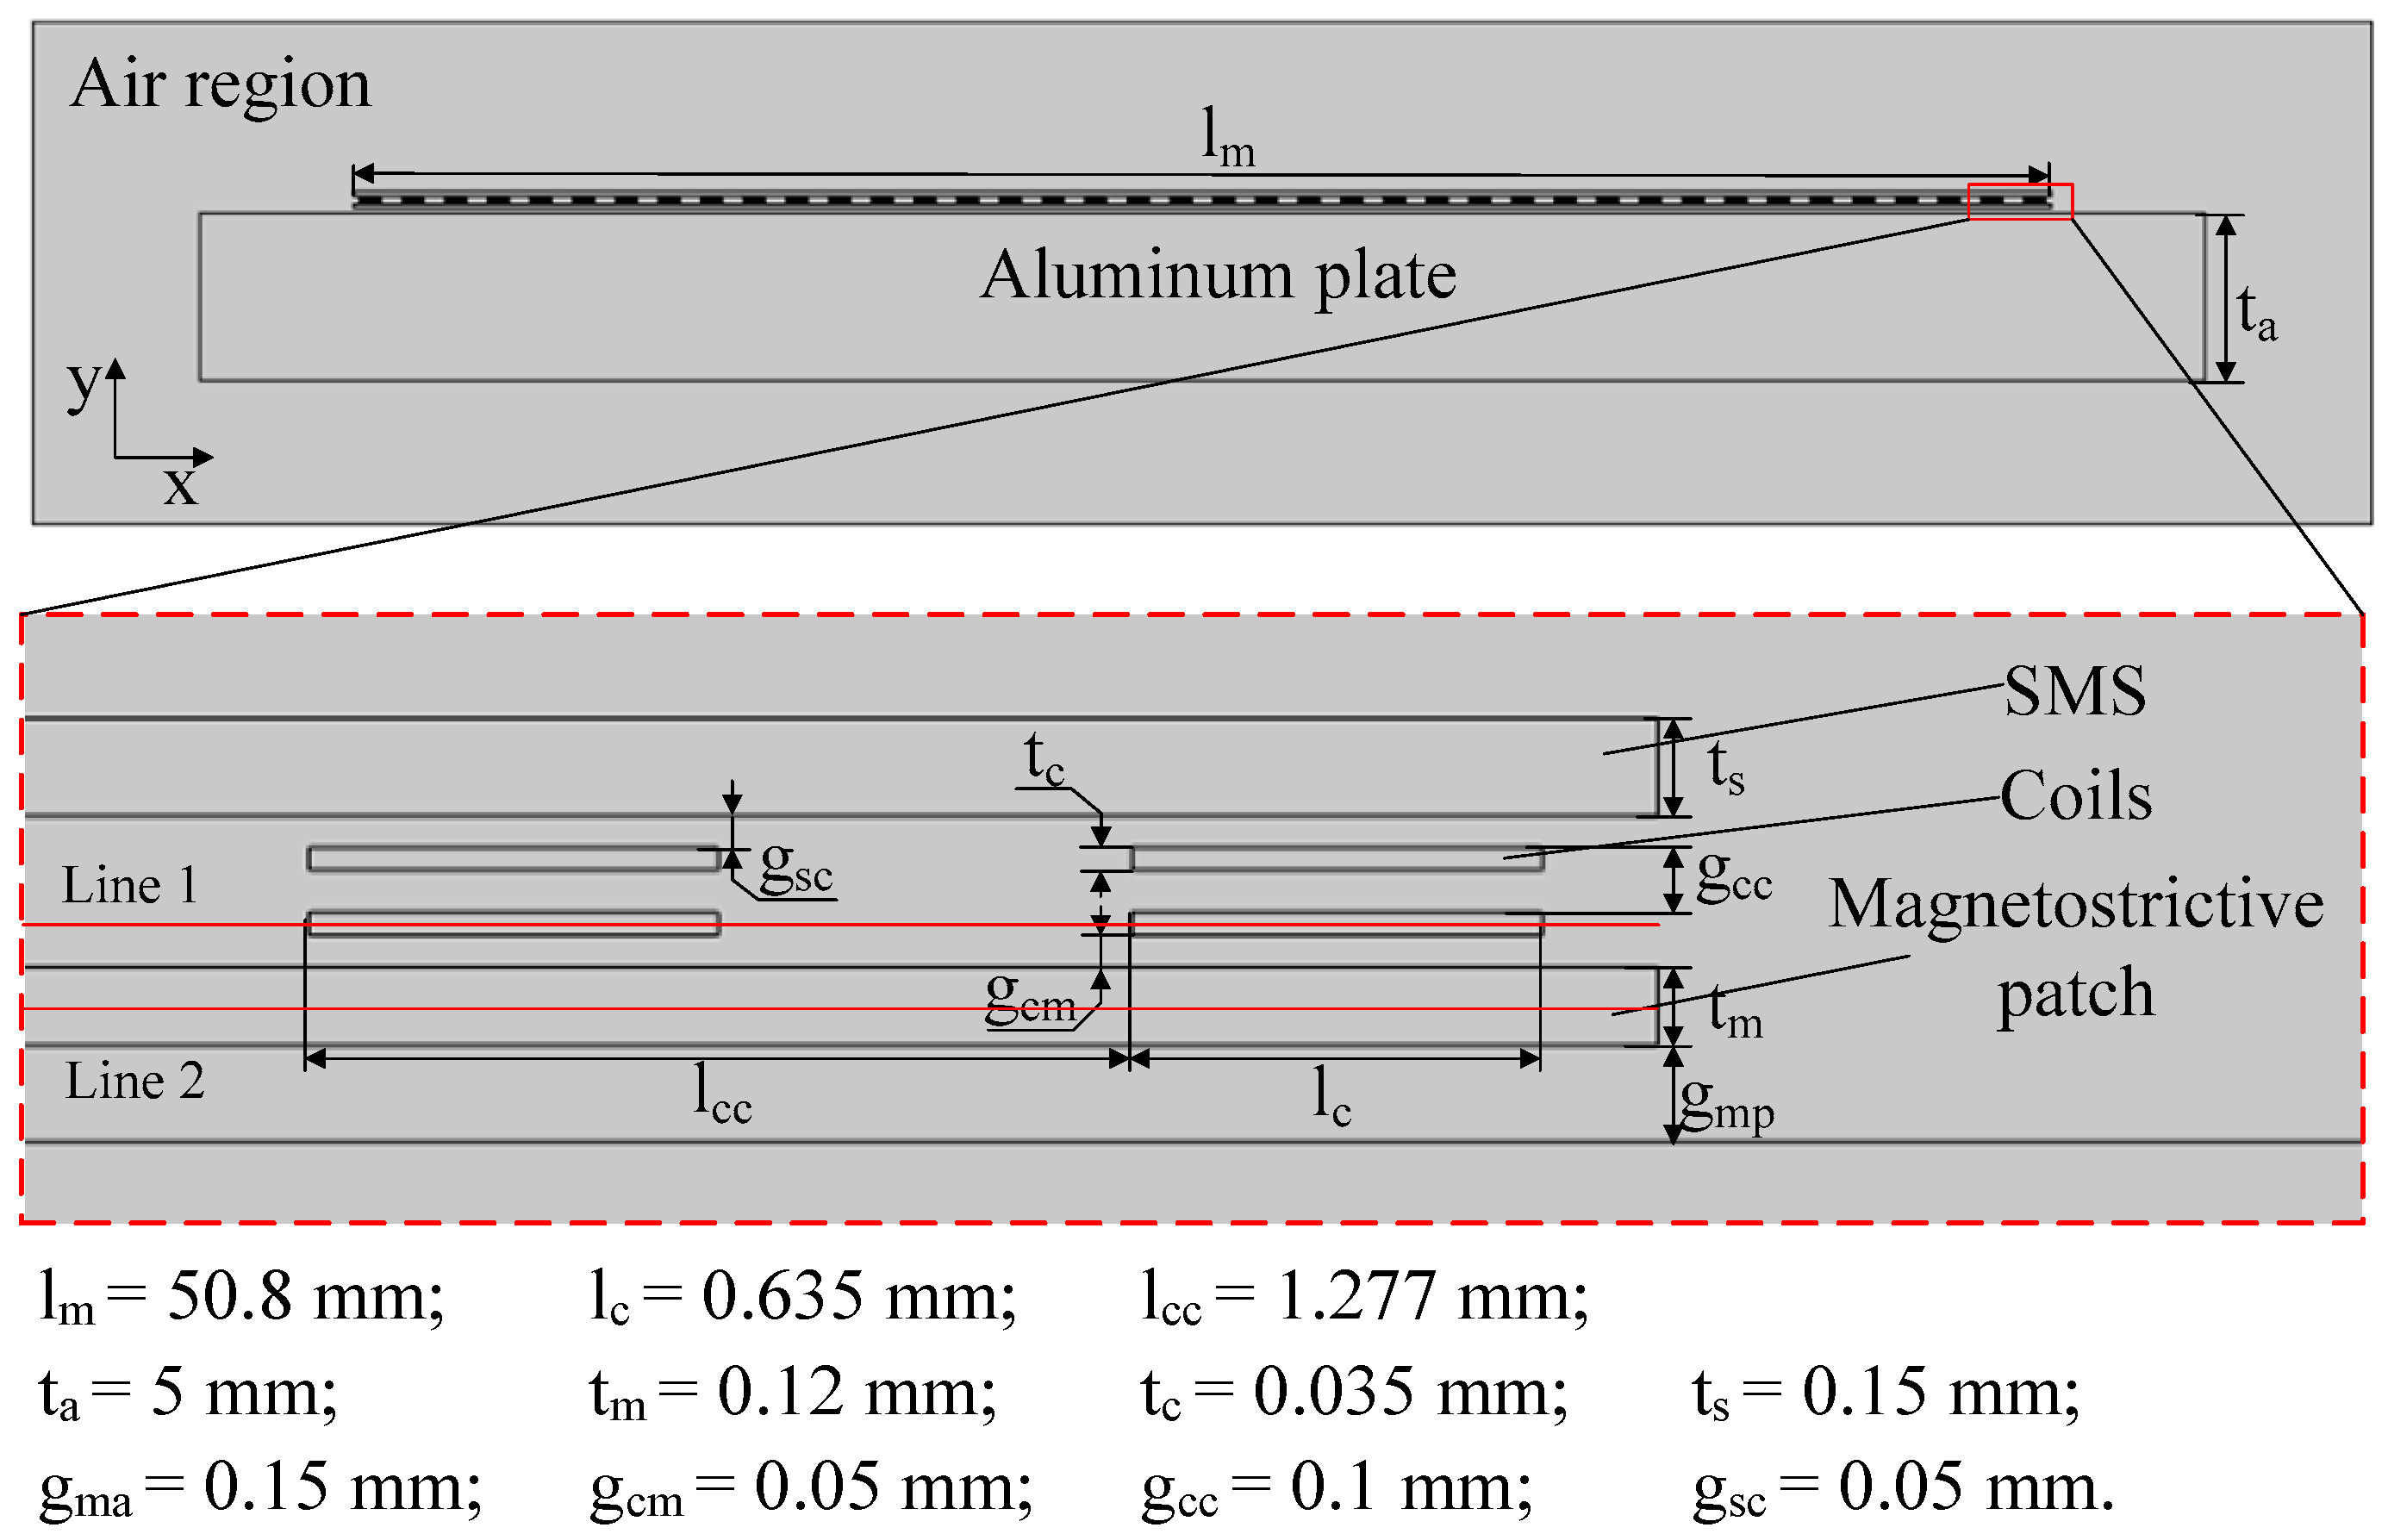
The dynamic magnetic field in the working region of the MPTs can be regarded as being uniform along the direction of the wires. Thus, for simplification, a two-dimensional model was built in COMSOL Multiphysics (COMSOL 5.3a, COMSOL Inc., Stockholm, Sweden) as shown in Figure 5. The coupling layer between the magnetostrictive patch and aluminum plate was neglected as it was non-conducting and non-magnetic. The coils of the two layers sealed in the FPC were made of copper. The material of the magnetostrictive patch was Fe–Co alloy. Permalloy, silicon steel, pure iron and Mn–Zn ferrite were the optional materials with a high relative permeability for the SMP. Considering the eddy-current loss, which may be caused by the dynamic magnetic field, the Mn–Zn ferrite with low conductivity was selected. In Figure 5, the real sizes of different parts are marked. The symbols represent the dimensions in the model (l: Length; t: Thickness; g: Gap distance) and the subscripts denote different parts (a: Aluminum plate; m: Magnetostrictive patch; c: Coil; s: SMS). lcc was the interval length of wires in the same coil. The material properties are listed in Table 1. In this study, the generation and detection of the zeroth shear horizontal mode (SH0 mode) was considered to have the advantage of non-dispersion. To avoid the interference of high order modes, the excitation frequency should be below the cutoff frequency of the SH1 mode (312 kHz) in the aluminum plate (the thickness was 5 mm). With the consideration of the high attenuation of wave modes at high frequencies and low detection sensitivity at low frequencies in field tests, the frequency range was determined as 55–150 kHz. The frequency tests were carried out with increasing steps of 5 kHz using the FPCs named MF64 and MF128, which were designed at the main frequencies of 64 kHz and 128 kHz, respectively (MF64 for 55–90 kHz, MF128 for 95–150 kHz). Two coils were designed in one FPC for wave direction controlling as shown in Figure 3, but only one was used to avoid channel crosstalk in experiments. The simulations used the same setup and the current directions are shown in Figure 6. The red solid lines in Figure 5 are reference lines with the length of lm to observe the magnetic intensities. For wave generation, the alternating currents with the amplitude 1A were loaded into the coils and the magnetic intensity along the x-axis of Line 1, which is in the middle of the magnetostrictive patch, was observed. In wave detection, the alternating magnetic fields with the amplitude 1 A/m2 are applied into the magnetostrictive patch along the x-axis and the magnetic intensity in Line 2, which was across the middle of the coils near the magnetostrictive patch, was observed.
3.2. Simulation Verification and Factor Analysis
The typical dynamic magnetic field distributions of MPTs with and without the SMPs at 85 kHz in wave generation and detection are shown in Figure 7. With the SMP, the magnetic flux lines can be restricted in the narrow area around the coils instead of dispersing in the air region. Figure 8 shows the amplitudes of the magnetic field intensities along the x-axis from Line 1 and Line 2, respectively. The dynamic magnetic field existing in the magnetostrictive patch are right below the coils with currents. In wave detection, the high peaks are magnetic intensities in the coils. The dynamic magnetic field in the magnetostrictive patch was enhanced more than three times with the SMP and the induced magnetic fields in the coils were also stronger. The results shown in Figure 9 confirmed the enhancement of the SMPs at other frequencies. It should be mentioned that the sharp fall in Figure 9a may have been caused by different current loadings as shown in Figure 6.
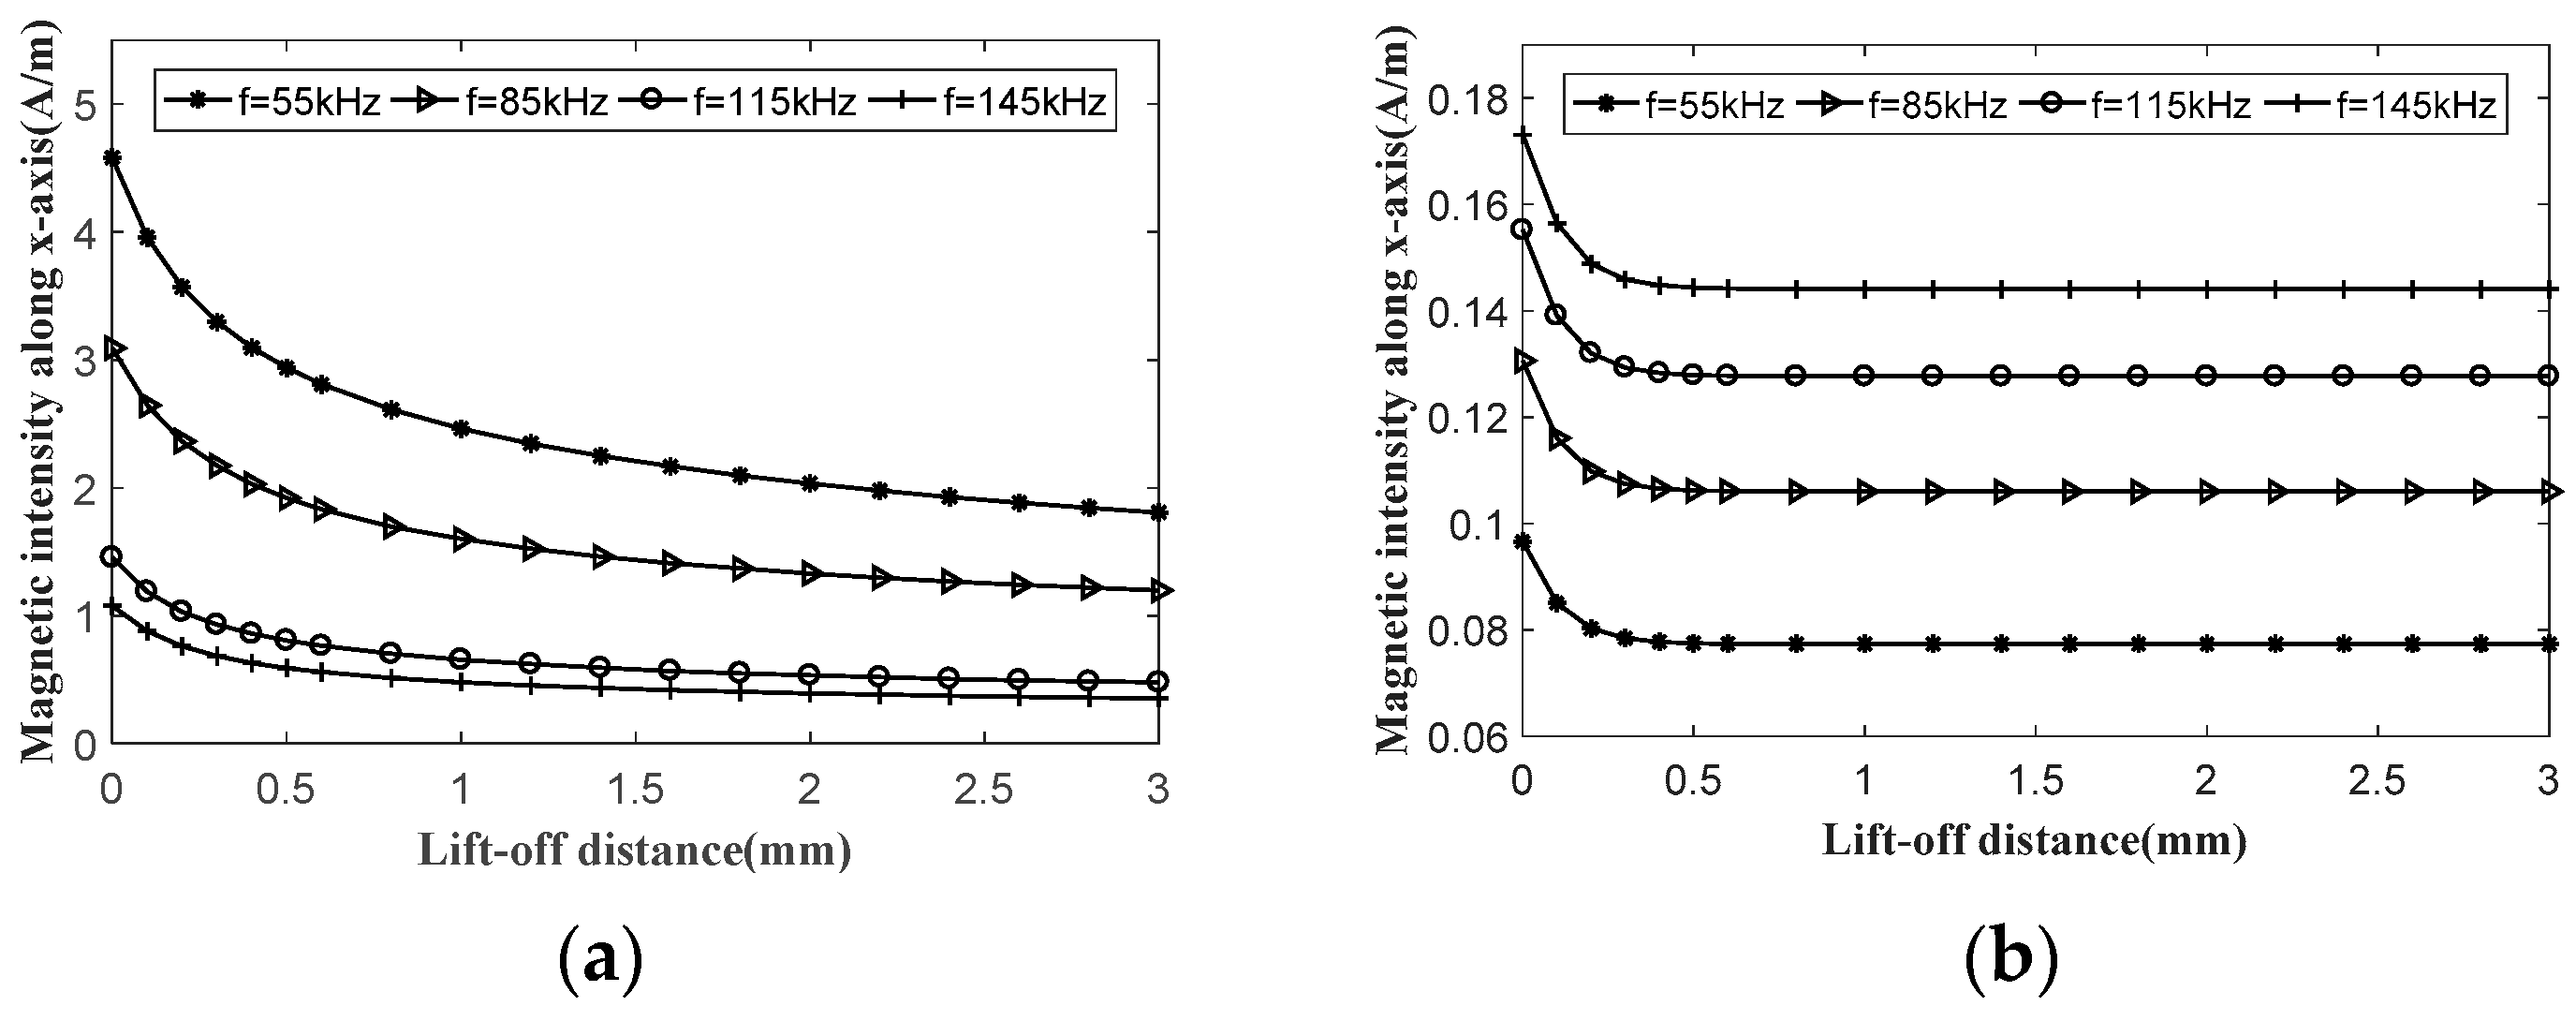
For the proper selection of the SMP, several properties, including the relative permeability, thickness (ts) and lift-off distance (gsc), were studied with the other parameters of the model having fixed values. The typical results at 55 kHz, 85 kHz, 115 kHz and 145 kHz are shown in Figure 10, Figure 11 and Figure 12. The magnetic fields get stronger with an increase in the relative permeability of the SMP, as shown in Figure 10a, which matches the theoretical prediction in Section 2.2. However, when the relative permeability is larger than 2000, the influence of relative permeability changes is subtle. The lower limit of the relative permeability for maximum magnetic field intensity in wave detection is 100. The dynamic magnetic field attenuates exponentially during the propagation in a good conductor so it is only distributed near the surface of the conductor (i.e., skin effect [37]). With this effect, the thickness of the SMP can be very small (0.01~0.6 mm in the simulation). The improvement of magnetic fields by an increase in the thickness was verified from the curves of 55 kHz and 85 kHz in Figure 11a, which did not increase significantly when the thickness was over 0.15 mm. For other cases at higher frequencies or in wave detection, it reaches the maximum for higher frequencies at the minimum thickness. The distance between the SMP and coils (i.e., the lift-off distance in this paper) will affect the improvement of the SMP if something necessarily has to be put in between (e.g., a second insulation layer). The influence of the SMP gets smaller naturally when the SMP gets further away from the coils. It can be explained with the increment of the magnetic resistance in the magnetic circuits over the lift-off distance as described in Section 2.2. Figure 12 shows the results for different lift-off distances. It could be found that during the lift-off of the SMP, the influence attenuation of the SMP continued until a long distance (2.5 mm) in wave generation, but the influence remained constant when the SMP was 0.5 mm away in wave detection.
4. Experimental Investigation
4.1. Experimental Setup
Experiments were carried out to verify the improvement of the SMP as shown in Figure 13. The equipment used in the experiments (MSGW30, Zheda Jingyi Tech, Ltd., Hangzhou, China) was designed for magnetostrictive guided wave inspection, which was integrated with modules, such as signal generation, power amplification, pre-amplification and A/D conversion. The equipment has two channels. Under the control of the computer, the equipment can work in the pulse-echo mode (wave generation and detection using Channel 1) and pitch-catch mode (wave generation using Channel 1 and detection using Channel 2). The inspection subject was an aluminum plate with a thickness of 5 mm. For the constant and same bonding conditions of the transducers (T1 and T2), dual adhesive tapes were used for the bonding between the magnetostrictive patches made of Fe-Co alloy and the aluminum plate. The thicknesses of the magnetostrictive patch and dual adhesive tape were 0.12 mm and 0.15 mm, respectively. The FPCs (MF64 and MF128) for the two main frequencies (64 kHz and 128 kHz) were processed with two coils and only one was used in the experiments to avoid the crosstalk. The generated guided wave propagated forward and backward without direction controlling and the wave packs from the far end of the plate in the signals were used for evaluation. The SMP was manufactured by hot-pressing with a mixture of the Mn–Zn ferrite power and rubber, which had a thickness and relative permeability of 0.15 mm and 2800, respectively. The SMP, FPC and magnetostrictive patch were all flexible and the dimensions of the SMP and magnetostrictive patch were 50.8 × 70 mm, which was the same as the working region of the FPC. The excitation signals at different frequencies were sinusoidal signals of four cycles filtered by the hanning windows and the sample frequency was 2 MHz.
The improvement of the SMP for wave generation and detection was first verified. In this experiment, the transducer marked as T1 in Figure 13 was used as an actuator while T2 was a sensor. The MF64 was used for frequencies of 55–90 kHz while the MF128 was used for frequencies of 95–150 kHz. The signals were set as the base data when T1 and T2 both were not covered by the SMPs. Furthermore, the signals received at the cases, such as only T1 covered by the SMP, only T2 covered by the SMP and both covered by the SMPs, were compared with the base data. The magnification was calculated using the peak values of the wave packs from the far end of the plate in the Hilbert envelopes of the signals.
The effect of thickness changes was investigated using multiple layers of SMPs. For each frequency, the signals were recorded when the MPT was covered by different layers of the SMPs (four layers at most). The last experiment was focused on the lift-off distance, which was carried out using a single layer of the SMP. The lift-off was achieved by installing multiple layers of epoxy patches between the FPC and SMP (six layers at most). The thickness of one single epoxy patch was 0.5 mm. These experiments were carried out with T1 used as an actuator and sensor in the pitch–catch mode. The signals from the cases in which the transducer was not covered by the SMP were used as the base data for amplification evaluation. It should be mentioned that in order to get rid of the void between the layers of the transducer, a nonmetal heavy weight was set above the transducer during the signal collection. The magnetostrictive patch was re-magnetized at the beginning of every experimental case to keep the uniformity of the bias magnetic field and multiple signals were collected in each case to reduce the effect of random noises.
4.2. Results and Discussions
The original signals were all processed with band-pass filters. Figure 14 shows the signals at 85 kHz when both the actuator and sensor were or were not covered by the SMPs. Comparisons were made between the ratios of the flight times in the signals and propagation distances from the transducers to the near end and far end. It can be confirmed that the wave packets at 2.25 × 10⁻⁴ s are echo waves from the near end and those at 5.48 × 10⁻⁴ s were from the far end. The far end echo waves were observed in the experiments, of which the peak values with the SMP were about two times of those without the SMP. The magnifications of signals at different frequencies were calculated by using the peak values of the far end echo waves in the envelope signals, which are shown in Figure 15. The SMP provided the enhancement for the MPT used in wave generation, which were even more than that in wave detection. The signal strength could be improved by 9.8 dB at most with both of the transducers covered by the SMPs.
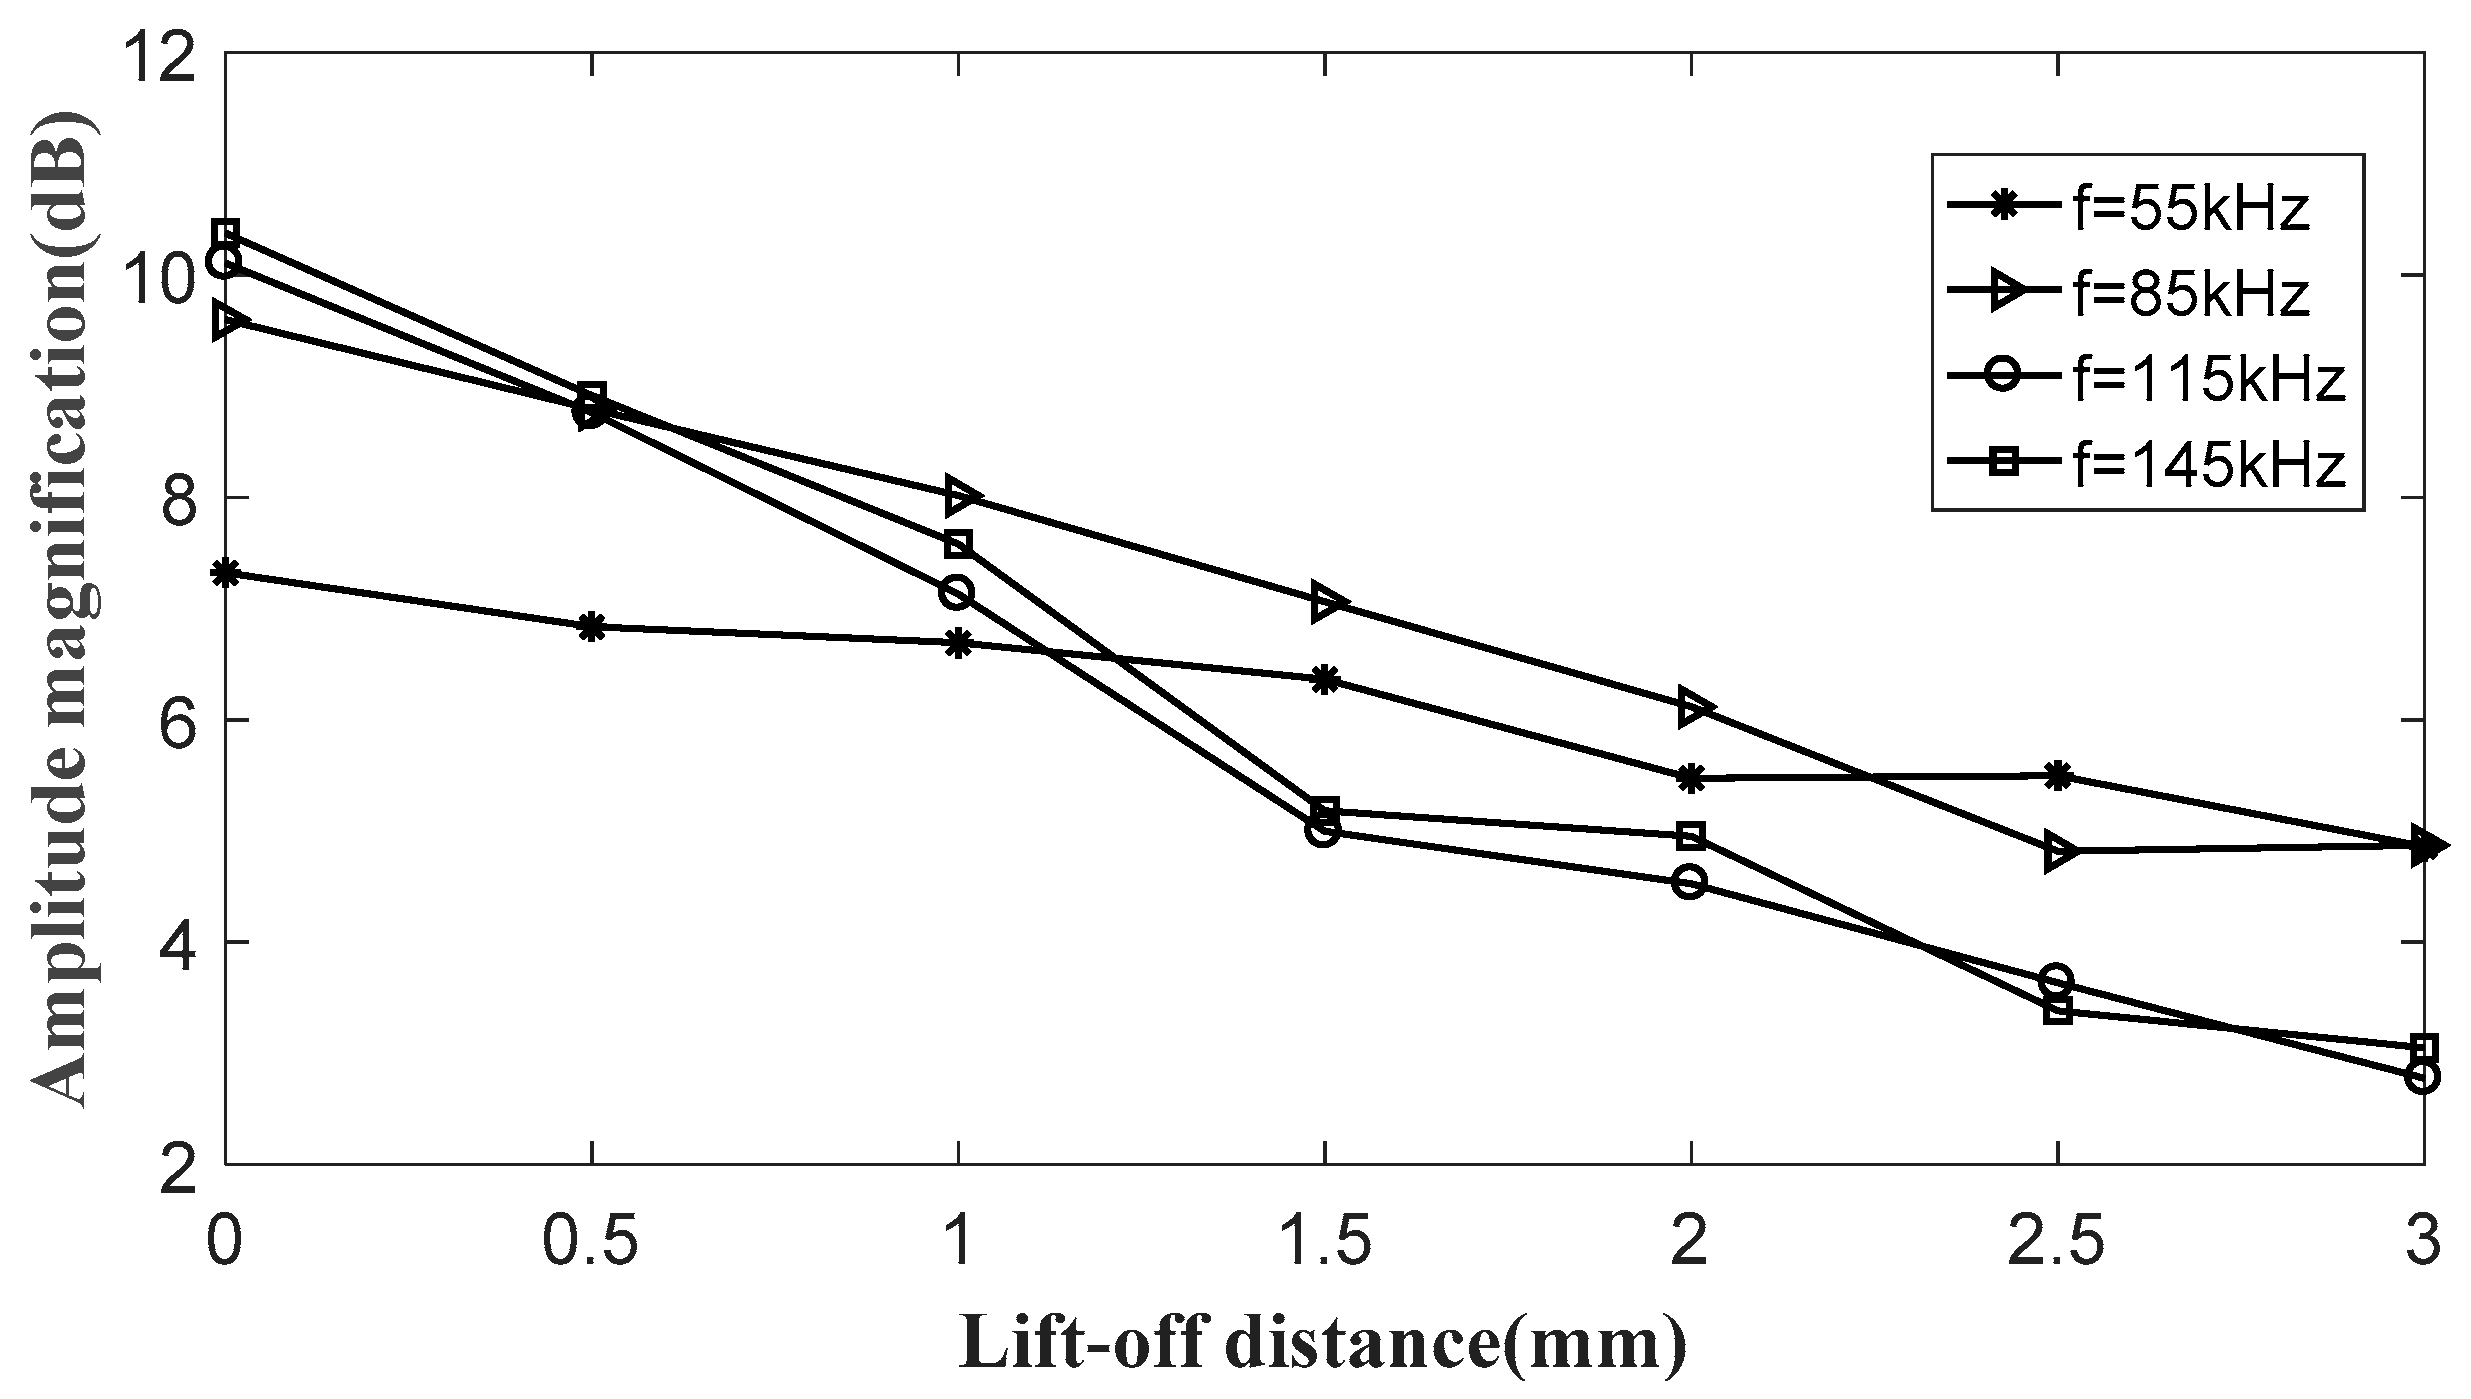
Figure 16 shows the results of the MPT covered by different layers of SMPs at different frequencies. The enhancement was promoted by multiple layers of SMPs, which reached a maximum amplification of 12.7 dB at 130 kHz. However, there were no significant changes when the layer number of the SMPs was over two. The step change at the frequencies of 90 kHz and 95 kHz may have been caused by two different types of FPCs in the experiments. Considering these results, the SMP with the thickness over 0.3 mm should be recommended. The typical results for different lift-off distances of the SMP are shown in Figure 17. The decreasing trends at different frequencies match the prediction. The magnifications decrease faster at higher frequencies. A slight enhancement of 2.8 dB still exists when the SMP is moved 3 mm away from the FPC. However, for better results, the SMP should have a closer fit to the FPC under allowed conditions.
5. Conclusions
A method of signal strength enhancement was proposed for the magnetostrictive patch transducer (MPT) by dynamic magnetic field optimization with a soft magnetic patch (SMP) in guided wave inspection. The enhancement was achieved by decreasing the resistance of the magnetic circuit in wave generation and restricting the induced dynamic magnetic field in wave detection. A numerical investigation was successfully performed for the improvement of dynamic magnetic fields in the magnetostrictive patch and region around the coils. Experimental validation was carried out for the SH0 wave inspection in an aluminum plate. The main findings are summarized as follows:
- The amplitude enhancement of the dynamic magnetic field in the magnetostrictive patch is beneficial for SH wave generation and the concentration of the induced magnetic field by the magnetostrictive patch in wave detection is good for the measurement by the coils.
- The SMP can significantly decrease the resistance of the magnetic circuit for the dynamic magnetic field in wave generation and concentrates the induced magnetic field in wave detection. The relative permeability should be more than 2000 and the thickness should be over 0.15 mm. The increased distance between the SMP and the coils was bad for the improvement.
- Covered by the SMPs with the relative permeability of 2800, the MPTs provided a better performance in both processes of wave generation and detection compared to those without the SMPs. The improvement of the SMP in wave detection was more than that in wave generation. The largest magnification can be 12.7 dB when the transducer is used as an actuator and sensor at the same time.
- For ideal results, using the SMPs with the relative permeability of 2800, a thickness over 0.3 mm and close fitting between the SMP and coils is recommended.
The SMP is expected to improve the signal strength of the MPT for guided wave inspection without sacrificing the flexibility and lightness of the transducer or increasing the system power. For future studies, the SMPs made of different materials with different relative permeabilities will be tested and different types of environmental factors, including temperature and electromagnetic disturbing, will be investigated. The MPT with the SMP will also be examined in field tests of pipe and tank floor scanning.
Author Contributions
J.W. conceived and designed the models and methods presented; Z.T., F.L. and K.Y. helped with the conception and experiments; J.W. performed the simulations, experiments and data analysis; J.W. and Z.T. wrote this paper.
Funding
The work was supported by the National Natural Science Foundation of China (Grant No. 51875511) and National Key Research and Development Program of China (Grant No. 2018YFC0809000).
Conflicts of Interest
The authors declare no conflicts of interest.
References
- Rose, J.L. Ultrasonic Guided Waves in Solid Media, 1st ed.; Cambridge University Press: Cambridge, UK, 2014; p. 1. ISBN 978-1-107-04895-9. [Google Scholar]
- Heinlein, S.; Cawley, P.; Vogt, T.K. Reflection of torsional T (0, 1) guided waves from defects in pipe bends. NDT E Int. 2018, 93, 57–63. [Google Scholar] [CrossRef]
- Leinov, E.; Lowe, M.J.S.; Cawley, P. Investigation of guided wave propagation and attenuation in pipe buried in sand. J. Sound Vib. 2015, 347, 96–114. [Google Scholar] [CrossRef] [Green Version]
- Hayashi, T.; Tamayama, C.; Murase, M. Wave structure analysis of guided waves in a bar with an arbitrary cross-section. Ultrasonics 2006, 44, 17–24. [Google Scholar] [CrossRef] [PubMed]
- Seung, H.M.; Park, C.I.; Kim, Y.Y. An omnidirectional shear-horizontal guided wave EMAT for a metallic plate. Ultrasonics 2016, 69, 58–66. [Google Scholar] [CrossRef] [PubMed]
- Hasanian, M.; Lissenden, C.J. Second order harmonic guided wave mutual interactions in plate: Vector analysis, numerical simulation, and experimental results. J. Appl. Phys. 2017, 122, 084901. [Google Scholar] [CrossRef]
- Yu, X.; Fan, Z.; Castaings, M.; Biateau, C. Feature guided wave inspection of bond line defects between a stiffener and a composite plate. NDT E Int. 2017, 89, 44–55. [Google Scholar] [CrossRef]
- Wu, J.; Tang, Z.; Lv, F.; Yang, K.; Yun, C.B. Ultrasonic guided wave-based switch rail monitoring using independent component analysis. Meas. Sci. Technol. 2018, 29, 115102. [Google Scholar] [CrossRef]
- Evans, M.; Lucas, A.; Ingram, I. The inspection of level crossing rails using guided waves. Constr. Build. Mater 2018, 179, 614–618. [Google Scholar] [CrossRef]
- Yao, W.; Sheng, F.; Wei, X.; Zhang, L.; Ynag, Y. Propagation characteristics of ultrasonic guided waves in continuously welded rail. Modern Phys. Lett. B 2017, 31, 1740075. [Google Scholar] [CrossRef] [Green Version]
- Nakamura, N.; Ogi, H.; Hirao, M. EMAT pipe inspection technique using higher mode torsional guided wave T (0, 2). NDT E Int. 2017, 87, 78–84. [Google Scholar] [CrossRef]
- Kogia, M.; Gan, T.H.; Balachandran, W.; Livadas, M.; Kappatos, V.; Szabo, I.; Mohimi, A.; Round, A. High temperature shear horizontal electromagnetic acoustic transducer for guided wave inspection. Sensors 2016, 16, 582. [Google Scholar] [CrossRef]
- Lee, J.R.; Chia, C.C.; Park, C.Y.; Jeong, H. Laser ultrasonic anomalous wave propagation imaging method with adjacent wave subtraction: Algorithm. Opt. Laser Technol. 2012, 44, 1507–1515. [Google Scholar] [CrossRef]
- Lee, J.R.; Chia, C.C.; Shin, H.J.; Park, C.Y.; Yoon, D.J. Laser ultrasonic propagation imaging method in the frequency domain based on wavelet transformation. Opt. Lasers Eng. 2011, 49, 167–175. [Google Scholar] [CrossRef]
- Sevillano, E.; Sun, R.; Perera, R. Damage detection based on power dissipation measured with PZT sensors through the combination of electro-mechanical impedances and guided waves. Sensors 2016, 16, 639. [Google Scholar] [CrossRef]
- Vinogradov, S.; Cobb, A.; Fisher, J. New Magnetostrictive Transducer Designs for Emerging Application Areas of NDE. Materials 2018, 11, 755. [Google Scholar] [CrossRef]
- Kwun, H.; Bartels, K.A. Magnetostrictive sensor technology and its applications. Ultrasonics 1998, 36, 171–178. [Google Scholar] [CrossRef]
- Wang, W.B.; Cao, S.Y.; Huang, W.M. Magnetostrive Materials and Devices, 1st ed.; Metallurgical Industry Press: Beijing, China, 2008; pp. 8–10. ISBN 9787502445324. (In Chinese) [Google Scholar]
- Kim, Y.Y.; Kwon, Y.E. Review of magnetostrictive patch transducers and applications in ultrasonic nondestructive testing of waveguides. Ultrasonics 2015, 62, 3–19. [Google Scholar] [CrossRef] [Green Version]
- Tzannes, N.S. Joule and Wiedemann effects-The simultaneous generation of longitudinal and torsional stress pulses in magnetostrictive materials. IEEE Trans. Sonics Ultrason. 1966, 13, 33–40. [Google Scholar] [CrossRef]
- Xu, J.; Wu, X.; Cheng, C.; Ben, A. A magnetic flux leakage and magnetostrictive guided wave hybrid transducer for detecting bridge cables. Sensors 2012, 12, 518–533. [Google Scholar] [CrossRef]
- Xu, J.; Wu, X.; Sun, P. Detecting broken-wire flaws at multiple locations in the same wire of prestressing strands using guided waves. Ultrasonics 2013, 53, 150–156. [Google Scholar] [CrossRef]
- Park, C.; Kim, Y.Y. Nonferromagnetic material inserted magnetostrictive patch bonding technique for torsional modal testing of a ferromagnetic cylinder. Rev. Sci. Instrum. 2010, 81, 035103. [Google Scholar] [CrossRef]
- Kumar, K.S.; Murthy, V.; Balasubramaniam, K. Improvement in the signal strength of magnetostrictive ultrasonic guided wave transducers for pipe inspection using a soft magnetic ribbon-based flux concentrator. Insight 2012, 54, 217–220. [Google Scholar] [CrossRef]
- Kim, H.W.; Cho, S.H.; Kim, Y.Y. Analysis of internal wave reflection within a magnetostrictive patch transducer for high-frequency guided torsional waves. Ultrasonics 2011, 51, 647–652. [Google Scholar] [CrossRef]
- Cho, S.H.; Lee, J.S.; Kim, Y.Y. Guided wave transduction experiment using a circular magnetostrictive patch and a figure-of-eight coil in nonferromagnetic plates. Appl. Phys. Lett. 2006, 88, 224101. [Google Scholar] [CrossRef]
- Yoo, B.; Na, S.M.; Flatau, A.B.; Pines, D.J. Ultrasonic guided wave sensing performance of a magnetostrictive transducer using Galfenol flakes-polymer composite patches. J. Appl. Phys. 2015, 117, 17A916. [Google Scholar] [CrossRef]
- Kim, Y.; Kim, Y.Y. A novel Terfenol-D transducer for guided-wave inspection of a rotating shaft. Sens. Actuators A Phys. 2007, 133, 447–456. [Google Scholar] [CrossRef]
- Cho, S.H.; Kim, H.W.; Kim, Y.Y. Megahertz-range guided pure torsional wave transduction and experiments using a magnetostrictive transducer. IEEE Trans. Ultrason. Ferroelectr. Freq. Control 2010, 57, 1225–1229. [Google Scholar] [CrossRef]
- Park, C.I.; Cho, S.H.; Kim, Y.Y. Z-shaped magnetostrictive patch for efficient transduction of a torsional wave mode in a cylindrical waveguide. Appl. Phys. Lett. 2006, 89, 174103. [Google Scholar] [CrossRef]
- Park, C.I.; Kim, W.; Cho, S.H.; Kim, Y.Y. Surface-detached V-shaped yoke of obliquely bonded magnetostrictive strips for high transduction of ultrasonic torsional waves. Appl. Phys. Lett. 2005, 87, 224105. [Google Scholar] [CrossRef]
- Zhang, X.; Tang, Z.; Lv, F.; Pan, X. Helical comb magnetostrictive patch transducers for inspecting spiral welded pipes using flexural guided waves. Ultrasonics 2017, 74, 1–10. [Google Scholar] [CrossRef]
- Kim, Y.G.; Moon, H.S.; Park, K.J.; Lee, J.K. Generating and detecting torsional guided waves using magnetostrictive sensors of crossed coils. NDT E Int. 2011, 44, 145–151. [Google Scholar] [CrossRef]
- Lee, J.S.; Kim, Y.Y.; Cho, S.H. Beam-focused shear-horizontal wave generation in a plate by a circular magnetostrictive patch transducer employing a planar solenoid array. Smart Mater. Struct. 2008, 18, 015009. [Google Scholar] [CrossRef]
- Huang, S.L.; Wang, K.; Zhao, W. Theory and Application of Electromagnetic Ultrasonic Guided Wave, 1st ed.; Tsinghua University Press: Beijing, China, 2013; p. 74. ISBN 978-7-302-33673-0. [Google Scholar]
- Zhang, X.W.; Tang, Z.F.; Lv, F.Z.; Pan, X.H. Excitation of axisymmetric and non-axisymmetric guided waves in elastic hollow cylinders by magnetostrictive transducers. J. Zhejiang Univ.-Sci. A 2016, 17, 215–229. [Google Scholar] [CrossRef]
- Yang, Q.; Li, Y.; Zhao, Z.; Zhu, L.; Luo, Y.; Zhu, J. Design of a 3-D rotational magnetic properties measurement structure for soft magnetic materials. IEEE Trans. Appl. Supercond. 2014, 24, 1–4. [Google Scholar] [CrossRef]
Figure 1.
Coils commonly used in the magnetostrictive transducers.
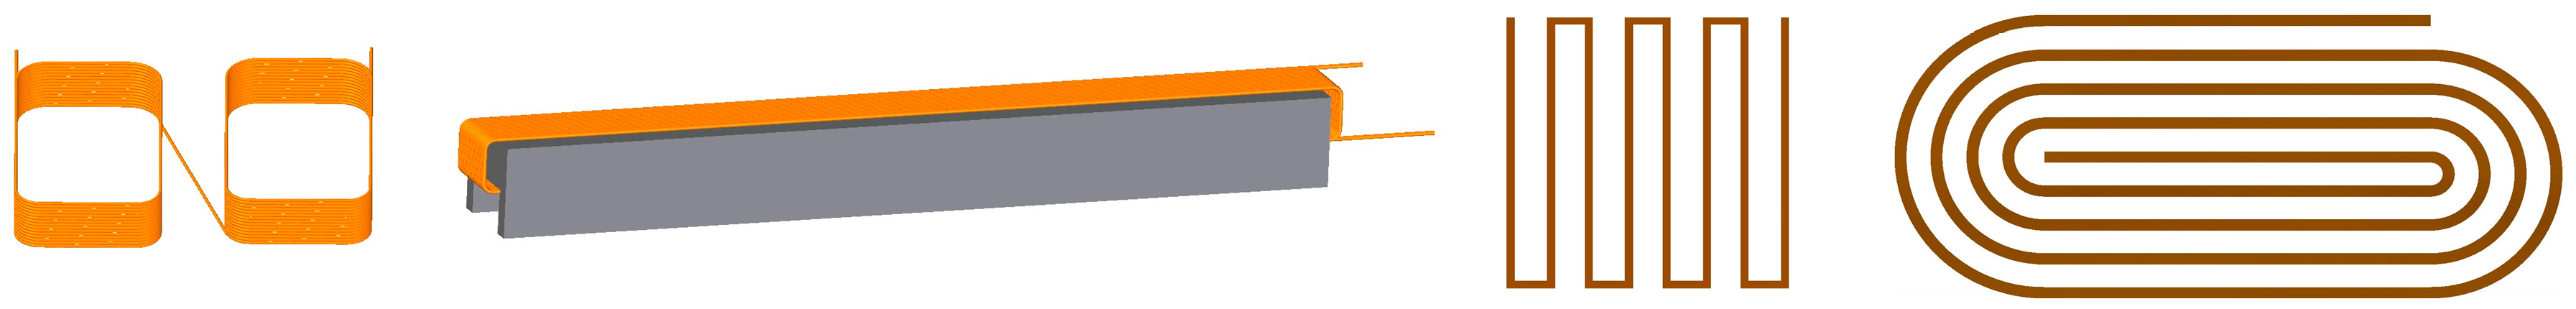
Figure 2.
Magnetic domain movement in the magnetostrictive effect.

Figure 3.
Magnetostrictive patch transducer for shear wave inspection.

Figure 4.
Diagram of dynamic magnetic fields in the MPTs (magnetostrictive patch transducers).
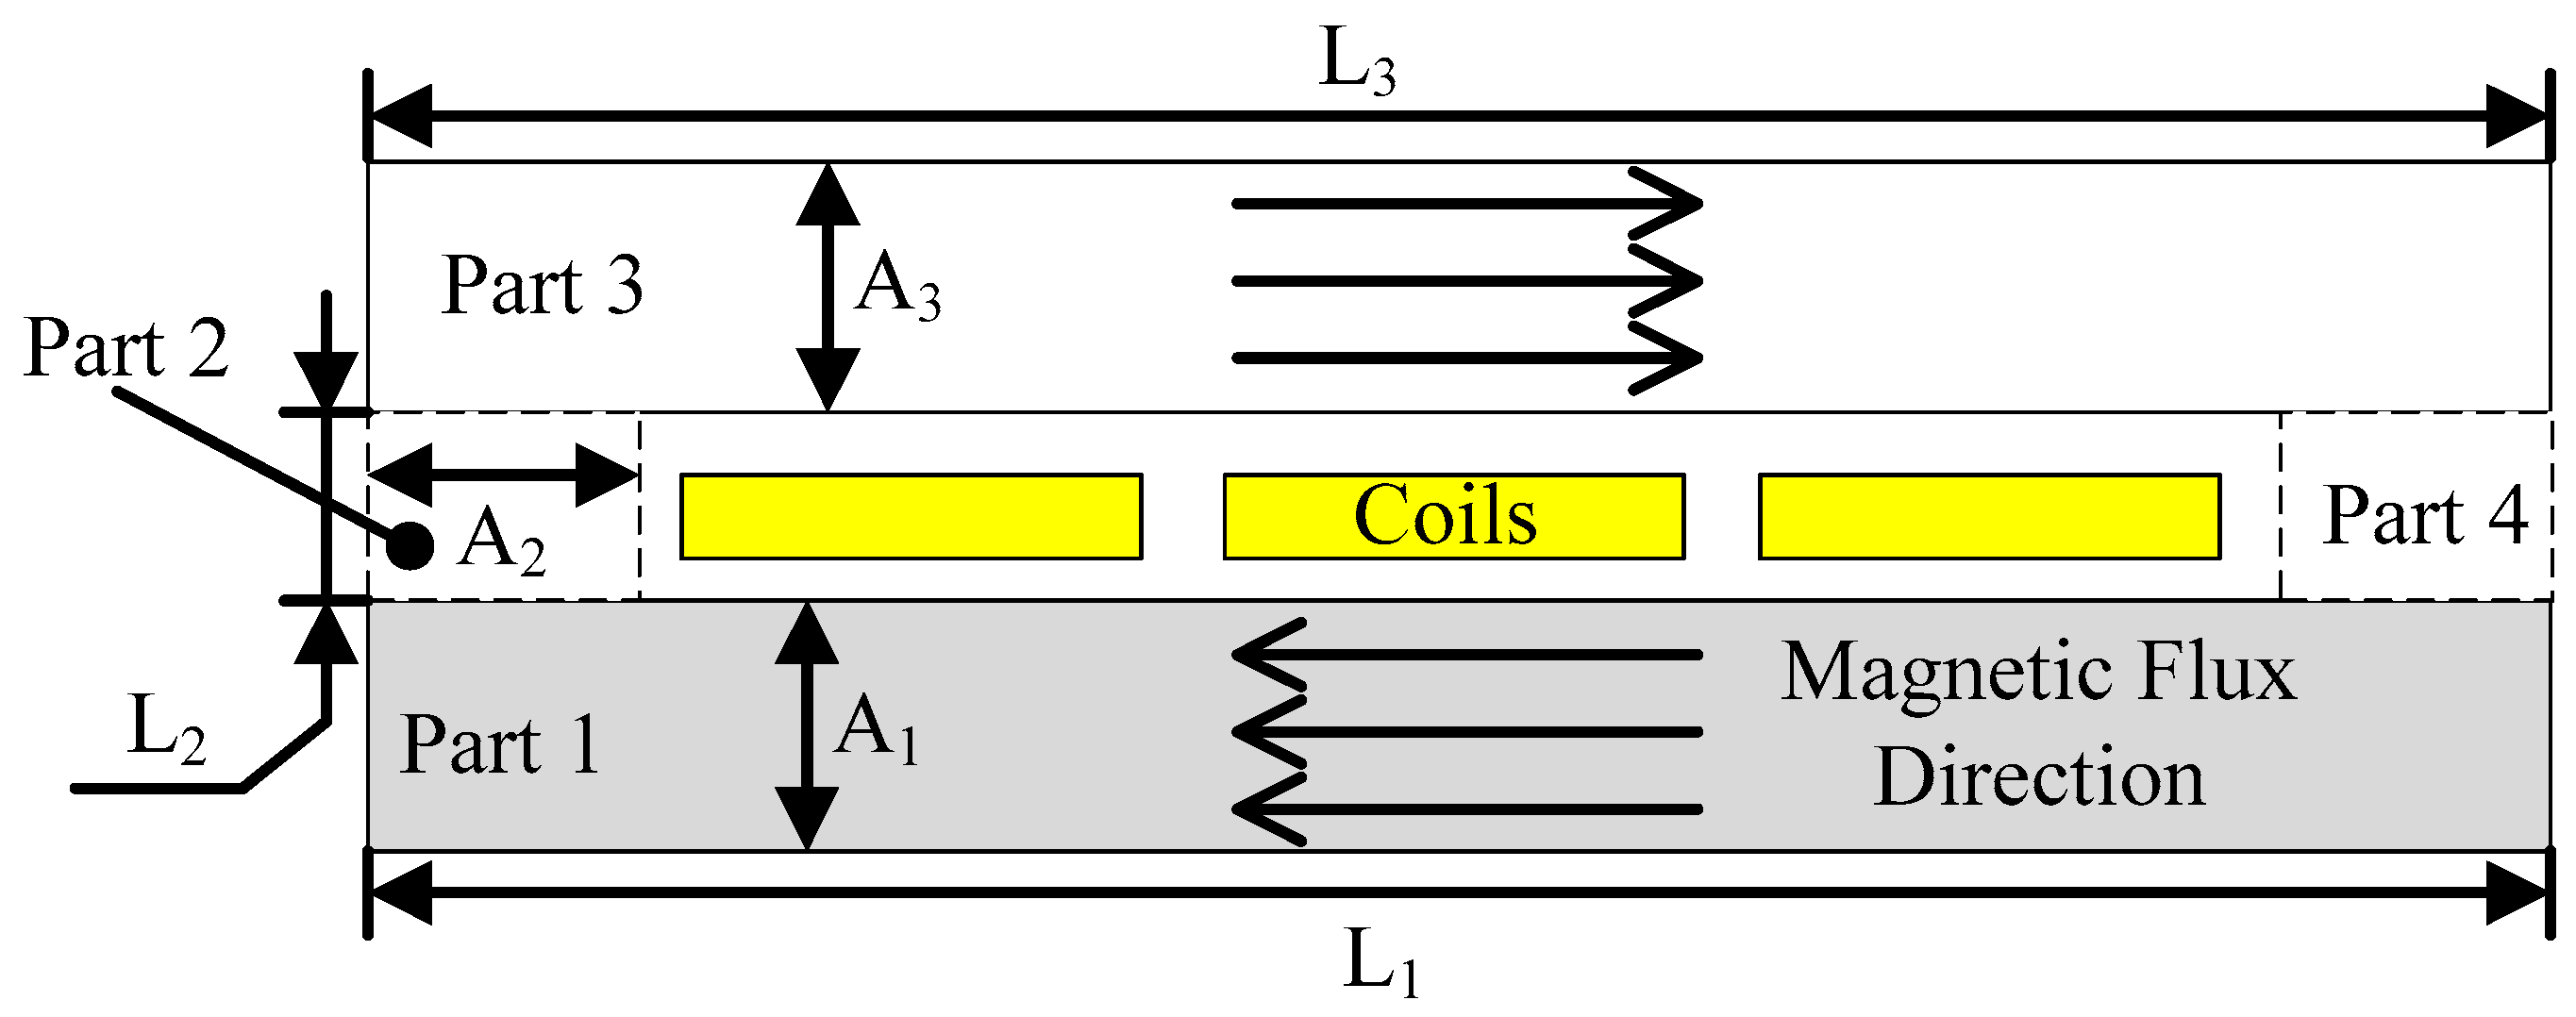
Figure 5.
Numerical model for dynamic magnetic field simulation of magnetostrictive patch transducers.
Figure 5.
Numerical model for dynamic magnetic field simulation of magnetostrictive patch transducers.
Figure 6.
Current directions for different types of magnetostrictive patch transducers.

Figure 7.
Magnetic field distribution in magnetostrictive patch transducers at 85 kHz. The magnetic lines are green lines in the case of wave generation and blue lines of wave detection.
Figure 7.
Magnetic field distribution in magnetostrictive patch transducers at 85 kHz. The magnetic lines are green lines in the case of wave generation and blue lines of wave detection.
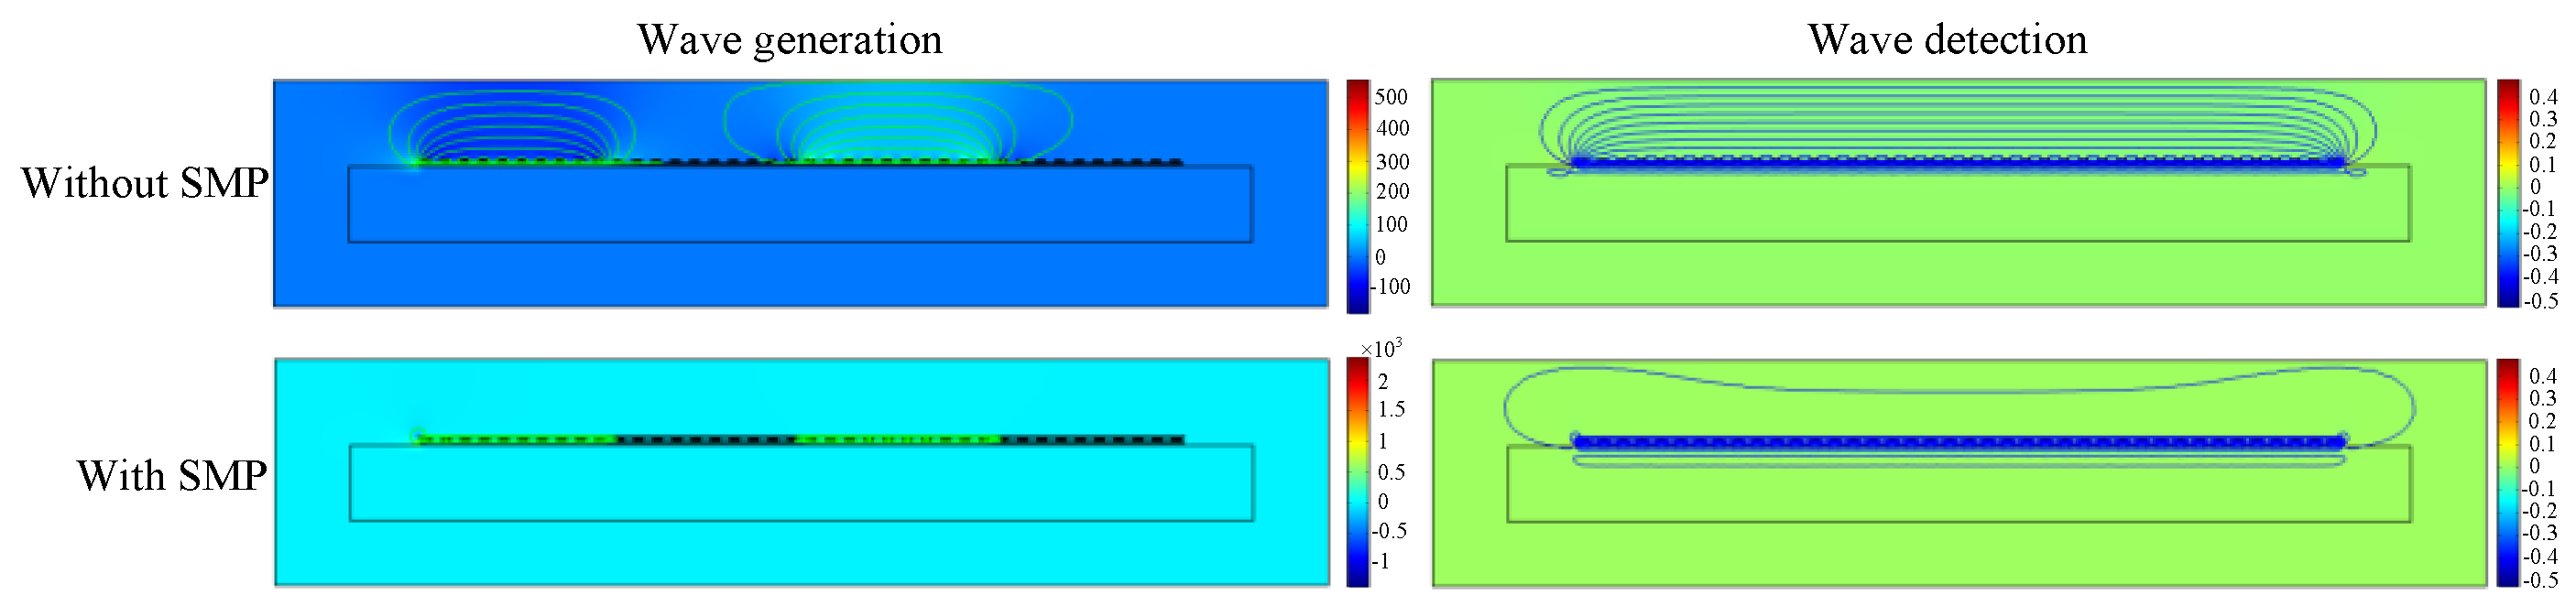
Figure 8.
Comparisons of magnetostrictive patch transducers with and without the SMPs at 85 kHz: (a) The magnetic field intensity in Line 1 in wave generation; (b) the magnetic field in Line 2 in wave detection.
Figure 8.
Comparisons of magnetostrictive patch transducers with and without the SMPs at 85 kHz: (a) The magnetic field intensity in Line 1 in wave generation; (b) the magnetic field in Line 2 in wave detection.
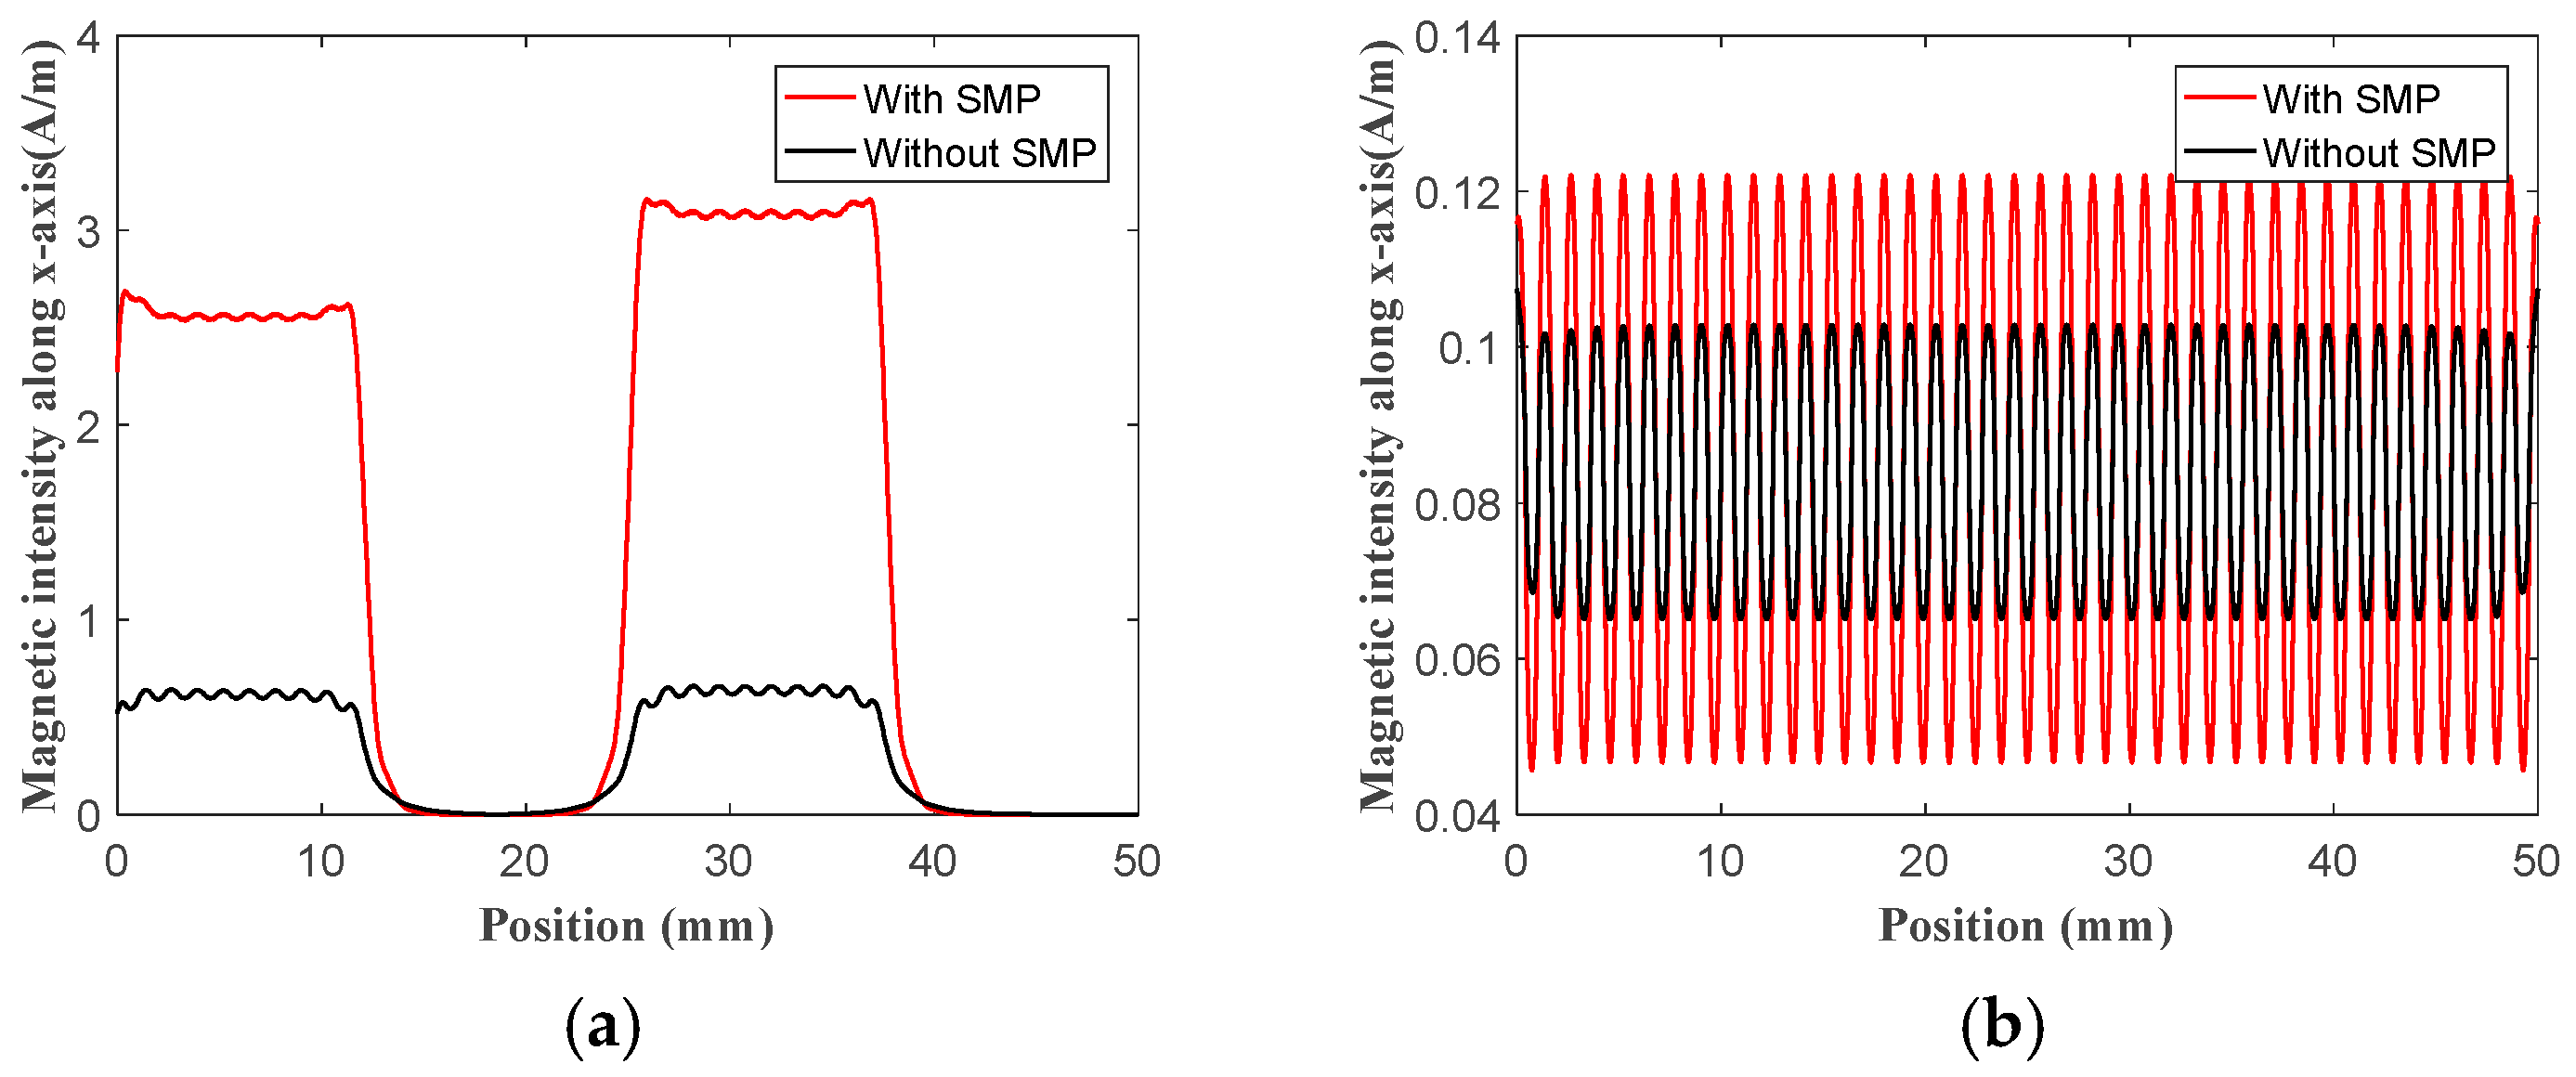
Figure 9.
Comparisons of MPTs with and without the SMPs at 55~150 kHz: (a) The magnetic field intensity in Line 1 in wave generation; and (b) the magnetic field in Line 2 in wave detection.
Figure 9.
Comparisons of MPTs with and without the SMPs at 55~150 kHz: (a) The magnetic field intensity in Line 1 in wave generation; and (b) the magnetic field in Line 2 in wave detection.
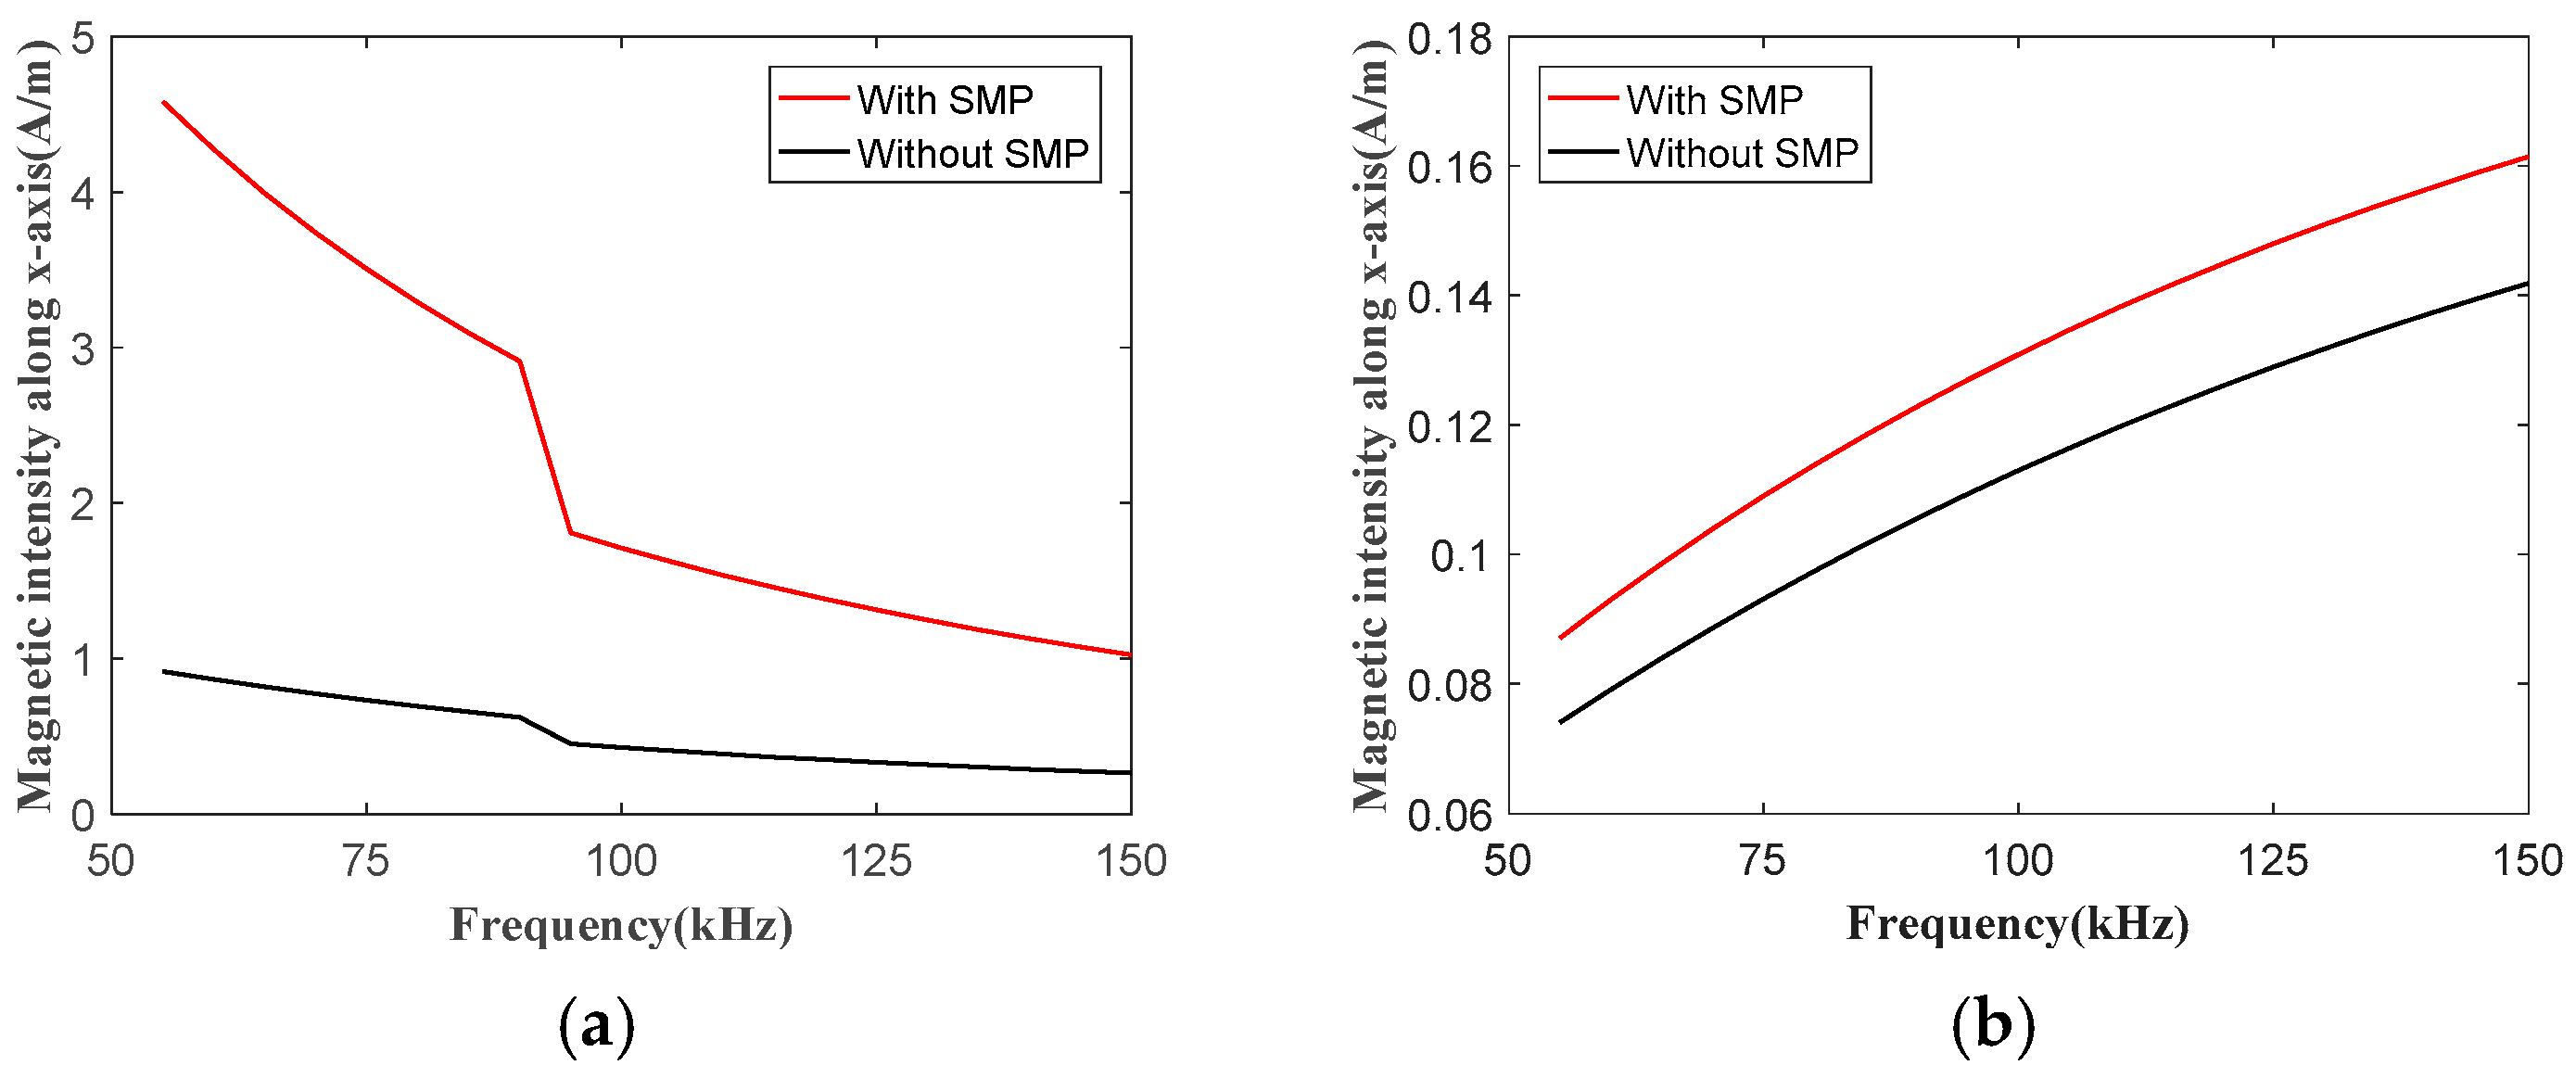
Figure 10.
MPTs with the SMPs of different relative permeabilities: (a) The magnetic field intensity in Line 1 in wave generation; and (b) the magnetic field intensity in Line 2 in wave detection.
Figure 10.
MPTs with the SMPs of different relative permeabilities: (a) The magnetic field intensity in Line 1 in wave generation; and (b) the magnetic field intensity in Line 2 in wave detection.
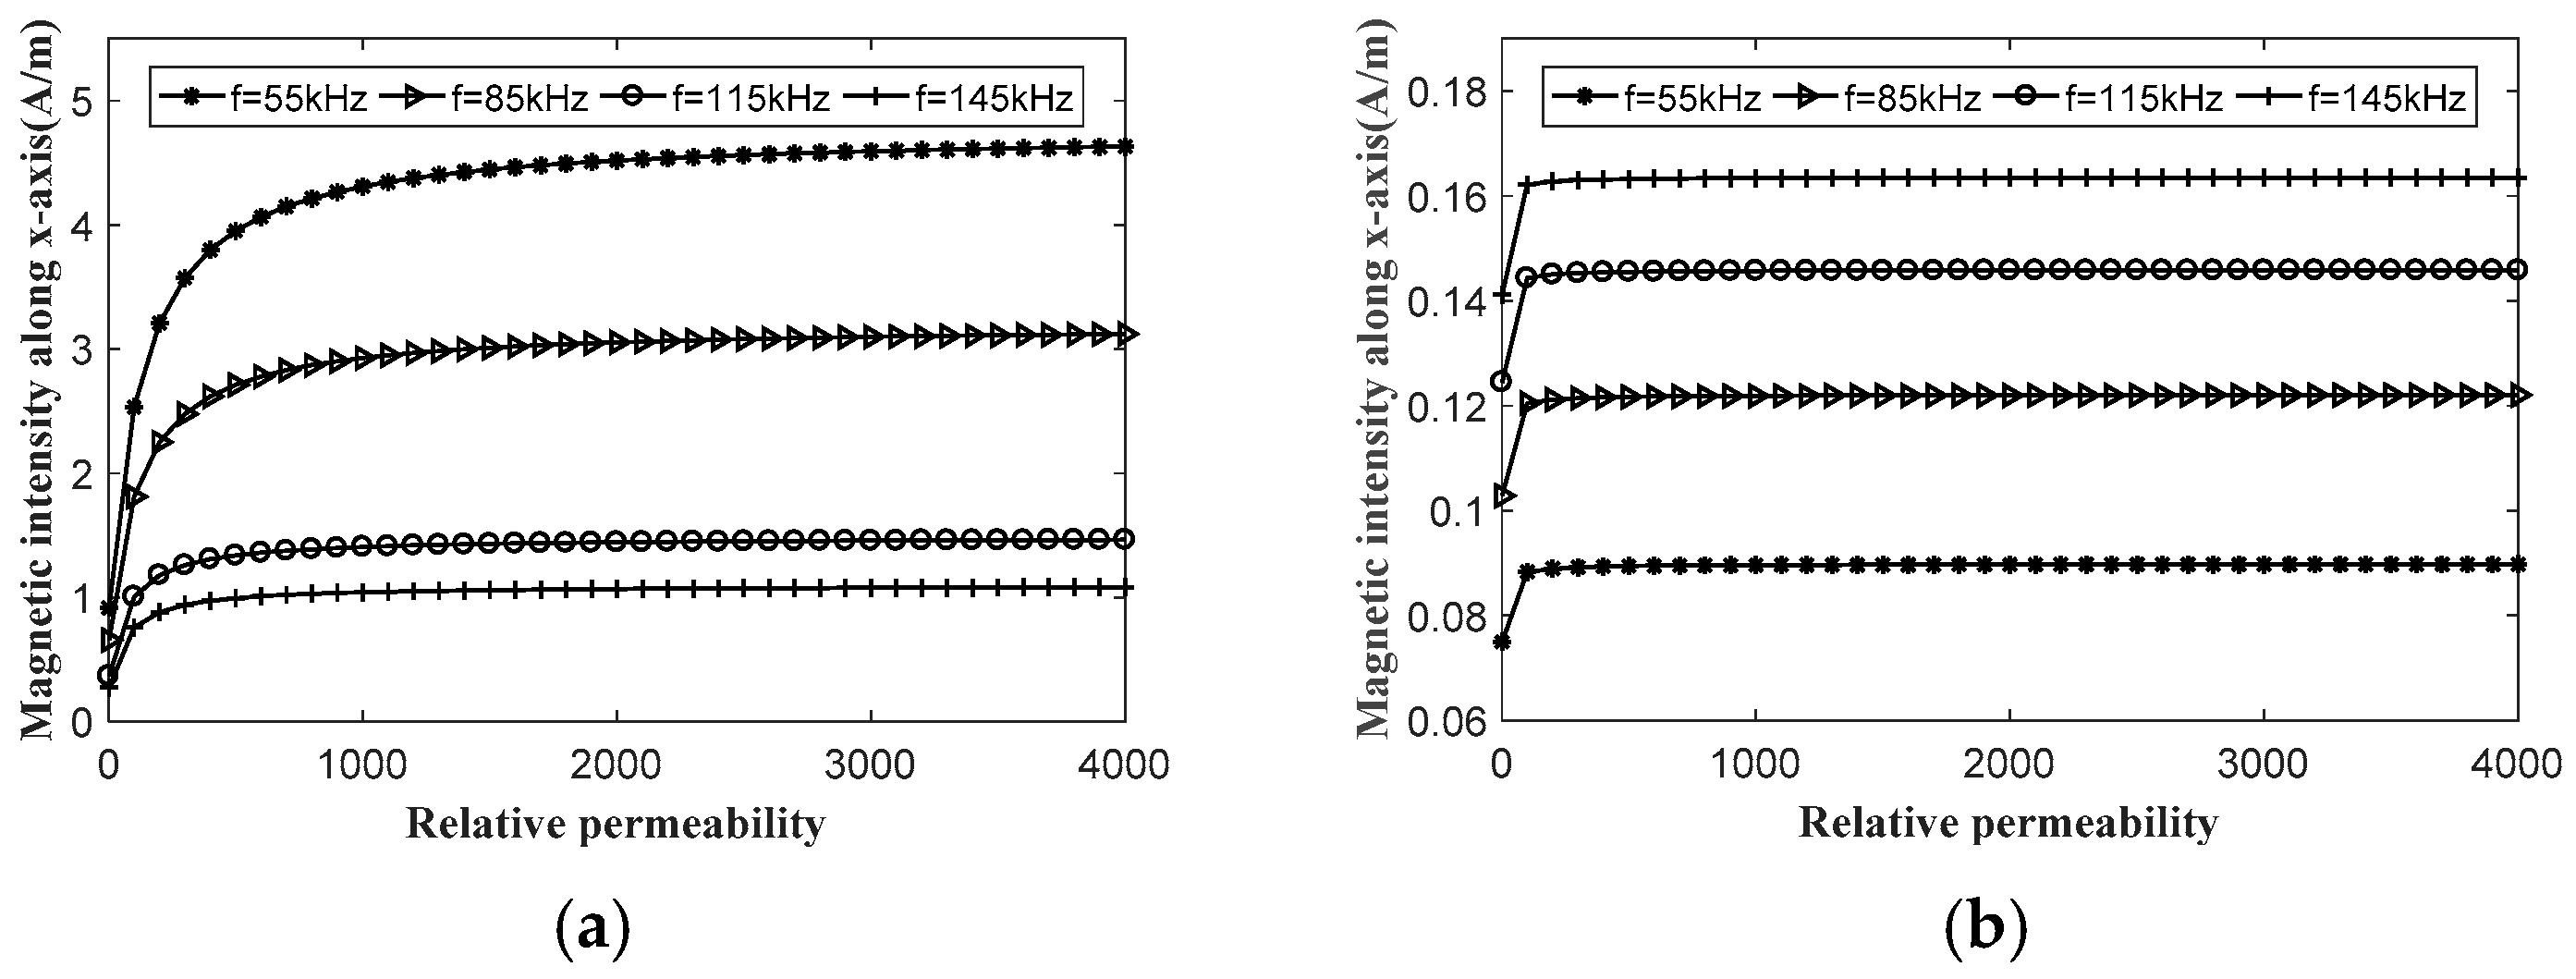
Figure 11.
MPTs with the SMPs of different thicknesses: (a) The magnetic field intensity in Line 1 in wave generation; and (b) the magnetic field intensity in Line 2 in wave detection.
Figure 11.
MPTs with the SMPs of different thicknesses: (a) The magnetic field intensity in Line 1 in wave generation; and (b) the magnetic field intensity in Line 2 in wave detection.
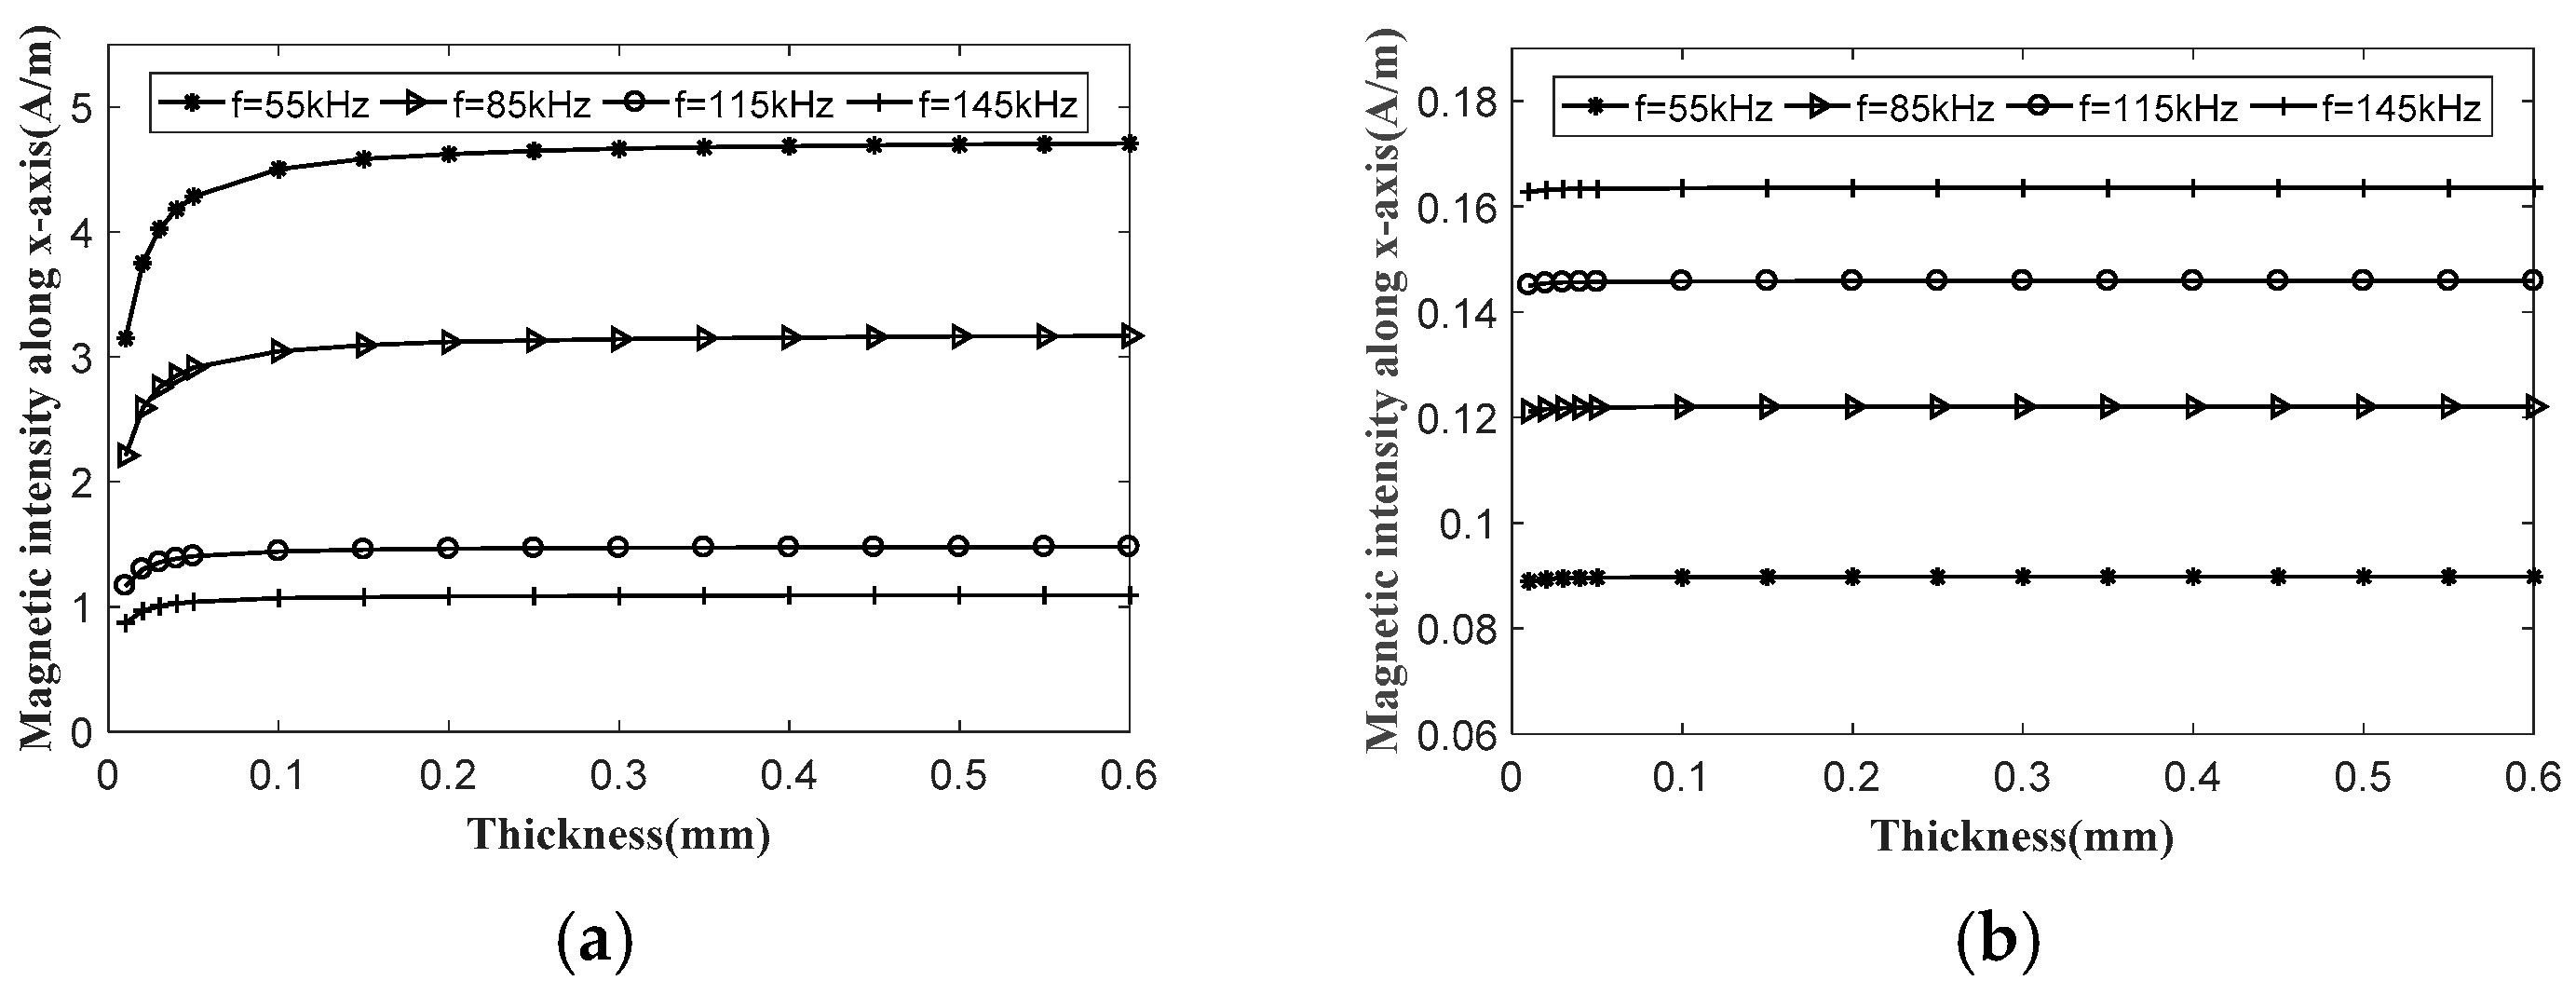
Figure 12.
MPTs with the SMPs of different lift-off distances: (a) The magnetic field intensity in Line 1 in wave generation; and (b) the magnetic field intensity in Line 2 in wave detection.
Figure 12.
MPTs with the SMPs of different lift-off distances: (a) The magnetic field intensity in Line 1 in wave generation; and (b) the magnetic field intensity in Line 2 in wave detection.

Figure 13.
The diagram of the experiments for transducer improvement with the SMP.
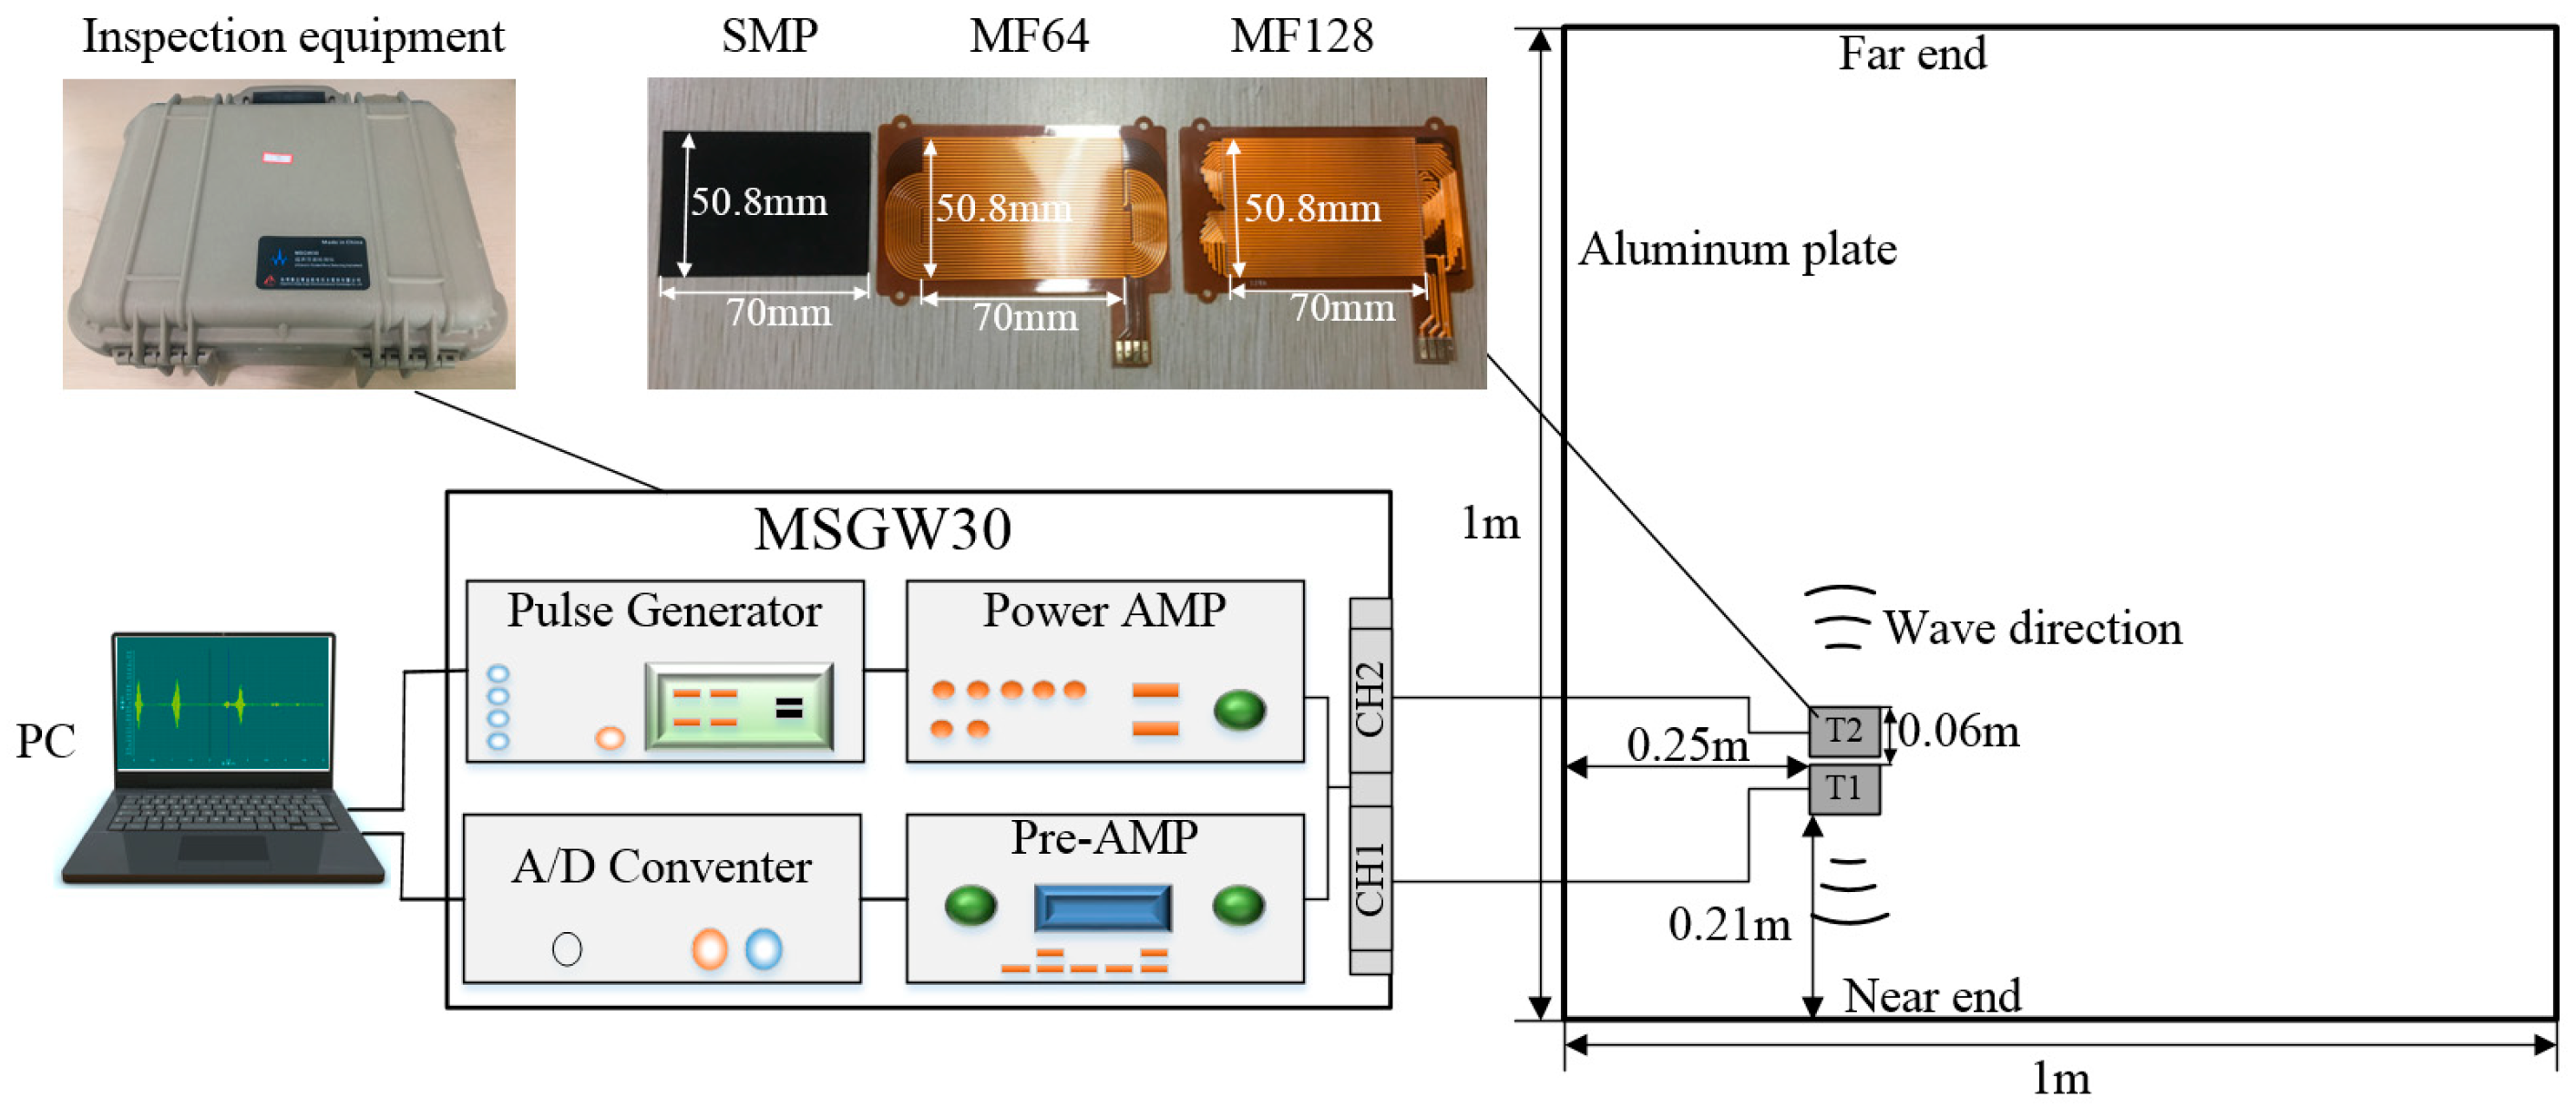
Figure 14.
Original signals of the cases in which T1 and T2 both were with and without the SMPs at 85 kHz. T1 was an actuator and T2 was a sensor.
Figure 14.
Original signals of the cases in which T1 and T2 both were with and without the SMPs at 85 kHz. T1 was an actuator and T2 was a sensor.
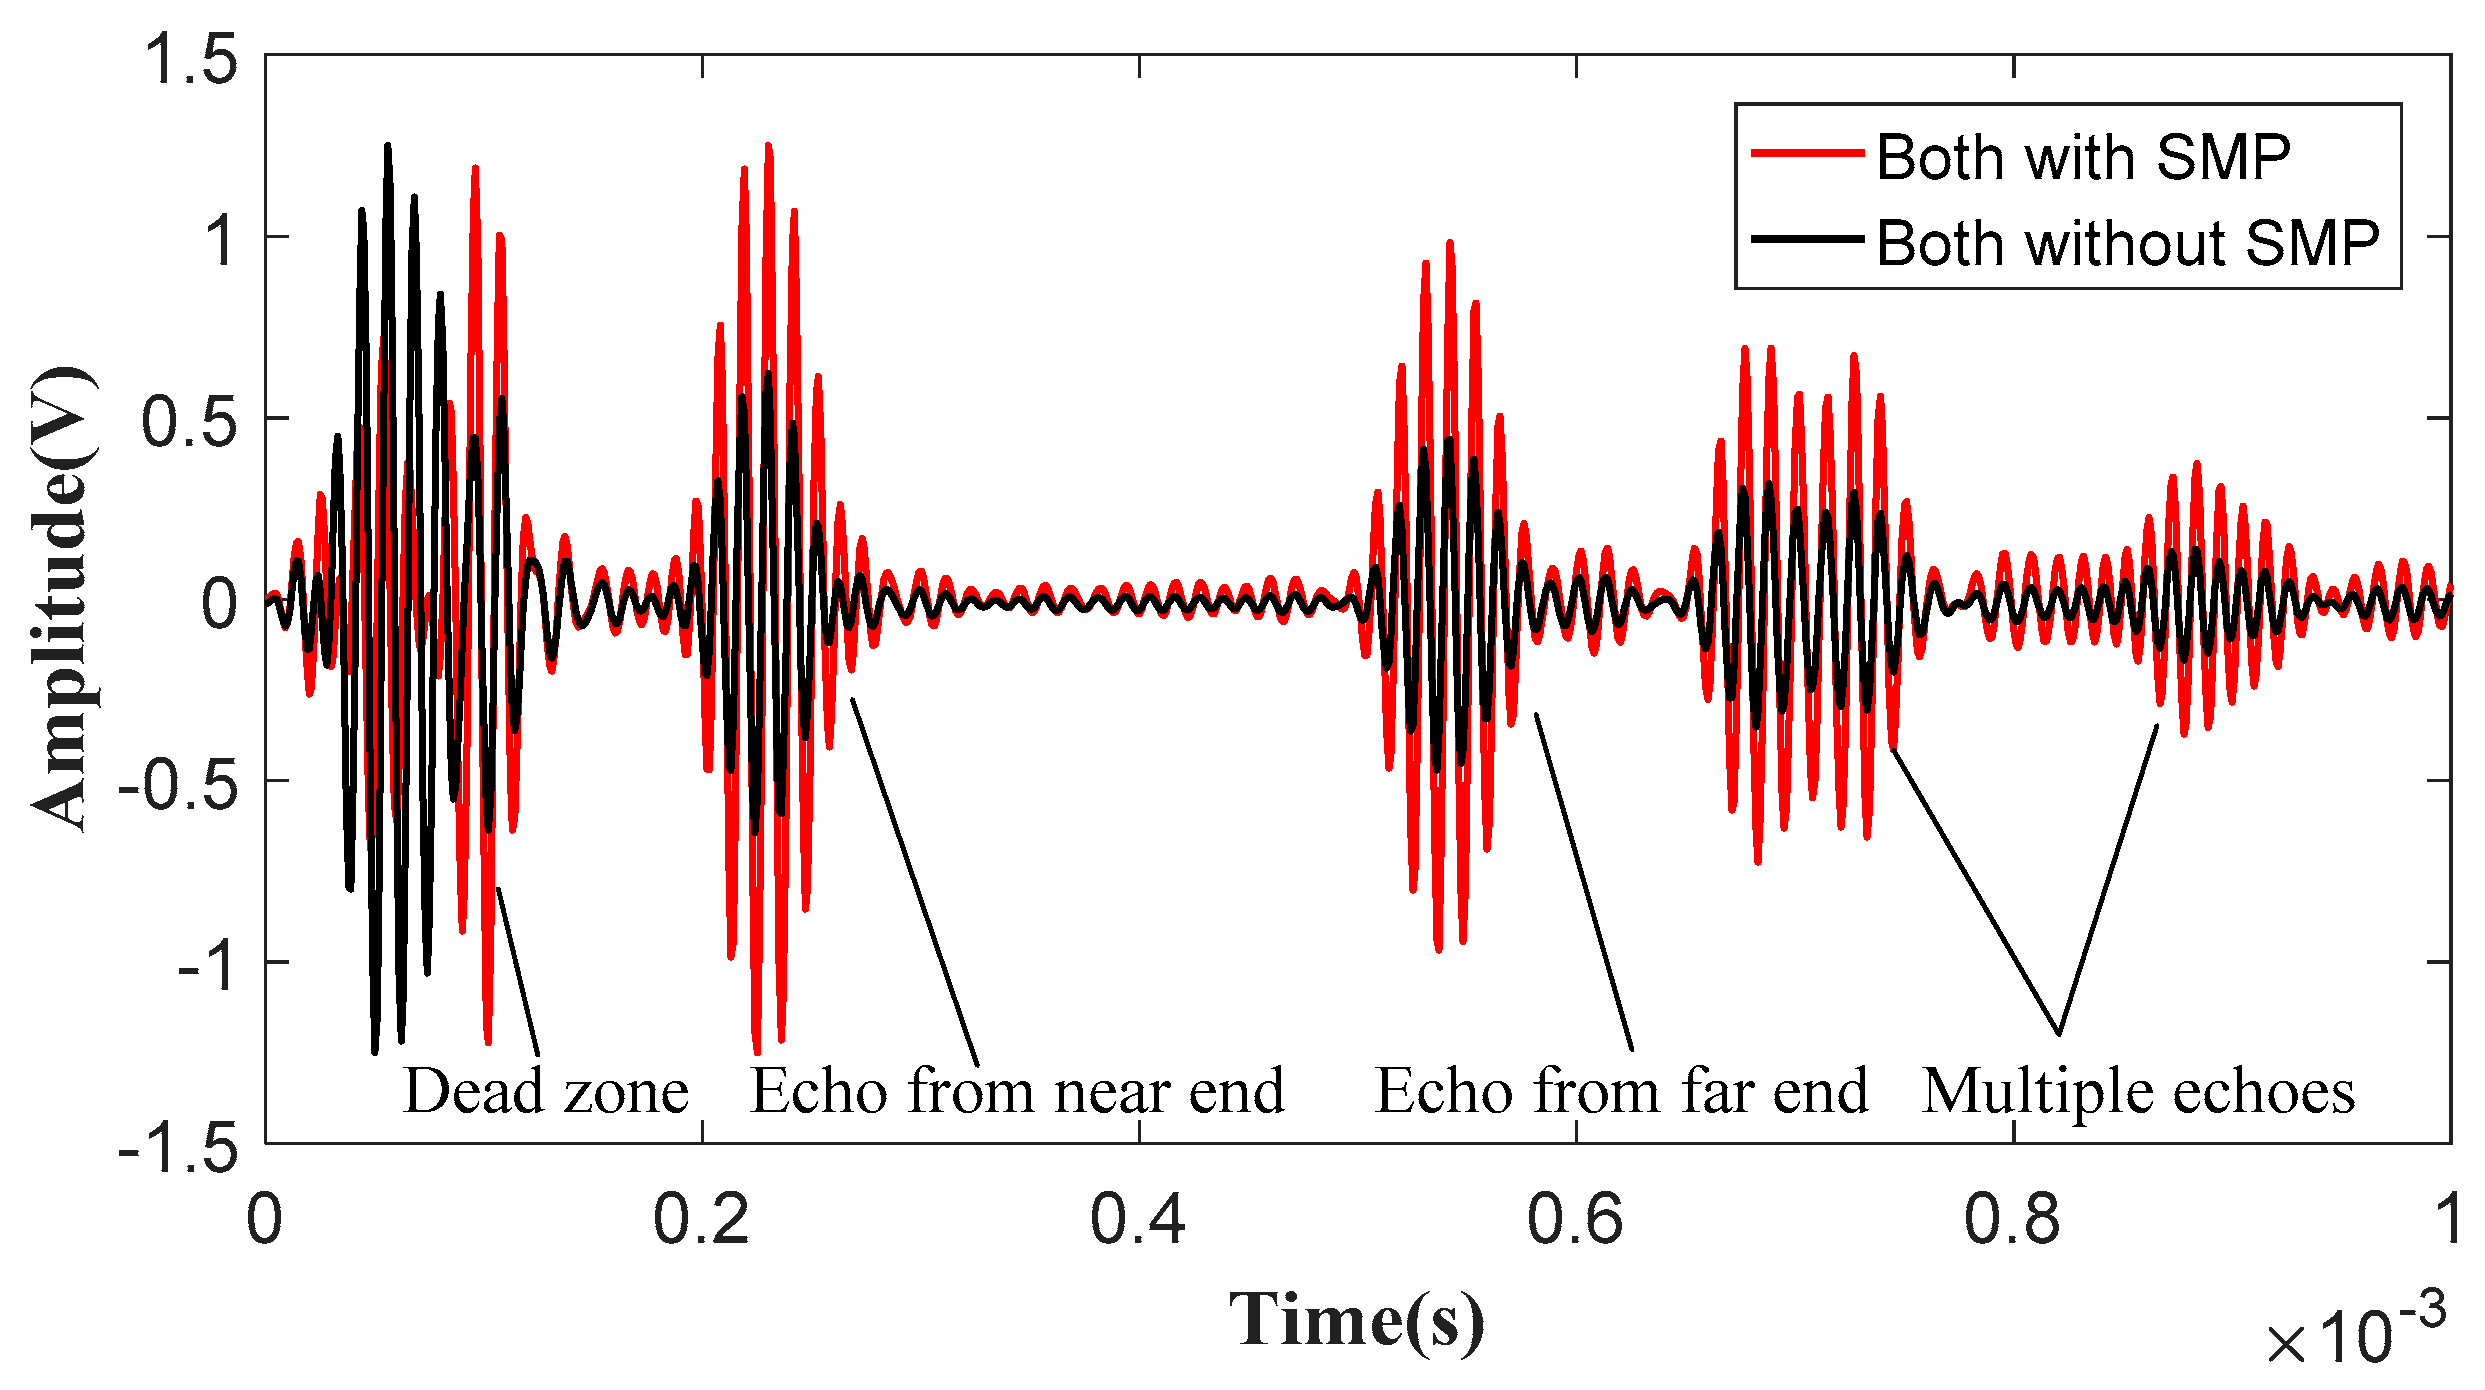
Figure 15.
Amplitude magnification for the MPTs in wave generation and detection with the SMPs at different frequencies. T1 was an actuator and T2 was a sensor.
Figure 15.
Amplitude magnification for the MPTs in wave generation and detection with the SMPs at different frequencies. T1 was an actuator and T2 was a sensor.
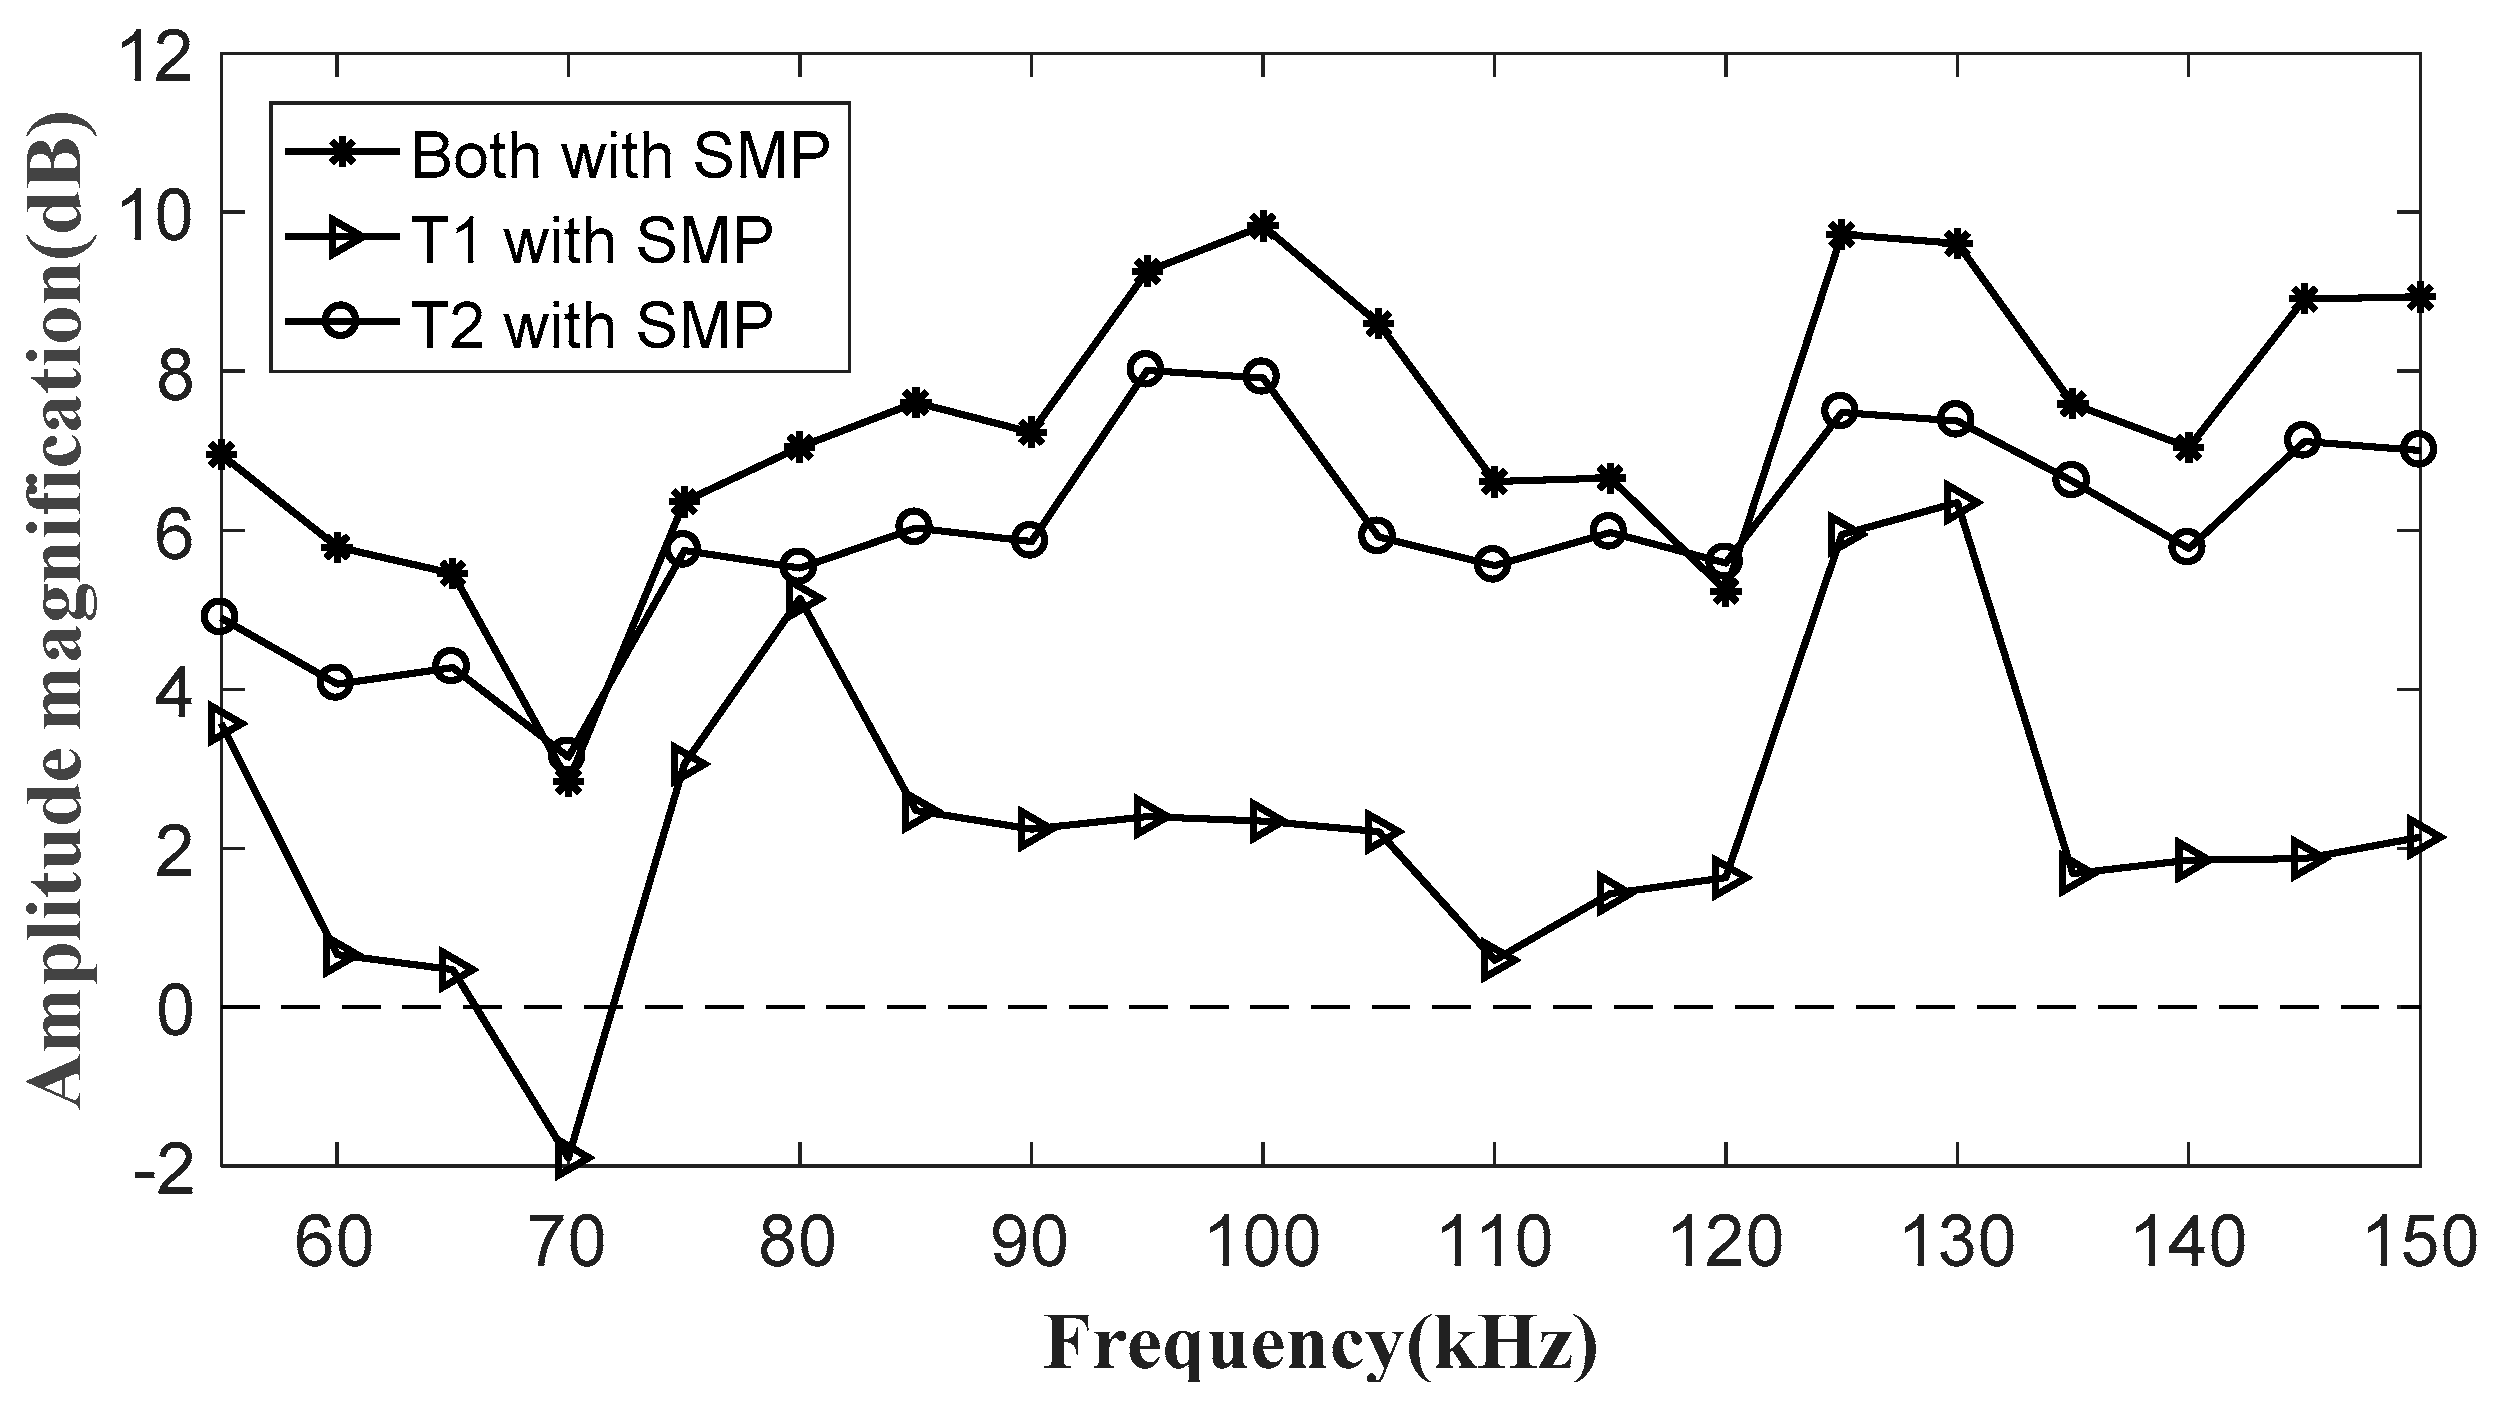
Figure 16.
Amplitude magnifications for the MPT with multiple layers of SMPs at different frequencies. T1 was an actuator and sensor.
Figure 16.
Amplitude magnifications for the MPT with multiple layers of SMPs at different frequencies. T1 was an actuator and sensor.

Figure 17.
Amplitude magnification for the magnetostrictive patch transducer with different lift-off distances of the SMP at several typical frequencies. T1 was an actuator and sensor.
Figure 17.
Amplitude magnification for the magnetostrictive patch transducer with different lift-off distances of the SMP at several typical frequencies. T1 was an actuator and sensor.

Table 1.
Material properties in the simulation.
| Material Name | Air | Aluminum | Copper | Fe–Co Alloy | Mn–Zn Ferrite |
|---|---|---|---|---|---|
| Relative permeability | 1 | 1 | 1 | 2000 | 2800 |
| Conductivity (S/m) | 0 | 3.774 × 10⁷ | 5.988 × 10⁷ | 2.5 × 10⁶ | 0.17 |
© 2019 by the authors. Licensee MDPI, Basel, Switzerland. This article is an open access article distributed under the terms and conditions of the Creative Commons Attribution (CC BY) license (http://creativecommons.org/licenses/by/4.0/).
Share and Cite
MDPI and ACS Style
Wu, J.; Tang, Z.; Yang, K.; Lv, F. Signal Strength Enhancement of Magnetostrictive Patch Transducers for Guided Wave Inspection by Magnetic Circuit Optimization. Appl. Sci. 2019, 9, 1477. https://doi.org/10.3390/app9071477
AMA Style
Wu J, Tang Z, Yang K, Lv F. Signal Strength Enhancement of Magnetostrictive Patch Transducers for Guided Wave Inspection by Magnetic Circuit Optimization. Applied Sciences. 2019; 9(7):1477. https://doi.org/10.3390/app9071477
Chicago/Turabian StyleWu, Jianjun, Zhifeng Tang, Keji Yang, and Fuzai Lv. 2019. "Signal Strength Enhancement of Magnetostrictive Patch Transducers for Guided Wave Inspection by Magnetic Circuit Optimization" Applied Sciences 9, no. 7: 1477. https://doi.org/10.3390/app9071477
Note that from the first issue of 2016, this journal uses article numbers instead of page numbers. See further details here.