An Accuracy-Efficiency-Power Consumption Hybrid Optimization Method for CNC Milling Process


1
Department of Mechanical Engineering, Chung Yuan Christian University, Taoyuan 32023, Taiwan
2
Technology Center, Walsin Lihwa Corporation, Taipei 110, Taiwan
*
Author to whom correspondence should be addressed.
Appl. Sci. 2019, 9(7), 1495; https://doi.org/10.3390/app9071495
Submission received: 3 March 2019
/
Revised: 6 April 2019
/
Accepted: 8 April 2019
/
Published: 10 April 2019
(This article belongs to the Special Issue Precision Dimensional Measurements)
Abstract
:This study proposes a hybrid optimization method which can help users to find optimal cutting parameters which will provide better efficiency and lower power consumption for a milling process. Empirical models including performance-power consumption characteristic curves of servo motors were built, and an optimization algorithm adopting the empirical models with procedure guiding function was developed. The empirical models were built based on the measurements from planned machining experiments with different combination of machining parameters including spindle speed, feedrate, and chip load, etc. After integrating the models and algorithm, an optimization system with human machine interface, which has procedure guiding function, was developed. The system can recommend optimal machining parameters for a milling process for shorter machining time and lower electricity costs based on the original machining parameters. Finally, cutting experiments were conducted to verify the proposed system, and the results showed that the proposed method can effectively enhance efficiency by 42.06% and save 34.74% in machining costs through reducing machining time and electrical power consumption.
1. Introduction
Increasing power efficiency in production is a prime target for many companies, for a number of different reasons. Power consumption is an important factor in operating cost. An efficiency power consumption system with high-performance output and higher productivity requiring less power is expected. In machine tool production, Computer Numerical Control (CNC) machine is usually used to produce the precision product. When the machining capacity is higher and machining time is longer, significantly higher power consumption will occur. In the past, enterprises use the shortest machining time to increase machine utilization and productivity. However, the shortest machining time does not always mean the lowest cost, because more power consumption is needed to finish the machining in a shorter time. As known, the energy crisis is accelerating, and energy costs are rapidly increasing so it will be beneficial if machining time was shorter and simultaneously, the power consumption lower. Moreover, most of the factories and power companies have signed an electric power contract, so if electricity consumption exceeds the contract, the cost of electricity will be greatly increased. Therefore, if the machine power consumption characteristics can be known, it can help the planning of production scheduling and cost.
In recent years, research on power consumption has grown rapidly. Gontarz et al. [1] introduced a new physical modeling method to predict the effects of power consumption and thermal effect for different modes of the turning machine tool and its components. A modeling framework was established and used to simulate power consumption. Abdoli et al. [2] explored the relationship between cutting parameters and machine power consumption. The power consumption model was established based on this relationship, and the model can be used for production line planning. Diaz et al. [3] estimated the cutting power consumption and spindle motor power consumption through an empirical formula. Mori et al. [4] suggested reducing the power consumption by reducing the machining time or synchronizing the spindle speed acceleration/deceleration and the feedrate system. Draganescu et al. [5] proposed a model to calculate power consumption, machine efficiency and material removal rate for metal cutting. To establish the relationship between the above parameters, the experimental data and response surface methodology (RSM) were used. Kara et al. [6] proposed an empirical model to describe the relationship between power consumption of the material removal process and process variables. The power consumption model for calculating the material removal rate and the amount of cutting was developed.
To carry out the above development, extensive experimental research and data analysis of machine power consumption characteristics are necessary. Many companies will collect various data, such as production data, quality data, production environment data, etc., to analyze production management and develop decision based policy. However, the enterprises rarely collect production parameters and power consumption data for analysis. Hence, when an enterprise wants to control power consumption, they lack the necessary data support. Although some enterprises are concerned about power consumption, it is manually collected and calculated. In addition, the power consumption data acquisition and analysis method is lacking. Some researches related to process monitoring have developed, for example, Dimla et al. [7] used various sensor signals to develop cutting monitoring of metal cutting. Usui et al. [8] proposed an analytical method based on orthogonal cutting data for machining and tool wear characteristics, to predict various tool shape and cutting conditions. Prickett et al. [9] used a machine controller to monitor the process and detect tool breakage signals. Cai et al. [10] proposed a feedback method to predict tool wear, milling error and online compensation. Li et al. [11] used sensor technology to detect tool wear and faults, and predict the impact of tool wear to surface quality. Choi et al. [12] used an intelligent online system to monitor tool wear.
Although some researches on power consumption have been performed, they usually only focus on power consumption or processing independently, and still lack a method which can synchronously optimize the machining accuracy, production efficiency, and power saving. The objective of this research is to establish the hybrid optimization of machining accuracy, production efficiency, and power consumption. The characteristics of motor power consumption during machining were investigated. Furthermore, the relationship between machining parameters and motor power consumption was created. Moreover, the optimization algorithm of production efficiency and power saving was built. Finally, the hybrid optimization system was created by using Visual C# language. With this system, the user can import the Numerical Control (NC) program to optimize the parameters. Then the system will analyze and calculate the optimal machining time, power consumption, and recommend the machining parameters for better efficiency, lower power consumption, with the same product quality.
2. Algorithm and Method
To determine the optimal machining parameters for better machining efficiency and lower power consumption without losing machining accuracy, it is necessary to understand the relationship between machine power consumption characteristics, machining parameters, and machining quality. Empirical models were first built based on the data (power consumption vs. motor speed or power consumption vs. machining feedrate) collected from the designed experiments. To separate the influence of cutting in motor power consumption, the data collection experiments were divided into two categories: (1) measurements without cutting load and (2) measurements with cutting load. Based on the collected data, a motor power consumption characteristics model with respect to machining parameters was built. Based on the model, the algorithm to search the machining parameter for shorter machining time and lower power consumption was developed. When a milling process and expected improvement of machining efficiency are given, the associated machining feedrate and spindle speed will be calculated based on the theoretical cutting equation, and used as initial values to search based on the motor power consumption characteristics model for the optimal parameters which have a lower motor power consumption.
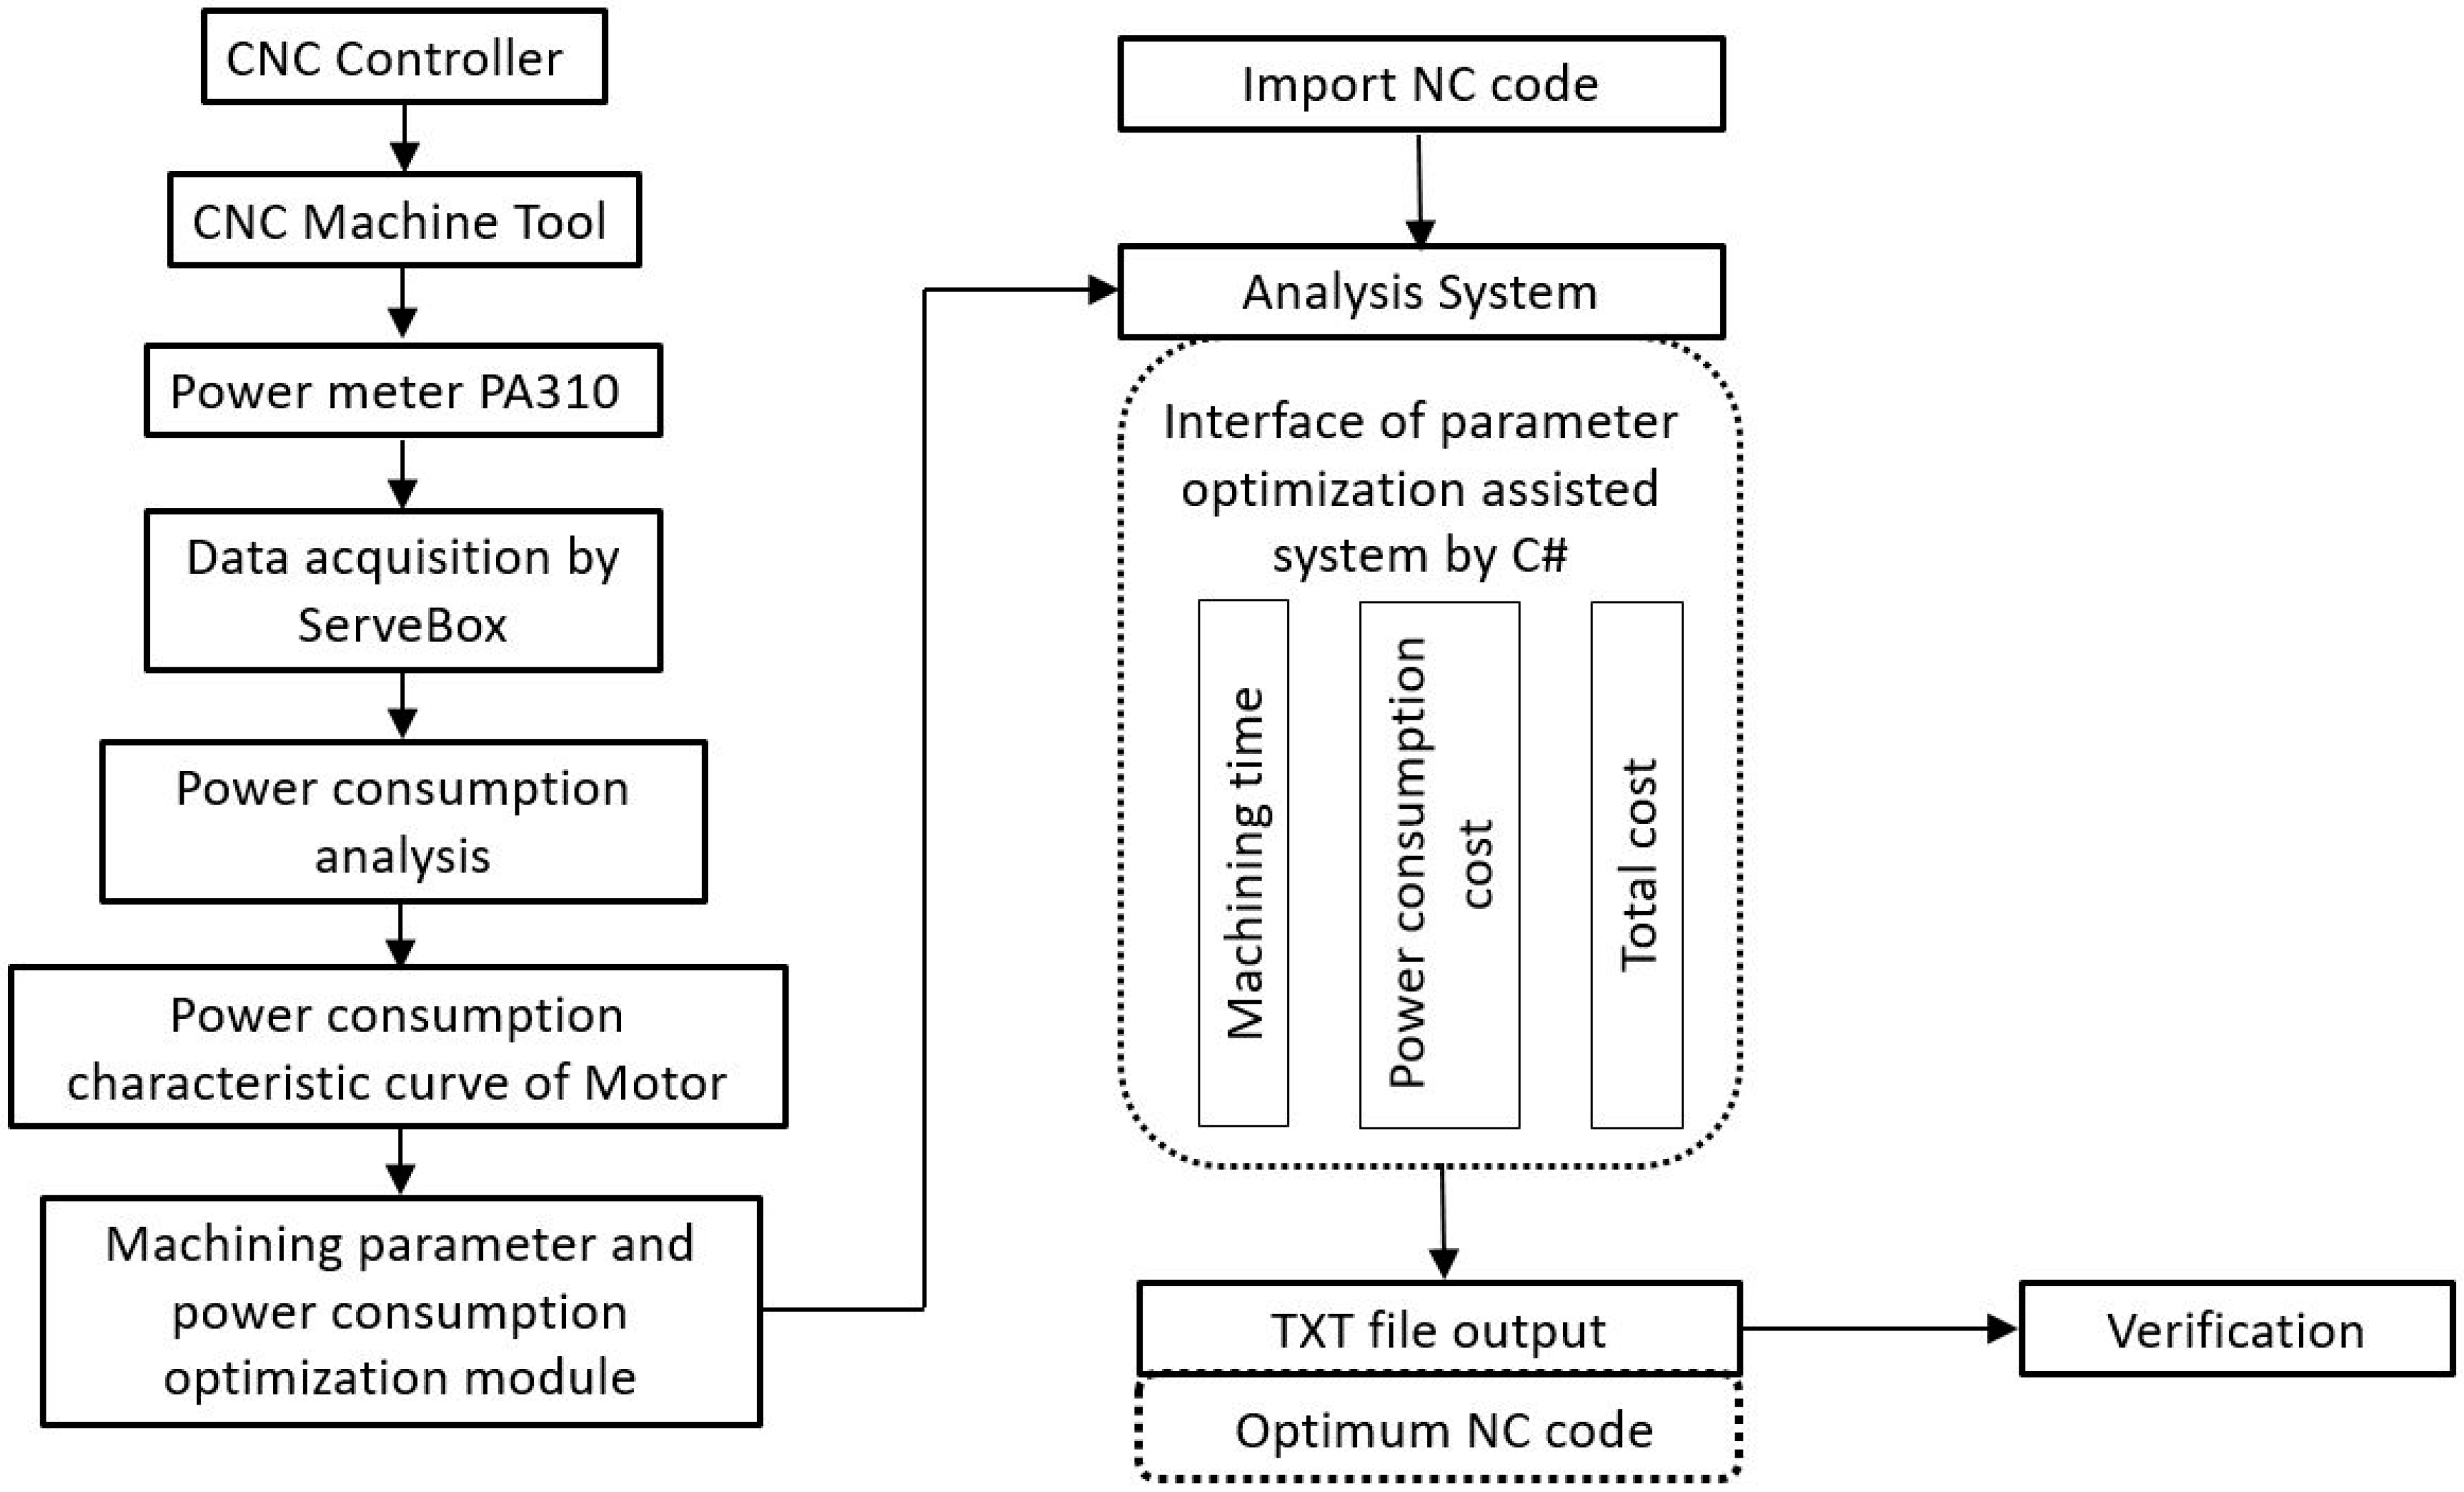
To analyze the relationship between electrical power consumption and machining conditions, the investigation and analysis of spindle motor and servo motor were important. The analysis process, first, used various machining parameters to observe the motor power consumption to understand the motor characteristics and power consumption, then established the relationship model between machining parameters and power consumption, the synchronous optimization algorithm of production efficiency and power consumption was established, and a human machine interface (HMI) was designed, to become the optimization manufacturing assisted system. The main function is the optimization of machining parameters to obtain power and production efficiency without decreasing the machining accuracy. Figure 1 shows the flowchart of the research.
Different materials with different machining conditions will cause different electrical power consumption, and the reasonable chip load of the cutter for different materials will be different too. Although the method and algorithm proposed in this study can be applied to different materials, the performance–power consumption characteristic curves of servo motors (such as power consumption vs. motor speed, or power consumption vs. machining feedrate) need to be investigated and built for different materials as core important data/information for implementation.
2.1. Optimization of Power Consumption
The cutting speed in the cutting process is proportional to the spindle motor speed, and the cutting feedrate is proportional to the servo motor speed. To shorten the machining time for improving machining efficiency, the feedrate of the servo motor needs to be increased. However, increasing the feedrate of the servo motor will increase the chip load and cutting resistance, hence, it will affect the tool life and machining accuracy. To avoid this effect, the spindle speed needs to be increased at the same time, so the chip load is kept maintained. However, the increasing of spindle speed and feedrate cause an increase in power consumption. In this study, power consumption is measured for different spindle speeds, then the influence of machining parameters on machine power consumption is created for the establishment of an optimized design algorithm.
According to the spindle speed–motor power consumption characteristic curve and feedrate–motor power consumption characteristic curve, the model of the relationship between machining parameters and power consumption can be established by the polynomial curve fitting method, then analyzed to determine the influence of each parameter on machine power consumption and the influence of the combination of parameters on machine power consumption. To reduce machining time by increasing the servo feedrate (i.e., increasing the servo motor speed) without affecting the tool life and machining accuracy, it is necessary to maintain the cutting load per tooth (chip load), so the spindle speed needs to be increased.
In the optimization procedure, first of all, the user needs to roughly define the expected increase of feedrate for better machining efficiency, and the system will then search the optimal feedrate close to the expected feedrate, which has lower electrical power consumption for the related servo motors, based on the pre-built empirical model. After the optimal feedrate is selected, the spindle speed is calculated to remain the same chip load for the cutter to avoid deteriorating the cutter life. Since the optimal feedrate was selected based on the goal of efficiency improvement, the optimal combination of parameters can provide better efficiency, better electrical power consumption, and almost the same tool life. The relationship of chip load, spindle speed, and feedrate is expressed in Equation (1).
where CP is the chip load (mm/tooth), F is the feedrate (mm/min), N is the spindle speed (rpm), and z is the number of teeth.
When optimizing machining, the required spindle speed is entered to the machining parameters–power consumption module to calculate the power consumption change. To make the power saving and machining cost of production easy to understand for industry, the machine power consumption is converted into electricity cost. The machining efficiency can be determined as machining cost saving, which can be obtained by multiply the machining time saving and machining cost as shown in Equation (2).
where Mcr is machining cost saving, Mt is machining time saving (hr), and hr is machining cost (NTD/hr).
Figure 2 shows the optimization algorithm of machining and power consumption. If the electricity cost of the shortened machining time exceeds the basic electricity cost, the system re-finds the machining parameters to obtain optimal machining efficiency and power consumption based on Equation (1) and the spindle speed–motor power consumption module and the feedrate–motor power consumption module. The final machining time must be less than the initial machining time to achieve lower cost.
After establishing the empirical models the for relationship between machining parameters and power consumption, an optimization system was developed in visual C# language. The user can enter the machining information (such as original NC program, machining precision requirement, tool diameter, etc.) and the expected improvement in machining efficiency from the human machine interface (HMI). After that, the system will automatically calculate the recommended optimal machining parameters. In the procedure, the system will guide the user to enter the expected feedrate for optimization, and then the system will re-calculate and find the optimal machining parameters. Finally, the optimal parameters will be saved as a CSV file or TXT file, and meanwhile, the parameters can also be uploaded to the cloud database with a JSON data format. Through the Ethernet and Fanuc Open CNC API Specification (FOCAS), two-way communication between the CNC machine controller and hybrid optimization module was established for data acquisition and transferring command to the CNC controller of a machine tool.
2.2. Hybrid Optimization System
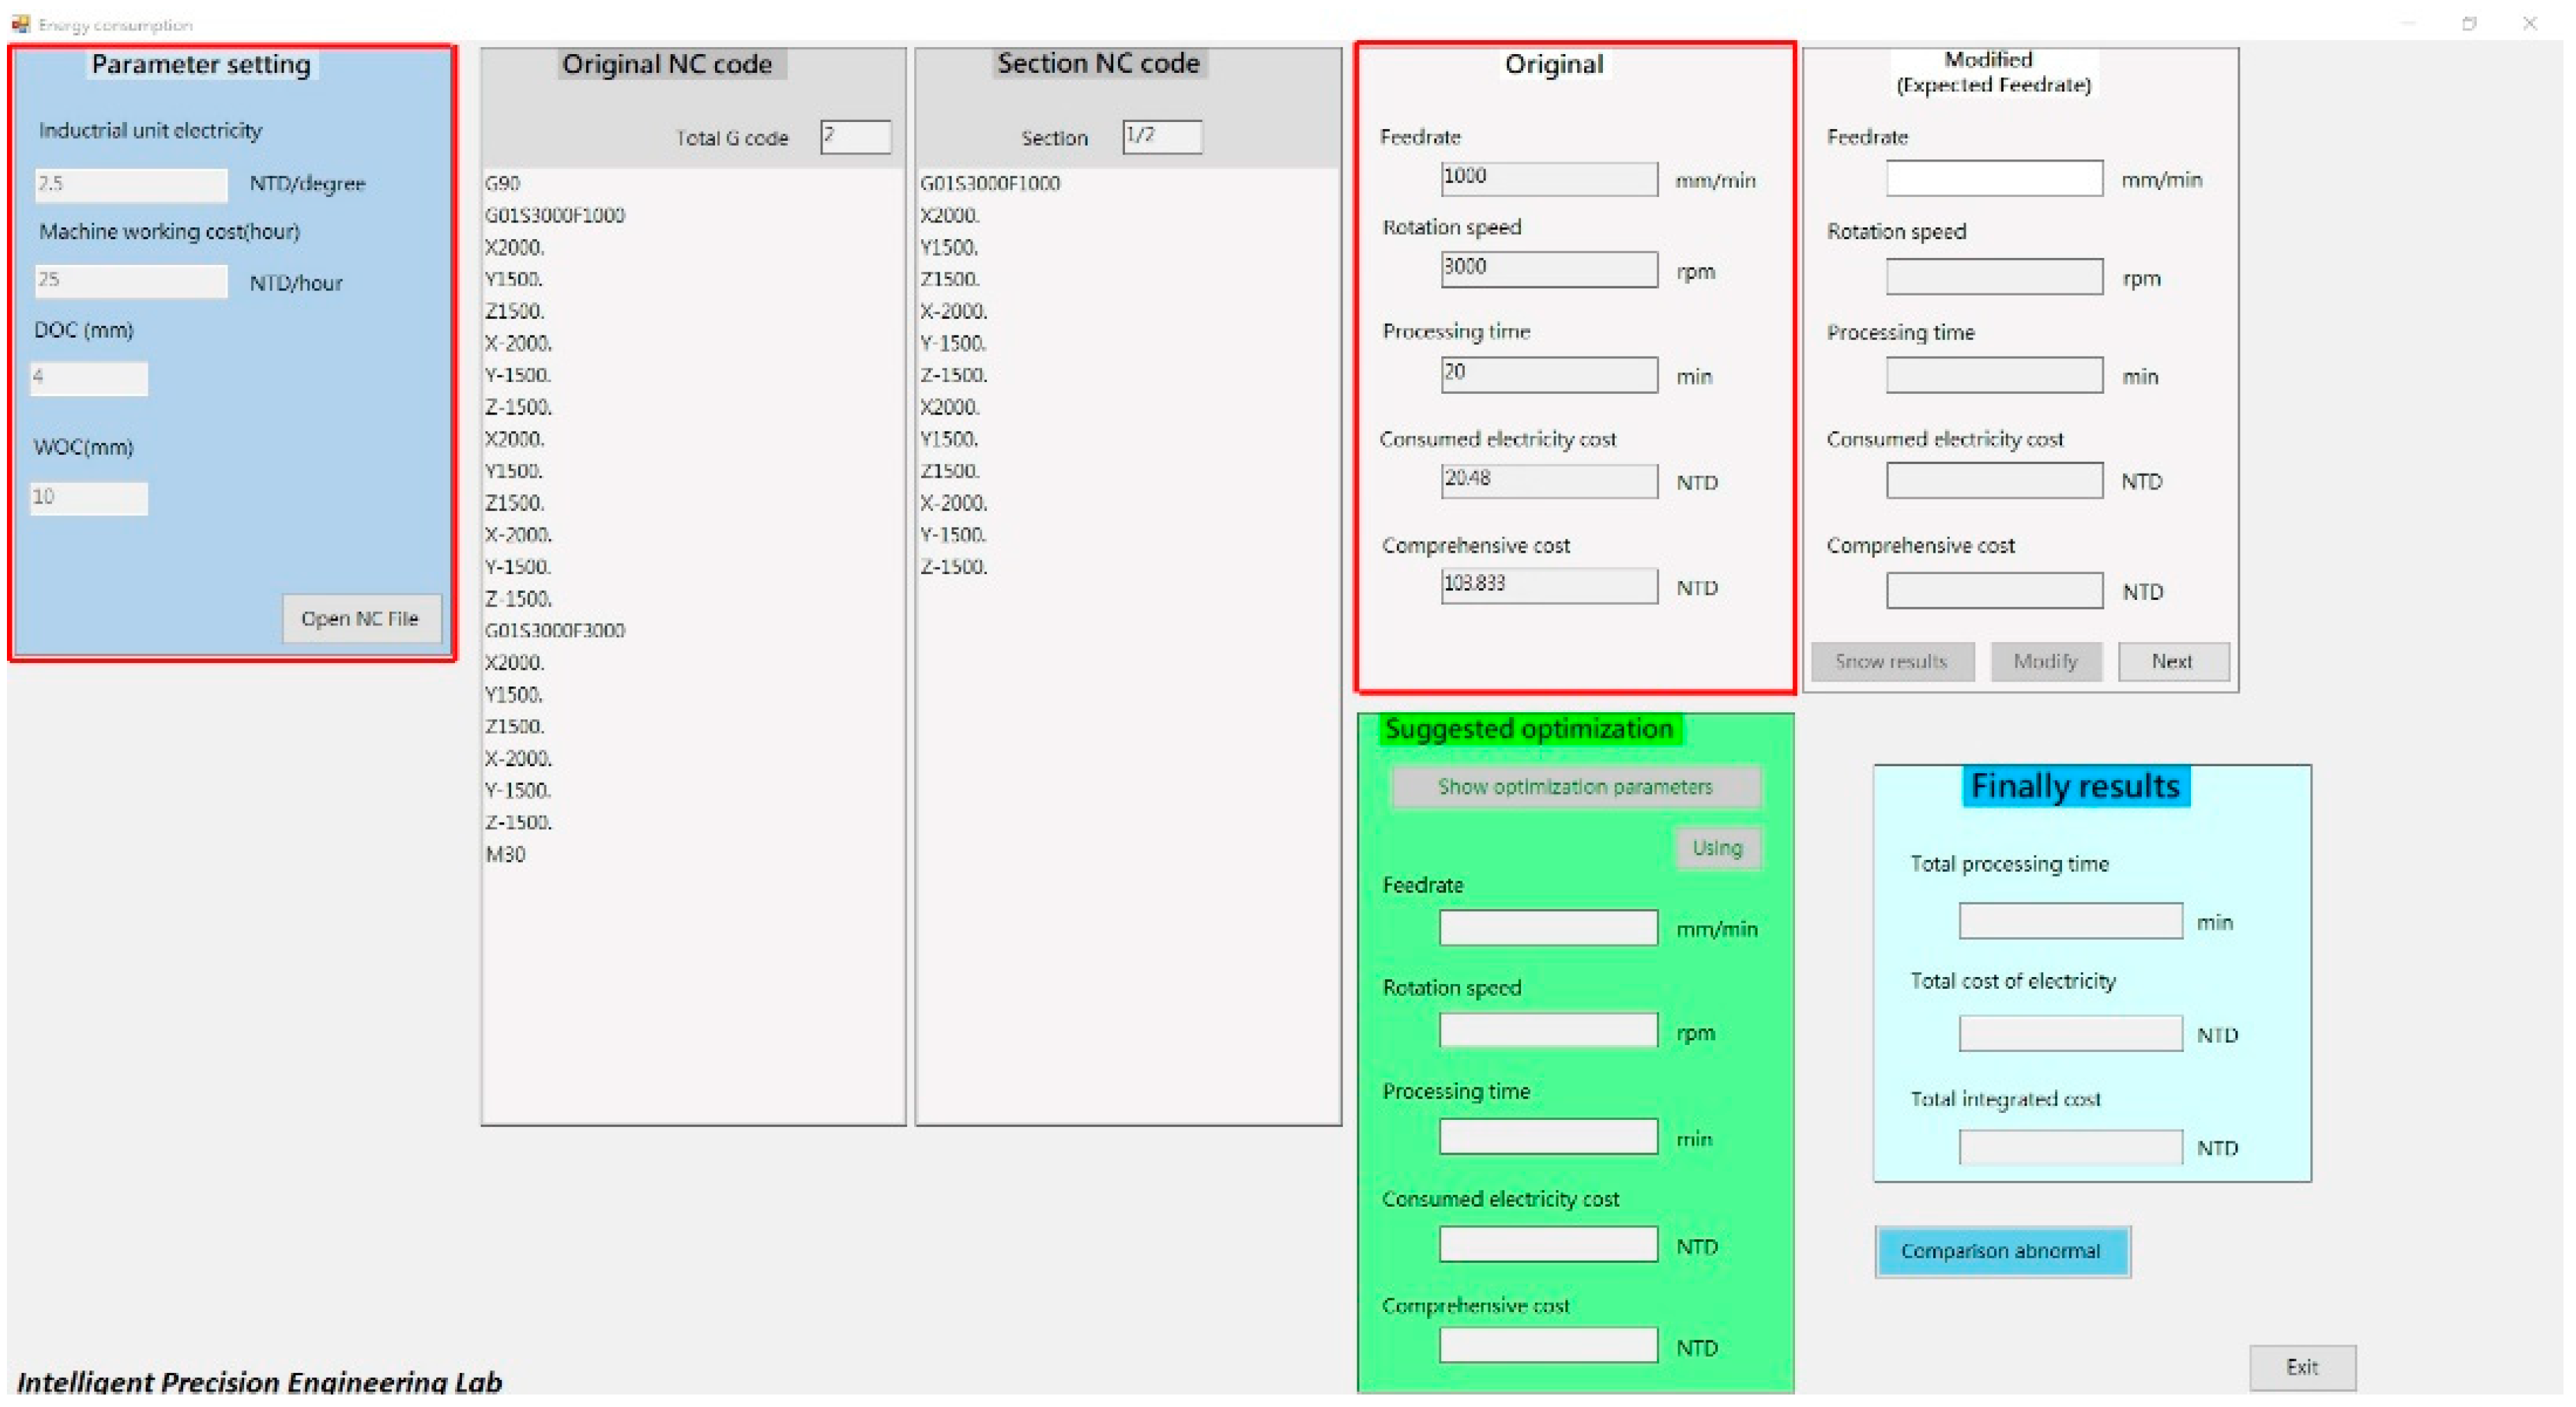
The HMI is designed and becomes the optimization manufacturing assisted system. The system can calculate the machining time, machining cost, and total cost as shown in Figure 3. The user needs to input regular electricity fees, base machining costs, and NC program, then the system will calculate the amount of three axes movements, and according to feedrate–power consumption model, analyze the machining time, machining cost, and total cost. The machining cost is calculated from power consumption (kW) multiplied machining time (hr). The user can enter the required machining parameters according their needs, then the system will calculate the machining time as shown in Figure 3. The system can recommend optimal parameters, and the user can select this recommended parameter and directly modify and export the optimized parameters as the NC program.
3. Experiments
3.1. Experiment Design
Basically, higher speed will produce higher power consumption, so an experiment with various speeds of spindle motor and X-, Y-, Z-axis servo motor were carried out to study the characteristic of the motor power consumption. The experiment was divided into two parts: without cutting load and with cutting load conditions. Assuming that the spindle motor speed sets 500 until 3000 RPM with the increasing step of 500, a power consumption measurement is performed for the spindle motor under these spindle speeds, to obtain the relationship between spindle speed and power consumption. Similarly, assuming that the servo feedrate sets 200, 500, 1000, 1500, 2000, 2500, 3000, 3500, 4000, 4500, 5000, 5500, 6000 mm/min, a power consumption measurement is performed for the servo motor under these servo feedrates, to obtain the relationship between servo feedrate and power consumption.
For investigation of power consumption with cutting load, because of different cutting conditions, the cutting load is also different, hence, the motor will have different power consumptions. Therefore, different cutting parameters were taken to investigate the relationship between cutting loading and power consumption. The cutting conditions are shown in Table 1. The machining parameters are according to the tool material, hardness of workpiece material, milling speed, and material removal rate (MRR). By using the equation , we can obtain the required spindle speed, and using equation , we can obtain the feedrate (mm/min), where V is the milling speed (m/min); D is the diameter of tool (mm); N is the spindle speed (rpm); F is the feedrate (mm/min); f is the material removal rate (mm/t); z is the number of teeth (t).
The machining parameters are shown in Table 2. Eight kinds of spindle speed, three kinds of feedrate, three kinds of feed per tool were taken, so a total of 24 combinations of parameters. Each parameter was tested five times.
3.2. Instrument and Data Acquisition
A CNC horizontal milling machine Dah Lih MCH-500 with X, Y, Z axis stroke 750×680×600 mm, spindle maximum speed 10,000 rpm, equipped with Fanuc controller is used in this experiment. The spindle and three servo motor power consumption are captured using Archmeter PA310 power meter. The power meters PA310 (hereinafter referred to as the power meter) were mounted on the spindle and three servo motor of R, S, T wire. RS232 cable is used to connect the motors and computer, then the power consumption data are captured via Servebox and stored in the computer.
4. Results and Discussions
From the experiment data, the analysis was conducted to investigate the relationship between cutting parameters and power consumption, and, thus, establish the regression equation using the polynomial regression method to achieve the purpose of optimizing machining efficiency and low power consumption.
4.1. Power Consumption Analysis without Cutting Load
According to the experiment scheme in the previous section, the experimental data can be divided into spindle and three servo motors. In the spindle experiments, six machining parameters were taken from 500 to 3000 rpm, with an increasing step every 500 rpm. The power consumption for each spindle speed parameter is shown in Figure 4. The experiment 1 to 3 and 4 to 6 were measured on different dates. It showed each power consumption value is very close to each other, around 0.00006 to 0.00009 kW. The power consumption does not significantly increase when the spindle speed increases. The reason is perhaps that the spindle is only in the idle state rather than the cutting state, so there is no cutting resistance, hence, increasing the spindle speed will not significantly affect the spindle power consumption.
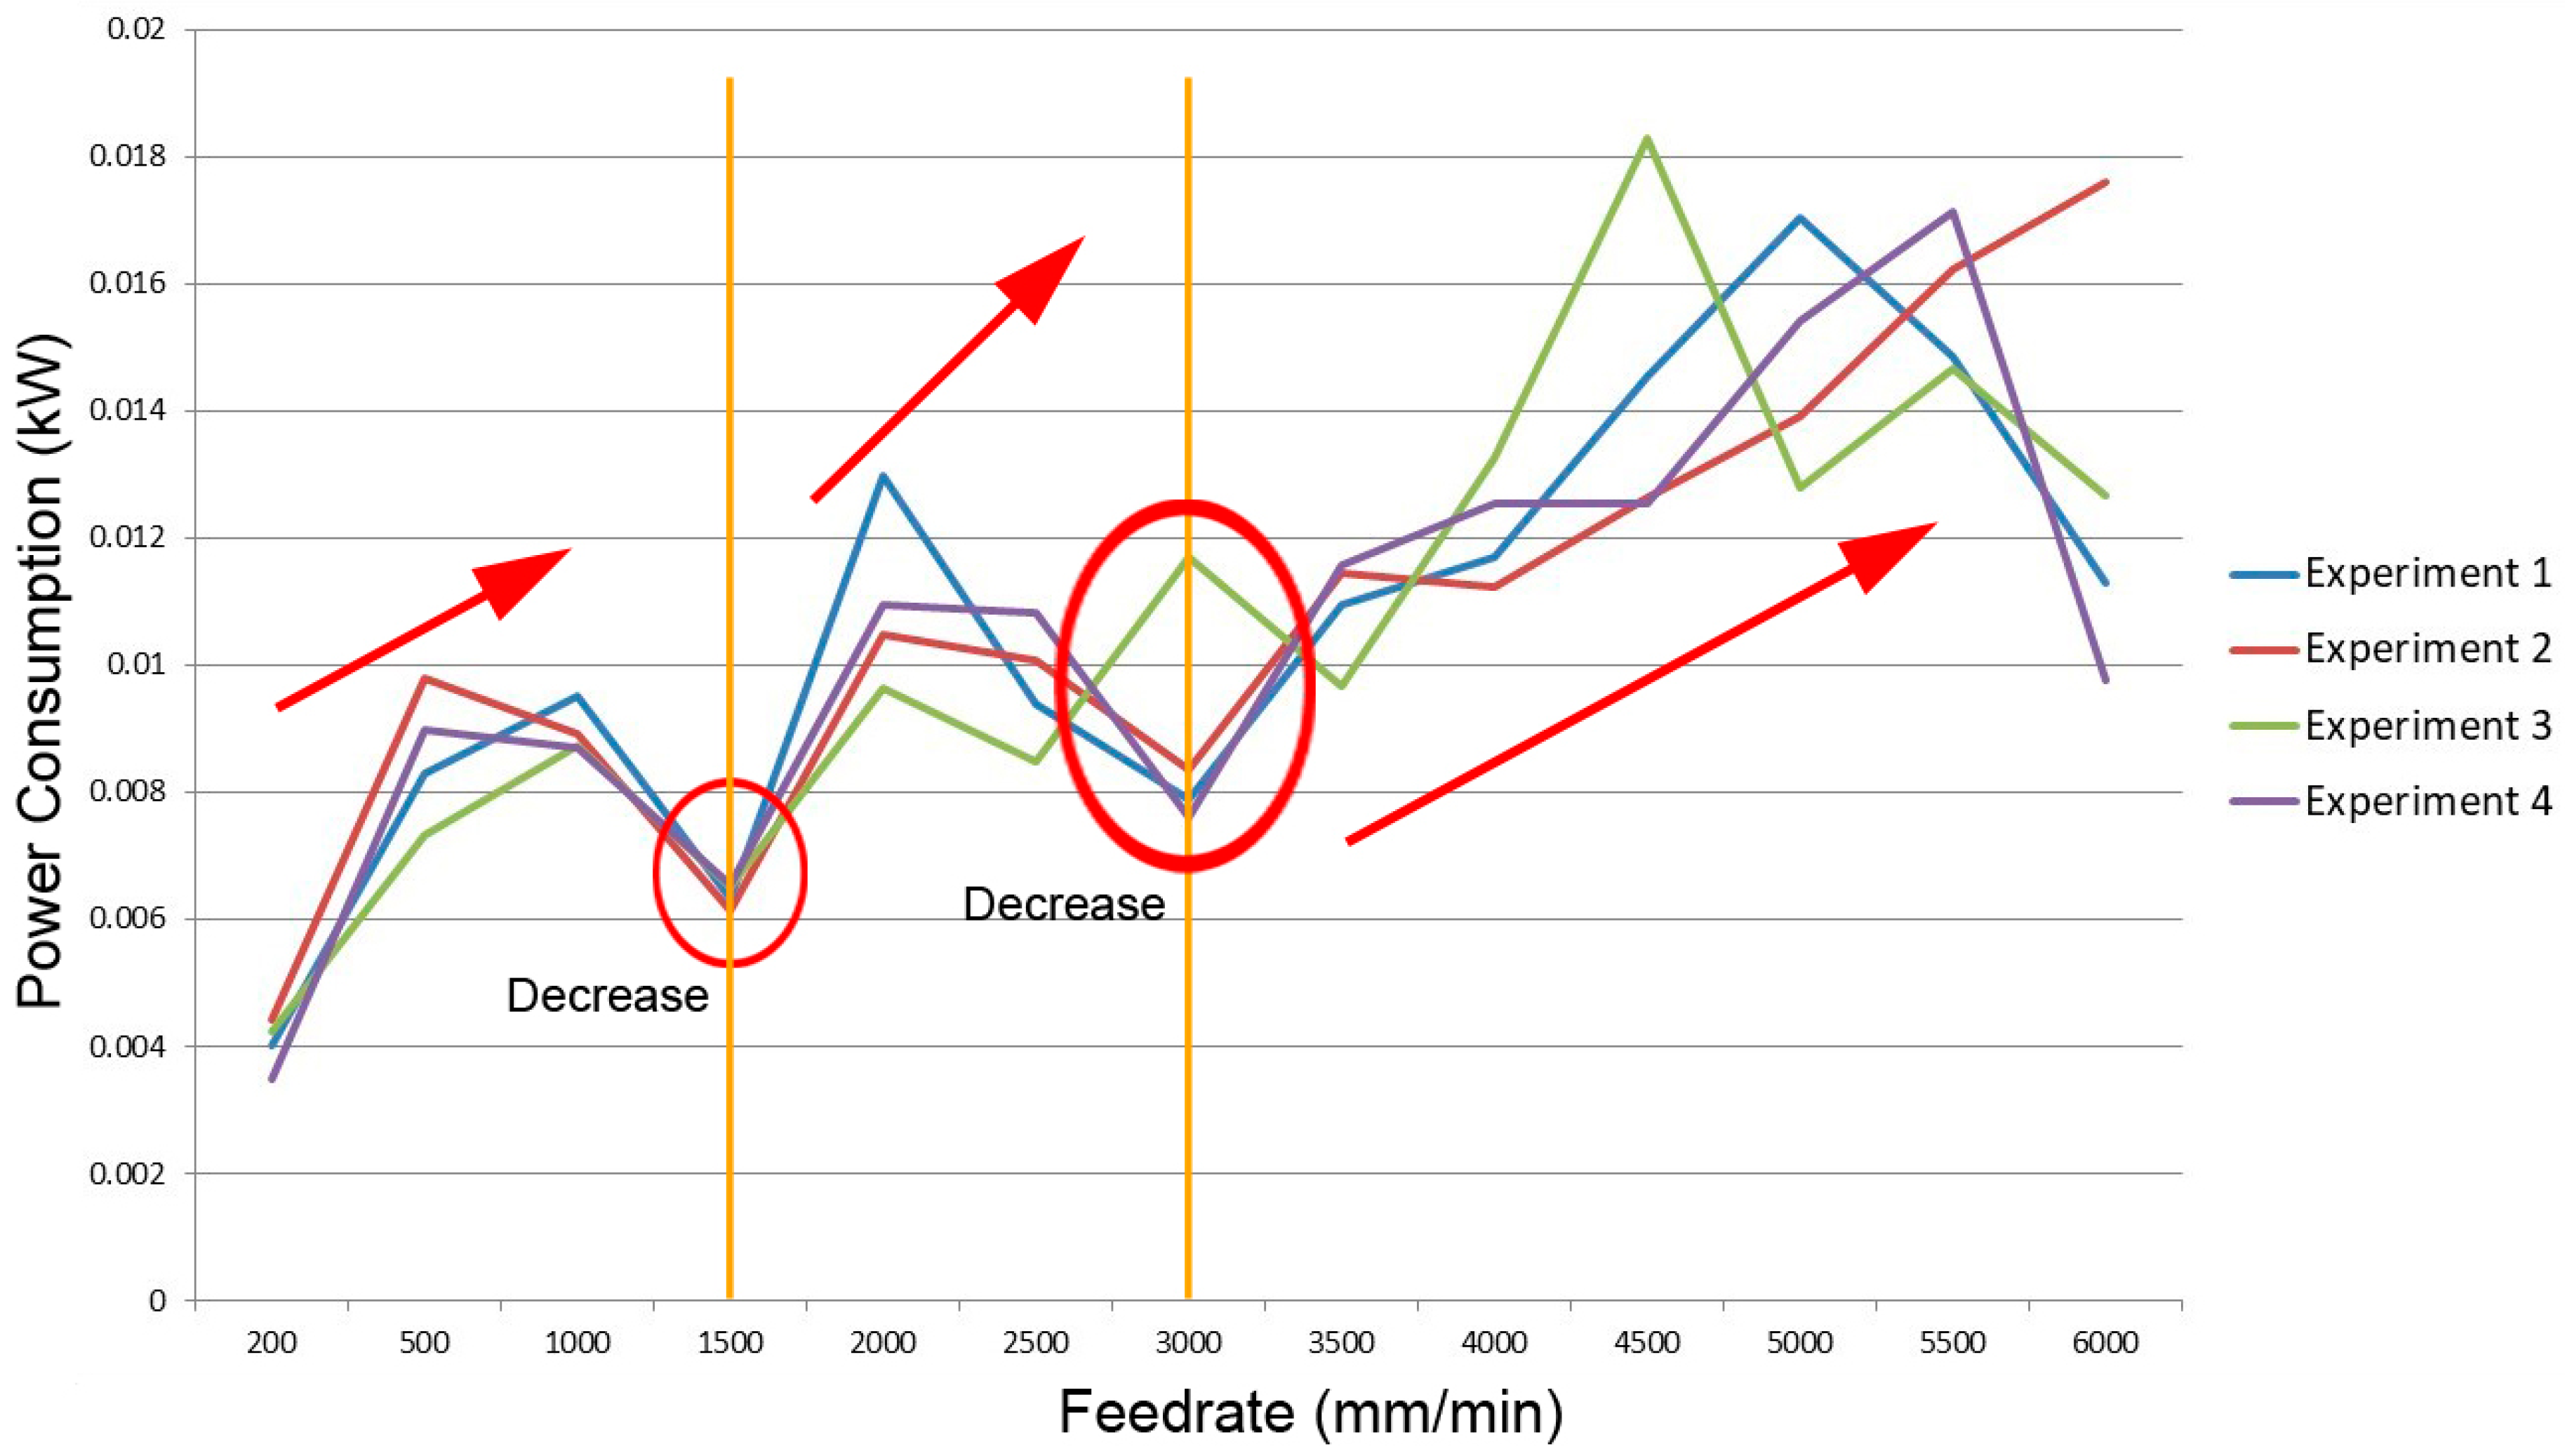
For X-axis servo motor, 13 combinations of feedrate were carried out from 200 mm/min until 6000 mm/min. The ommencinh feedrate was 200 mm/min and after 500 mm/min, the feedrate was increased every 500 mm/min up to 6000 mm/min. Figure 5 shows the resulting power consumption for different feedrates. The experiment was repeated three times, and the results were reproducible. However, only a few of data showed a difference of about 0.005 kW, even at the feedrate of 4500 mm/min, the maximum difference was 0.01 kW. As seen in Figure 5, the power consumption increase rate is about 0.00125 kW per 500mm/min when the feedrate is 200 to1500 mm/min, but at feedrate of 2000 mm/min it reduces. When the feedrate is in the range of 2000 to 4000 mm/min, the power consumption trend is higher with an increase rate of about 0.0025 kW per 500 mm/min. However, at the feedrate of 4000 mm/min the power consumption is significantly reduced, but in the feedrate range of 4500 to 6000 mm/min the power consumption rises quickly with increasing value of 0.005 kW per 500 mm/min. The increasing trend is higher than the first two feedrate sections. It can be concluded that increasing feedrate will increase power consumption, but when the feedrate is 2000 mm/min and 4500 mm/min the power consumption is lower. Moreover, it recommends to use these two feedrates to obtain lower power consumption.
Since the power consumption at the feedrate of 4500 mm/min is large, this data is excluded in the average calculation. Figure 6 shows the average calculation result, and each section regression equation can be obtained as follow:
For Y-axis servo motor, the parameter is similar to X-axis servo motor experiment, commencing at 200 mm/min and rising to 6000 mm/min with an increasing step of 500 mm/min. Figure 7 shows the relationship Y-axis motor upward direction with power consumption for different feedrates. It is seen the power consumption rate for feedrate range 200 to 1000 mm/min is about 0.0025 kW per 500 mm/min but smaller at a feedrate of 1500 mm/min. When the feedrate range is between 1500 and 2000 mm/min the power consumption increase rate is 0.005 kW per 500 mm/min, but a feedrate of 2500 to 3000 mm/min exhibits a decreasing trend. When the feedrate is between 3000 and 5500 mm/min the power consumption gradually increases from 0.008 kW up to 0.015 kW. From the results, the power consumption tends to increase with feedrate increase, but a feedrate of 1500 mm/min, 3000 mm/min, and 6000 mm/min showed lower power consumption. Therefore, these three feedrates can be considered to obtain lower power consumption without decrease machining efficiency.
Figure 8 shows the power consumption of Y-axis motor downward direction. It is seen the power consumption at a feedrate of 200 mm/min and 500 mm/min is greater than the feedrate of 1000 to 3500 mm/min. This perhaps is due to the influence of spindle weight. To maintain the low feedrate, the current must be increased to overcome the impact of spindle weight. When the feedrate is over 3500 mm/min, the power consumption increases with the increasing rate of 0.002 kW per 500 mm/min. As seen in Figure 8, the feedrate range of 1000 to 3500 mm/min provided lower power consumption without loss of machining efficiency, so this feedrate range can be considered for machining. Compare to up direction power consumption, the down direction power consumption is lower. This is because more power is needed to overcome spindle weight during toward up.
Figure 9 shows the average calculation of Y-axis up direction power consumption, then the regression equation can be obtained as follows: Equation (6) for a feedrate of 500 to 1500 mm/min, Equation (7) for a feedrate of 1500 to 2000 mm/min, and Equation (8) for a feedrate of 2000 to 6000 mm/min.
Figure 10 shows the average calculation of Y-axis down direction power consumption, and the regression equation can be obtained as follows: Equation (9) for a feedrate of 500 to 3500 mm/min, and Equation (10) for a feedrate of 3500 to 6000 mm/min.
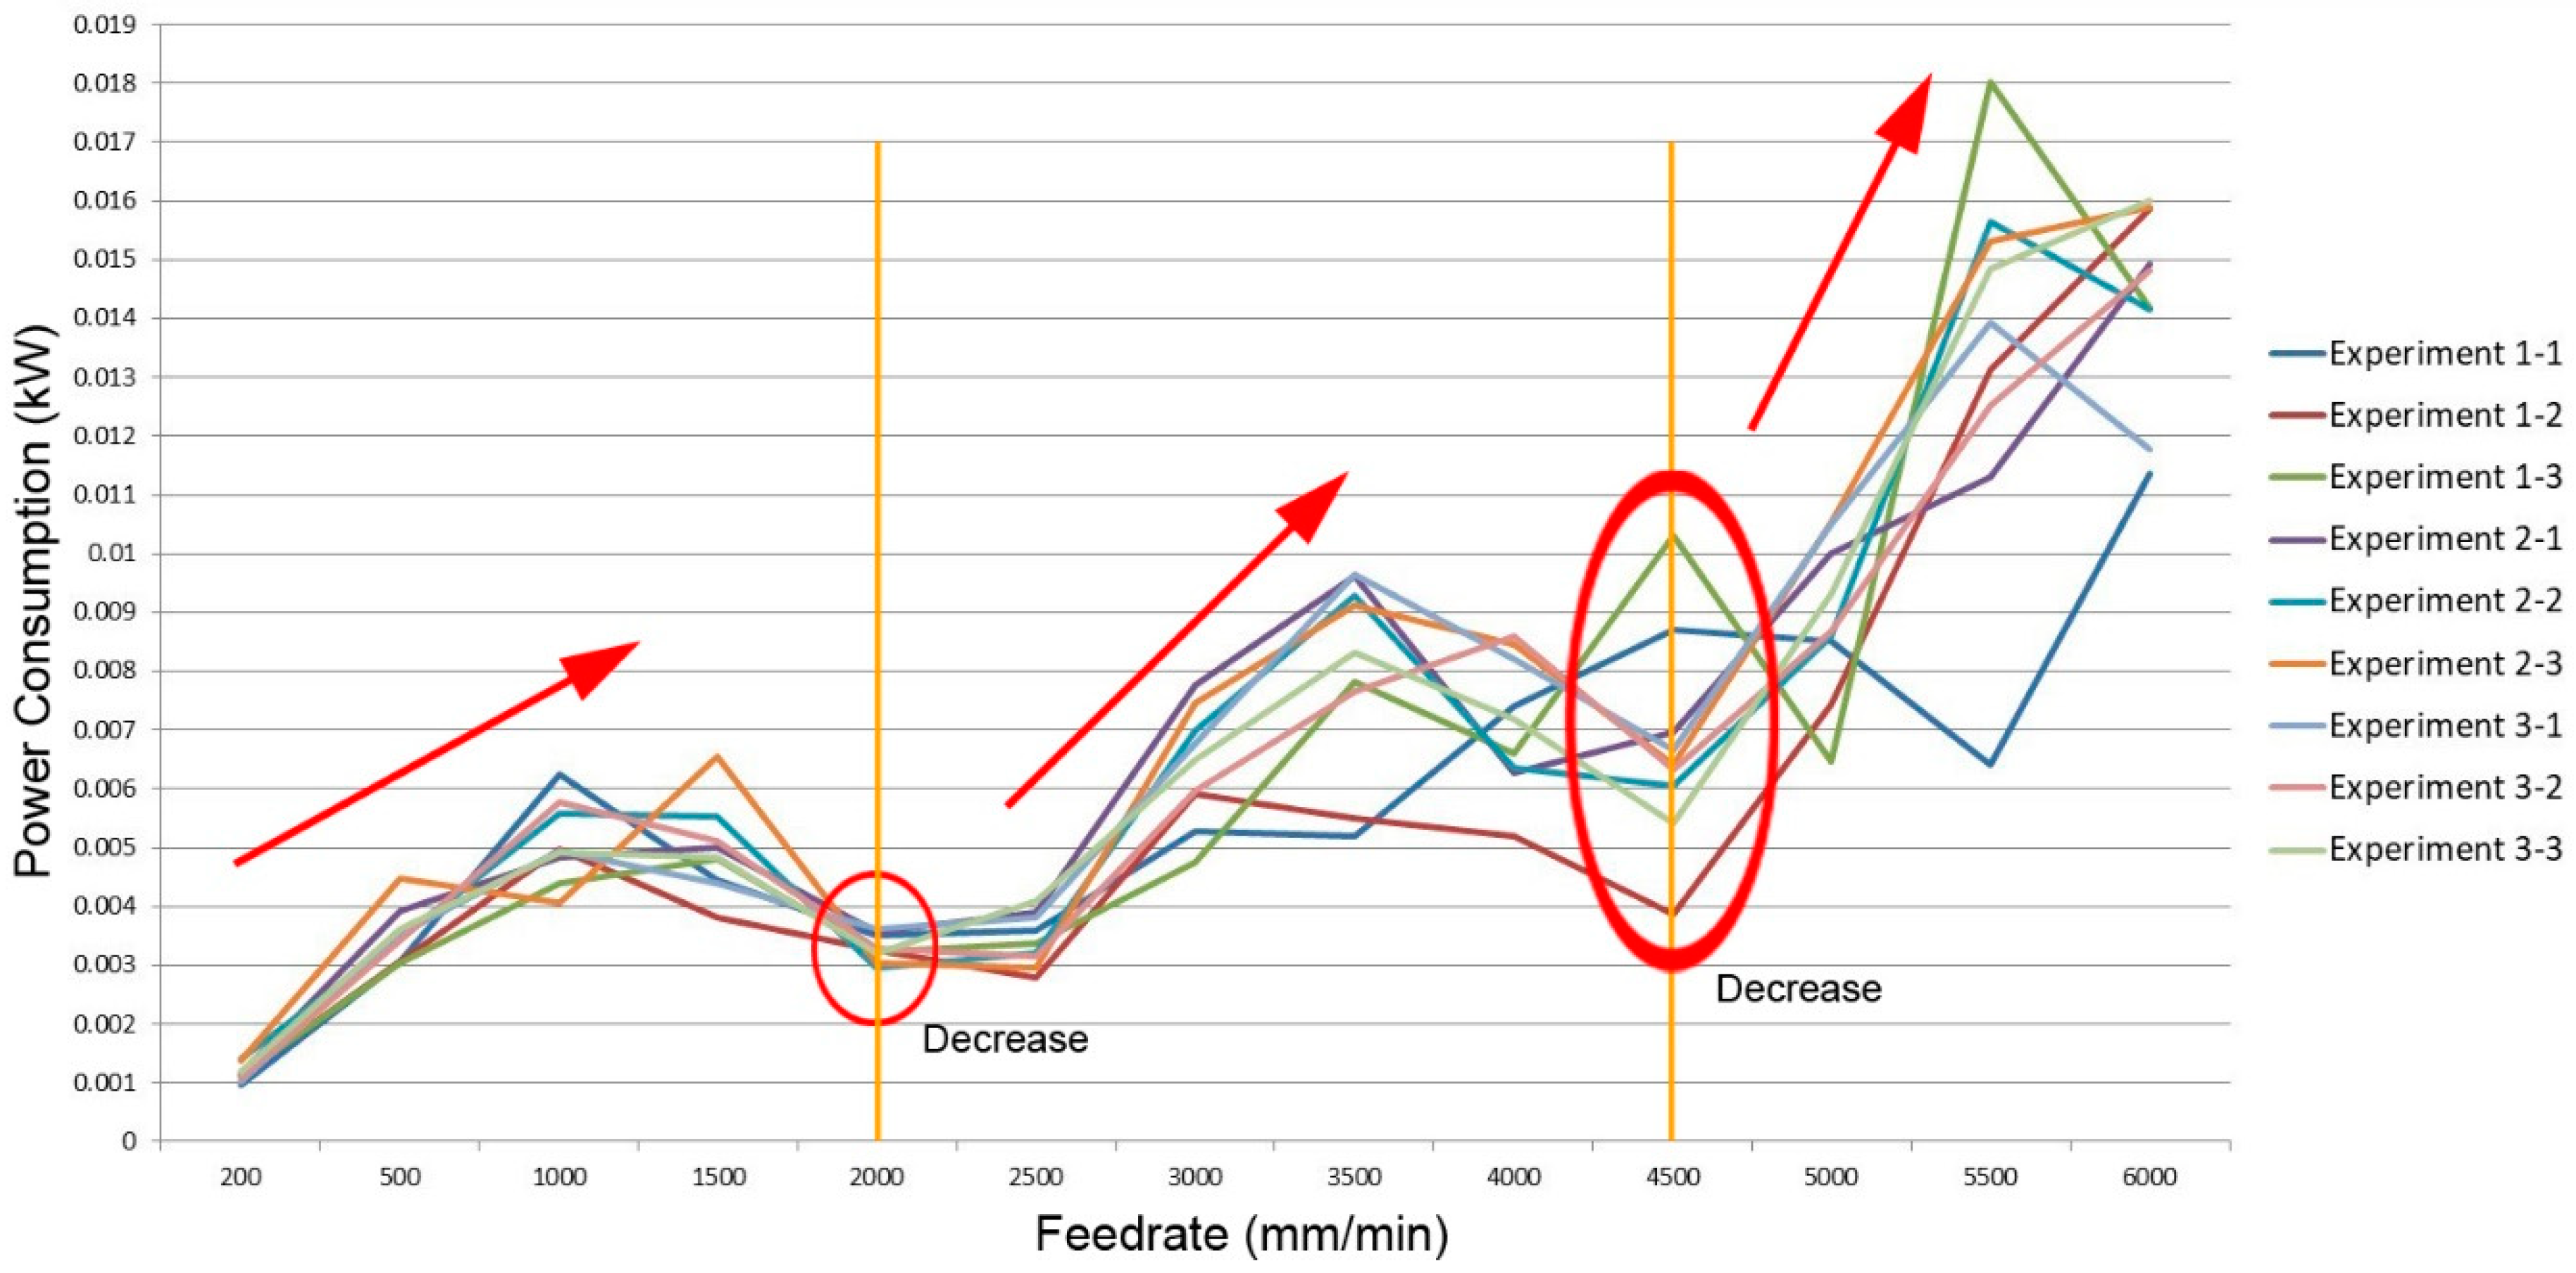
Regarding Z-axis servo motor, the experiment parameters are similar to X- and Y-axis, 13 parameter combination feedrates from 200 mm/min up to 6000 mm/min with increasing step 500 mm/min. Figure 11 shows the experiment results for different feedrates. As seen, the results are mostly reproducible. Only a few of the data have a 0.005 kW difference, such as at the feedrate of 5500 the difference is 0.012 kW. As seen in Figure 11, the power consumption rate at a feedrate of 200 to 1500 mm/min is 0.001 kW per 500 mm/min, but at a feedrate of 2000 mm/min the power consumption is decreased. When the feedrate range is 2500 to 3500 mm/min, the power consumption rate increases about 0.002 kW per 500 mm/min. When the feedrate is 4000 mm/min and 4500 mm/min, the power consumption is reduced, but at a feedrate range of 4500 to 6000 mm/min the power consumption rate increase is about 0.003 kW per 500 mm/min. It can be seen that the overall power consumption tends to increase with the increasing feedrate, but at a feedrate of 2000 mm/min, 2500 mm/min, 4000 mm/min, and 4500 mm/min the power consumption is lower. These feedrates can be considered as the machining parameter to obtain lower power consumption without production efficiency loss.
Since the power consumption at a feedrate of 5500 mm/min has a larger difference, it will be excluded from the average calculation analysis. Figure 12 shows the average calculation result, and the regression equation of each section can be obtained as follow: Equation (11) for a feedrate of 500 mm/min to 2000mm/min, Equation (12) for a feedrate of 2000 to 4500 mm/min, Equation (13) for a feedrate of 4500 to 6000 mm/min.
As seen in Figure 12, when the feedrate is 500 mm/min, the power consumption is 0.004 kW. If the feedrate is increased to 1500 mm/min, the power consumption is 0.005 kW. When the feedrate increases to 3000 mm/min, the power consumption is 0.006 kW. If in the beginning, the machining used a feedrate of 500 mm/min, the power consumption is 0.004 kW per second, so for an hour the power consumption 0.004 kW/sec X 3,600 sec/hr = 14.4 kWh. When the machining feedrate is 1500 mm/min for which the machining efficiency increases three times, the power consumption is 0.005 kW/sec X 3,600 sec/hr = 18 kWh. When the machining feedrate is 3000 mm/min for which the machining efficiency increase six times, the power consumption is 0.006 kW/sec X 3,600 sec/hr = 21.6 kWh. If we assume for a feedrate of 500 mm/min, the machining time needed is half an hour, the power consumption is 0.5 hr X 14.4 kWh = 7.2 kWh. If we use the feedrate of 1500 mm/min, the machining time needed is 10 min, then the power consumption is 3 kWh. Hence, compared to a feedrate of 500 mm/min, the power saving is 4.2 kWh and also the machining time is three times faster.
4.2. Power Consumption Analysis with Cutting Load
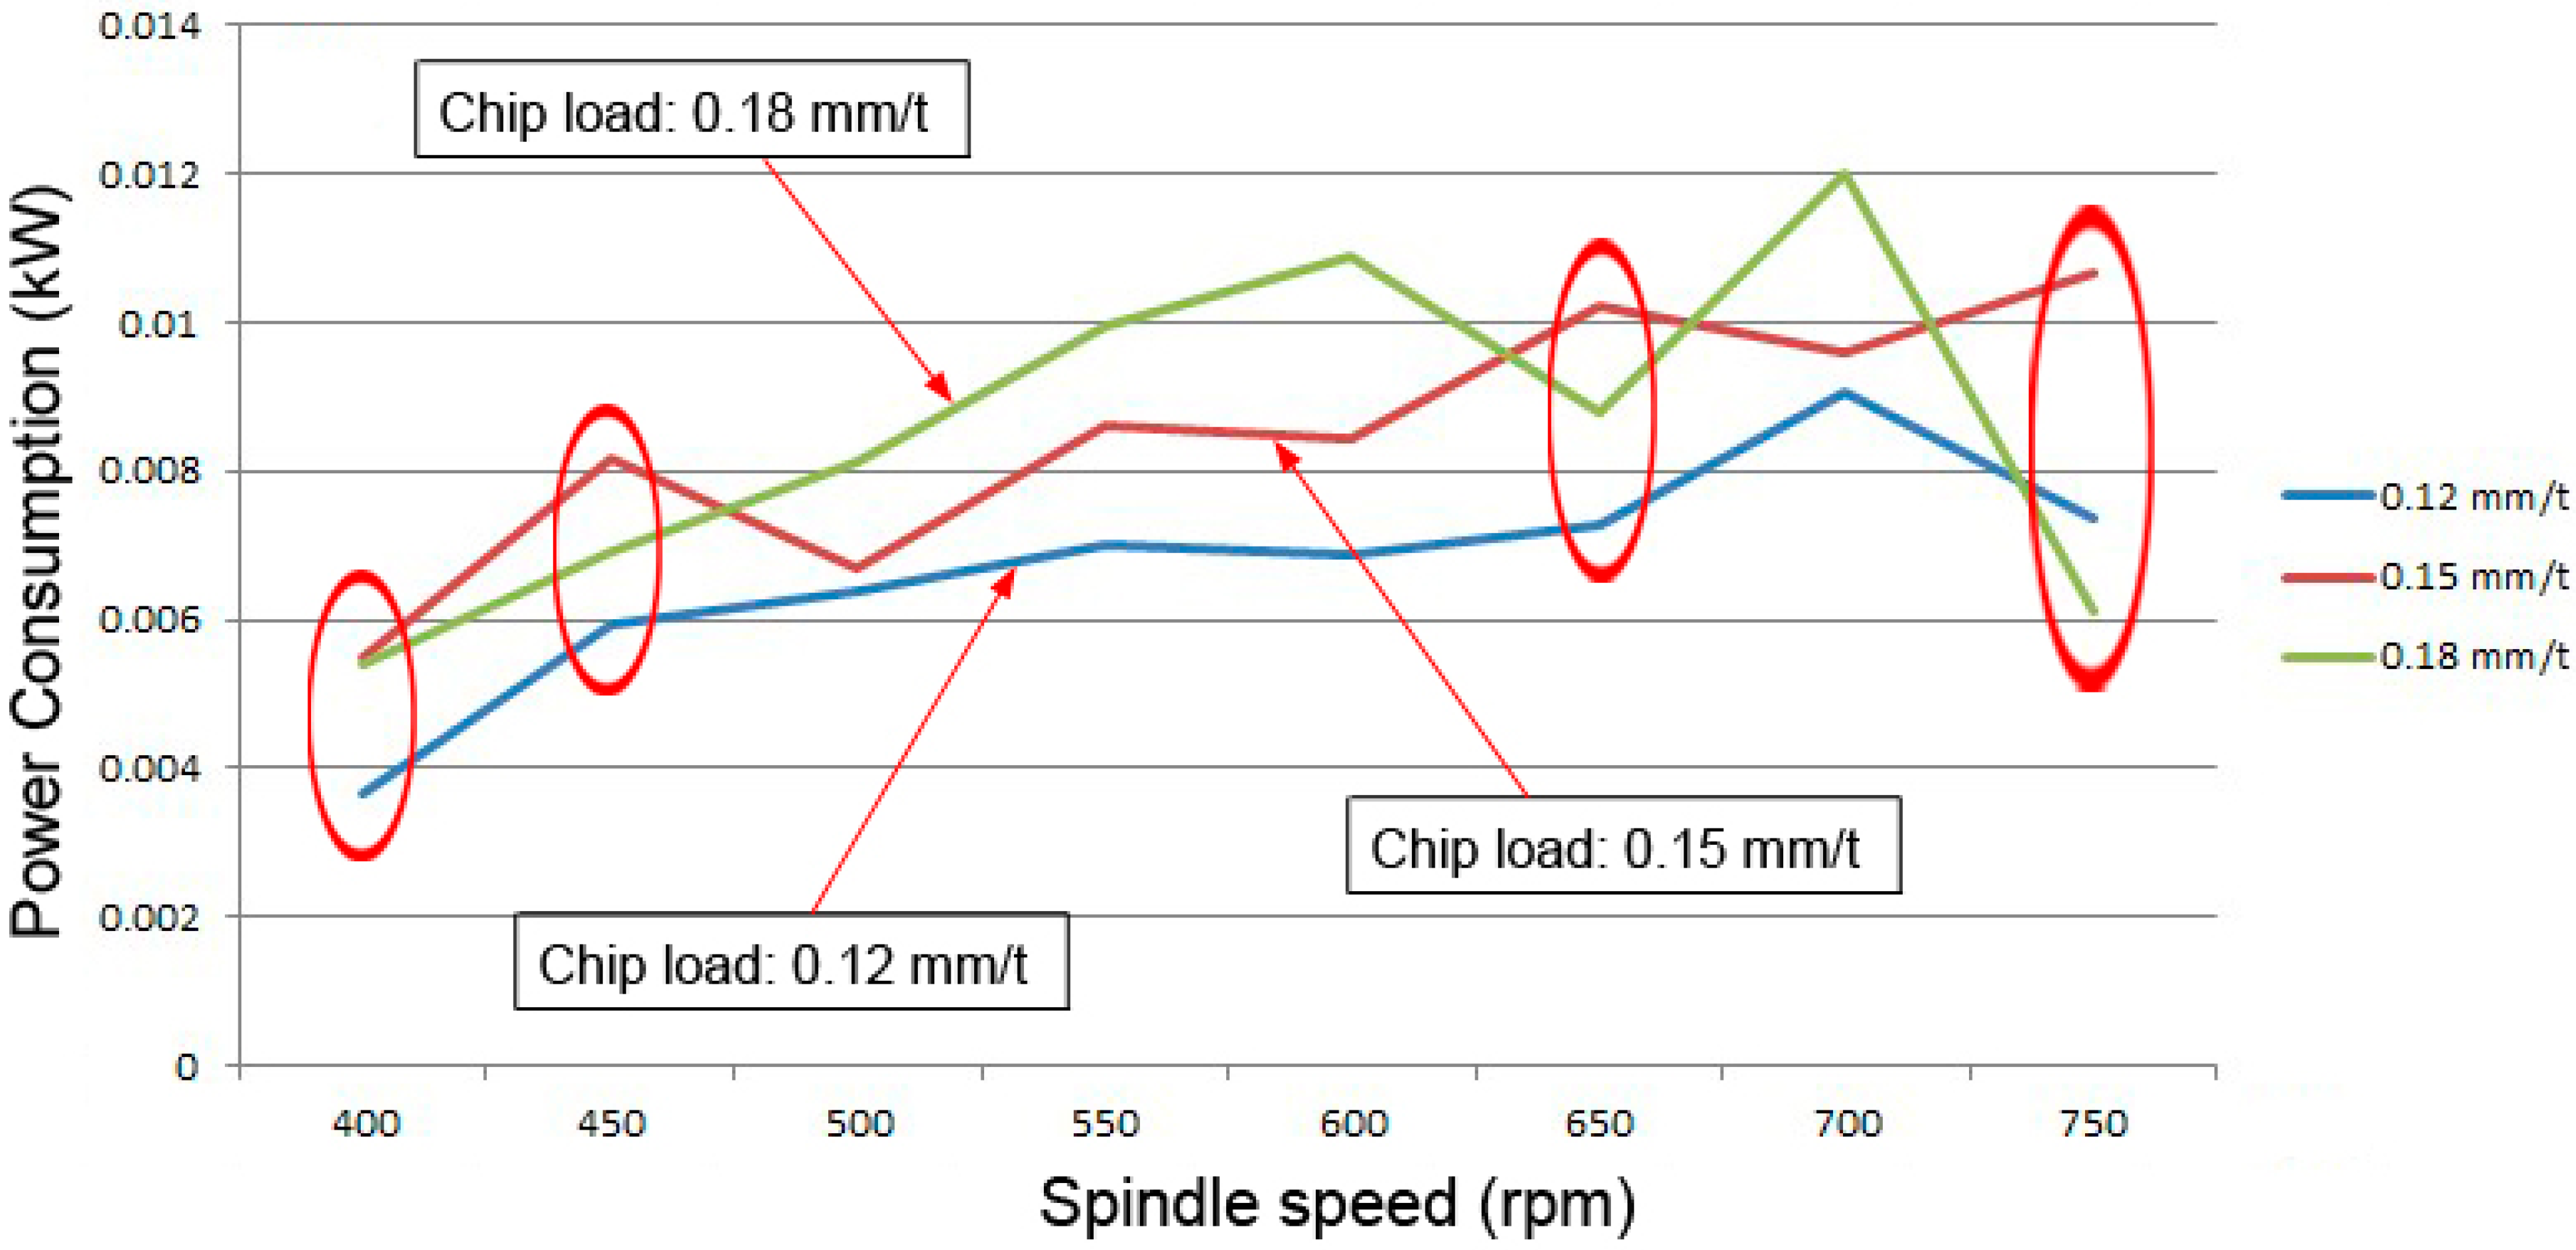
Since the experiment under cutting condition was repeated five times for each parameter, the average result will be used in the analysis. The result of experiment 1 is shown in Figure 13. The power consumption trend of X-axis motor for different chip loads is seen. Under the same spindle speed, a higher chip load (0.18 mm/t) did not consume higher power than the other two smaller chip loads. For eight different spindle speeds, there are four power consumptions of the 0.18 mm/t chip load smaller than the power consumption of the 0.15 mm/t chip load. Under the fixed spindle speed, the feedrate determines the chip load. Similarly, to maintain the same chip load, the feedrate must be proportional to the spindle speed. The chip load not only determines the spindle cutting load but also influences power consumption. The results do not exhibit significant affection for spindle power consumption due to the small difference of chip load.
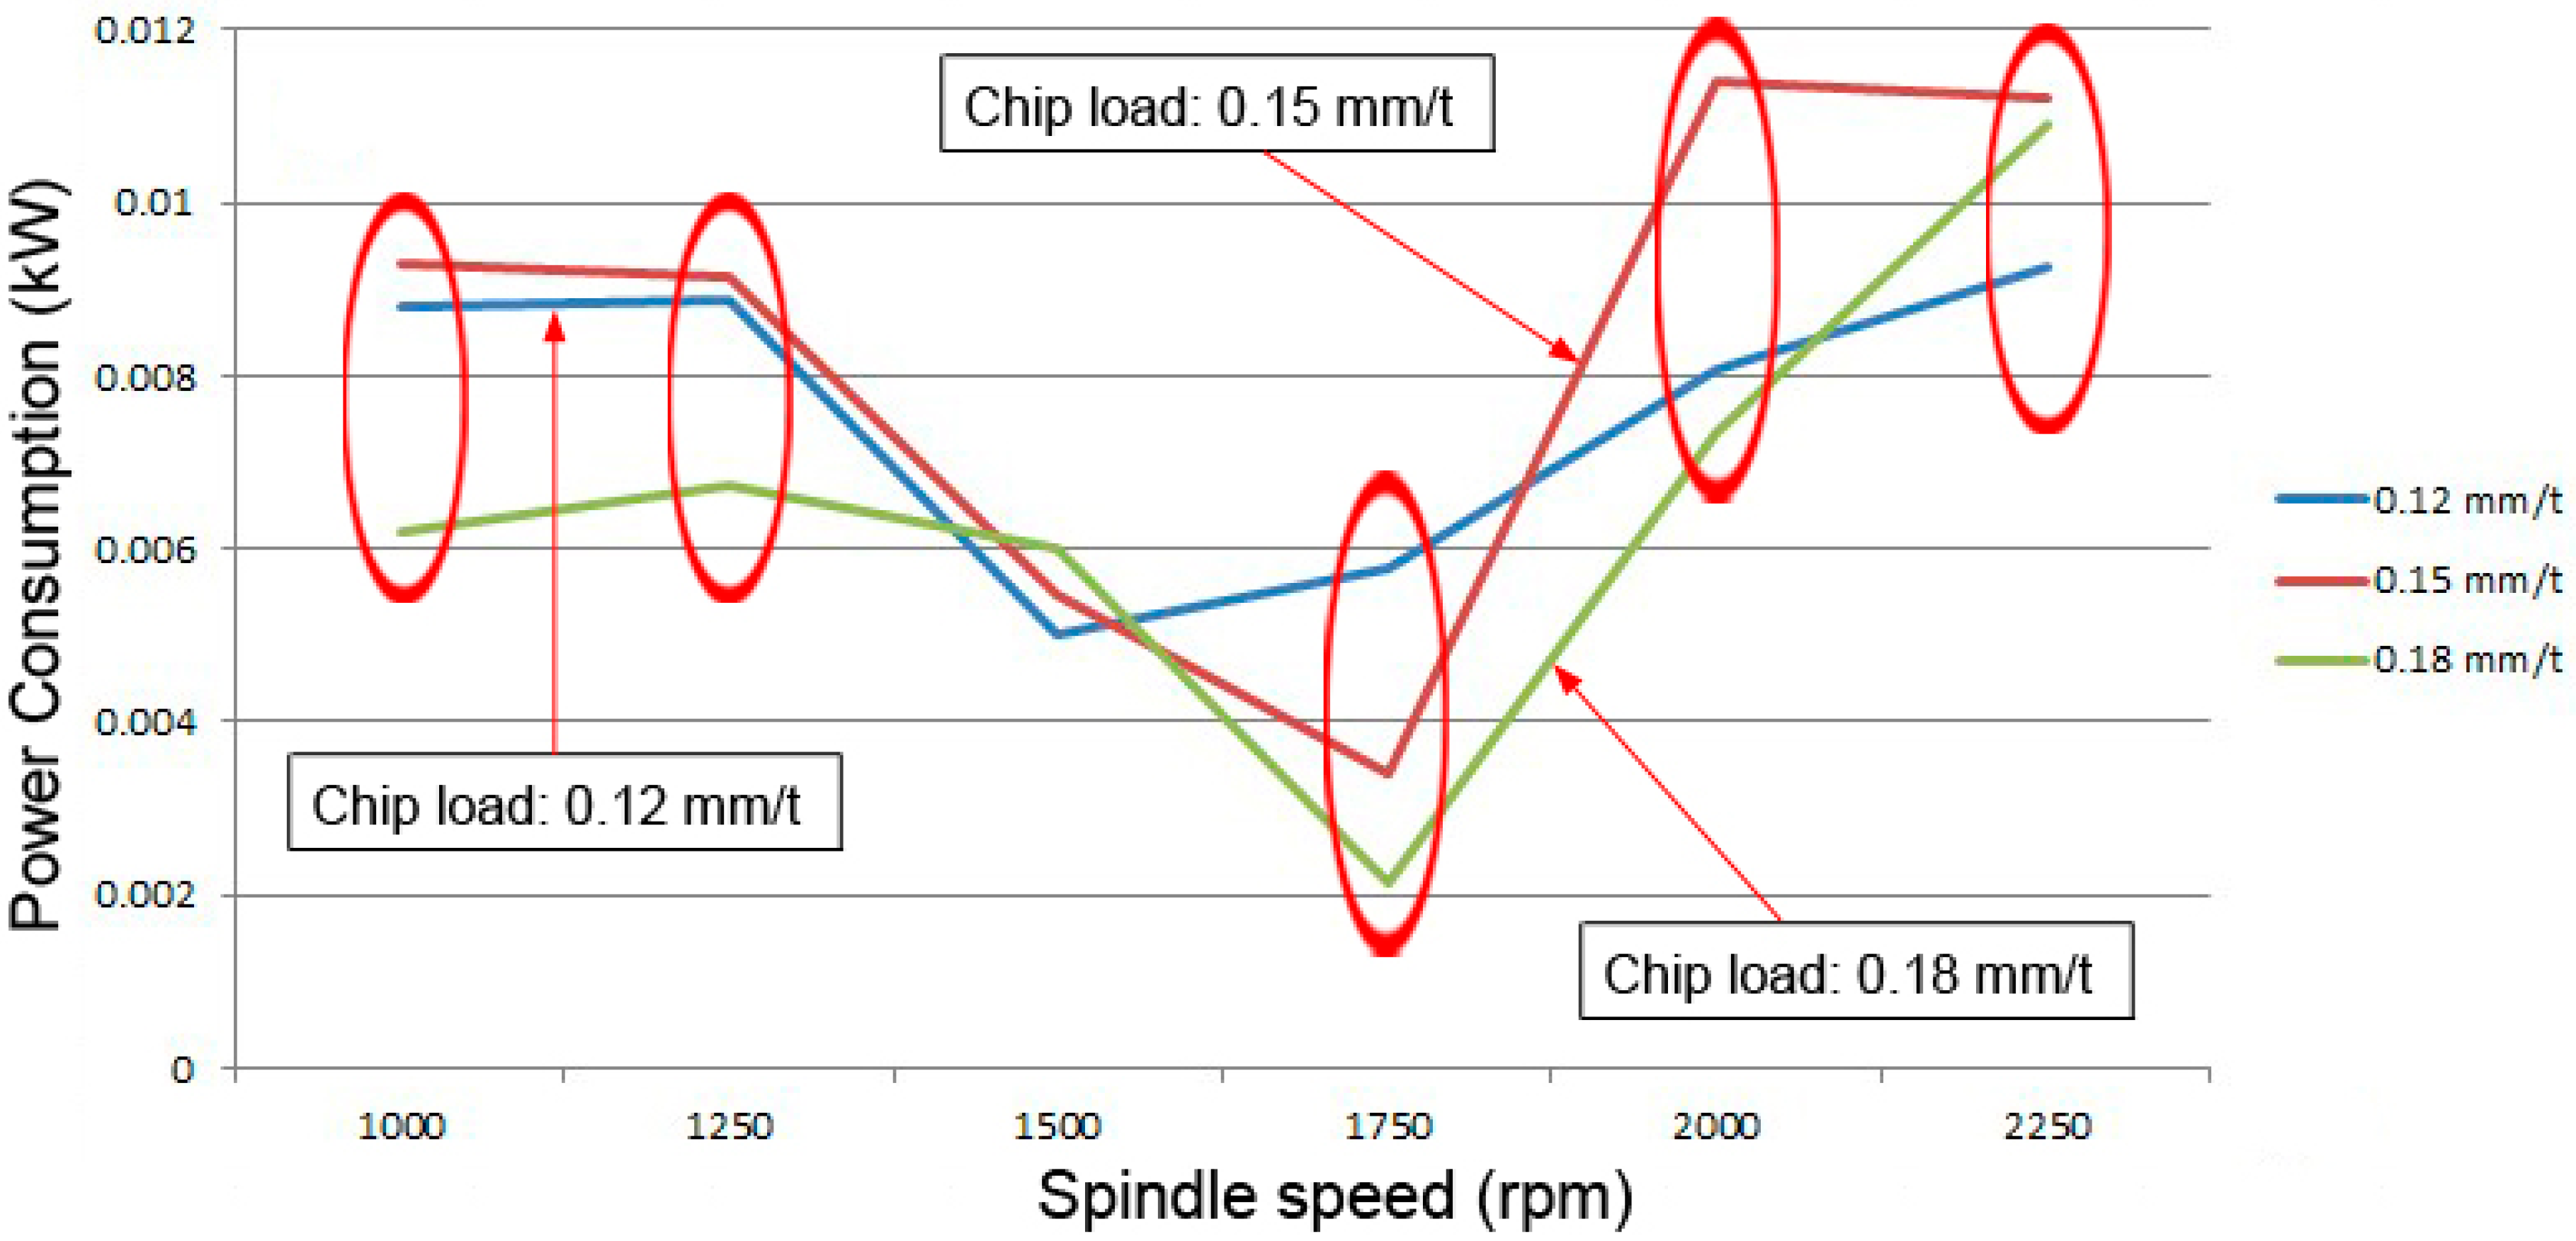
In experiment 2, a larger interval of spindle speed was used to obtain a larger feedrate difference and observe the power consumption characteristic of the feedrate servo motor. The power consumption results of experiment 2 are shown in Figure 14. It is seen, even when the spindle speed was increased to 1000 to 2250 rpm with the maximum feedrate of 270 mm/min, the power consumption of chip load of 0.18 mm/t is smaller than chip load of 0.12 mm/t and 0.15 mm/t. This is perhaps due to the width of cut 20 mm which has reached 80% of cutter diameter that is classified as heavy cutting, thus, generating large cutting resistance. Hence, the motor power consumption is increased. In addition, when the spindle speed was 2250 rpm and the feedrate 1620 mm/min, a spark was appearing during the cutting process, so it is not appropriate to increase the feedrate.
4.3. Verification
4.3.1. Power Consumption without Cutting Load
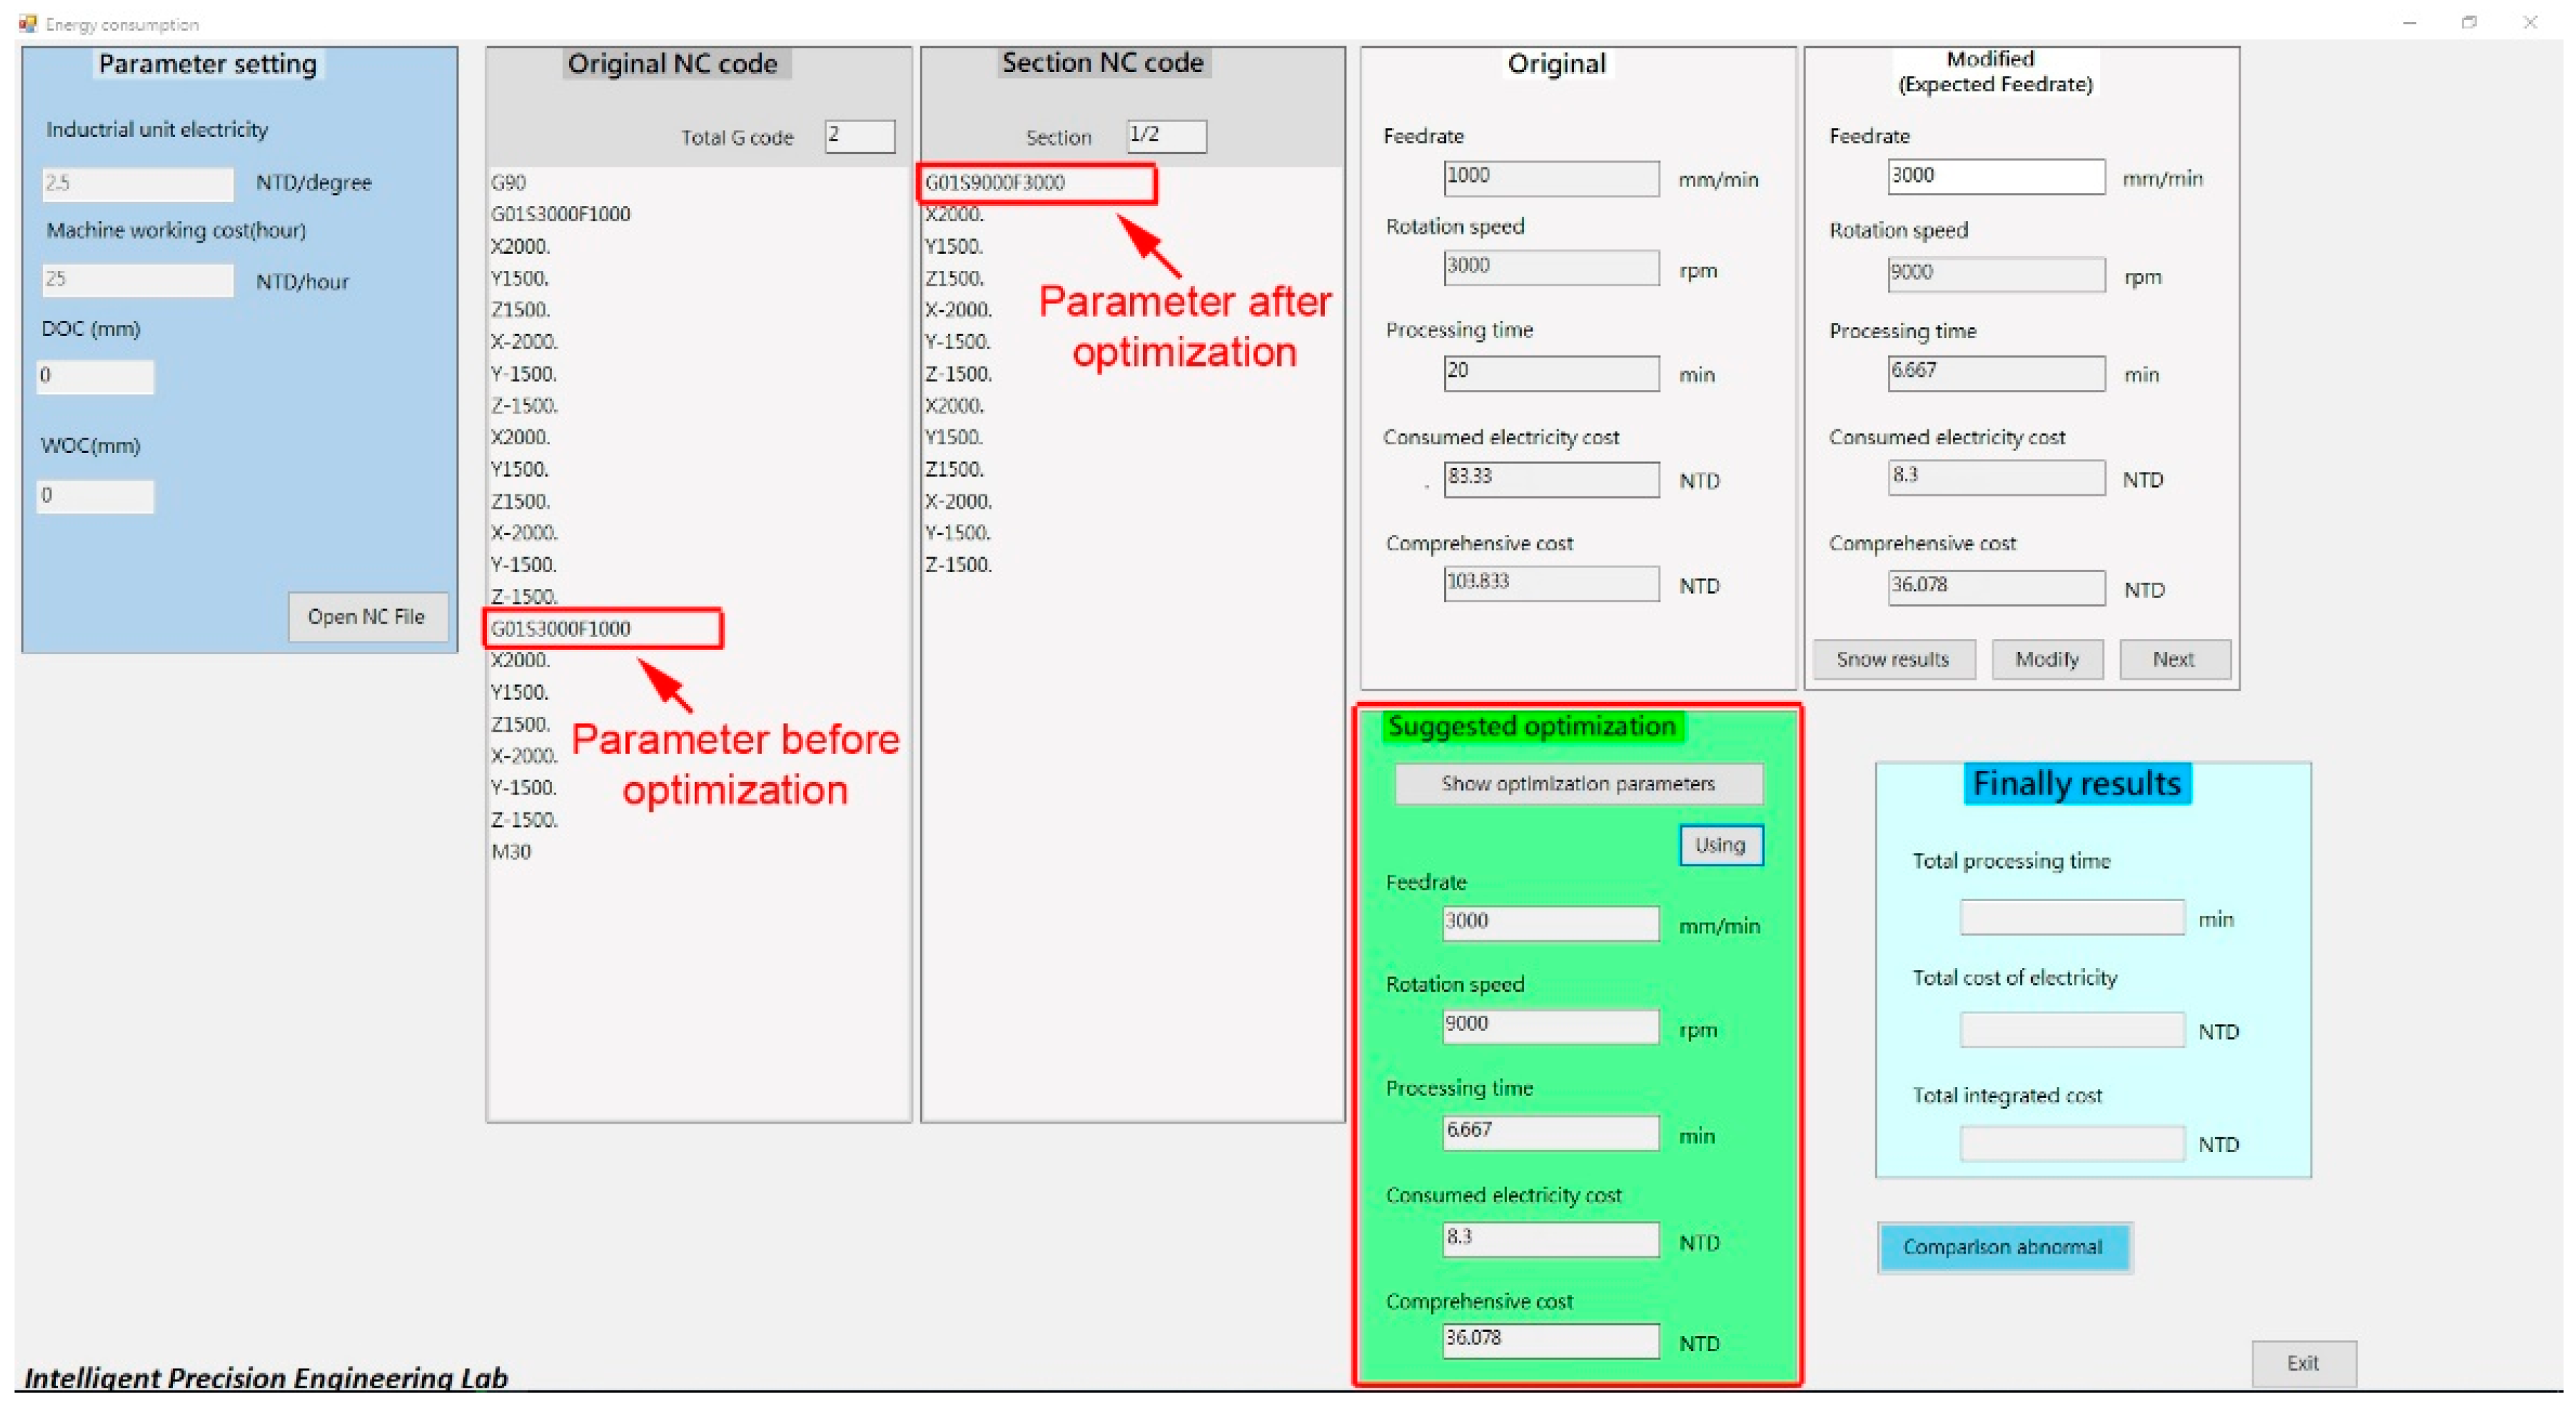
To verify the effectiveness of the proposed system, the electricity unit price and machining cost (hourly-rate) were set as 2.5 NTD/degree and 25 NTD/hour, and a 3-D straight line machining trajectory from (X2000, Y1500, Z1500) to (Z-1500, Y-1500, X-2000) was planned. The cutting path with the same feedrate was repeated twice. The original feedrate for machining was 1000 mm/min, and expected to improve for 3-times faster. Based on those parameters, the system calculated and recommend using a feedrate of 3000 mm/min as shown in Figure 15. Because the power consumption of three servo motors was quite small for a feedrate range of 1000 to 3000 mm/min (as shown in Figure 6, Figure 9, Figure 10, Figure 12), the electricity cost (about only 0.005 kW) is much less than the machining cost. Therefore, short machining time will be more dominant for the overall cost. Meanwhile, to remain the same chip load, the rotation speed of spindle was also increased from 300 rpm to 9000 rpm.
Power consumption amounts of the three axes servo motors with a feedrate of 1000 mm/min are shown in Figure 16, Figure 17 and Figure 18. In the figures, those with very low power consumption (almost zero) represent that machine was moving at that time. The total machining time was about 20 min, the power consumption of X-, Y-, and Z-axis motor were 2.396, 3.619, and 2.178 kW, respectively. The total power consumption was 8.193 kW, and the power consumption cost was about 20.4825 NTD. The machining cost for 20-minutes is about 83.333 NTD. By summing up the power consumption cost and machining cost, the total cost for this machining process was about 103.833 NTD.
For a feedrate of 3000 mm/min, the power consumption amounts of the three axes servo motors are shown in Figure 19, Figure 20 and Figure 21. The total machining time was about 6.667 min, and the power consumption of X-, Y-, and Z-axis were 0.7023, 1.5982, and 1.0192 kW, respectively. The total power consumption was about 3.32 kW, and the cost of the power consumption was 8.3 NTD. For 6.67 min, the machining cost was about 27.778 NTD. By summing up the power consumption cost and machining cost, the total cost for this machining process was about 36.078 NTD.
The comparison of power consumption between actual measured data and the estimated calculation is shown in Table 3. It can be seen that the actual power cost is 2 to 3 NTD (or equivalent to 1 to 2 kWH) higher than the estimated calculation. Due to the error between the generated characteristic curves and the actual values of the three axes servo motors, it is quite acceptable. It was also noted that the generated characteristic curves had good agreement with the actual measured values (difference between the actual values and the estimated values were only about 0.1 kWH).
As it was noted, when the feedrate was adjusted from 1000 mm/min to 3000 mm/min, the total power consumption cost was reduced from 21 NTD to 8.5 NTD, and the machining cost decreased from 83.3 NTD to 27.8 NTD; the total cost was lowered to 36.3 NTD from 104.4 NTD as well. It proved that when feedrate increased, the motor power consumption may also increase. However, if the machining time can be significantly shortened, then the total power consumption cost will still be significantly reduced.
4.3.2. Power Consumption with Cutting Load
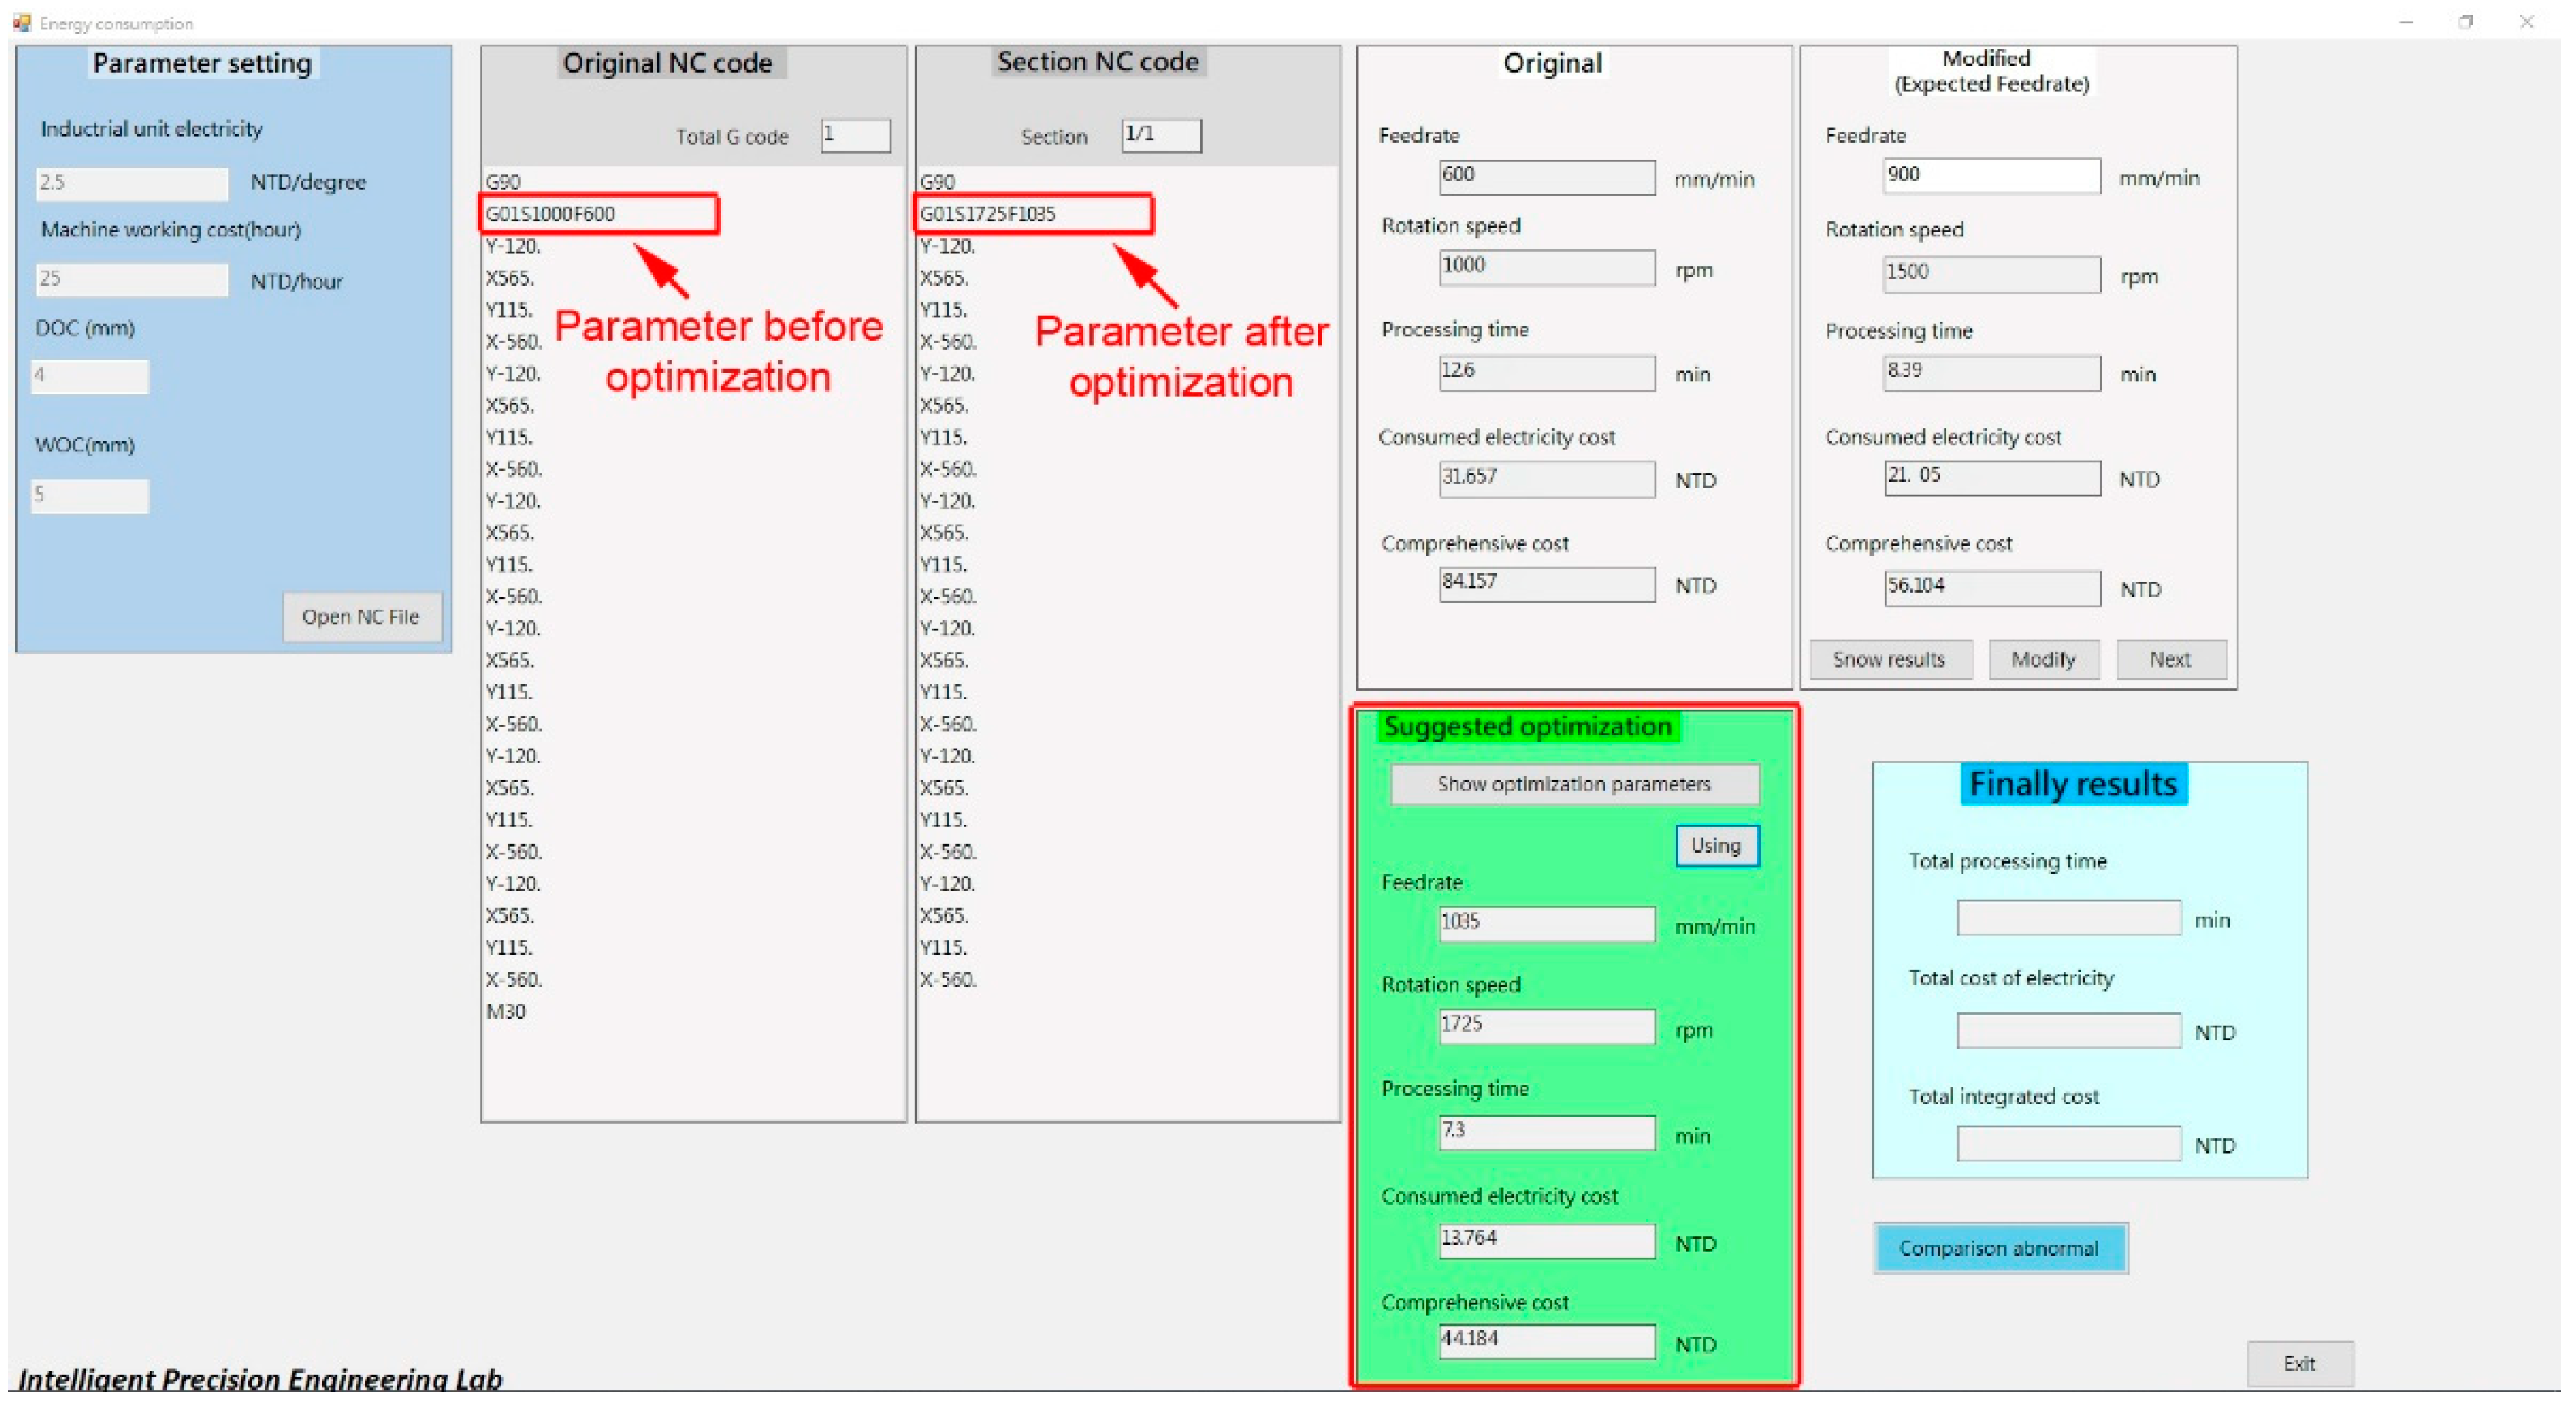
The condition used for verification was assumed as electricity fee is 2.5 NTD/degree and the machine cost is 250 NTD/hour. For machining, a 4-mm depth of cut, and 5-mm width of cut, and 25-mm diameter end mill were used for machining iron. The original spindle speed and feedrate were 1000 rpm and 600 mm/min, respectively, the expected improvement of feedrate was at least 1.5 times faster. A straight line machining trajectory from (X565, Y-120,), (X-560, Y115,) was planned. The cutting path was repeated six times, and the total cutting length was 7560 mm. The system analyzed for the optimal feedrate according to motor power consumption characteristics curves. A feedrate of 1035 mm/min was finally chosen as the optimal value for the process (as shown in Figure 22).
When a feedrate of 600 mm/min was used, the total machining time was about 12.6 min, and the total power consumption was about 12.663 kW. After converting, the power consumption cost was about 31.657 NTD, the machining cost was about 52.5 NTD, and total cost became 84.157 NTD. When the recommended feedrate of 1035 mm/min was used, the total machining time reduced to 7.3 min, the total power consumption was about 5.5056 kW. After converting, the power consumption cost was about 13.764 NTD, and the machining cost is 30.42 NTD. By summing up power consumption cost and machining cost, the total cost for this process was about 44.184 NTD. Figure 23 shows the power consumption data for using 600-mm/min feedrate. The X-axis actual measured power consumption was 8.485 kW (blue line), and the Y-axis actual measured power consumption was 4.178 kW (red line).
When a 1035-mm/min feedrate was used, the X-axis actual power consumption (measured) was 4.543 kW (blue line in Figure 24), and the Y-axis actual power consumption (measured) was 0.9626 kW (red line in Figure 24).
The comparison of actual measurement and estimated calculation of power consumption is shown in Table 4. It was noted that the estimated power consumption in X-axis and Y-axis were smaller than the actual measured data. For a feedrate of 600 mm/min, the actual total power consumption for X-axis (3.325 kW) was higher than the estimate, also the Y-axis (1.226 kW) was higher than the estimated calculation value. For a 1035-mm/min feedrate, the actual total power consumption for X-axis (3.047 kW) was higher than the estimated value. In addition, the actual total power consumption of Y-axis (0.5809 kW) was higher than the estimated calculation value. The actual power consumption was higher than the estimation calculated by characteristics curves which may be because of the 24 starts and stops of the machine for each machining experiment due to repeating the machining process for six times. More energy was consumed for the machine starts and stops. In general, the recommended optimal parameters by the system could improve the machining efficiency and reduce the total power consumption cost. As it can be seen in Table 4, when the feedrate was adjusted from 600 mm/min to 1035 mm/min, the power consumption cost was reduced from 31.657 NTD to 13.764 NTD, and the total machining time also dropped from 12.6 min to 7.3 min. It proves that when the feedrate increase, even if the power consumption of each motor not always decreased, the save of machining time could reduce the total power consumption cost for synchronously improving the machining efficiency and power consumption.
5. Conclusions
In this paper, an accuracy-efficiency-power consumption hybrid optimization method was established. The relationship between motor speed and power consumption with and without cutting load was created. The synchronous optimization algorithm was developed based on these relationship models. This study used motor-power consumption characteristic to develop optimization models and algorithm. According to the models and algorithm, an accuracy-efficiency-power consumption synchronous optimization system with a procedure-guided HMI was developed. Results of verification experiments showed that the system can help to select the optimal parameters for better machining efficiency and power consumption without losing machining accuracy.
Author Contributions
Conceptualization, S.-M.W.; methodology, S.-M.W. and C.-Y.L.; software, C.-Y.L.; validation, C.-Y.L. and C.-C.Y.; formal analysis, C.-Y.L. and H.G.; investigation, C.-Y.L. and S.-M.W.; resources, C.-Y.L. and C.-C.Y.; data curation, C.-Y.L.; writing, H.G. and S.-M.W.
Acknowledgments
This study was supported by Ministry of Science and Technology Taiwan under the grant number MOST 107-2221-E-033-066 and MOST 108-2634-F-033-001.
Conflicts of Interest
The authors declare no conflict of interest.
References
- Gontarz, A.; Züst, S.; Weiss, L.; Wegener, K. Energetic Machine Tool Modeling Approach for Energy Consumption Prediction; Institute of Machine Tools and Manufacturing (IWF), Swiss Federal Institute of Technology: Zürich, Switzerland, 2012. [Google Scholar]
- Abdoli, S.; Semere, D.T. Investigation on Machine Tools Energy Consumptions. Int. J. Mech. Aerosp. Ind. Mechatron. Eng. 2014, 8, 1091–1098. [Google Scholar]
- Diaz, N.; Choi, S.; Helu, M.; Chen, Y.; Jayanathan, S.; Yasui, Y.; Kong, D.; Pavanaskar, S.; Dornfeld, D. Machine Tool Design and Operation Strategies for Green Manufacturing. In Proceedings of the 4th CIRP International Conference on High Performance Cutting, Gifu, Japan, 24–26 October 2010. [Google Scholar]
- Mori, M.; Fujishima, M.; Inamasu, Y.; Oda, Y. A study on energy efficiency improvement for machine tools. CIRP Ann. Manuf. Technol. 2011, 60, 145–148. [Google Scholar] [CrossRef]
- Dragannescu, F.; Gheorghe, M.; Doicin, C.V. Models of Machine Tool Efficicency and Spesific Consumed Energy. J. Mater. Process. Technol. 2003, 141, 9–15. [Google Scholar] [CrossRef]
- Kara, S.; Li, W. Unit process energy consumption models for material removal processes. CIRP Ann. Manuf. Technol. 2011, 60, 37–40. [Google Scholar] [CrossRef]
- Dimla, S.D.E. Sensor signals for tool-wear monitoring in metal cutting operations—A review of methods. Int. J. Mach. Tools Manuf. 2000, 40, 1073–1098. [Google Scholar] [CrossRef]
- Usui, E.; Shirakashi, T. Analytical prediction of cutting tool wear. Wear 1984, 100, 129–151. [Google Scholar] [CrossRef]
- Prickett, P.W.; Johns, C. An overview of approaches to end milling tool monitoring. Int. J. Mach. Tools Manuf. 1999, 39, 105–122. [Google Scholar] [CrossRef]
- Jun, C.H. The Study of Endmill Milling Error and Online Compensation. Master’s Thesis, National Tsinghua University, Hsinchu, Taiwan, 1988. [Google Scholar]
- Dan, L.; Mathew, J. Tool wear and failure monitoring techniques for turning—A review. Int. J. Mach. Tools Manuf. 1990, 30, 579–598. [Google Scholar] [CrossRef]
- Choi, G.S.; Wang, Z.X.; Dornfield, D.A.; Tsujino, K. Development of an intelligent on-line tool wear monitoring system for turning operations. In Proceedings of the USA–Japan Symposium on Flexible Automation, A Pacific Rim Conference ISCIE, Kyoto, Japan, 9–13 July 1990. [Google Scholar]
Figure 1.
Flowchart of research. CNC: Computer Numerical Control; NC: Numerical Control.

Figure 2.
Optimization algorithm of machining and power consumption.

Figure 3.
Machining efficiency and power consumption hybrid optimization human machine interface (HMI).
Figure 3.
Machining efficiency and power consumption hybrid optimization human machine interface (HMI).

Figure 4.
Relationship between spindle speed vs. power consumption w/o cutting load.

Figure 5.
Relationship between X-axis motor feedrate vs. power consumption w/o cutting load.

Figure 6.
Curve of average X-axis motor feedrate vs. power consumption w/o cutting load.

Figure 7.
Relationship between Y-axis motor (up direction) feedrate vs. power consumption w/o cutting load.
Figure 7.
Relationship between Y-axis motor (up direction) feedrate vs. power consumption w/o cutting load.

Figure 8.
Relationship between Y-axis motor (down direction) feedrate vs. power consumption w/o cutting load.
Figure 8.
Relationship between Y-axis motor (down direction) feedrate vs. power consumption w/o cutting load.

Figure 9.
Curve of average Y-axis motor (up direction) feedrate vs. power consumption w/o cutting load.
Figure 9.
Curve of average Y-axis motor (up direction) feedrate vs. power consumption w/o cutting load.

Figure 10.
Curve of average Y-axis motor (down direction) feedrate vs. power consumption w/o cutting load.
Figure 10.
Curve of average Y-axis motor (down direction) feedrate vs. power consumption w/o cutting load.

Figure 11.
Relationship between Z-axis motor feedrate vs. power consumption w/o cutting load.

Figure 12.
Curve of average Z-axis motor feedrate vs. power consumption w/o cutting load.

Figure 13.
X-axis motor power consumption vs. Spindle speed for experiment 1.

Figure 14.
X-axis motor power consumption vs. Spindle speed range of 1000 to 2250 rpm.

Figure 15.
The proposed parameters information for w/o cutting load.

Figure 16.
Power consumption data of X-axis with F1000.

Figure 17.
Power consumption data of Y-axis with F1000.

Figure 18.
Power consumption data of Z-axis with F1000.

Figure 19.
Power consumption data of X-axis with F3000.

Figure 20.
Power consumption data of Y-axis with F3000.

Figure 21.
Power consumption data of Z-axis with F3000.

Figure 22.
The proposed parameters information for w/cutting load.

Figure 23.
Actual power consumption with cutting load using 600-mm/min feedrate.

Figure 24.
Actual Power consumption with cutting load using 1035-mm/min feedrate.


Table 1.
Cutting condition.
| Workpiece Material | Cast Iron (HB244) |
|---|---|
| Workpiece dimensions | 550 × 100 × 100 mm |
| Cutting tool | Carbide end mills |
| No. of teeth | 4 teeth |
| Tool diameter | 25 mm |
Table 2.
Machining parameters.
| Subject | Experiment 1 | Experiment 2 |
|---|---|---|
| Milling speed (m/min) | 30~60 | 30~60 |
| Chip load (mm/t) | 0.12, 0.15, 0.18 | 0.12, 0.15, 0.18 |
| Spindle speed (rpm) | 450~750 | 1000~2750 |
| Feed rate (mm/min) | 192~540 | 480~1980 |
| Width of Cut (mm) | 20 | 20 |
| Depth of Cut (mm) | 4 | 4 |
Table 3.
Actual and estimated comparison for power consumption without cutting load.
| Information | Power Costs (NTD) | Machining Costs (NTD) | Total Costs (NTD) | |
|---|---|---|---|---|
| Processing Source | ||||
| Calculated by program (F1000) | 17.85 | 83.333 | 101.183 | |
| Calculated with measured data (F1000) | 20.482 | 83.333 | 103.833 | |
| Calculated by program (F3000) | 8.3 | 27.778 | 36.078 | |
| Calculated with measured data (F3000) | 8.3 | 27.778 | 36.078 | |
Table 4.
Actual and estimated comparison for power consumption with cutting load.
| Information | X-axis Total Power Consumption (kW) | Y-axis Total Power Consumption (kW) | Power Costs (NTD) | |
|---|---|---|---|---|
| Processing Source | ||||
| Calculated by program (F600) | 5.16 | 2.952 | 20.28 | |
| Calculated with measured data (F600) | 8.485 | 4.178 | 31.657 | |
| Calculated by program (F1035) | 1.496 | 0.382 | 4.691 | |
| Calculated with measured data (F1035) | 4.543 | 0.963 | 13.764 | |
© 2019 by the authors. Licensee MDPI, Basel, Switzerland. This article is an open access article distributed under the terms and conditions of the Creative Commons Attribution (CC BY) license (http://creativecommons.org/licenses/by/4.0/).
Share and Cite
MDPI and ACS Style
Wang, S.-M.; Lee, C.-Y.; Gunawan, H.; Yeh, C.-C. An Accuracy-Efficiency-Power Consumption Hybrid Optimization Method for CNC Milling Process. Appl. Sci. 2019, 9, 1495. https://doi.org/10.3390/app9071495
AMA Style
Wang S-M, Lee C-Y, Gunawan H, Yeh C-C. An Accuracy-Efficiency-Power Consumption Hybrid Optimization Method for CNC Milling Process. Applied Sciences. 2019; 9(7):1495. https://doi.org/10.3390/app9071495
Chicago/Turabian StyleWang, Shih-Ming, Chun-Yi Lee, Hariyanto Gunawan, and Chin-Cheng Yeh. 2019. "An Accuracy-Efficiency-Power Consumption Hybrid Optimization Method for CNC Milling Process" Applied Sciences 9, no. 7: 1495. https://doi.org/10.3390/app9071495
Note that from the first issue of 2016, this journal uses article numbers instead of page numbers. See further details here.