Subsidy and Pricing Model of Electric Vehicle Sharing Based on Two-Stage Stackelberg Game – A Case Study in China


School of Electrical Engineering and Automation, Wuhan University, Wuhan 430072, China
*
Author to whom correspondence should be addressed.
Appl. Sci. 2019, 9(8), 1631; https://doi.org/10.3390/app9081631
Submission received: 11 February 2019
/
Revised: 8 April 2019
/
Accepted: 17 April 2019
/
Published: 19 April 2019
(This article belongs to the Special Issue Energy Management and Smart Grids)
Abstract
:Electric vehicle sharing provides an effective way to improve the traffic situation and relieve environmental pressure. The government subsidy policy and the car-sharing operator’s pricing strategy are the key factors that affect the large-scale application of electric vehicle sharing. To address this issue, a subsidy and pricing model for electric vehicle sharing based on the two-stage Stackelberg game is proposed in this paper according to the current situation in China. First, an electric vehicle sharing operation mode under government participation is constructed. Then, a two-stage Stackelberg game model involving the government, the car-sharing operator and the consumers is proposed to determine the subsidy rates and pricing strategies. The improved particle swarm optimization algorithm is used to obtain the Nash equilibrium of the model. Also, the influence of private car cost and shared travel comfort on subsidy rates and pricing strategies is analyzed. Finally, the simulation of electric vehicle sharing in a town of China is carried out to investigate the performance of the proposed subsidy and price model. The simulation results show that the model rationally formulates subsidy policies and pricing strategies of the electric vehicle sharing to balance the interests of the three participants, mobilizing users’ enthusiasm while guaranteeing the benefits of the government and operator, making the overall benefit optimal.
1. Introduction
With the development of the world economy, the number of automobiles is increasing rapidly, which has brought about a series of environmental and traffic problems such as exhaust gas pollution, accelerated consumption of fossil energy, traffic congestion and parking difficulty. People’s quality of life and the development of the city are greatly restricted. As a green travel tool, replacing fuel vehicles, electric vehicles will become the main means of transportation in the future, which has become a trend of the times [1]. Meanwhile, the emergence of the sharing economy has made resource utilization more rational. According to statistics, each shared car can replace 6–10 private cars on average [2]. Once it is applied on a larger scale in transportation, it will greatly improve the current traffic situation, relieve the pressure of infrastructure and improve the efficiency of resource utilization [3]. For consumers, car sharing services can save the cost of car purchase, maintenance, insurance, parking and so on while meeting travel demand [4]. What cannot be ignored is that electric vehicles not only can be regarded as mobile loads but also flexible energy storage units, which will provide high quality auxiliary services for the power grid, such as peak shaving, frequency modulation and spinning reserve [5,6]. Moreover, the application of the sharing mode makes electric vehicles (EVs) belong to one or more interests, when dispatching the shared electric vehicles to participate in grid auxiliary services, the interests are more easily coordinated and the efficiency will be significantly improved. Therefore, promoting the development of shared electric vehicles is of strategic significance for alleviating environmental and traffic pressure, promoting the effective allocation of resources and ensuring the safe operation of the power grid.
At present, there are some existing literatures about electric vehicle sharing, mainly focused on market forecasting, network planning, operational mode, and pricing mechanism analysis. Zhou [7] predicted the future car sharing market in Australia, Malaysia, Indonesia and Thailand based on expert opinions. Zhu [8] and Li [9] predicted the demand for electric vehicle sharing and determined the most preferred address based on mobile edge computing and the analytic hierarchy process, respectively. Becker, Kopp, et al. [10,11,12] studied the influence of ownership rate of fuel vehicles on the application of electric vehicle sharing and came to the conclusion that electric vehicle sharing has greater competitiveness under the guidance of reasonable price. These studies point out that shared electric vehicles have great demand potential in cities. In the research of operational mode and pricing mechanism analysis, Xu [13] considered the maximization of operator profit, and established a mixed integer nonlinear programming model to optimize fleet size and prices. Aiming at the shared autonomous electric vehicles, Chen [14] analyzed the impact of pricing strategies on its market share and operational effectiveness. However, neither of the two papers considers the role of government subsidies. Some cities such as Seoul, Dublin and Paris have implemented electric vehicle sharing programs and explored their operating models and pricing mechanisms. The program in Seoul achieved good customer satisfaction, but a survey conducted by Kim [15] shows that respondents tend to be less satisfied with charging because the charging standard is based on taxi pricing. With the support of the government, Dublin accomplished a test area for electric vehicle sharing. However, the operational efficiency of the project has not achieved satisfactory results, due to high operating costs and sustained financial support from the government [16]. The electric vehicle sharing program in Paris is carried out by signing a public service agreement with the government to bear the part of repair and maintenance costs for each vehicle, and takes the government’s public service as the main purpose, which only gets remuneration and profit from the business performance [17].
It can be concluded from the current research and operating experience that electric vehicle sharing has enormous potential and market, but due to the small scale of operation and low user acceptance, the industry has the characteristics of high operating costs and low profits, which will make it hard to succeed without the governments’ coordinated support. Additionally, the factors affecting the cost are not analyzed in depth to develop reasonable pricing measures. Moreover, the charging characteristic of electric vehicles and the ability to provide auxiliary services for the power grid will also affect pricing strategies, which are not taken into consideration in the current studies.
The emerging trend of electric vehicle sharing is in urgent need of government support. And it is of great significance to study the government’s guiding measures for the industry. Fortunately, many countries have paid attention to the development of electric vehicle sharing. In order to create a favorable development environment, relevant development guidance and subsidy policies have been issued. Taking Shanghai, China as an example, the electric vehicle rental businesses of Bremen’s car-sharing model was introduced in busy areas by government–enterprise cooperation and the travel pressure in these areas has been effectively alleviated [18]. In order to improve the environment, the Chinese government has attached great importance to the development of electric vehicles and financially supports all aspects of the development of electric vehicles [19]. In 2017, guidance on promoting the healthy development of small and micro passenger car rental was announced, providing comprehensive support for car sharing [20]. However, there is a lack of mature theoretical guidance in operational mode and cost control considering the continued support of government, which decides the success or failure of electric vehicle sharing. In addition, in the developing process of electric vehicle sharing, the government, operator and consumers have certain conflicts of interest, and their coordination is an important issue. Therefore, the goal of this paper is to establish an operational mode and pricing mechanism of electric vehicle sharing considering government support policies.
The main contribution of this paper is to propose an electric vehicle sharing operation mode with government participation in the early stage, and construct a two-stage Stackelberg game model considering subsidy and pricing strategies. We took the implementation environment of electric vehicle sharing in China as an example to carry out the research. First, the operation mode with government participation is proposed, so as to improve the enthusiasm of the electric vehicle sharing enterprise. Next, combining the situation that the electric car-sharing industry is still in its infancy, taking the impact of policy subsidies into account, the users’ cost utility, the operator’s revenue utility and the government’s economic and social utility are analyzed. Then, a two-stage Stackelberg game model consisting of three participants—the government, operator and users—is established. Considering the interests of the participating entities, the pricing strategy of the operator and the government’s subsidy incentive mechanism are investigated. Additionally, the impact of factors such as private car travel costs on the results is analyzed.
As a new travel mode, electric vehicle sharing will compete with the taxis, buses and private cars. Although the travel cost of buses is relatively low, its comfort and convenience are far less than the other three travel modes. Electric vehicle sharing is not competitive in this kind of user group. The studies of pricing mechanism and subsidy strategy in this paper are both for the development and promotion of electric vehicle sharing, whose main target customer group is private car users, including those who have purchased plans or are ready to sell existing private vehicles. Bus users consider electric vehicle sharing only in special scenarios, such as inconvenient destination public transportation, time limit of arrival, and presence of elderly and children. These scenarios occur at a low frequency, where the price strategy has little impact on user travel. Therefore, this article mainly focuses on the comparison between electric vehicle sharing and private cars.
The rest of this paper is organized as follows. Section 2 of this paper gives an overview of the game model and introduces the interrelationship among the participating entities. Section 3 constructs the mathematical model of the game. In Section 4, the existence of the Nash equilibrium is proved and the solution method of the model is designed based on the improved particle swarm optimization algorithm. Section 5 analyzes the results and discusses the effects of some parameters. Finally, the paper is summarized in Section 6.
2. Operation Mode of Electric Vehicle Sharing with Government Participation
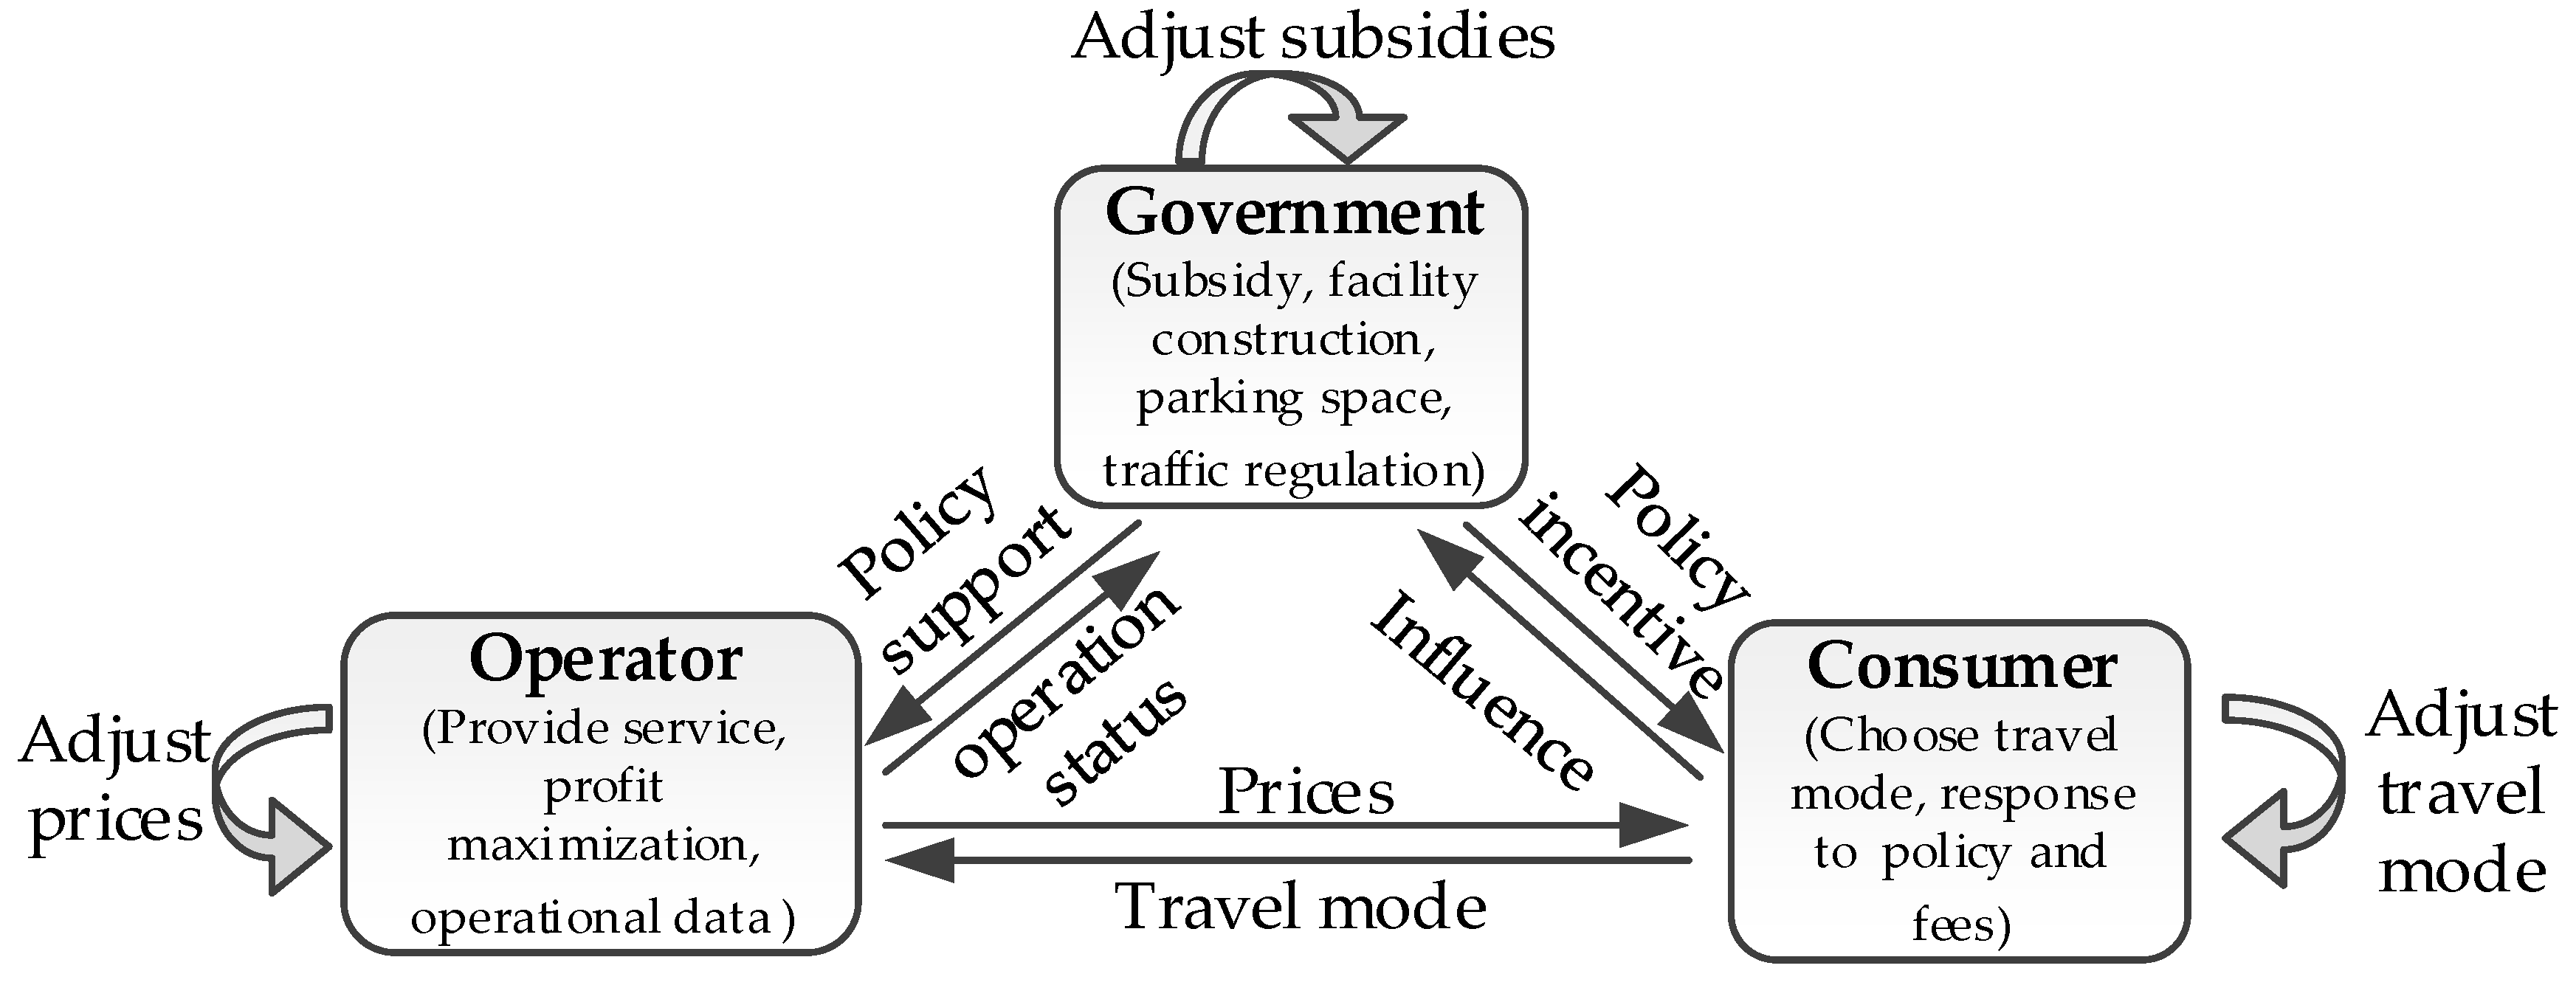
As an innovative measure to improve the traffic environment, electric vehicle sharing has a certain public welfare nature. Under the social system of China, the development model based on government financial support will become the main approach in its initial development [19,20]. However, its long-term development must ensure the profitability of the project. Therefore, this section proposes an operation mode of electric vehicle sharing with government participation, as shown in Figure 1, which clarifies the relationship among the three parties in the market. As the electric vehicle sharing is in its early state, policy support will have a crucial impact on its development. At this stage, the dominant force is the government, while the main force is the enterprise, and the driving force is the user. The large-scale promotion of electric vehicle sharing can bring significant environmental and social benefits to the government, improving the efficiency of resource utilization, and easing the pressure on urban transportation and infrastructure. The government will give strong support to electric vehicle sharing operators by publishing subsidy policies, providing convenience for the construction of charging facilities and parking spaces, integrating sharing operations into transportation and urban development plans and forming connections between sharing networks and other transportation modes. Considering their costs and benefits with subsidy income, operators adjust prices and adopt various marketing methods to attract more users to participate in electric vehicle sharing, postpone car purchase plans or sell existing vehicles, or reduce the usage frequency of private vehicles. According to the prices given, combined with the convenience and comfort of travel, the users determine the travel mode, and feedback the willingness to the car-sharing operator. Then the operators adjust the price strategy to maximize their interests according to the costs and benefits, and report the demand and scale of the car-sharing service to the government. Through policy incentives and publicity, the government encourages users to take the electric vehicle sharing into consideration when planning to purchase a car. Vehicles with long idle times can be considered for sale. Meanwhile, the government introduces measures to protect consumer rights and interests, and makes it convenient for consumers to get electric vehicle sharing services nearby. Consequently, it is possible to reduce the use of private cars, suppress the amount of motor vehicles that has risen sharply and promote green travel. The users’ choices of travel mode indicate their enthusiasm in electric vehicle sharing, which can prompt the government to adjust the subsidy strategy to achieve optimal environmental and social benefits, and ultimately affect the government’s decision-making.
3. Subsidy and Pricing Strategy of Electric Vehicle Sharing Based on Game Theory
The government’s impact on users is indirectly achieved through subsidies to operators. The reverse impact is mainly reflected by whether to participate in the car-sharing services provided by the operator. Therefore, this paper transforms the trilateral game model into a two-stage Stackelberg game, as shown in Figure 2. In the first stage, with the car-sharing operator as the leader, based on the government’s subsidy rates for electric vehicles and supporting facilities, the pricing strategy is announced to users. Then they compare the cost with private car travel, determine travel plans and feedback to the operator. According to the operation situation, the operator adjusts the pricing strategy to influence the users’ choices to make its own interests optimal. In the second stage, the followers are the whole of the car-sharing operators and users. As the leader, the government receives the overall participation of the consumers, and adjusts the subsidy rates, thus changes the operating status of the operators, and prompts them to change the pricing strategy. User engagement changes accordingly. Assume that the three subjects make decisions rationally. Repeat the above process until the benefits of each subject are maximized. At this point no one is willing to adjust the strategy, which is the final equilibrium state.
This paper selects government, car-sharing operator, and customers as the three players of the game. The government’s strategies are the subsidy rates for electric vehicles and infrastructure, denoted by , respectively. The strategy set for the operator are the pricing strategies per kilometer and per minute, denoted by , respectively. The users’ strategies are to choose electric vehicle sharing or private car travel, denoted by , respectively, where indicates whether the travel n chooses electric vehicle sharing or not, and indicates whether it chooses private car or not, represented by 1 and 0 respectively.
3.1. Payoff to Customers
Assuming that consumers are rational individuals, according to the utility theory in economics, they are certain to choose the most effective travel mode. This section builds utility functions for shared and private travel. Assume that the users mainly consider three factors: Travel expenses, travel time and comfort [21]. Calculating the time cost and comfort cost, the three factors are converted into the same dimension for comparison to determine the strategy selected by the user [22]. The main target group for sharing electric vehicles is those who have a car purchase plan or a private car with low idle rate. By comparing the travel costs of shared and private car travel, consumers can make decisions intuitively, thus delaying the purchase plan or even selling the existing vehicles. It will significantly reduce vehicle ownership, speed the urban traffic and alleviate infrastructure shortage. The coefficient of comfort cost (COM) is calculated as follows [23]:
where is the coefficient of time value; is the time value of the area; is the reduction factor of the vehicle for restoring fatigue time; is the score corresponding to the level of the j-th comfort influencing factor. The selected six indicators are ride stability, the perception of crowding in vehicle, privacy, air and temperature in vehicle, physical exertion and punctuality of the ride. Where is the average travel time of the area, is the average travel distance of the area.
• Costs for electric vehicle sharing
where and are the travel miles and time of the travel respectively; is the coefficient of comfort cost for electric vehicle sharing; is the waiting time including the time to borrowing point and from the returning point to the destination; is the time value of the user. Assume that the latter two satisfy uniform distribution [24].
where and are the upper and lower limits of the user’s time value respectively; and are the upper and lower limits of the waiting time respectively.
• Costs for private car
where is the coefficient of private car travel expenses, including fuel consumption, maintenance, tire wear, insurance, depreciation, etc; is the coefficient of comfort cost for private cars.
• Payoff of the consumers considering the travel choice
where is the decision strategy; means electric vehicle sharing is chosen during travel n; and means private car is chosen.
3.2. Payoff to Government
Considering economic, environmental and social benefits, the government’s utility function mainly includes two parts: Benefits and expenditure. The former includes the benefits of energy saving, emission reduction [25] and less parking facilities [26]. The latter are the subsidies for shared electric vehicles and infrastructure construction (converted to equal annual value). The formulation of the government’s payoff is [27,28]
where is the average number of daily travel in the region; is the number of days included in a year, which is used to convert the daily income into annual income; is the energy consumption of traditional fuel vehicles per 100 km (represented by electric energy); is the electricity price; and are the percentages of energy-saving and emission reduction of electric vehicles compared to fuel vehicles; is the carbon emission of fuel vehicles per 100 km; is the price of carbon market; is the average number of trips per day; is the cost of parking space per square meter. Where is the average parking space; is the interest rate; is the number of vehicles owned by the car-sharing operator; is the average cost of purchasing an electric vehicle; is the cost of infrastructure per sharing electric car; and , and are the lifetime of sharing electric vehicles, infrastructure and parking space, respectively.
3.3. Payoff to Operator
The operator can achieve benefits through the fees paid by consumers, the participation of grid-assisted services [29], and financial subsidies offered by the government. Costs for vehicle purchase and network construction (converted to equal annual value), operating expenses (including personnel and vehicle scheduling, facility maintenance, wages, etc.) [13] and charging costs constitute the expenditure of the operator. Its utility function is
where is the benefit coefficient of the car-sharing operator providing auxiliary services to the power grid. Here, it is simply considered that the auxiliary service revenue is linear with the number of vehicles. Where is the power consumption of electric vehicles per 100 km; is the ratio of the number of configured parking spaces to the number of vehicles; is the daily operating cost per vehicle.
3.4. Constraints
For operators, larger fleet and wider coverage will cause greater appeal to the users. However, worrying about the cost and risk, the operator generally adopts a more conservative investment strategy in the early stage and limits the fleet size within a certain range. The higher the financial subsidies are, the stronger the willingness of the operator to operate is on a large scale. The more times shared vehicles are used, the more active the operators are in predicting the industry’s prospects. Then the operator will be encouraged to increase the fleet size. Thus, considering the impact of policy and user response, the expression for the fleet size of the operator is built as follows:
where is the number of electric vehicles that the operator has when reaching the basic operation scale; and respectively reflect the degree of influence of subsidies and user travel choices on the fleet size of the operator.
4. Existence of Nash Equilibrium and Solving Algorithm
4.1. Existence of Nash Equilibrium
Theorem 1 [30]: For a multilateral Stackelberg game, if are non-empty tight convex subsets in two locally convex Hausdorff linear topological spaces respectively, the equilibrium solution exists when each player satisfies the following conditions:
- is quasi-convex
- and are continuous set-valued mappings
Obviously, strategy sets of each player are non-empty tight convex subsets. The waiting time and time value are random, which indicate that the utility functions of the players are continuous.
For the second condition in theorem 1, there have
It can be seen that the mathematical model satisfies the quasi-convex condition, so the existence of the Nash equilibrium is proved.
4.2. Nash Equilibrium Solving Algorithm
According to the game mechanism and the mathematical model constructed above, the user’s strategy can be directly optimized when the operator’s price strategies are given. Therefore, the model is simplified to a two-layer programming problem, with the government’s payoff as the objective function of the upper layer and the operator’s payoff as the objective function of the lower layer. The users’ utility function is used for travel selection, and their travel conditions are the constraints of the upper and lower layers. In this paper, the improved particle swarm optimization algorithm is used to solve the problem. When the bi-level programming model reaches stable state, the adjustment of any subject’s strategy cannot make its own benefit better. Therefore, the fitness function of the improved particle swarm optimization (PSO) algorithm is constructed as follows:
The solution process is shown in Figure 3.
- Initialize the government’s subsidy rates , and the operator’s pricing strategies according to the constraints (initialize the population).
- Calculate the users’ utility function and determine their travel mode. Then calculating the government’s and operator’s utility functions based on the users’ travel choice, the initial value of the fitness function can be obtained.
- Update the particles’ position and velocity based on the linearly decreasing inertia weight and the asynchronous change learning factor, and then update the optimal values of the individuals and group.
- Repeat step 2 and 3 until the bi-level programming reaches equilibrium.
- Output the optimal strategies of the government, operator and users.
5. Simulation Analysis and Discussion
A small town in China is selected for simulation analysis, assuming that the average daily travel times of the motor vehicle of the town is 5000. Based on the data from American National Household Travel Survey (NHTS) in 2017, Monte Carlo simulation is used to extract 5000 sets of travel data from the users who choose to travel by motor vehicle, including travel time, travel distance, the start and end time, etc. Referring to the description of the shared fleet size in [31,32], it is assumed that the basic operation scale is 40 vehicles, the response coefficient of subsidies is 16.67, and the coefficient of consumers’ enthusiasm is 0.05. Referring to the current subsidy policies and the pricing standards for taxis and shared vehicles in the town, assume that . According to the survey data of the region, the values of the remaining parameters are shown in Table 1 [23,27,28].
5.1. Pricing and Impact of Subsidies
In order to study the importance of current policy support for the development of electric vehicle sharing, this paper sets up two scenarios for case study. Scenario 1 considers the trilateral game among the government, operator and users with the government’s financial subsidies. Scenario 2 cancels the subsidy support. Only considering the environmental and social benefits of the government, a trilateral game among the same three players is built. The results are shown in Table 2. The environmental benefits include the benefits of energy-saving and emission reduction. The social benefits take the reduction of urban land pressure and delaying of the construction of ancillary service facility in the power grid into account. Their mathematical expressions are as follows:
In the unsubsidized scenario, the operator increases the prices to ensure the income level. The average daily number of sharing decreases and then the scale of operation also decreased. The reduced spending leads to higher revenue. Meanwhile, the decline in the enthusiasm of the users causes a decrease in the government benefits, resulting in a reduction in environmental and social benefits, which is not worth the loss for the government. This shows that subsidies play an important role in the early development of electric vehicle sharing. Comparing to the current mathematical models discussed about electric vehicle sharing, we take the influence of the government into account [13,14]. The analysis of this paper shows that the subsidies can give operators and consumers a positive signal, reduce the burden of initial investment by operators, support their development and operation and bring more social and environmental benefits, which can satisfy the interests of all the players in the game.
5.2. Sensitivity Analysis of Benefits to Subsidy Rates and Pricing Strategies
According to the definition of Nash equilibrium, after the game reaches equilibrium, changing the strategy of either party will result in damage to other subjects’ interests. Next, the equilibrium solution is analyzed. If the operator’s pricing strategy is adjusted, the interests of all participants are shown in Table 3, and the changes are shown in Figure 4.
According to the tabular data, when the prices are lowered by 2%, the number of shared trips increases by 5.28%. It can be seen that the users’ travel choice is very sensitive to price changes. Operator’s revenue falls by 4.15%. Government’s benefit increases by 4.14%. Among them, the environmental benefit increases by 1.87%, and the social benefit increases by 5.25%. As the cost of shared travel is reduced, more users will abandon the fuel vehicles and use the electric vehicle sharing, therefore the government’s benefit will increase. But in the early stage of the development of electric vehicle sharing, when the utilization rate of facilities is low, more users mean larger scale and greater cost. In addition, the fee income will decrease due to lower pricing. Therefore, the operator’s revenue will decline to a certain extent. Obviously, this is what the operator is not willing to see. Similarly, the upward adjustment of pricing will affect the enthusiasm of participating in sharing, resulting in the impaired benefits of the government. Only the equilibrium solution can achieve a balance acceptable to all players and contribute to the continued growth of environmental and social benefits.
Table 4 shows the benefit values when keeping the pricing strategy unchanged and adjusting the subsidy rates.
Since the charging strategy is the most direct factor affecting the user’s travel choice, the daily shared travel situation will not change if the pricing is unchanged. From the formulas of environmental and social benefit, it can be known that the benefit values are mainly related to the travel situation. Only adjusting the subsidies will not cause significant changes in their values, so the two items are not included in Table 4 for analysis. If the prices remain the same, when the subsidy rates drop by 2%, the government’s utility will increase by 0.13%, and the operator’s income will decrease by 0.14%. Then the initiatives of the operator to improve services and scale up will be disrupted, which in turn will affect the sustainable development of the industry. Even if the government’s utility improves due to the reduction of expenditures, it will be very unfavorable for the growth of environmental and social benefits in the long run. Similarly, an increase in the subsidy rate will increase government spending, affect the government’s income level and investment in other areas, which may also adversely affect the economy and people’s livelihood.
At the moment of advancing electric energy to replace other energy sources, there is still resistance to the promotion of electric vehicles, and the promotion of electric vehicle sharing still needs to be explored. From the above analysis, we can find that game theory has great advantages in coordinating the interests of multiple subjects. When the game reaches equilibrium, the adjustment of either participant’s strategy will harm the interests of the remaining participants. The equilibrium is essentially a state that is accepted by all participants and can maximize their interests. Comparing to the traditional optimization models that use the utility of the operator or users as the objective function [13,33], this paper considers the benefits of all participants in the market and coordinates them from a global perspective, which can balance the interests of all participants in the emerging industry of electric vehicle sharing, maintain their enthusiasm, and ensure the long-term sustainable development.
5.3. Analysis of the Factors Affecting Subsidies and Pricing
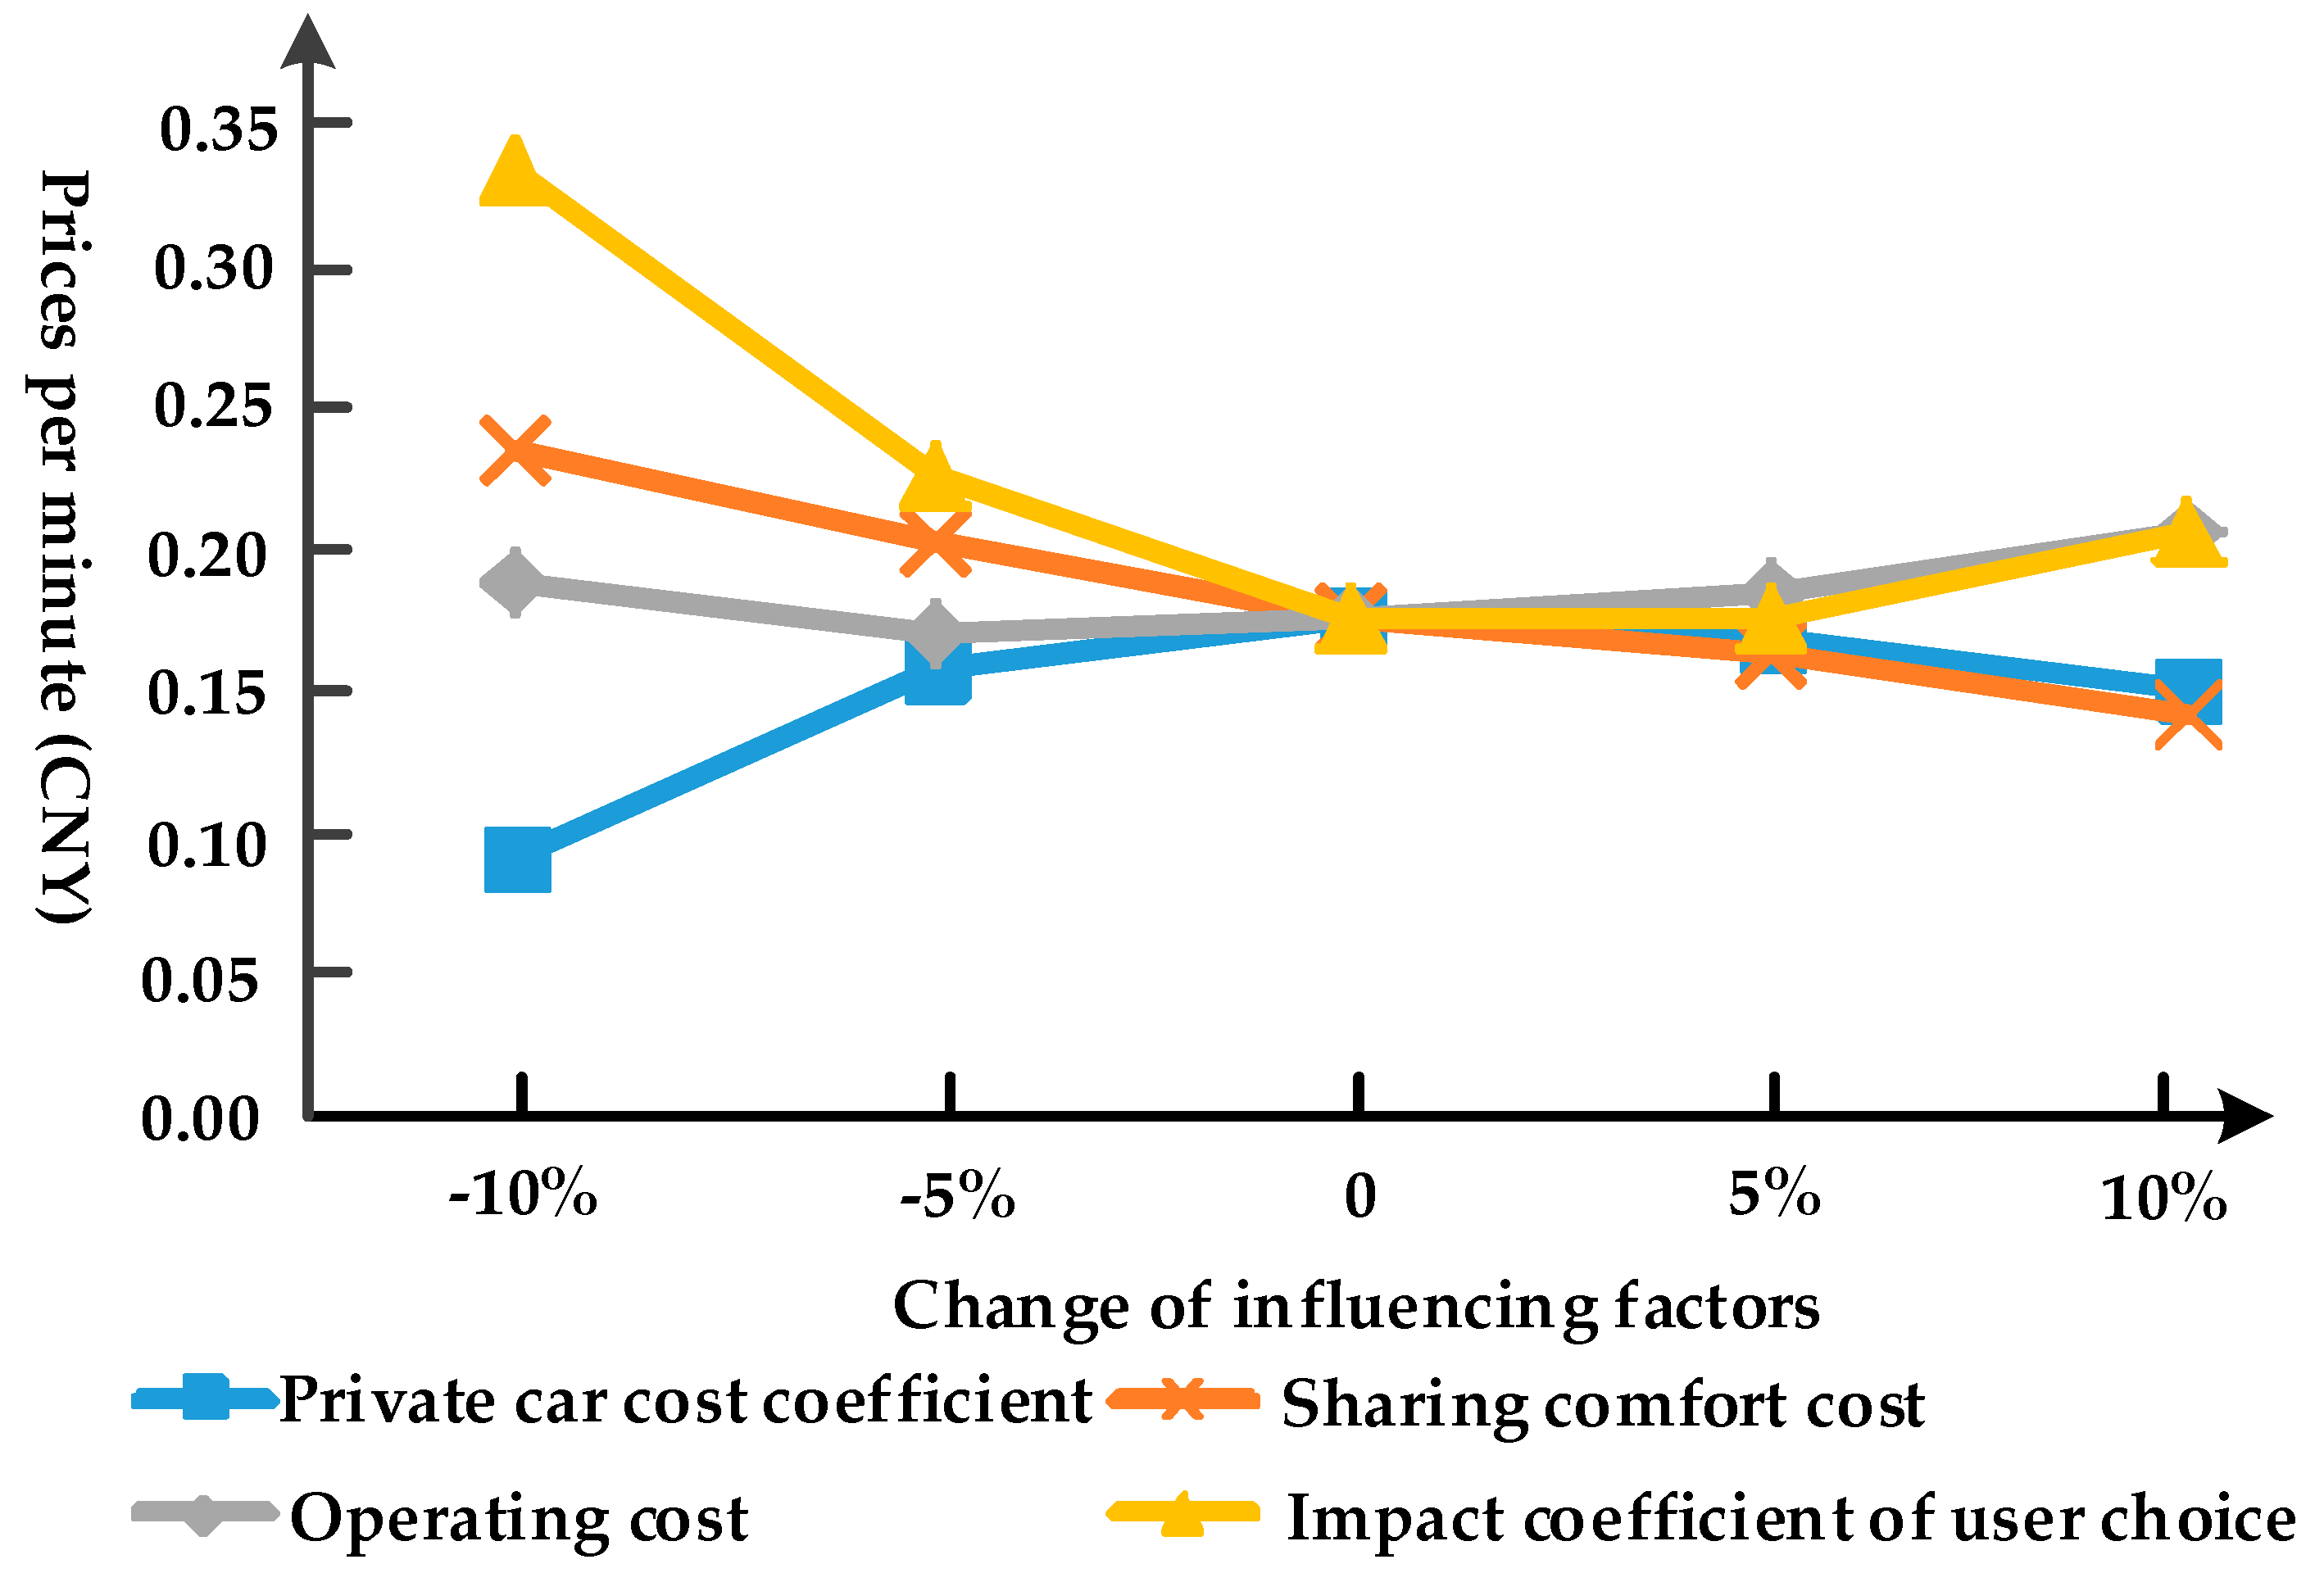
Adjust the private car cost coefficient, sharing comfort cost, operating cost, and impact coefficient of user choice and subsidy and make them change ±10%. The results are shown in the figures below. Among them, the curves for the pricing strategies per kilometer and per minute are shown in Figure 5 and Figure 6 respectively. The curves for the subsidy rates for electric vehicles and infrastructure are shown in Figure 7 and Figure 8 respectively.
As the cost of private car increases, even if the car-sharing operator raises the price, the cost of sharing travel can be lower than the private car. So the car-sharing operator’s profit margin is larger, and the price will definitely increase, as can be seen from the Figure 5 and Figure 6. However, exorbitant pricing will affect the enthusiasm of participating in sharing, especially the time-based charging price, which will aggravate the users’ anxiety when parking, especially in traffic jams. Therefore, after the initial growth, with the change in the cost of private cars, the curve of prices per minute has a slight decline in the later period, which can avoid an excessive increase in the total amount of charges when the price per kilometer is increasing. With the cost of sharing comfort increases, the comfort of using decreases. So, the operator needs to reduce charges to improve user satisfaction, and both price curves for sharing comfort cost are declining.
The price curves of the operating cost and the influence coefficient of the user’s choice are up-concave, and the subsidy rate curves are up-convex. The increase in the influence coefficient makes the operator’s fleet size increase, which leads to an increase in daily operating costs. Therefore, the curves corresponding to the two influencing factors have the same trend. The initial development of the operator focuses on expanding the scope of services. By lowering the prices, users in larger areas can be further attracted, and the utilization efficiency of facilities can be improved, thereby achieving greater benefits. At this time, the increase in policy support will help ease the economic pressure of the operator, so the subsidy rates have increased. After having a certain scale, the customer base is basically determined in the early stage of publicity and operation, and has little potential for expansion. At this time, it is necessary to improve the quality of service in order to prevent the consumer from leaving, guaranteeing vehicle availability, and making it convenient to park nearby. Increasing the prices can guarantee the revenue of the operator. For the users, the increase in satisfaction can make up for the loss caused by the increase in travel expenses. After the development of the industry enters a stable state, the encouragement brought by subsidies is weakened. The operator needs to seek new business models that do not depend on subsidies, as the subsidy rates are gradually decreasing. For the curve of the impact coefficient of subsidy, the higher the subsidy rates are, the higher the enthusiasm for participation is, and the larger the subsidy impact coefficient is.
From the above analysis, it can be seen that the private car expenses, sharing comfort and the operating cost can have a great impact on the equilibrium price of the game. The operator needs to carefully determine the value of each parameter when formulating the prices. And it should be adjusted according to the actual situation such as the change of oil price to ensure the best efficiency. The subsidy rates are closely related to the development process of electric vehicle sharing. The government can gradually adjust the subsidy rates according to the industry’s development trends to ensure the optimal comprehensive benefits.
6. Conclusions
In view of the situation that the development of electric vehicle sharing is in its early stage during which the participation of the government plays an important role, such as in China, and considering the government subsidies, a two-stage Stackelberg game model involving the government, electric vehicle sharing operator and consumers is proposed. Based on the utility theory, the model constructs the utility function of each participating entity, quantitatively considers various factors such as environmental benefits and social benefits, takes the interests of multiple participants into account, and provides ideas for car-sharing operators to formulate price strategies. The simulation results verify the correctness and effectiveness of our proposed model and indicate that game theory has great advantages in coordinating the interests of multiple subjects. Based on it, the subsidies and pricing strategies obtained can meet the interests of all participants, obtain their recognition and make the overall benefit optimal. The results also show that subsidies play an irreplaceable role in the development of electric vehicle sharing in China. Private car expenses, sharing comfort and operating costs can have a great impact on the equilibrium prices of the game. The subsidy rates are mainly related to the size of the shared operation and need to be adjusted in accordance with the actual situation.
The size of the operator’s fleet in this paper only briefly considers the impact of subsidies and user enthusiasm. A more accurate mathematical model is needed in the further development. The development of electric vehicle sharing is closely related to the social and cultural environment in which they are located. This article only uses China as an example for analysis. Subsequent research can deeply explore the impact of social and cultural factors. In the electric vehicle sharing market, the government not only exerts influence through financial subsidies, but also plays an important role in facility construction, traffic layout and so on. How to quantify and measure the effects of the government’s policy requires further research. In addition, the network settings and user requirements for electric vehicle sharing will have a significant impact on traffic conditions. Subsequent research can optimize traffic conditions in conjunction with relevant data from the transportation network.
Author Contributions
J.Y. and Y.L. conceived and designed the experiments; Y.L. performed the experiments; F.W. and L.C. analyzed the data; J.Y. and Y.L. wrote the paper; F.W. and L.C. edited the text.
Funding
This research was funded by MOE (Ministry of Education in China) Project of Humanities and Social Sciences, grant number 17YJCZH212.
Conflicts of Interest
The authors declare no conflict of interest.
References
- Zhang, L.; Hu, X.; Wang, Z.; Sun, F.; Deng, J.; Dorrell, D.G. Multiobjective Optimal Sizing of Hybrid Energy Storage System for Electric Vehicles. IEEE Trans. Veh. Technol. 2018, 67, 1027–1035. [Google Scholar] [CrossRef]
- Chen, T.D.; Kockelman, K.M.; Hanna, J.P. Operations of a shared, autonomous, electric vehicle fleet: Implications of vehicle & charging infrastructure decisions. Transp. Res. Part A Policy Pract. 2016, 94, 243–254. [Google Scholar] [Green Version]
- Shaheen, S.A.; Cohen, A.P. Carsharing and Personal Vehicle Services: Worldwide Market Developments and Emerging Trends. Int. J. Sustain. Transp. 2013, 7, 5–34. [Google Scholar] [CrossRef]
- Perboli, G.; Ferrero, F.; Musso, S.; Vesco, A. Business models and tariff simulation in car-sharing services. Transp. Res. Part A Policy Pract. 2018, 115, 32–48. [Google Scholar] [CrossRef]
- Liang, H.; Liu, Y.; Li, F.; Shen, Y. Dynamic Economic/Emission Dispatch Including PEVs for Peak Shaving and Valley Filling. IEEE Trans. Ind. Electron. 2019, 66, 2880–2890. [Google Scholar] [CrossRef]
- Zhao, J.; Wan, C.; Xu, Z.; Wong, K.P. Spinning Reserve Requirement Optimization Considering Integration of Plug-In Electric Vehicles. IEEE Trans. Smart Grid 2017, 8, 2009–2021. [Google Scholar] [CrossRef]
- Zhou, F.; Zheng, Z.; Whitehead, J.; Perrons, R.; Page, L.; Washington, S. Projected prevalence of car-sharing in four Asian-Pacific countries in 2030: What the experts think. Transp. Res. Part C Emerg. Technol. 2017, 84, 158–177. [Google Scholar] [CrossRef]
- Zhu, X.; Li, J.; Liu, Z.; Yang, F. Location deployment of depots and resource relocation for connected car-sharing systems through mobile edge computing. Int. J. Distrib. Sens. Netw. 2017, 13, 155014771771162. [Google Scholar] [CrossRef]
- Li, W.; Li, Y.; Fan, J.; Deng, H. Siting of Carsharing Stations Based on Spatial Multi-Criteria Evaluation: A Case Study of Shanghai EVCARD. Sustainability 2017, 9, 152. [Google Scholar] [CrossRef]
- Becker, H.; Ciari, F.; Axhausen, K.W. Measuring the car ownership impact of free-floating car-sharing – A case study in Basel, Switzerland. Transp. Res. Part D Transp. Environ. 2018, 65, 51–62. [Google Scholar] [CrossRef]
- Kopp, J.; Gerike, R.; Axhausen, K.W. Do sharing people behave differently? An empirical evaluation of the distinctive mobility patterns of free-floating car-sharing members. Transportation 2015, 42, 449–469. [Google Scholar] [CrossRef]
- Illgen, S.; Höck, M. Electric vehicles in car sharing networks—Challenges and simulation model analysis. Transp. Res. Part D Transp. Environ. 2018, 63, 377–387. [Google Scholar] [CrossRef]
- Xu, M.; Meng, Q.; Liu, Z. Electric vehicle fleet size and trip pricing for one-way carsharing services considering vehicle relocation and personnel assignment. Transp. Res. Part B Methodol. 2018, 111, 60–82. [Google Scholar] [CrossRef]
- Chen, T.D.; Kockelman, K.M. Management of a Shared Autonomous Electric Vehicle Fleet: Implications of Pricing Schemes. Transp. Res. Record 2016, 2572, 37–46. [Google Scholar] [CrossRef]
- Kim, D.; Ko, J.; Park, Y. Factors affecting electric vehicle sharing program participants’ attitudes about car ownership and program participation. Transp. Res. Part D Transp. Environ. 2015, 36, 96–106. [Google Scholar] [CrossRef]
- Rabbitt, N.; Ghosh, B. Economic and environmental impacts of organised Car Sharing Services: A case study of Ireland. Res. Transp. Econ. 2016, 57, 3–12. [Google Scholar] [CrossRef]
- Terrien, C.; Maniak, R.; Chen, B.; Shaheen, S. Good practices for advancing urban mobility innovation: A case study of one-way carsharing. Res. Transp. Bus. Manag. 2016, 20, 20–32. [Google Scholar] [CrossRef]
- Li, Y.; Zhan, C.; De Jong, M.; Lukszo, Z. Business innovation and government regulation for the promotion of electric vehicle use: Lessons from Shenzhen, China. J. Clean. Prod. 2016, 134, 371–383. [Google Scholar] [CrossRef]
- Qiao, Q.; Zhao, F.; Liu, Z.; Hao, H. Electric vehicle recycling in China: Economic and environmental benefits. Resour. Conserv. Recycl. 2019, 140, 45–53. [Google Scholar] [CrossRef]
- Guiding Opinions of the Two Sectors on Promoting the Healthy Development of Small and Minibus Leases. Available online: http://www.gov.cn/xinwen/2017-08/08/content_5216567.htm (accessed on 14 March 2019).
- Vredin Johansson, M.; Heldt, T.; Johansson, P. The effects of attitudes and personality traits on mode choice. Transp. Res. Part A Policy Pract. 2006, 40, 507–525. [Google Scholar] [CrossRef] [Green Version]
- Zhou, X.; Chen, J.; Xie, P.; Zeng, C.; Yang, J. Load demand analyzing method for electric vehicle charging station based on the principle of maximizing utility. Electr. Meas. Instrum. 2018, 55, 1–8. [Google Scholar]
- He, S. Analysis of Travel Mode Choice Behavior of Urban Residents Based on Generalized Cost. Mod. Transp. Technol. 2016, 13, 79–83. [Google Scholar]
- Yang, H.; Yan Kong, H.; Meng, Q. Value-of-time distributions and competitive bus services. Transp. Res. Part E Logist. Transp. Rev. 2001, 37, 411–424. [Google Scholar] [CrossRef]
- Prud’homme, R.; Koning, M. Electric vehicles: A tentative economic and environmental evaluation. Transp. Policy 2012, 23, 60–69. [Google Scholar] [CrossRef] [Green Version]
- Sun, L.; Wang, S.; Liu, S.; Yao, L.; Luo, W.; Shukla, A. A completive research on the feasibility and adaptation of shared transportation in mega-cities—A case study in Beijing. Appl. Energy 2018, 230, 1014–1033. [Google Scholar] [CrossRef]
- Sun, B.; Ruan, H.; Xu, W.; Jiang, J.; Gong, M. Quantitative Analysis of Influence Factors about EV’s Charging Electricity Price Based on the Static Non-Cooperative Game Theory. Trans. China Electrotech. Soc. 2016, 31, 75–85. [Google Scholar]
- Zhang, C.; Wen, F.; Xue, Y.; Yuan, J.; Li, B.; Wang, H. A preliminary investigation on the overall profit assessment of electric vehicle development to the society. J. North China Electr. Power Univ. 2014, 41, 55–63. [Google Scholar]
- Iacobucci, R.; McLellan, B.; Tezuka, T. Modeling shared autonomous electric vehicles: Potential for transport and power grid integration. Energy 2018, 158, 148–163. [Google Scholar] [CrossRef]
- Jia, W.; Xiang, S.; He, J.; Yang, Y. Existence and stability of weakly Pareto-Nash equilibrium for generalized multiobjective multi-leader–follower games. J. Glob. Optim. 2015, 61, 397–405. [Google Scholar] [CrossRef]
- Barth, M.; Todd, M. Simulation model performance analysis of a multiple station shared vehicle system. Transp. Res. Part C Emerg. Technol. 1999, 7, 237–259. [Google Scholar] [CrossRef]
- Wang, L.; Shu, Y.; Tang, L.; Zhang, W. Adaptive Scheduling Strategy in Car-sharing System Based on Feedback Dynamic Pricing. J. Transp. Syst. Eng. Inf. Technol. 2018, 18, 12–17+74. [Google Scholar]
- Boyacı, B.; Zografos, K.G.; Geroliminis, N. An optimization framework for the development of efficient one-way car-sharing systems. Eur. J. Oper. Res. 2015, 240, 718–733. [Google Scholar] [CrossRef] [Green Version]
Figure 1.
Relationships among the participants of electric vehicle sharing.

Figure 2.
Framework of the two-stage Stackelberg game model.

Figure 3.
Process of finding Nash equilibrium.

Figure 4.
Changes in the benefits and number of shared travelers with pricing.

Figure 5.
Curve of prices per kilometer.

Figure 6.
Curve of prices per minute.

Figure 7.
Curve of the subsidy rates of electric vehicles.

Figure 8.
Curve of subsidy rates of infrastructure.


Table 1.
Parameter value for game solving.
| Parameter | Value | Parameter | Value |
|---|---|---|---|
| 76. 662 | 1.3 | ||
| 0.81 | 35. 001 | ||
| 50.5% | 10% | ||
| 28.7% | 4 | ||
| 14.955 | 20 | ||
| 0.15 | 10 | ||
| 2 | 1/6 | ||
| 2500 | 5/6 | ||
| 30 | 5 | ||
| 134800 | 15 | ||
| 30000 | 2.63 | ||
| 150 | 0.3 | ||
| 365 | 0.09 | ||
| 1277.5 |
Table 2.
Equilibrium solution and the benefits of each participant in two scenarios.
| Parameter | Scenario 1 (with Subsidies) | Scenario 2 (no Subsidies) |
|---|---|---|
| Price per kilometer (CNY) | 1.683 | 1.7823 |
| Price per minute (CNY) | 0.175 | 0.1883 |
| Subsidy rate for electric vehicles | 0.1444 | / |
| Subsidy rate for infrastructure | 0.3835 | / |
| The number of sharing travel daily | 2008 | 1650 |
| Sharing travel ratio | 40.16% | 33.00% |
| Operator benefit (million CNY) | 16.30 | 18.14 |
| Government benefit (million CNY) | 17.73 | 16.22 |
| Environmental benefit (million CNY) | 6.57 | 6.13 |
| Social benefit (million CNY) | 12.46 | 10.24 |
Table 3.
Benefits of all participants after adjustment of prices.
| Parameter | −2% | −1% | 0% | 1% | 2% |
|---|---|---|---|---|---|
| The number of sharing travel daily | 2114 | 2053 | 2008 | 1956 | 1906 |
| Sharing travel ratio | 42.28% | 41.06% | 40.16% | 39.12% | 38.12% |
| Operator benefit (million CNY) | 15.6235 | 15.9856 | 16.2992 | 16.6573 | 16.9736 |
| Government benefit (million CNY) | 18.4681 | 18.0497 | 17.7347 | 17.3737 | 17.0311 |
| Environmental benefit (million CNY) | 6.6978 | 6.6299 | 6.5750 | 6.5094 | 6.4574 |
| Social benefit (million CNY) | 13.1186 | 12.7419 | 12.4642 | 12.1426 | 11.8344 |
Table 4.
Interests of all participants after adjustment of subsidy rates.
| Parameter | −2% | −1% | 0% | 1% | 2% |
|---|---|---|---|---|---|
| The number of sharing travel daily | 2008 | 2008 | 2008 | 2008 | 2008 |
| Operator benefit (million CNY) | 16.2769 | 16.2881 | 16.2992 | 16.3104 | 16.3215 |
| Government benefit (million CNY) | 17.7570 | 17.7459 | 17.7347 | 17.7236 | 17.7124 |
© 2019 by the authors. Licensee MDPI, Basel, Switzerland. This article is an open access article distributed under the terms and conditions of the Creative Commons Attribution (CC BY) license (http://creativecommons.org/licenses/by/4.0/).
Share and Cite
MDPI and ACS Style
Yang, J.; Lin, Y.; Wu, F.; Chen, L. Subsidy and Pricing Model of Electric Vehicle Sharing Based on Two-Stage Stackelberg Game – A Case Study in China. Appl. Sci. 2019, 9, 1631. https://doi.org/10.3390/app9081631
AMA Style
Yang J, Lin Y, Wu F, Chen L. Subsidy and Pricing Model of Electric Vehicle Sharing Based on Two-Stage Stackelberg Game – A Case Study in China. Applied Sciences. 2019; 9(8):1631. https://doi.org/10.3390/app9081631
Chicago/Turabian StyleYang, Jun, Yangjia Lin, Fuzhang Wu, and Lei Chen. 2019. "Subsidy and Pricing Model of Electric Vehicle Sharing Based on Two-Stage Stackelberg Game – A Case Study in China" Applied Sciences 9, no. 8: 1631. https://doi.org/10.3390/app9081631
Note that from the first issue of 2016, this journal uses article numbers instead of page numbers. See further details here.