Time Domain NMR in Polymer Science: From the Laboratory to the Industry


1
Università degli Studi di Milano-Bicocca, Milan, Department of Materials Science, Via R. Cozzi, 55, 20125 Milan, Italy
2
Trelleborg Coated Systems Italy S.p.A., SP140, 26855 Lodi Vecchio (LO), Italy
*
Authors to whom correspondence should be addressed.
Appl. Sci. 2019, 9(9), 1801; https://doi.org/10.3390/app9091801
Submission received: 22 March 2019
/
Revised: 15 April 2019
/
Accepted: 23 April 2019
/
Published: 30 April 2019
(This article belongs to the Special Issue Applications of Low Field Magnetic Resonance)
Abstract
:Highly controlled polymers and nanostructures are increasingly translated from the lab to the industry. Together with the industrialization of complex systems from renewable sources, a paradigm change in the processing of plastics and rubbers is underway, requiring a new generation of analytical tools. Here, we present the recent developments in time domain NMR (TD-NMR), starting with an introduction of the methods. Several examples illustrate the new take on traditional issues like the measurement of crosslink density in vulcanized rubber or the monitoring of crystallization kinetics, as well as the unique information that can be extracted from multiphase, nanophase and composite materials. Generally, TD-NMR is capable of determining structural parameters that are in agreement with other techniques and with the final macroscopic properties of industrial interest, as well as reveal details on the local homogeneity that are difficult to obtain otherwise. Considering its moderate technical and space requirements of performing, TD-NMR is a good candidate for assisting product and process development in several applications throughout the rubber, plastics, composites and adhesives industry.
1. Introduction
Nowadays, polymers are of major practical importance, since they have low cost and show unique physical properties, such as viscoelasticity, toughness, and ability to form either glasses, semi-crystalline or elastic materials, that scale easily with minimal variation of either chemistry, and molecular weight [1]. They are found in many applications, from packaging to automotive and healthcare [2]. It is fundamental to understand the materials’ behavior, correlating their microscopic properties with their macroscopic performances in real applications and vice versa, in order to improve the final products, acting on either the polymer chemistry or the manufacturing parameters. Therefore, tools are needed to monitor the “state of the art” of the current materials and processes.
NMR (nuclear magnetic resonance) has always been one of the main characterization techniques for solid polymeric materials, since its first applications in the 1970s. Particularly, solid-state NMR allows to study polymers at a molecular level in almost all their states and with minimal sample preparation procedure, in a non-destructive manner [3,4,5]. The use of high field instruments gives insights into the chemical and structural composition of polymers, but these instruments are expensive and require great maintenance limiting their application in industrial contexts. A powerful alternative can come from low-field benchtop devices, operating in time domain. They are easy to use, even for relatively unspecialized personnel, therefore they allow to conduct measurements fast and without any special sample preparation. With appropriate calibration procedure, quantitative information is obtainable. In addition to that, their small size makes them easily implementable in every laboratory, and their footprint is low since they operate through permanent magnets, which do not require cryogenic gases. Low-field instruments are both in closed geometry and in open geometry, such as the NMR-MOUSE [6]. The former are valuable tools to characterize bulk properties, while the latter possesses highly inhomogeneous fields, which, through hampering FID (free induction decay) detection, enables to gain space-dependent information, varying the position of the instrument on the material and its distance to the surface, thus selecting a slice along the material’s thickness. The most industrially relevant topic is by far the NMR of proton (1H) atoms, ubiquitous in organic compounds, polymers, and natural materials.
Though 1H LF-TD-NMR does not provide chemical information, since after Fourier transform chemical shift dispersion is extremely limited and basically all the protons contribute to a single resonance, it has been proved to be useful to study the dynamical properties of polymer chains.
This information can be drawn from the relaxation of 1H spins. The restoration of a spin thermal equilibrium state with the lattice in an external static magnetic field, following a perturbation through sequences of electromagnetic pulses, is characterized by two relaxation times: a spin–spin (T2) and a spin–lattice (T1) relaxation time. Their magnitude is dependent upon how the interaction between spins and with the environment (the so-called lattice) is modulated by the molecular mobility. In fact, they show well-known dependence with the motional correlation time τc (Figure 1), described by the BPP equations (Bloembergen–Purcell–Pound) [7], in the hypothesis of two equal spins where the only relaxation channel is the dipolar interaction between them:
Therefore, their determination can be exploited to discriminate different dynamical regimes inside the material, depending on its structure and morphology. Motional correlation times affect, in turn, macroscopic dynamical behavior, related to viscoelasticity, mechanical response, and processing characteristics, which are, in the end, the main concerns for specific applications.
Some methods require additional equipment, such as fast-field cycling (FFC) and pulse field gradient (PFG).
FFC allows to measure T1 as function of the variation of the magnetic field strength, spanning on a wide range of frequencies. This can be obtained either with a single instrument, capable of fast electrical switching of the field, or physically moving the sample in instruments with different magnetic fields [8]. Referring to Equation (1), the analysis of the dispersion curve of T1 vs. ω0 (Larmor frequency, that is the frequency associated with the precession of the spin caused by the magnetic field) allows to distinguish different correlation times, which define different dynamics inside the polymeric material [9]. This can be useful to perform “molecular rheology” experiments.
Instead, PFG is a technique to monitor the molecular diffusion and requires a tunable magnetic field gradient. The NMR signal attenuation after the pulsed gradient is dependent on the diffusion coefficient of the molecule [10]. It can be exploited to study the dynamics of polymers in solution or inside porous materials [11,12]. Although interesting for polymer characterization, these two techniques will not be further addressed in this review, since we decided to deal with the basic equipment for LF-TD-NMR in the characterization of polymeric items.
Although in principle all nuclear spins can be studied with LF-TD-NMR, only abundant ½ spins can be measured with reasonable signal-to-noise ratio, furthermore, only spins with high gyromagnetic have significant Larmor frequencies at low field, basically only two systems satisfy these two requirements at the same time: 1H and 19F. In this review, we focus just on 1H, and we would like to highlight the main applications of pulse sequences that can be conducted on low-field NMR instruments and the relevant parameters that can be drawn out. Parameters that can help to understand polymeric materials in two different environments: at an academic level for the characterization of innovative polymeric materials or to highlight basic polymer physics, in the industry for R&D and quality control (QC). A special section has been dedicated to bioplastics. In fact, future perspectives are oriented towards the substitution of traditional plastics with raw materials coming from natural resources. Preliminary studies have been made to assess the physical properties of these new materials.
2. Sequences
LF-NMR suffers some specific disadvantages, especially magnetic field inhomogeneities, long instrument dead-time, and low signal-to-noise ratio. To overcome them, traditional pulse sequences to extract dynamic parameters at high field have been adapted for the application at lower fields.
Experiments are usually accumulated to increase the signal-to-noise ratio, between each scan time of approximately 5T1 is chosen to allow a complete return to the equilibrium state along the z-axis, corresponding to the direction of the static magnetic field. Since relaxation times magnitude is field dependent, increasing with field strength, that is a point in favor of low-field devices, because the lower T1 means a decrease in the experimental time.
Hereby, the main experimental methodologies are addressed. Examples of applications are postponed to Section 3.
2.1. 1H T2 Relaxation
Numerically T2 is the time required to achieve 37% of dephasing of magnetization, flipped in the transverse (xy) plane respect to the static magnetic field, so it is called transverse relaxation time. Here it is useful to remind the reader that the orientation of the magnetic field defines the z-axis of both the laboratory frame and the rotating frame, thus x and y are transverse axes. The dephasing is caused by the interactions existing within the spins’ ensemble, due to random variation in the local field experienced by each spin, and it is not associated with any energy exchange with the environment.
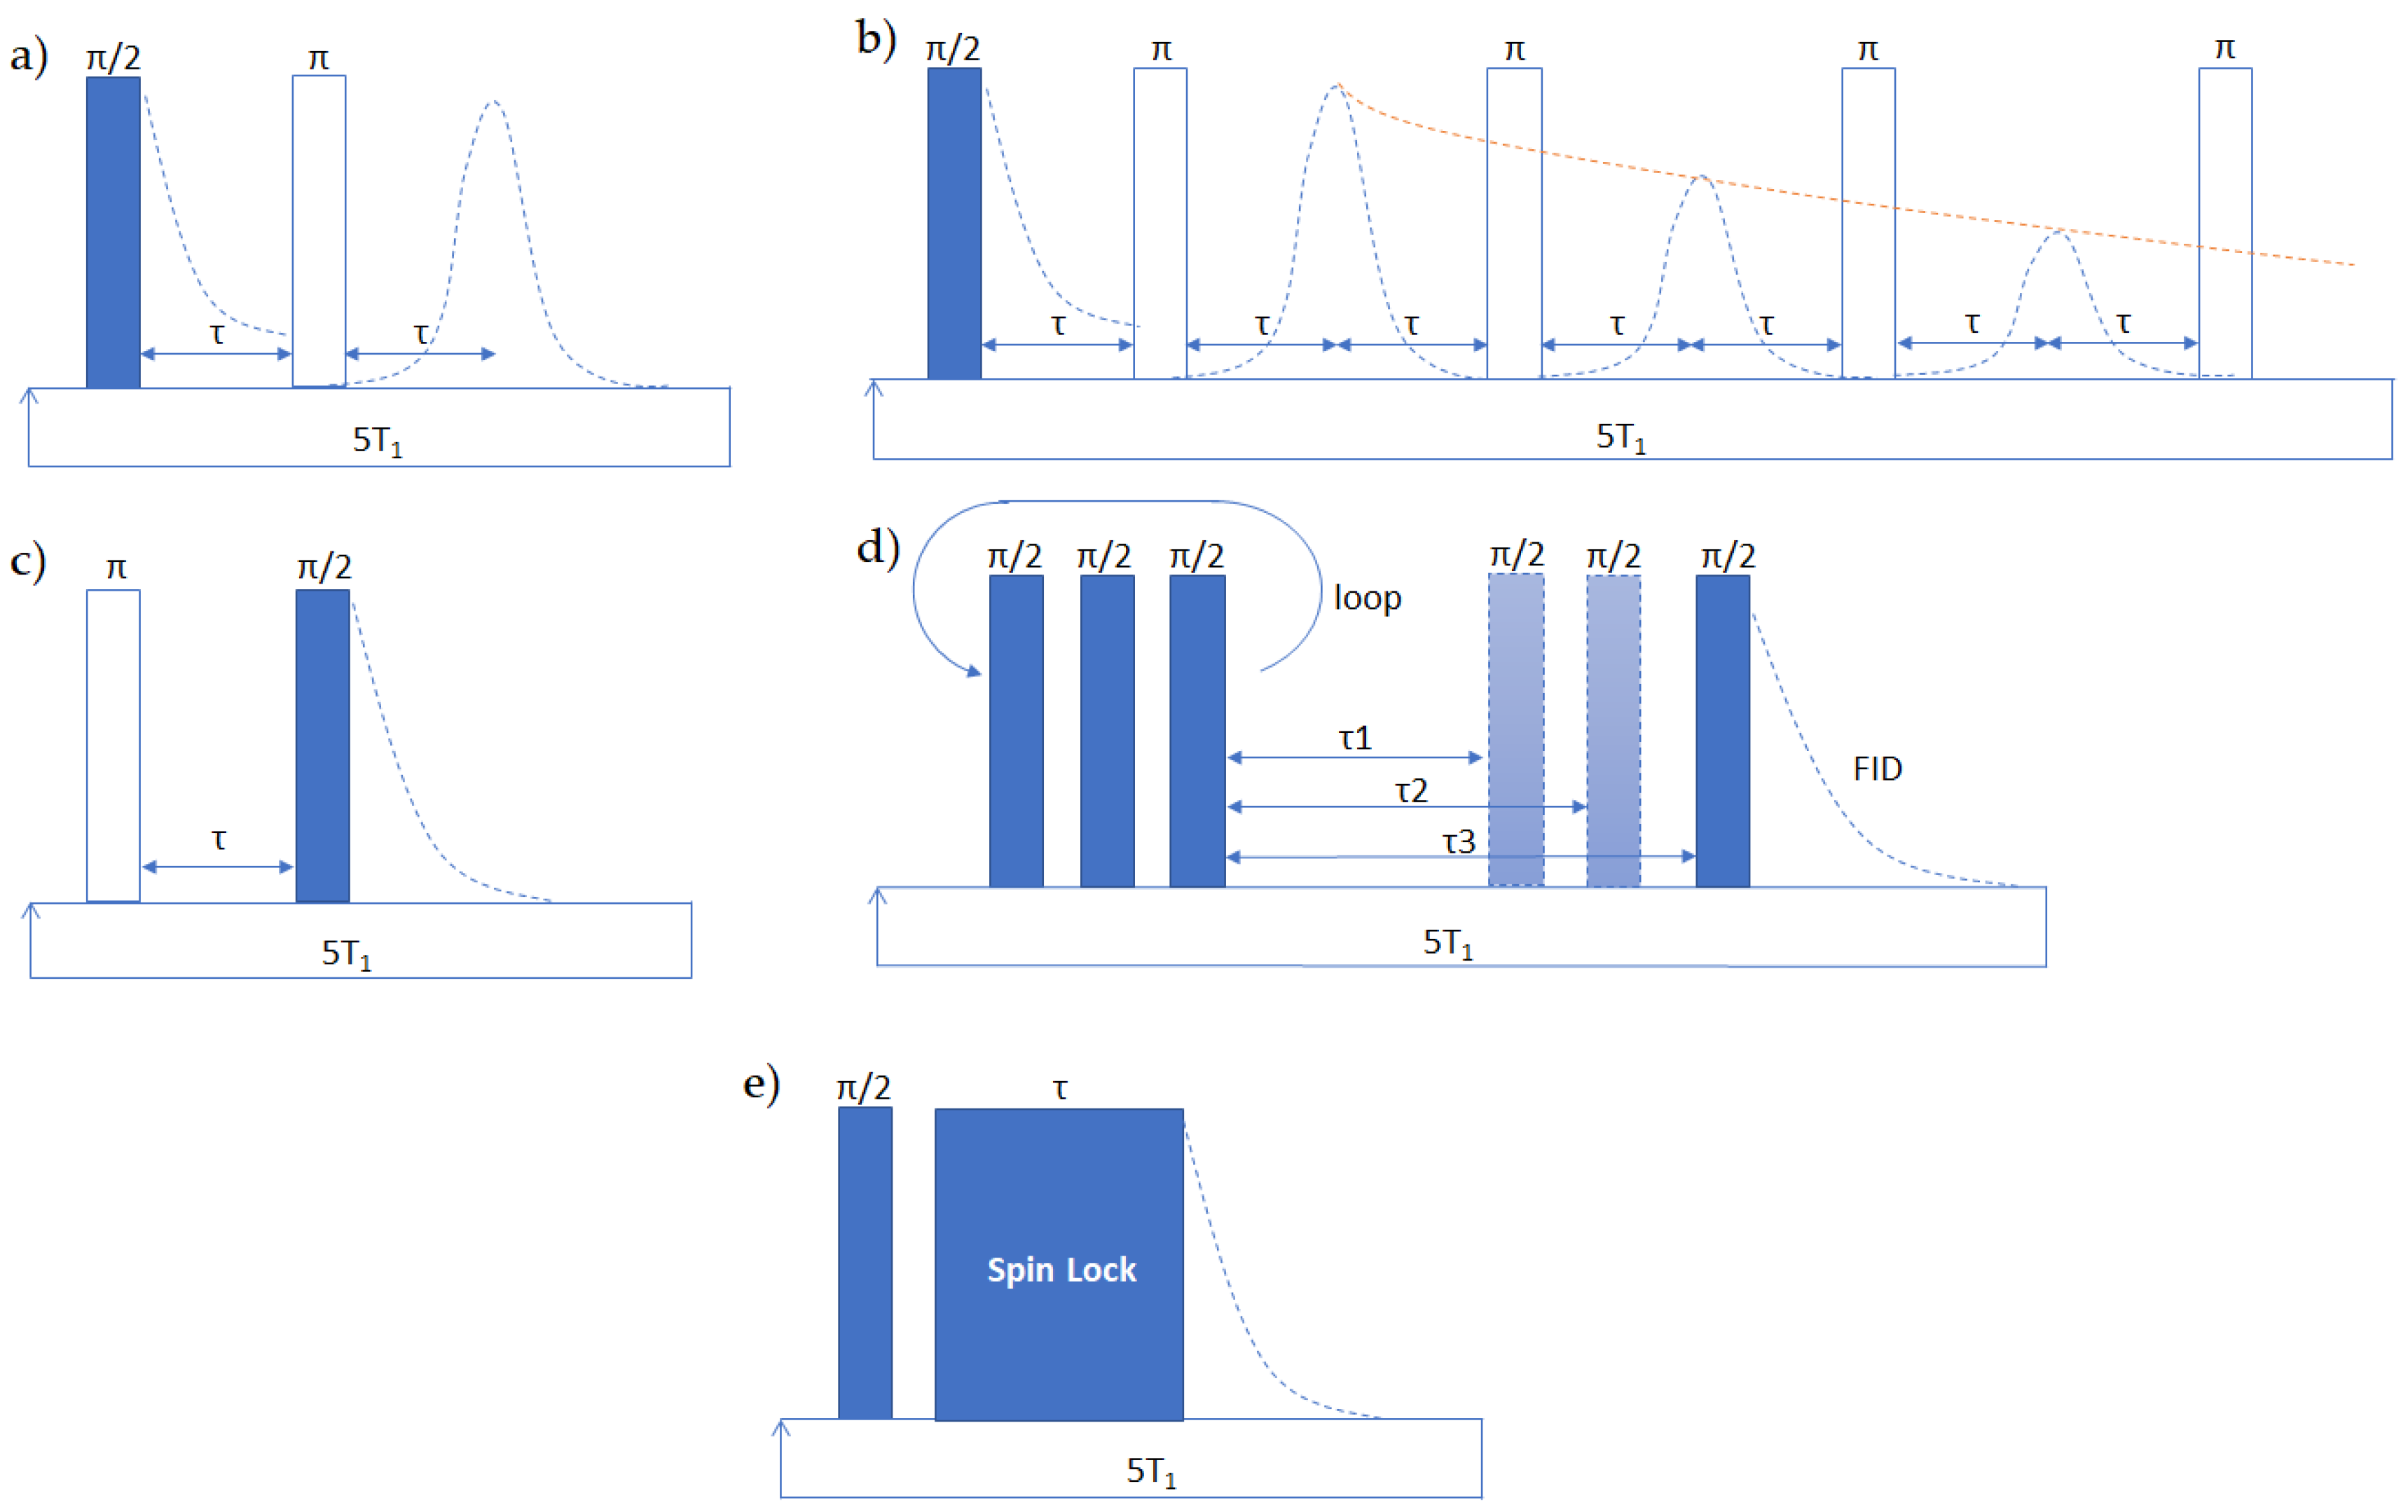
Theoretically, T2 should be obtained by flipping the magnetization on the xy plane with a single π/2 pulse and then analyzing the free induction decay (FID)
However, especially with low-field devices and with solid samples, field inhomogeneities cause an additional contribution to the decoherence of spins, producing a much shorter decay time, indicated as T2*, this phenomenon is substantially uncorrelated with the dynamic phenomena. To remove the field’s effect, more complex sequences need to be applied, as shown in Figure 2, T2 is prevalently influenced by slow motional dynamics.
Hahn echo (HE) [13] (Figure 2a) and CPMG (Carr–Purcell–Meiboom–Gill) [14] (Figure 2b) experiments rely on the formation of spin echoes. The application of an initial π/2 pulse is followed by π pulses that refocus the dephasing of spins due to field inhomogeneities, with the creation of an echo. The echo amplitude reduction is determined only by the transversal relaxation processes. HE employs a two-pulse scheme, repeated for increasing separation times between the two pulses, while CPMG employs a single π/2 pulse followed by multiple π pulses, separated by the same echo time. CPMG is faster than HE, but it is subjected to imperfection in the pulses and off-resonance effects, especially for highly coupled systems, while HE cannot offset spatial dislocation of the nuclei, and becomes unsuitable for the study of fluids [15].
Both experiments can also be performed on NMR-MOUSE devices [6], with appropriate adaptation. First of all, the π pulse is obtained doubling the amplitude of the π/2 pulse, instead of doubling the length, to excite a specific slice, and secondly, the signal decays according to an effective relaxation time T2,eff, which is a mixture of T1 and actual T2, because of the strong field gradient.
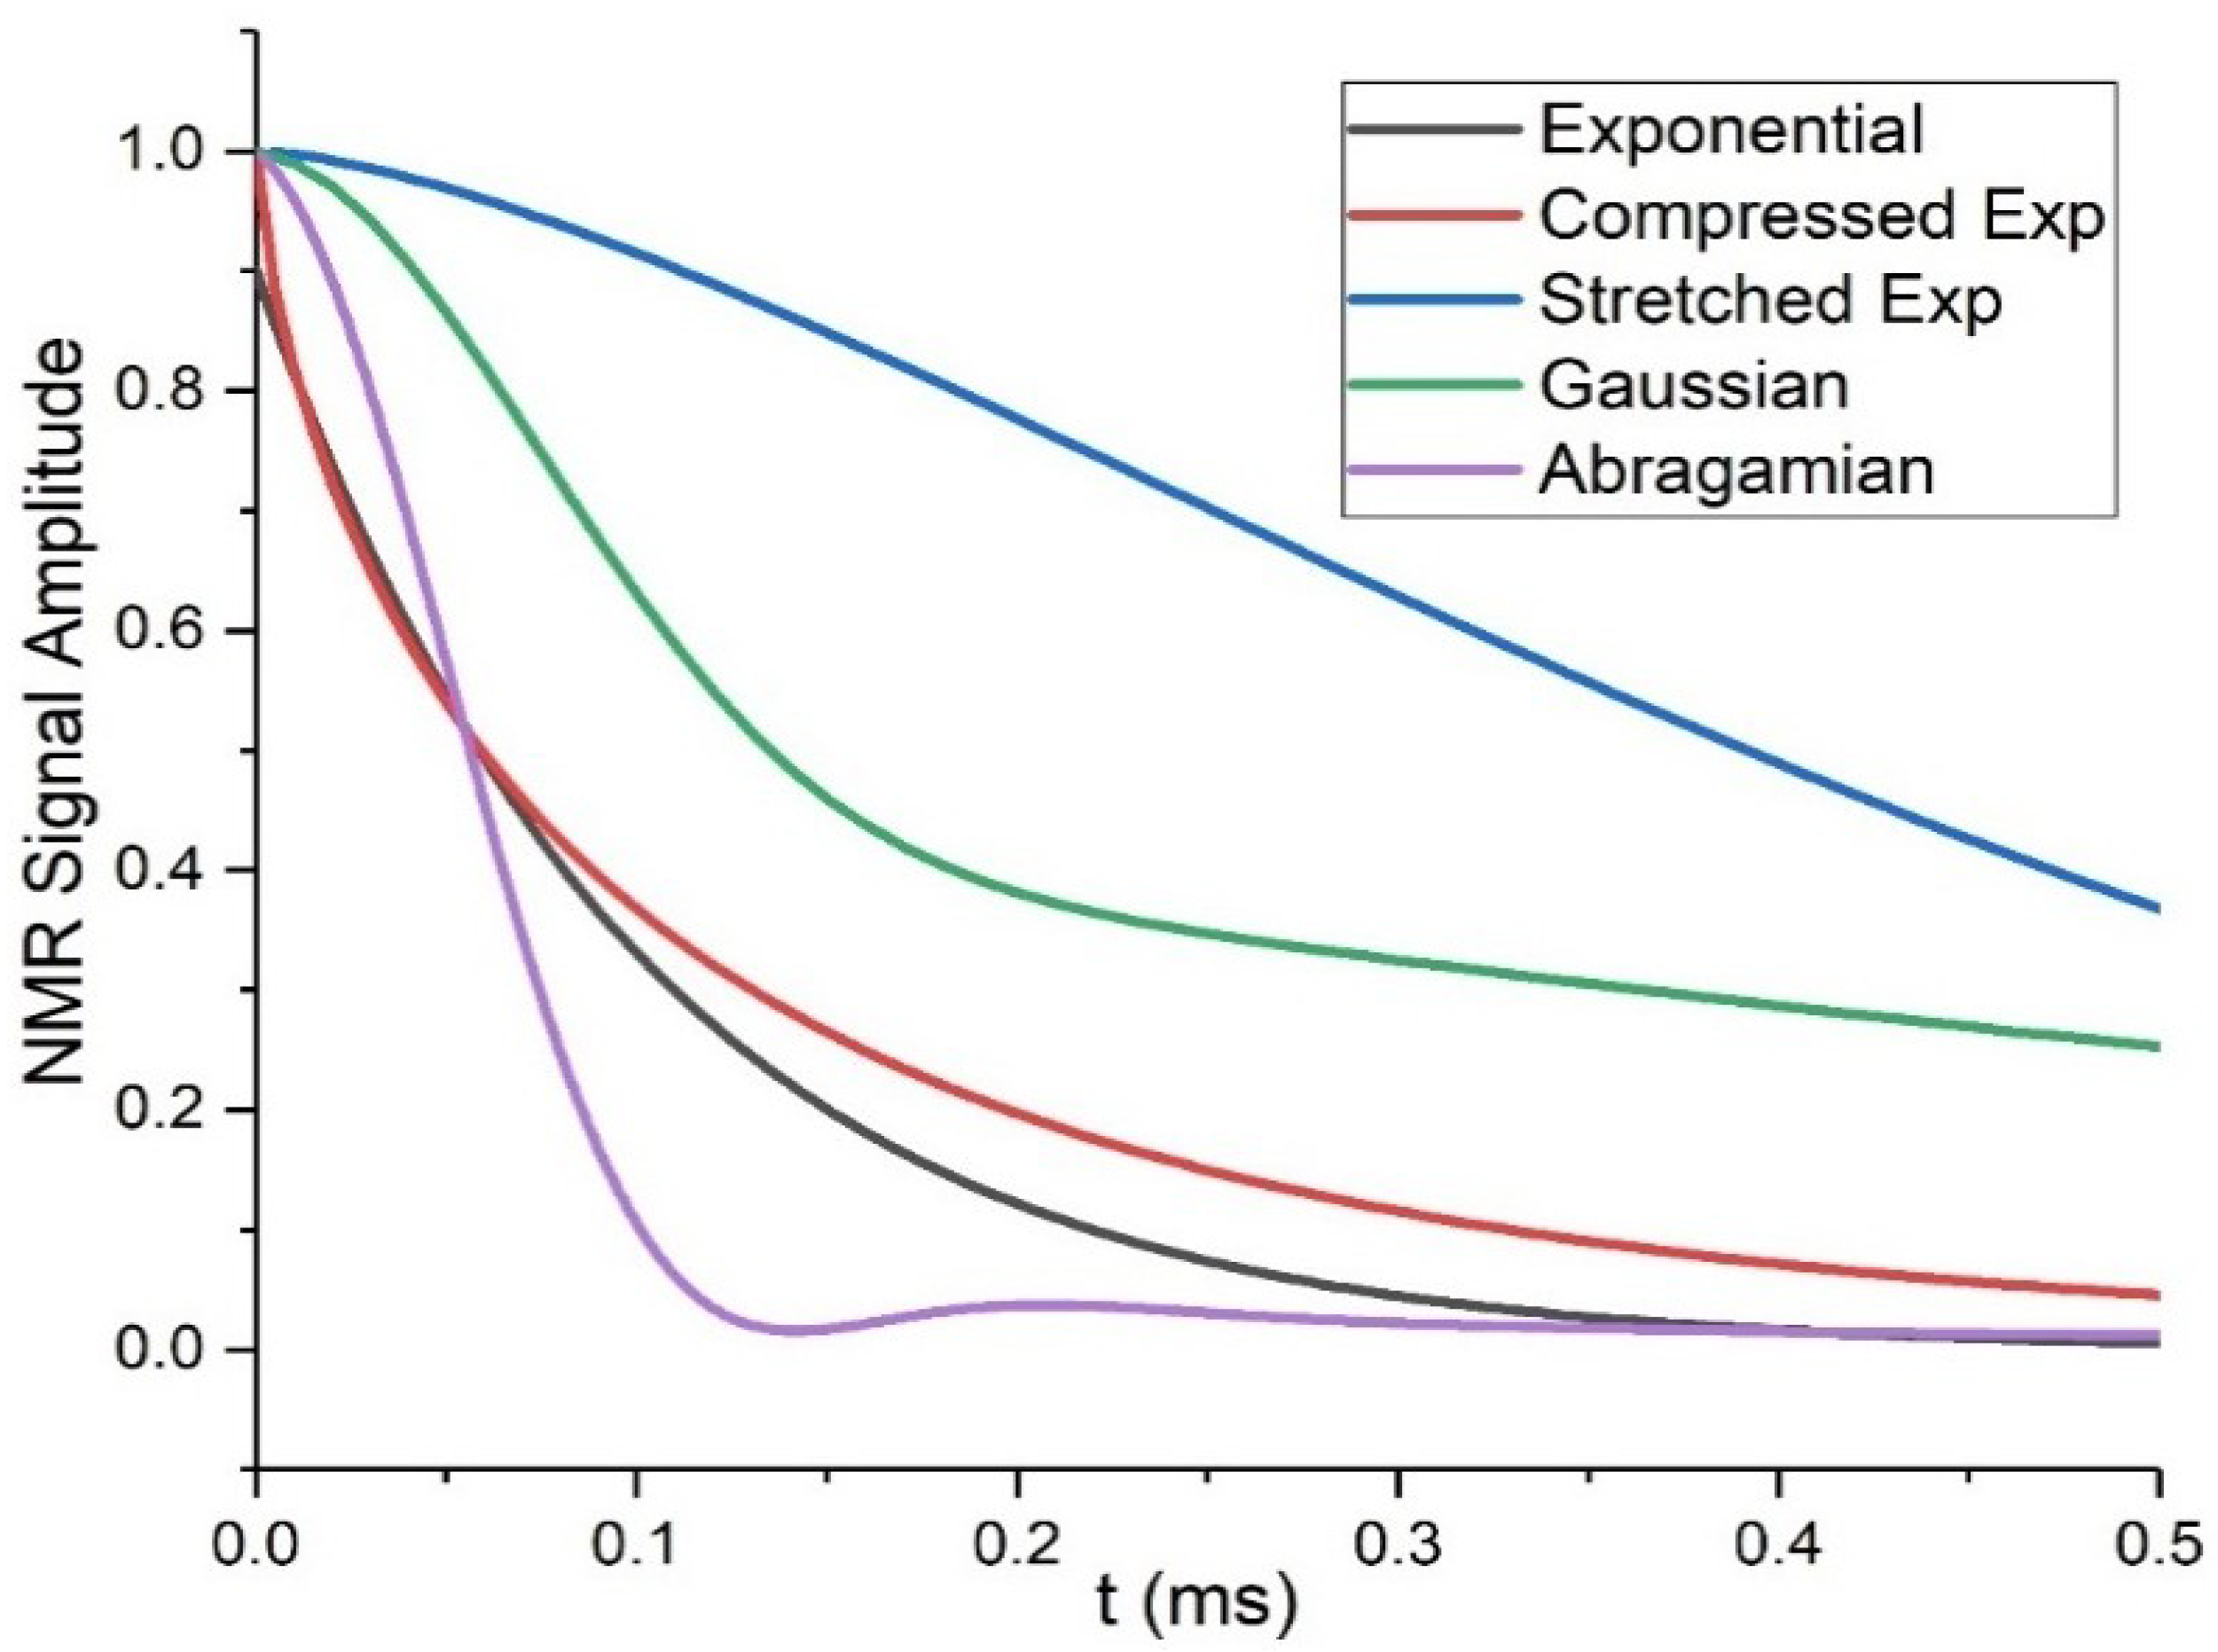
T2 decay is represented according to different models: for liquids or systems with high mobility, exponential decays describe the system rather well, but for strongly restricted mobility more complex representations, including Gaussian (), Abragamian ( (4) where a2+b2/3=M2 is the second Van Vleck moment) or stretched or compressed exponentials ( functions, are employed. The Abragamian function (Equation (4)) is often used to represent the shape of magnetization decays of crystalline lattices, which is influenced by the strong contribution of the second dipole moment, caused by the high number of interacting dipolar-coupled pairs. A compressed exponential, also called Weibullian function, so-defined when n in Equation (5) is comprised between one and two, gives a better description of more isotropic dynamics, for example in liquids or polymers above Tg, especially when the decay depends on dipolar couplings. Instead, for n below one the exponential is defined as stretched and indicates inhomogeneous distributions of exponential decays, that it is interpreted as inhomogeneity of the sample itself [16]. Multiphase systems usually generate multi-modal decays, described by combinations of the above functions (Figure 3 depicts the curve forms of the equations described above).
2.2. 1H T1 Relaxation
It is the characteristic time that describes the recovery of magnetization along the static field direction axis, or longitudinal relaxation. Since it involves a variation of the total energy of the system, it implies an energy exchange between the spin system and the environment. This is allowed if the energy gap between the high-energy and low-energy spin states overlaps with the vibrational and rotational energies associated with motional states of the atoms in the surrounding environment. Analysis of T1 relaxation gives back information about faster segmental dynamics, involving motion of side groups or rotations in the backbone.
It is usually measured with saturation recovery (SATREC) [17]) (Figure 2d) or inversion recovery (INVREC) [18] (Figure 2c) experiments. The main difference is the initial flipping of magnetization in the INVREC, substituted in the SATREC by a train of π/2 pulses, to set the magnetization in the transverse plane to zero. Inversion provides better quality fittings, but it is unsuitable in highly coupled systems where quantitative inversion is not easily achieved.
Ideally, signals acquired with these sequences are fitted by a sum of exponential decay functions, corresponding to different phases within the sample. Operatively single exponential decay is usually prevalent, even for multiphase materials, because of spin diffusion [3,4]. In fact, T1 measurements require a longer time than T2 measurements, since T1 is longer than T2, and consequently the magnetization has the time to transfer from one domain to another during the measurement, averaging the magnetization all over the samples. That makes it difficult to distinguish between different phases, especially at low-field where the longitudinal relaxation occurs on the same timescale as the spin-diffusion process.
2.3. 1H T1 in the Rotating Frame (1H T1ρ)
The relaxation time T1ρ describes a relaxation process that takes place in the presence of both the static field and a time-dependent field B1. It is typically obtained by applying a spin-lock sequence, and then sampling the FID amplitude at increasing spin-locking times (Figure 2e) [19]. The decay is an exponential function, similarly to T2 [20]. It allows to probe very slow motions, from 100 Hz to the order of few kHz, such as chain rearrangements. It can be used to study chain packing, because of its sensitivity both to system homogeneity and to the degree of order (longer T1ρ, better polarization efficiency of the spin-lock pulse, higher chain organization).
2.4. Multiple-Quantum (MQ)
MQ-NMR established itself as the most powerful and reliable method to measure the residual dipolar couplings (Dres) in a material endowed with anisotropic motions as in the case of elastomers or liquid crystals. In crystalline solids or glassy systems proton–proton dipolar couplings are determined by the average distance among protons and by their relative position since molecular motions with large amplitudes are absent. On the other hand, in liquids and polymer melts isotropic motions average dipolar couplings to zero. In elastomers, cross-links (that represent fixed endpoints for polymer strands) prevent fully isotropic orientation fluctuations. Thus, finite residual dipolar couplings persist for strands in the polymer network [21] and are representative of the degree of motional constraint.
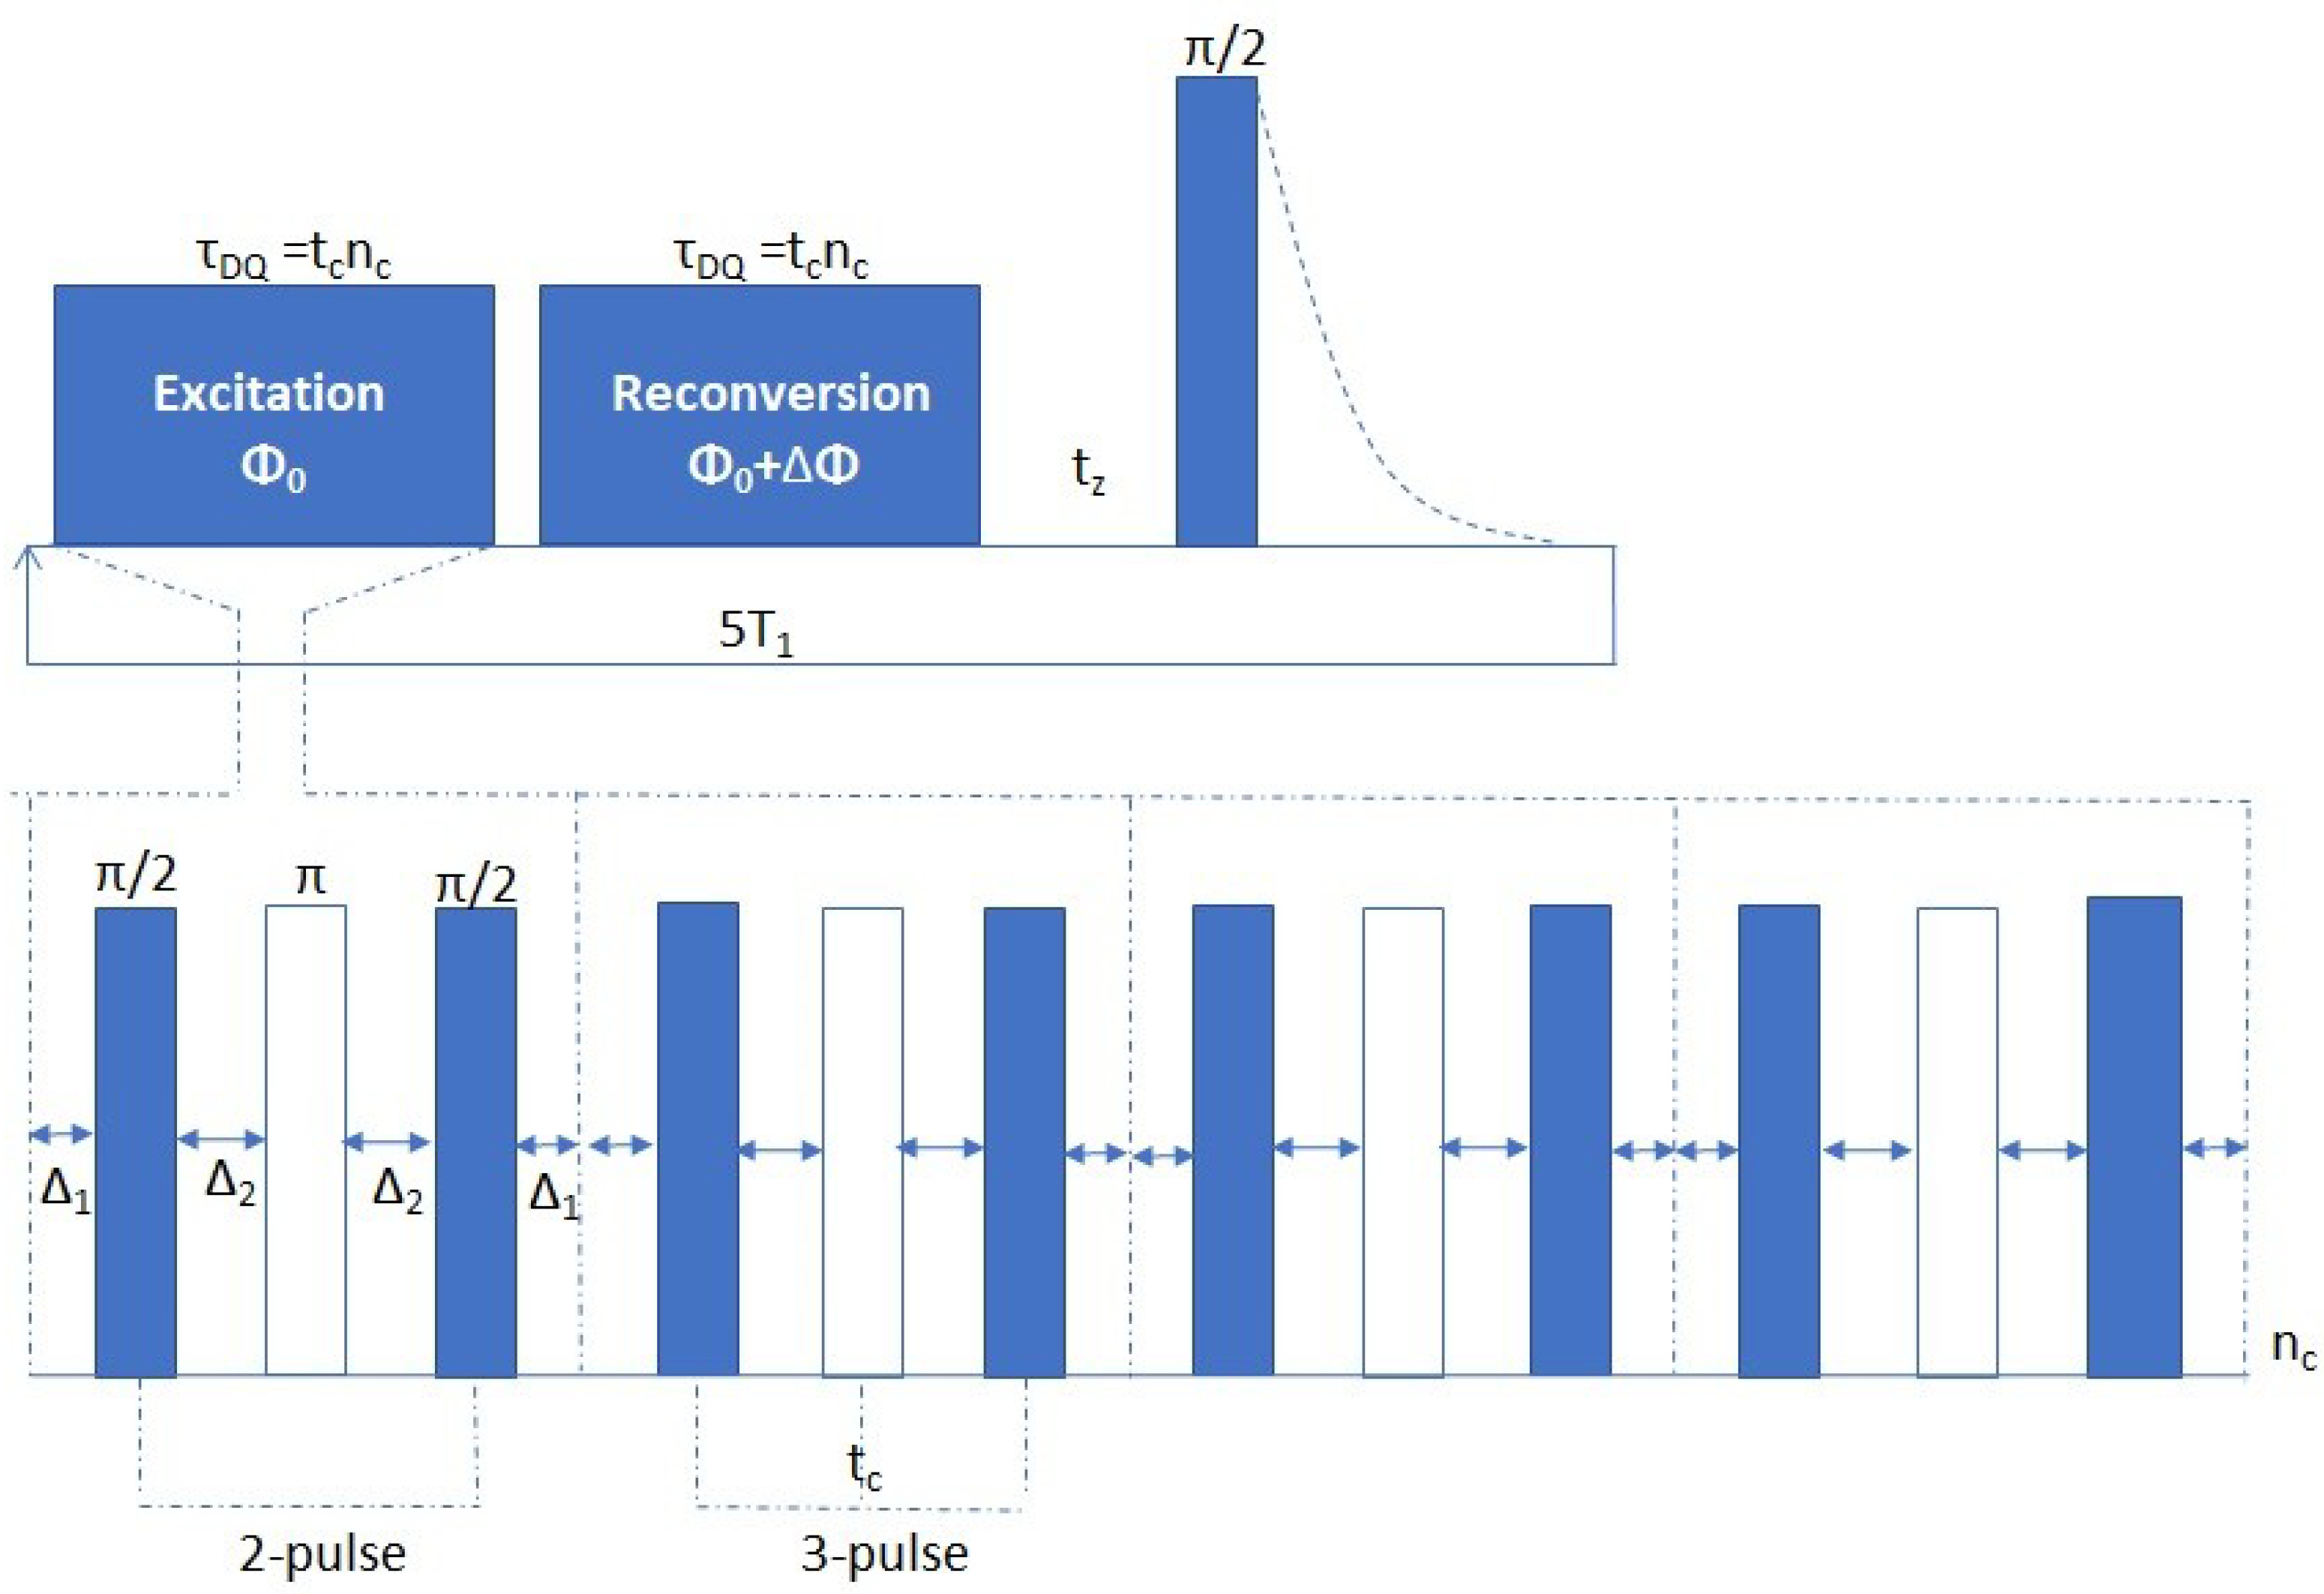
The MQ-NMR sequence most applied at low-field is the Baum–Pines (BP) sequence [22], shown in Figure 4. It is composed of an excitation period, that produces the multiple quantum (dominated by the double-quantum) coherence, followed by a reconversion period, consisting of the same pulse sequence as the excitation period, but with different phase, that converts the multiple quantum coherences into observable one-quantum coherences. Finally, the converted coherence is detected as FID through a single π/2 pulse [7].
One interesting feature of current implementations of the BP sequence is that, by simply changing the receiver phase during acquisition, one can selectively detect either the reconverted DQ coherence (IDQ) or a reference signal containing the magnetization that had not been evolved into DQ coherence (Iref). Thus, one can separate the build-up of the double-quantum (DQ) function (IDQ) from the relaxation phenomena that affect differently the various populations of 1H nuclei (Iref). Normalization of the DQ curve respect to the total magnetization, calculated as the sum of IDQ and Iref, yields pure structural information about the material with the appropriate fitting of the InDQ curve [23].
The excitation and reconversion blocks of the BP sequence are composed of eight π/2 pulses, and by four π pulses inserted in between to avoid the formation of artifacts. Considering the phase switching time, on most instruments, the minimum excitation time is then set at 0.1 ms. This timescale is not adequate to characterize strongly dipolar coupled systems, because the MQ coherences in such systems are generated at much shorter times. Some alternative sequences have been proposed: two-pulse, three-pulse [23,24] and five-pulse [25] sequences (Figure 4). They allow to access shorter times, that corresponds to strong dipolar couplings, but are less efficient in the long-time limit, because complete time reversal is not possible.
2.5. Spins’ Manipulation
Building on the concepts presented above, experiments can be tailored or combined to manipulate specific spins interactions.
A typical issue of TD-NMR is detecting the magnetization of rigid components, which is lost during the instrument dead-time, since it decays at most in 20 µs (Figure 5) and cannot be refocused by Hahn echo or CPMG. The traditional approach to overcome the dead-time was the introduction of a solid echo (SE), constituted by two π/2 pulses, separated by a time τ, but it proved to be not quantitative in dense dipolar-coupled systems [26]. MSE (mixed magic sandwich echo) is a more advanced refocusing sequence that can be applied before FID detection. The double cycle of π/2 pulses attains “time reversion”, recovering the lost signal as an echo. The so-obtained FID can be fitted with a multicomponent function that in its simplest version is made of a Gaussian, for the rigid part, and a Weibullian for the mobile component. The weight of each component is then translated into a rigid proton fraction and a mobile proton fraction. The value of the Weibullian exponent is generally associated with the degree of phase separation.
Furthermore, the MSE sequence can be used as a building block and combined with other sequences. For example, an MSE block inserted at the end of a saturation recovery sequence allows phase-resolved measurement of T1 relaxation time.
Pulse sequence blocks can also be used as filters, being able to select the magnetization pertaining to only one materials’ fraction and filtering out the other.
One filter that can be used to select magnetization only for dipolar-coupled fractions is the DQ filter (Figure 6a). It consists of a BP, two-pulse or three-pulse sequence, with the excitation time fixed at a value that maximizes signal intensity, and it is preceded by a so-called z-filter, that is an inversion of the magnetization in the z-axis, to compensate for T1 relaxation artifacts. It can be applied even prior to applying the same BP sequence, to preventively remove the contribution of liquidlike components and improving the InDQ [27], but a shorter version is largely applied for spin diffusion experiments [28,29,30].
In order to select the magnetization arising from mobile fractions, an early approach was the Goldman–Shen (GS) sequence [31]. It is constituted by three π/2 pulses: the first two are separated by a time τ0, after which the magnetization from hard segments has decayed to zero due to short effective transverse relaxation time T2*. The second pulse rotates the remaining magnetization onto the z-axis. Then, during a diffusion time τ, the magnetization diffuses from the soft to the hard component, allowing the magnetization arising from the hard fraction to increase; the third pulse tips the magnetization in the transverse plane, where it can be detected [32] for the spin diffusion measurements described below. A more sophisticated approach, that concerns the refocusing of the rigid fraction without relying on the T2*, led to the development of the MAPE (magic and polarization echo) filter (Figure 6b). It consists of an MSE filter applied directly on the longitudinal magnetization. Increasing the spacing between the pulses, the filter length increases, and the contribution of strong dipolar couplings can be completely suppressed [16].
A different approach was proposed to bring out only signals of the mobile component with the use of a dipolar filter, based on the GS, followed by an MSE, to refocus the magnetization lost during the filter time [33].
2.6. Spin-diffusion
Spin diffusion is a process exploited to assess sample homogeneity and investigate the domain sizes [16,28]. It occurs because of actual magnetization transfer under dipolar interactions, proceeding thanks to a spin-diffusion mechanism, that is due to the exchange of magnetization state between neighboring spins through a flip-flop process [34]. The magnetization diffuses following the Fick’s law, and the establishment of the equilibrium state depends on the material, on the density of the source and sink, respectively, and on the domain sizes [35].
Its detection is based upon mobility filtering. A phase with specific mobility is selected, employing either a DQ filter (Figure 6a) or a MAPE filter (Figure 6b), and the magnetization is allowed to transfer from the selected phase to the other, therefore the signal arising from that phase becomes detectable [36]. The sequence is composed of periods in which the phase generating the magnetization is selected (called filter period), a spin diffusion period with a variable diffusion time in which the magnetization flows to the other phases present in the material, and a phase-resolved detection, that can be preceded by an MSE sequence, to completely recover the rigid-phase signal lost during the dead time.
From the fitting of all data, the domain sizes can be estimated, down to tens of nanometers [16].
2.7. Steady-state Free Precession (CP-CWFP Sequence)
Steady state is achieved when a balance between the number of excited and relaxing spins is created, thanks to the application of a continuous series of radio frequency perturbations. It is based upon the ideas that in the rotating frame the magnetization reaches a static value because of the continuous applications of the small B1 field [7]. The sequence to obtain the steady-state condition is achieved with a train of π/2 pulses separated by time intervals Tp shorter than T2* (Figure 7). The signal is characterized by a characteristic decay time T*=2T1T2/(T1+T2) and the constant signal amplitude of the steady state Ms/M0 = T2/(T1+T2). The system of two equations allows determining T1 and T2 simultaneously in a single experiment, with strong overlap between the results and the values obtained from traditional measurements [37,38]. It has interesting outcomes for example to probe changes during fast reactions.
2.8. Data Processing
Other than the application of fitting functions, such as the ones described in Section 2.1, on the magnetization evolution graphs, there are more sophisticated procedures for data handling. The information is extracted relying on algorithms.
One of the most widely applied is the inverse Laplace transform (ILT). It is based on the description of the NMR decay signal as an integral superposition of exponentials, weighed by their probability density [39]. The integral equation that has to be solved is known as a Fredholm integral equation of the first kind. Applying a numerical inversion procedure, like the Fourier Transform, the probability density functions are obtained. They are generally represented as peak distribution functions of different T2 [40]. The number of peaks and their distributions are linked to the degree of heterogeneity of the material under analysis [41].
Generally, to stabilize the outcome of the integral solution and avoid the noise contribution, regularization methods are implemented. The most common in NMR is the Tikhonov regularization [42], especially concerning the extraction of Dres from the curves of MQ experiments [23]. It consists in finding the optimum parameter that minimizes the fitting error, applying a minimization procedure on the fitting function chosen as the Kernel function.
3. Applications
One or more sequences can be picked up from this bouquet of measurements and applied to a large variety of materials, processes or applications. In fact, it is possible to assess polymer physics principles with a simple method, conduct routine quality control on polymer-based products, differentiate among different products. Industrial R&D scientists can correlate some microscopic properties with macroscopic performances, in order to tailor the material to a specific application. This ubiquity and adaptability, depending on the purpose and on the operators, represent the real strength of this novel technique.
3.1. Discovery and Characterization of New Materials
In the last decades, materials science had been gaining more and more relevance to the development of materials with new or improved properties [43]. Most materials require a thorough characterization to understand how they behave in defined conditions. Especially polymers, as we said in the introduction, can be quite easily modified in order to access new characteristics, for example, the ability to self-heal after damage or to be biocompatible or to self-assemble in nanostructures or porous materials.
Thermoplastics, elastomers, and composites can all be so modified. Some relevant examples, addressing, in particular, the solution to technical and environmental issues, will be reported.
A great effort has been deployed in recent years for the synthesis of rubbery materials endowed with self-healing properties because rubbers are often employed in challenging environments, where long-term performances are hoped for. The ability to autonomously recover from damage is therefore very attractive, even from an economic point-of-view, since those materials could potentially be low-maintenance and with longer lifetime. NMR can help to give an insight into the self-healing mechanism and retention of properties after recovering.
The mechanism, that is responsible for effective self-healing in a popular self-healing rubber, that associates through reversible hydrogen bonding, was examined. The rubber is composed of fatty acids, amines, such as 1-2-aminoethylimidazolidone (UDETA) and diethylenetriamine (DETA), and urea. It is claimed that segregation of polar and apolar moieties occurs. MSE measurements indicate that two phases exist, with a different composition (established through high-field NMR) and different dynamic behavior. MQ was used to further characterize the heterogeneous structure and proved the existence of anisotropic mobility, that is proof of a rubber network. The three-pulse version of BP was used because the temperature for an appropriate determination of Dres would have been too high and would have accelerated the aging, therefore the measures were carried out at a lower temperature, where a large Dres is attained. Two components with different Dres are apparent, suggesting two subcomponents in the dipolar coupled fraction. Therefore, a very complex and heterogeneous structure was speculated. MQ was also employed to assess the aging process of the rubber at high temperature, showing an increase of the Dres with a higher temperature at short aging time, which leads to the formation of irreversible crosslinks, with a detrimental effect on the self-healing properties [44]. A similar rubber made of polyurethane, urea, and UDETA was characterized in respect to its self-healing ability as a function of moisture. MSE and HE experiments, fitted simultaneously, were used to assess the variation of NMR Tg as function of the relative humidity at which the sample was conditioned. The authors used the increase in the lower relaxation time T2 and its exponent in the three components fitting as the main parameters to confirm the increased mobilization of chains with increased humidity and increased amount of UDETA. Matching the variation of a mobile fraction with observations from other optical techniques, they could define a threshold of at least 59% of mobile-like dynamics to achieve self-healing [45].
Another attractive feature for rubbers is the possibility to be easily recycled. In fact, although crosslinking is mandatory to obtain the long-range elasticity that renders rubbers so useful, its irreversibility prevents recycling, with great environmental problems. The creation of reversible crosslinking could help to overcome this issue.
One approach to address the problem is to exploit ionic interactions between the polymer chains and highly polar crosslinkers, introducing ionic moieties in common polymers. In reference [46], a carboxylated nitrile rubber (XNBR) was crosslinked with variable amounts of MgO, since carboxyl groups form ionic aggregates with magnesium oxide. The combined use of MQ, in its five-pulse version, and MSE-FID provides evidence of the structure of the elastomer, underlining the existence of two domains of coupled chains: a heavily trapped fraction in the proximity of the ionic aggregates and a more mobile component of chains between the crosslinks. The increasing addition of MgO increases the conversion of carboxylic groups into carboxylates, consequently enhancing both the crosslink density and the trapped rubber fraction (Figure 8a), which reaches a plateau above the stoichiometric ratio, where all the carboxylic groups are converted. However, crosslinks density further increases because of an additional number of ionic interactions of ionic moieties with the excess of MgO, that derives from a reduction in the aggregation number of ionic clusters. At higher temperatures, the trapped fraction and the crosslinks density decrease, demonstrating the reversibility of the bonding strategy.
Alternatively, thermo-reversible covalent linkages can be created though Diels–Alder reactions. Ethylene/propylene rubber (EPM) and ethyl/vinyl acetate rubber (EVM) were chemically modified with the introduction in the backbone of furfurylamine (FFA) and furan that can undergo a Diels–Alder coupling with maleimide. MQ NMR with a low field instrument allowed to determine the Dres distributions for the two polymer classes, which translates into a distribution of crosslinks in the network. There was evidence in the EPM for the formation of a bimodal distribution, attributed to polar clusters, while the EVM presents a monomodal, though large, distribution, because of the absence of phase separation based on polarity (Figure 8b). The difference was confirmed by SAXS. The different mechanical properties between the two materials were interpreted on the basis of the homogeneity (or lack thereof) of the network [47].
Another strategy to allow recyclability and, at the same time, allowing for use in a biomedical application is the use of biocompatible prepolymer.
Some biocompatible polyurethanes made of biocompatible diols, such as polyethylene glycol (PEG), hexamethylene diisocyanate (HDI), and calcium glycerol phosphate (GPCa), were characterized in respect to the variation of their dynamic properties with the introduction of new components into the formulation. ILT was employed to obtain the T2 and T1 distributions. It gave evidence of the crosslinking in the material and of the softening effect with the addition of mobile diols as PEG and the hardening effect provided by the GPCa salt [48].
Particular interest has been directed towards the realization of objects with nanometer size which show unique physical properties and can be applied in many fields, from medicine to energy production [49,50]. Their size makes their characterization complicate and requires novel approaches. For example, complete phase separation or the existence of an interphase between distinct components could be assessed, as done for core-shell PBA-PS nanoparticles with baroplastic properties. Low-field NMR is, in fact, able to prove phase separation through MSE. Monitoring the reduction of rigid fraction from below the PBA Tg towards higher temperatures, two softening regions were detected, as shown in Figure 9: the first one corresponding to the complete mobilization of PBA protons above Tg, a second one at higher temperature than PS Tg, where the system starts to reptate and no rigid fraction remains. In between these two transitions only PS protons contribute to rigid fraction [51].
Furthermore, common plastics can acquire a plethora of new perspectives, depending on chemical modification or manufacturing. An example is given by the fabrication of PS-based polyHIPEs (polymerized high internal phase emulsions) [52], which are studied because of their easily tunable properties, especially their high porosity. A good understanding of polyHIPEs structure and its origin is fundamental to obtain good homogeneity of the material and good control over the properties. The effect of the introduction of para-DVB (para-divinylbenzene) was investigated. Musgrave et al. measuring 1H T1 and 1H T1ρ, to explore both local and segmental motions, concluded that a higher content of DVB creates a network with small clusters of chains, allowing greater freedom of rotation of phenyl groups and a greater alignment of chains. Further addition of para-DVB reduces both parameters, an indication of a more mobile but disordered structure. These assumptions correlate well with the strong decreasing of the elastic modulus (Table 2 in reference [52]).
Other porous materials that have attracted interest as study subjects for TD-NMR are hydrogels, which are particularly relevant as biotechnological platforms. Especially PVA (poly vinyl alcohol) underwent a thorough investigation, thanks to its biocompatibility. Some studies were conducted to gain insights into the structure of PVA cryo-gels, analyzing the process of gelation. Increasing the number of freeze-thaw cycles, the Dres increases through the formation of rigid polymer areas, probably crystallites. This process is completely thermo-reversible, according to the simultaneous reduction of rigid fraction and constant Dres with higher temperatures, allowing to formulate a mechanism consisting of the melting of secondary and primary crystals up to a threshold temperature where both rigid fraction and Dres becomes null, that corresponds to transform the gel into an isotropic aqueous solution [53]. Removing the water out of a chemically crosslinked gel, a xerogel is obtained. In reference [54], PVA crosslinked with glutaraldehyde (GA) was characterized taking 1H T1 as structure descriptor. It turned out to be very sensitive both to crosslinking degree and to loading with silica, both of them inducing a reduction in 1H T1 due to the decreased number of hydroxyl moieties available for hydrogen bonding. That also highlighted the existence of an interaction between PVA and silica, that was not detected before with other techniques. 1H T1 also has the possibility to estimate the extent of spin diffusion path length, that means the length of spatial homogeneity, which decreases with both the crosslinking and loading.
Functional composites materials response has also been characterized, especially concerning the realization of optical devices to exploit photophysical processes in photon harvesting. To match the need for solid supports and a high diffusion path length to ease the probability for the active molecules to get in contact with each other, polymers are addressed as the most adequate matrixes. An interesting correlation has been found out between the active molecules decay rates and the T2 of a series of polyacrylates [55]. For the sensitizer molecule, the local rigidity that characterizes the polyacrylates is not sufficient to suppress its decay rate, because of inelastic processes, while an increase of mobility, reflecting on an increase of 1H T2, that happens in acrylates with long side chains, favors the decay rate of the emitter, increasing the overall efficiency of the device.
3.2. Polymer Physics
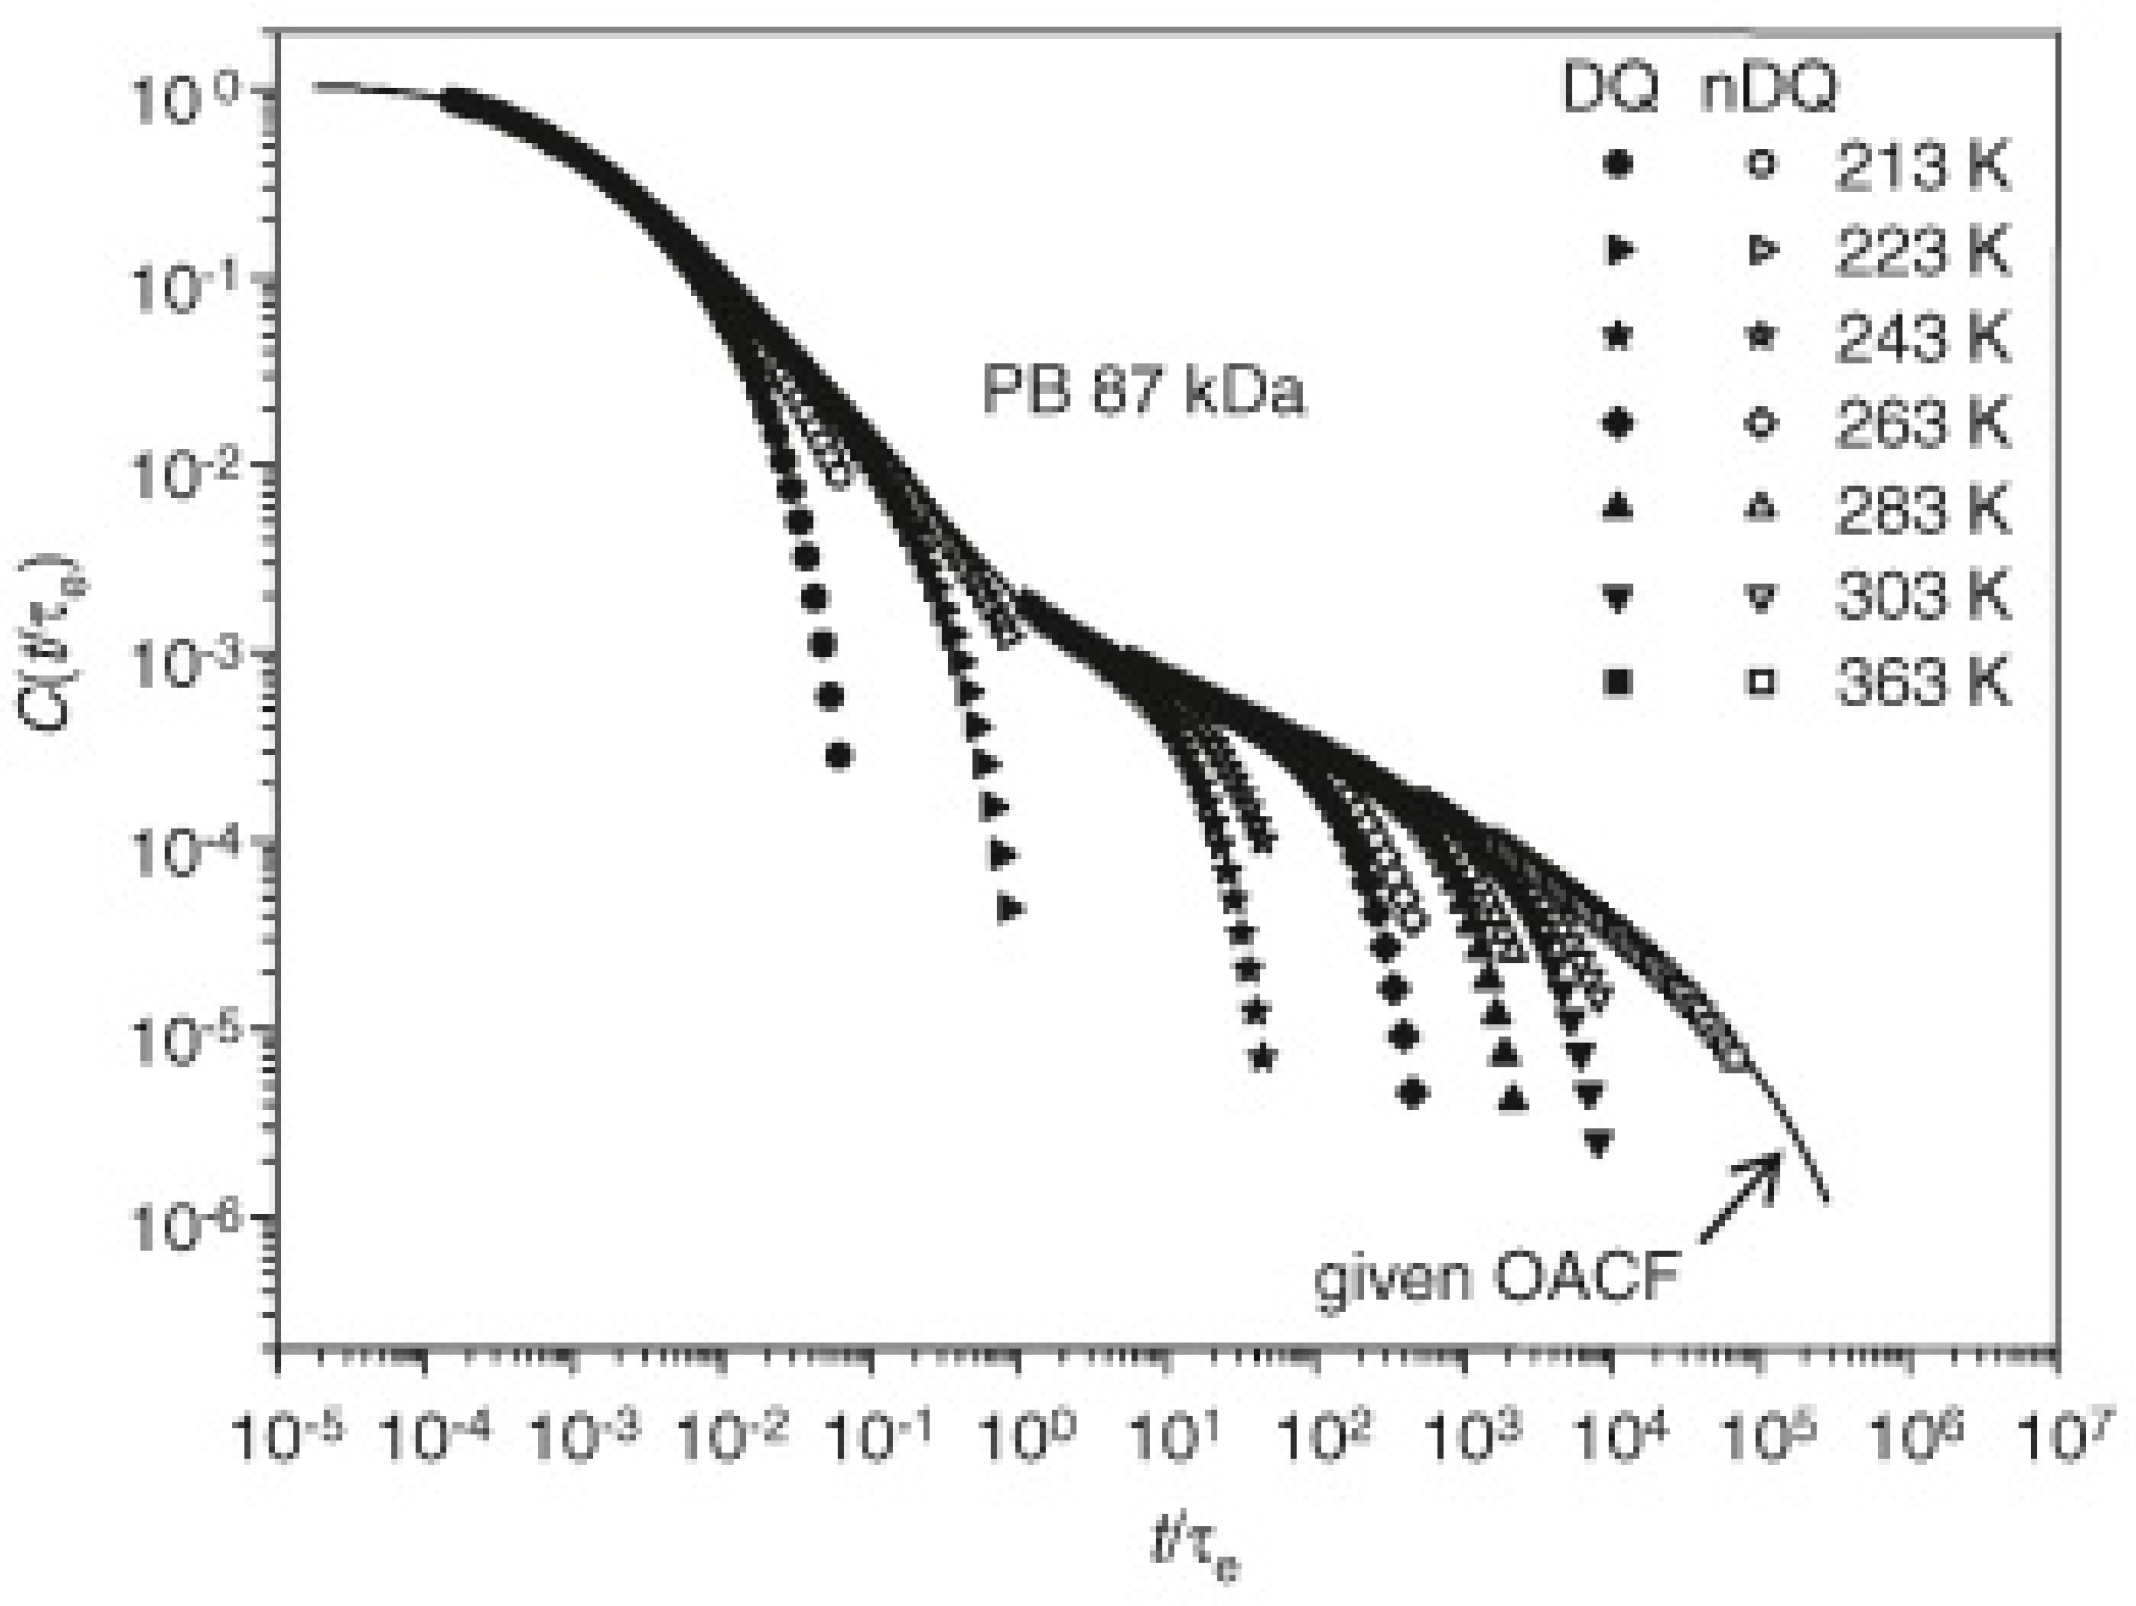
Since relaxation times are directly connected to correlation times, molecular dynamics theories can be properly investigated. Molecular dynamics in well-entangled polymer liquids has to be delved into because it has important outcomes in the prediction of melts viscosity and processing conditions [56]. TD-NMR has been used to test the predictions of the reptation model [57], especially in the Doi–Edwards regimes II-IV [58] (constrained Rouse, reptation and free diffusion of chains), relating to the determination of the orientational autocorrelation function (OACF) C(t), which depends on the second Legendre polynomial P2(cosθ), where θ is the segmental orientation relative to a reference direction, which, in case of NMR experiments, is the external magnetic field direction [59]. C(t) describes the probability of the reptation tube survival, which is higher as the degree of anisotropy of segmental orientation fluctuations is higher, that is the average over time of P2 differs from 0. MQ experiments are basically founded on the non-annulment of the integral upon all the P2(cosθ) of every dipolar coupled spin pair, therefore an in-depth study of signal functions derived from this kind of experiments revealed to be highly effective in the reconstruction of C(t).
MQ signals of polybutadiene (PB), polyisoprene (PI) and polydimethylsiloxane (PDMS) in a broad range of molecular weights had been recorded. Effects of both molecular weight and temperature on the MQ build-up were evaluated, together with the variation of the uncoupled fraction, to confirm the existence of possible additional relaxation processes, such as contour length fluctuations. Direct calculations of C(t) were carried out, applying improved analytical representation [60], under the approximation that C(τDQ) is proportional, according to an initial rise approximation of the InDQ curve, to InDQ(τ)/τ2 on the τDQ time scale, at short times. This is especially valid for describing directly motion regime II (constrained Rouse), whereas to determine longer time results into the III and IV regimes, time-temperature superposition principle (TTS) was applied. InDQ at several temperatures were fitted to estimate the Dres values, used to calculate C(t) and each result was appropriately shifted accordingly to the entanglements correlation time, obtained from the literature. The so-obtained C(t) curve, presented in Figure 10, was then fitted to determine transition regime times and exponential trends. The observations confirmed that flexible homopolymers have very similar motional behavior, following the theoretical prediction of the tube model and its molecular weight dependence. However, higher mobility than predicted in the regime II was found, indicating a less static tube constraint [61]. Regime 0 and I are instead usually investigated with fast-field cycling experiment [62,63,64].
More recently, another approach was proposed to extract the analytical parameter of OACF directly from MQ signal functions. Briefly, MQ signals have been interpolated using an approximated function for C(t), namely constant at very short time and a power law at longer times, in a similar fashion to C(t) of elastomers. This allows the fitting over a larger data range, overcoming the high errors for the initial rise analysis and of TTS and allowing to study transition areas. The authors claim that this approach could help to study even phenomena where different dynamical processes coexist and TTS is not applicable [65].
Lately, a different method for characterizing intermediate to fast regime motion ( >kHz) was proposed by Filgueiras et al. [33] based on a dipolar filter, which suppresses the signal from rigid segments. Whenever some molecular segments become more mobile, the signal is no longer completely suppressed and can be refocused with an MSE block, creating an echo the more intense the higher the mobility. The onset temperatures of dynamic processes occurring in the material are therefore accessible, together with their activation energies, as seen for aPP (atactic polypropylene) and PIB (polyisobutylene). The variation of filter time at different temperatures for both polymers induces a displacement of the MSE echo intensity curves at longer times, because of increasing correlation time, and an increasing maximum intensity, correlated to narrowing distributions of correlation times, proved using a Tikhonov regularization procedure on the curves.
The contribution of entanglements to elasticity in elastomers was also studied. Variation of DQ NMR build-up curves and consequent Dres as function of crosslinker functionality had been employed to test the validity of the most common elasticity models: the affine and phantom model. The found linearity between functionality and Dres is an indication of better accuracy of the phantom model, although it does not account properly for the contribution of defects. The existence of non-zero intercepts was an indication of contribution to anisotropy, i.e., to elasticity, of entanglements. Defects act as diluents, like solvent molecules, with no further contribution to elasticity [66].
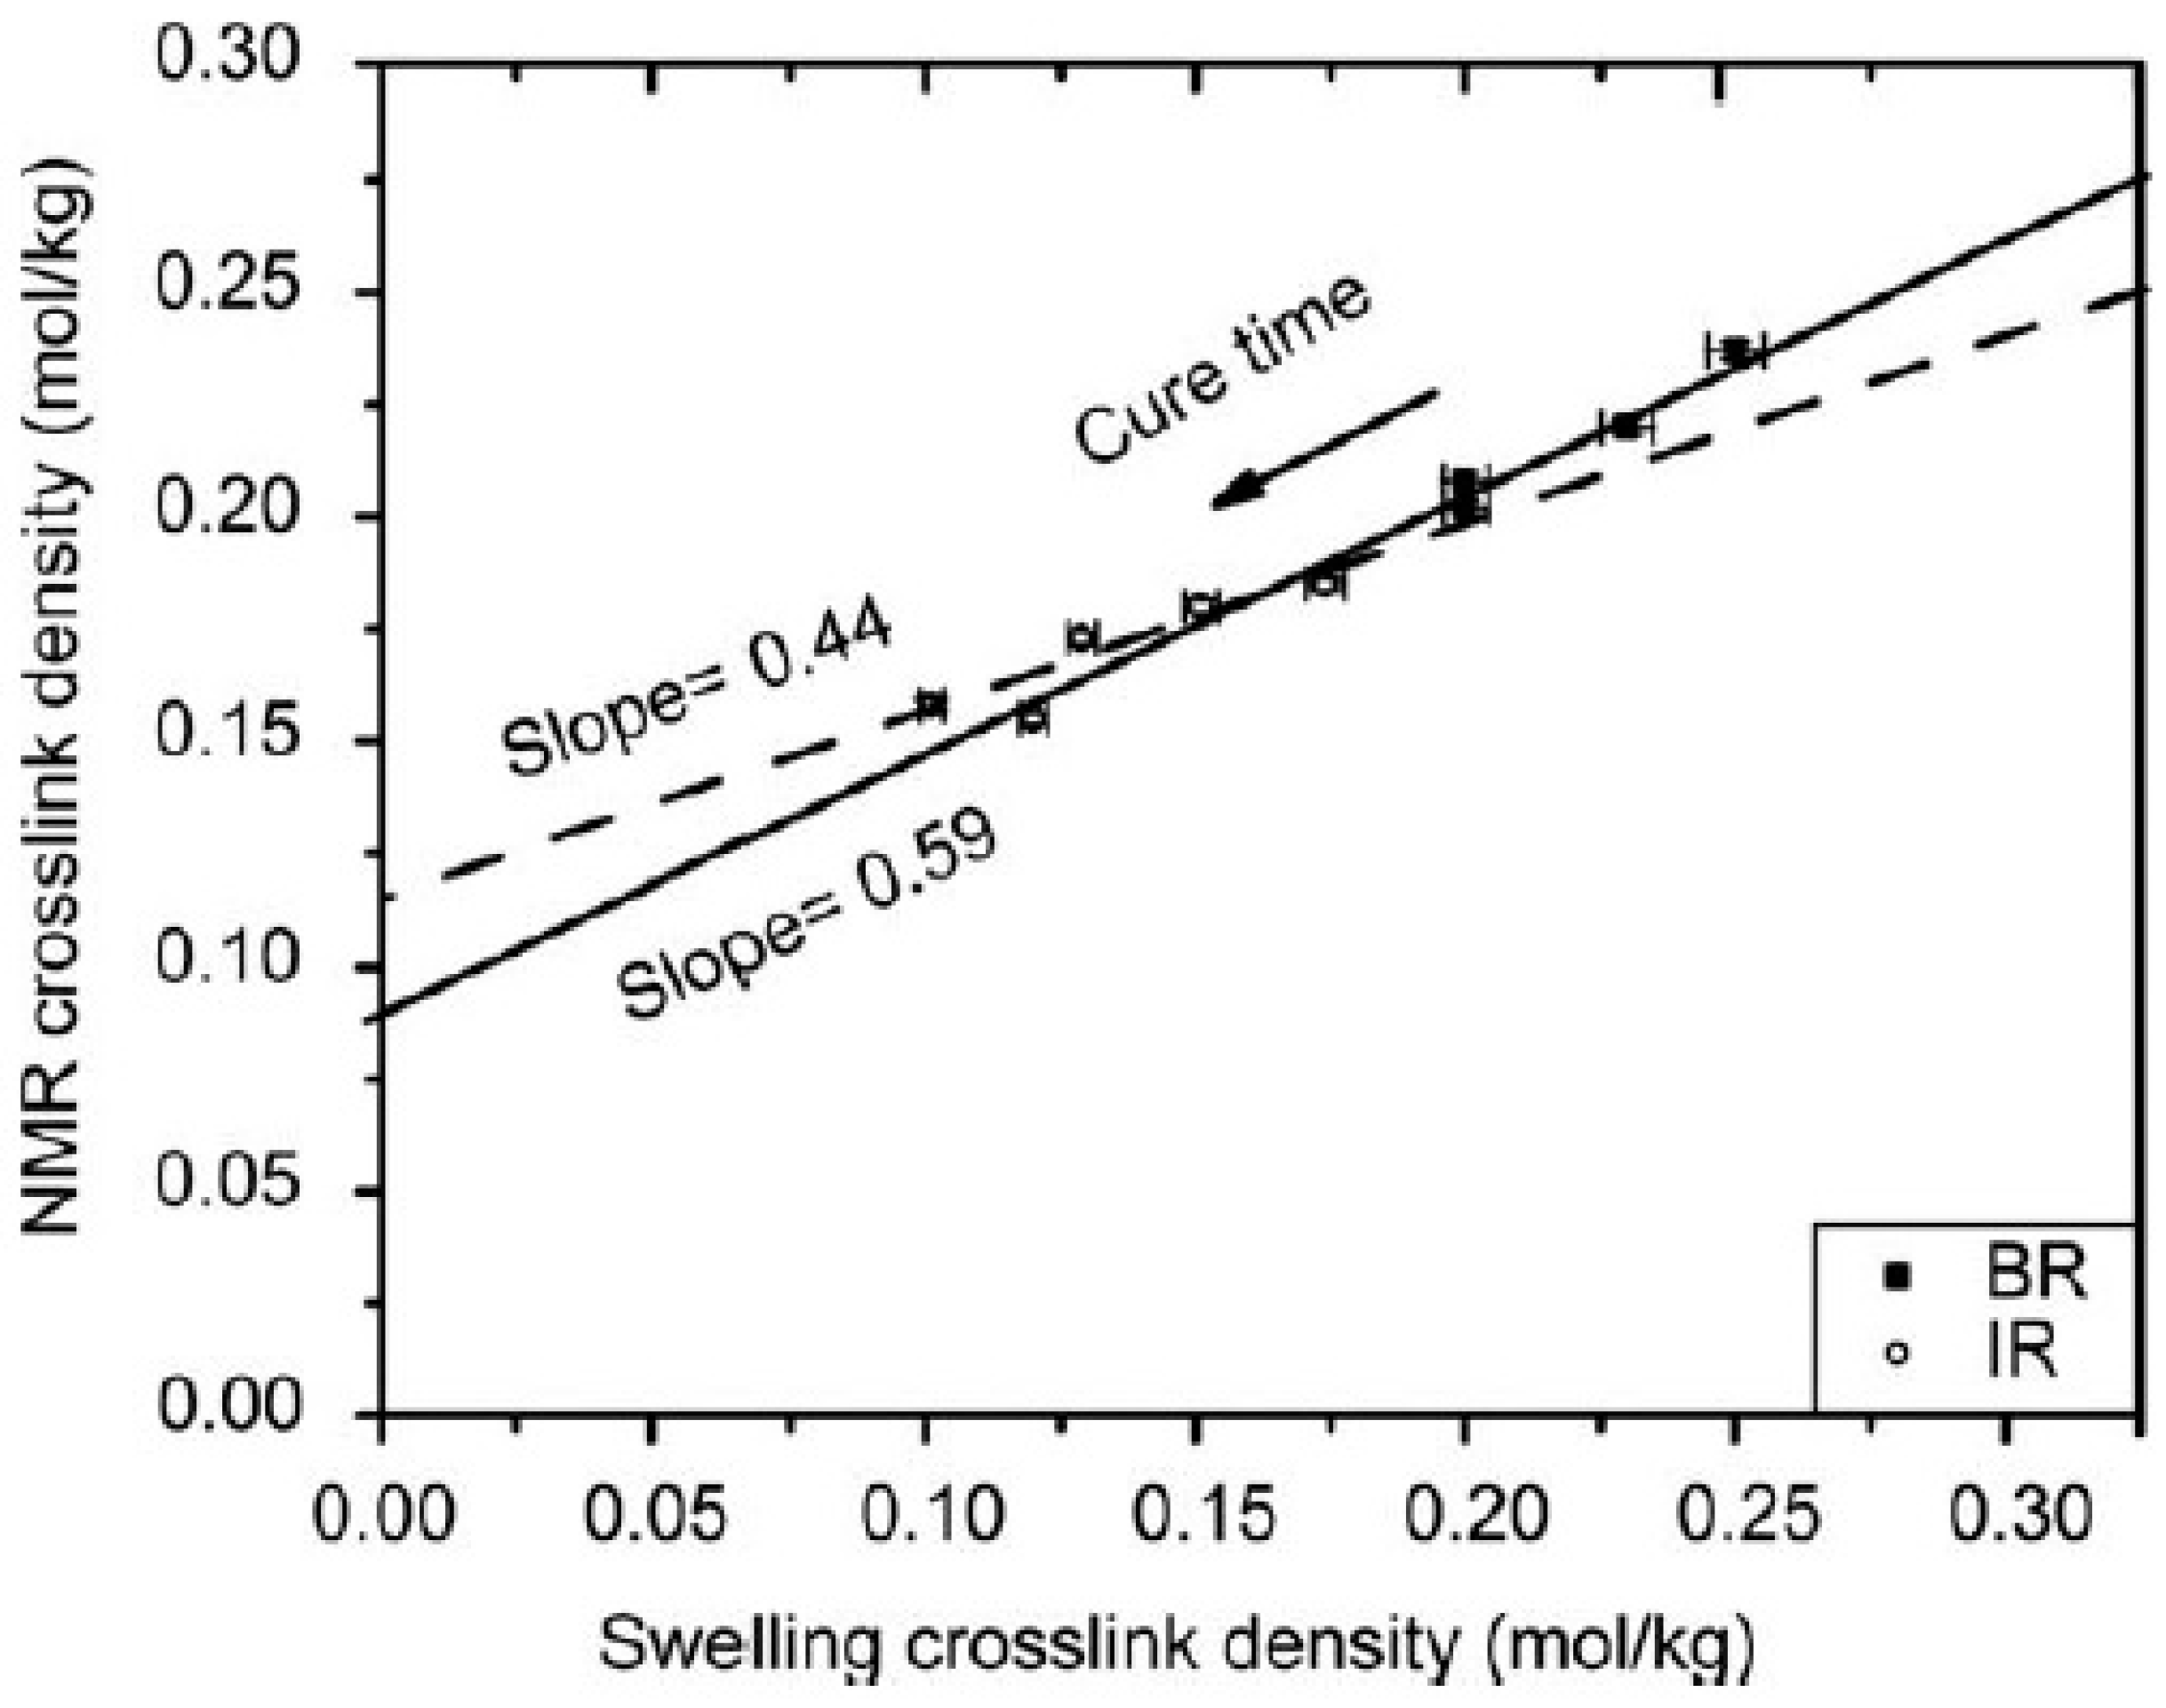
Another study that demonstrates the better accuracy of the phantom model in describing the elastomer network was conducted by Dibbanti et al. [67], employing MQ NMR experiments. Samples of PB, PI and their blends at increasing cure times were analyzed. Linear correlation (Figure 11) between the crosslink density from swelling experiments, obtained with the modified Flory–Rehner equation for filled elastomers, based on the phantom model, and TD-NMR crosslink density, from Dres calculation, was found. The study also highlighted the sensitivity of TD-NMR to the minimal variation of crosslink density with cure time and its different mechanism according to chemically different rubbers, leading contingently to different network structures.
The capability to distinguish different rubbers has always been a challenge because of elastomers’ complex nature, due to the many different variables that can play a role, but MQ opened the possibility to potentially verify the effect of each of them.
Furthermore, spin-spin relaxation time 1H T2 measured through Hahn echo decay, depends on the degree of motional anisotropy, i.e., to the constraints’ density. The relationship is highlighted in the theory of Gotlib [68], that provides a direct proportion between the number of statistical segments between two junctions and the 1H T2 at high temperature in the approximation of gaussian chains (Z=T2p/αT2rl where α is a theoretical coefficient depending on the angle between the segment axis and the internuclear vector with the nearest spin on the chain and T2rl is T2 at temperature far below Tg). A successful example of that is given by the evaluation of network structure in polyacrylate systems PEGDA-HA (polyethylene glycol-700-diacrylate-hexyl acrylate) [69].
However, some drawbacks to this approach can be individuated: the equation above is dependent on the assumption of Gaussian chains and R2 (1/T2) contains a contribution from incoherent loss of transverse magnetization, as proposed in the paper of Magusin et al. [70]. Indeed, they showed the linear, but shifted along the y axis, correlation of R2 and RDQ (rate of DQ build-up), on samples of EPM and EPDM crosslinked rubber (Figure 12). The non-zero intercept is attributed to the additional term of incoherent dephasing.
Moreover, MQ possesses the added value to provide information on the actual structure of the network, through the study of Dres distributions. For example, it was applied to differentiate the effect of sulfur and peroxide vulcanization, with the first giving a more homogeneous network [70]. That was observed also in the study of the evolution of network structure during the processing of natural rubber latex particles [71], that cannot be probed with other methods, such as rheology or swelling. Dres and the associated distributions were used to define the crosslinking degree during three steps of the processing: pre-vulcanization in the latex state, film formation and post-vulcanization, whose variations are graphically represented in Figure 13a,b, respectively. MQ single-point measurements were chosen to obtain the pre-vulcanization kinetics in the latex state. The study pointed out that sulfur creates a homogeneous network, whereas peroxide promotes the formation of a core-shell structure, which develops into an inhomogeneous network once the film is formed [72]. That was believed to come from the different diffusion rate vs. reaction rate of the two vulcanizing agents. In the end, the difference reflects onto the strain-induced crystallization behavior of natural rubber, affecting, in turn, the stress-strain properties. The more homogeneous network created by sulfur is, in fact, able to enhance homogeneously the molecular orientation induced by crosslinks, while the clustering induced by peroxides reduces the degree of orientation [73].
The DQ-build up is represented by a variety of functions, commonly Gaussians or Abragam-like, which are used to fit the data and obtain information about the residual dipolar coupling values. For a deeper analysis, these functions are also implemented as kernel functions in the Tikhonov regularization procedure. Using a kernel function with angular dependence, the MQ analysis can also monitor the effect of uniaxial stretching in rubbers [74]. The results on natural rubber samples showed the inadequacy of established models for elasticity after deformation.
However, Baum–Pines sequence is not applicable in highly crosslinked systems, such as resins, because it is too lengthy to record the signal from highly coupled portions. Some modified versions, with five, three or two pulses, have been proposed. Although the determination of Dres was successful on a common resin, such as diglycydil ether of bisphenol A (DGBA) with diethylene triamine as curing agent [75], it is necessary to combine results from separate experiments with two-pulse and three-pulse to describe reliably the build-up curve.
Another approach has been proposed, that is the use of 1H T1 according to the BPP theory (Equation (1)). The BPP equation was modified incorporating a distribution of correlation times related to the degree of couplings. 1H T1 measurements with INVREC sequence at different temperatures were conducted on fully cured resins of DGBA with hardners of different molecular weights. The curves around the minimum were fitted with the modified version of BPP equation and structural parameters, as activation energy and distribution width parameter, were determined, showing a correlation with the crosslinking degree in the material [76].
Another interesting topic is the understanding of the reinforcement effect due to filler-rubber interactions [77]. MSE measurements showed that a gradient of polymer mobility exists around the filler particles, that can be separated in at least three components: a glassy, an intermediate and the network fraction. The fraction of immobilized component increases with increasing filler specific surface, but it is reduced with a similar trend with increasing temperature or solvent content. MQ was used to determine the existence of a highly crosslinked portion in case of covalent filler grafters with an optimal dispersion [78]. Furthermore, the effect of filler morphology was investigated with a similar method. Rod-like silica nanoparticles immobilize a higher amount of rubber respect to spherical ones due to the formation of domains of aligned rods where the glassy layers pertinent to different particles overlap (Figure 14). These observations correlated with higher reinforcing capabilities [79]. Processing conditions for in-situ generated silica have implications also for the amount of bound rubber. HE and SE were combined to reconstruct the FID, which was fitted using the three components described above. Both the expected silica yield and the sol-gel reaction time determines the amount of bound rubber, probably due to different dispersion level obtained inside the rubber matrix [80].
To highlight the direct interaction of the polymer matrix with the filler, combined analysis of 1H MQ NMR and equilibrium swelling data have been adopted. The deviation of the crosslink density of rubbers in filled compounds from the masterline (1/Mc,NMR vs. 1/Mc,swelling) has been attributed to the effect of interaction with the filler. The stronger is the interaction, the more restricted is the degree of swelling, because of the topological restrictions imposed at the filler interface, while there is no significant change in the crosslink density measured through low-field NMR and consequently the deviation from the masterline is higher. It has been shown in reference [81] that the interaction becomes stronger with the introduction of organo-modified particles or nanosized fillers, such as graphene sheets, that also provide improved mechanical properties.
Combined analysis of MSE data for rigid fractions determination, T2 and DQ build-up curves can help in understanding morphology changes in thermoplastic elastomers. SEBS (styrene-b-ethylene-co-butylene-b-styrene) was investigated regarding the origin of a broad endothermic transition during heating at low butylene content (LB1 sample). MSE-FID measurements for rigid fraction confirmed that this transition is not a crystallization. T2 variation with temperature highlighted the complexity of the underlying morphology since it cannot be described neither as fully separated domains or as a single domain, as it can be seen in the trend for LB1 in Figure 15a. Figure 15b evidence also that LB1 possesses a higher order parameter than SEBS with high butylene content (HB1) for the mobile fraction and the existence of at least two zones with different dynamic order parameters, as obtained from MQ build-up analysis. The results were explained in terms of the presence of a so-called rotator mesophase [82].
Another kind of phase transition that can be studied is the crystallization process. PCL (polycaprolactone), i-PP (isotactic polypropylene) and PEcO (poly(ethylene-co-octene)) are typical semi-crystalline polymers, whose crystallization kinetics had been measured [83]. MSE followed by CPMG was employed to evaluate the rigid fraction over time at crystallization temperature. Subtracting the melt-like component, the crystalline and rigid-amorphous fractions were estimated, with results that agree well with X-ray and dilatometry.
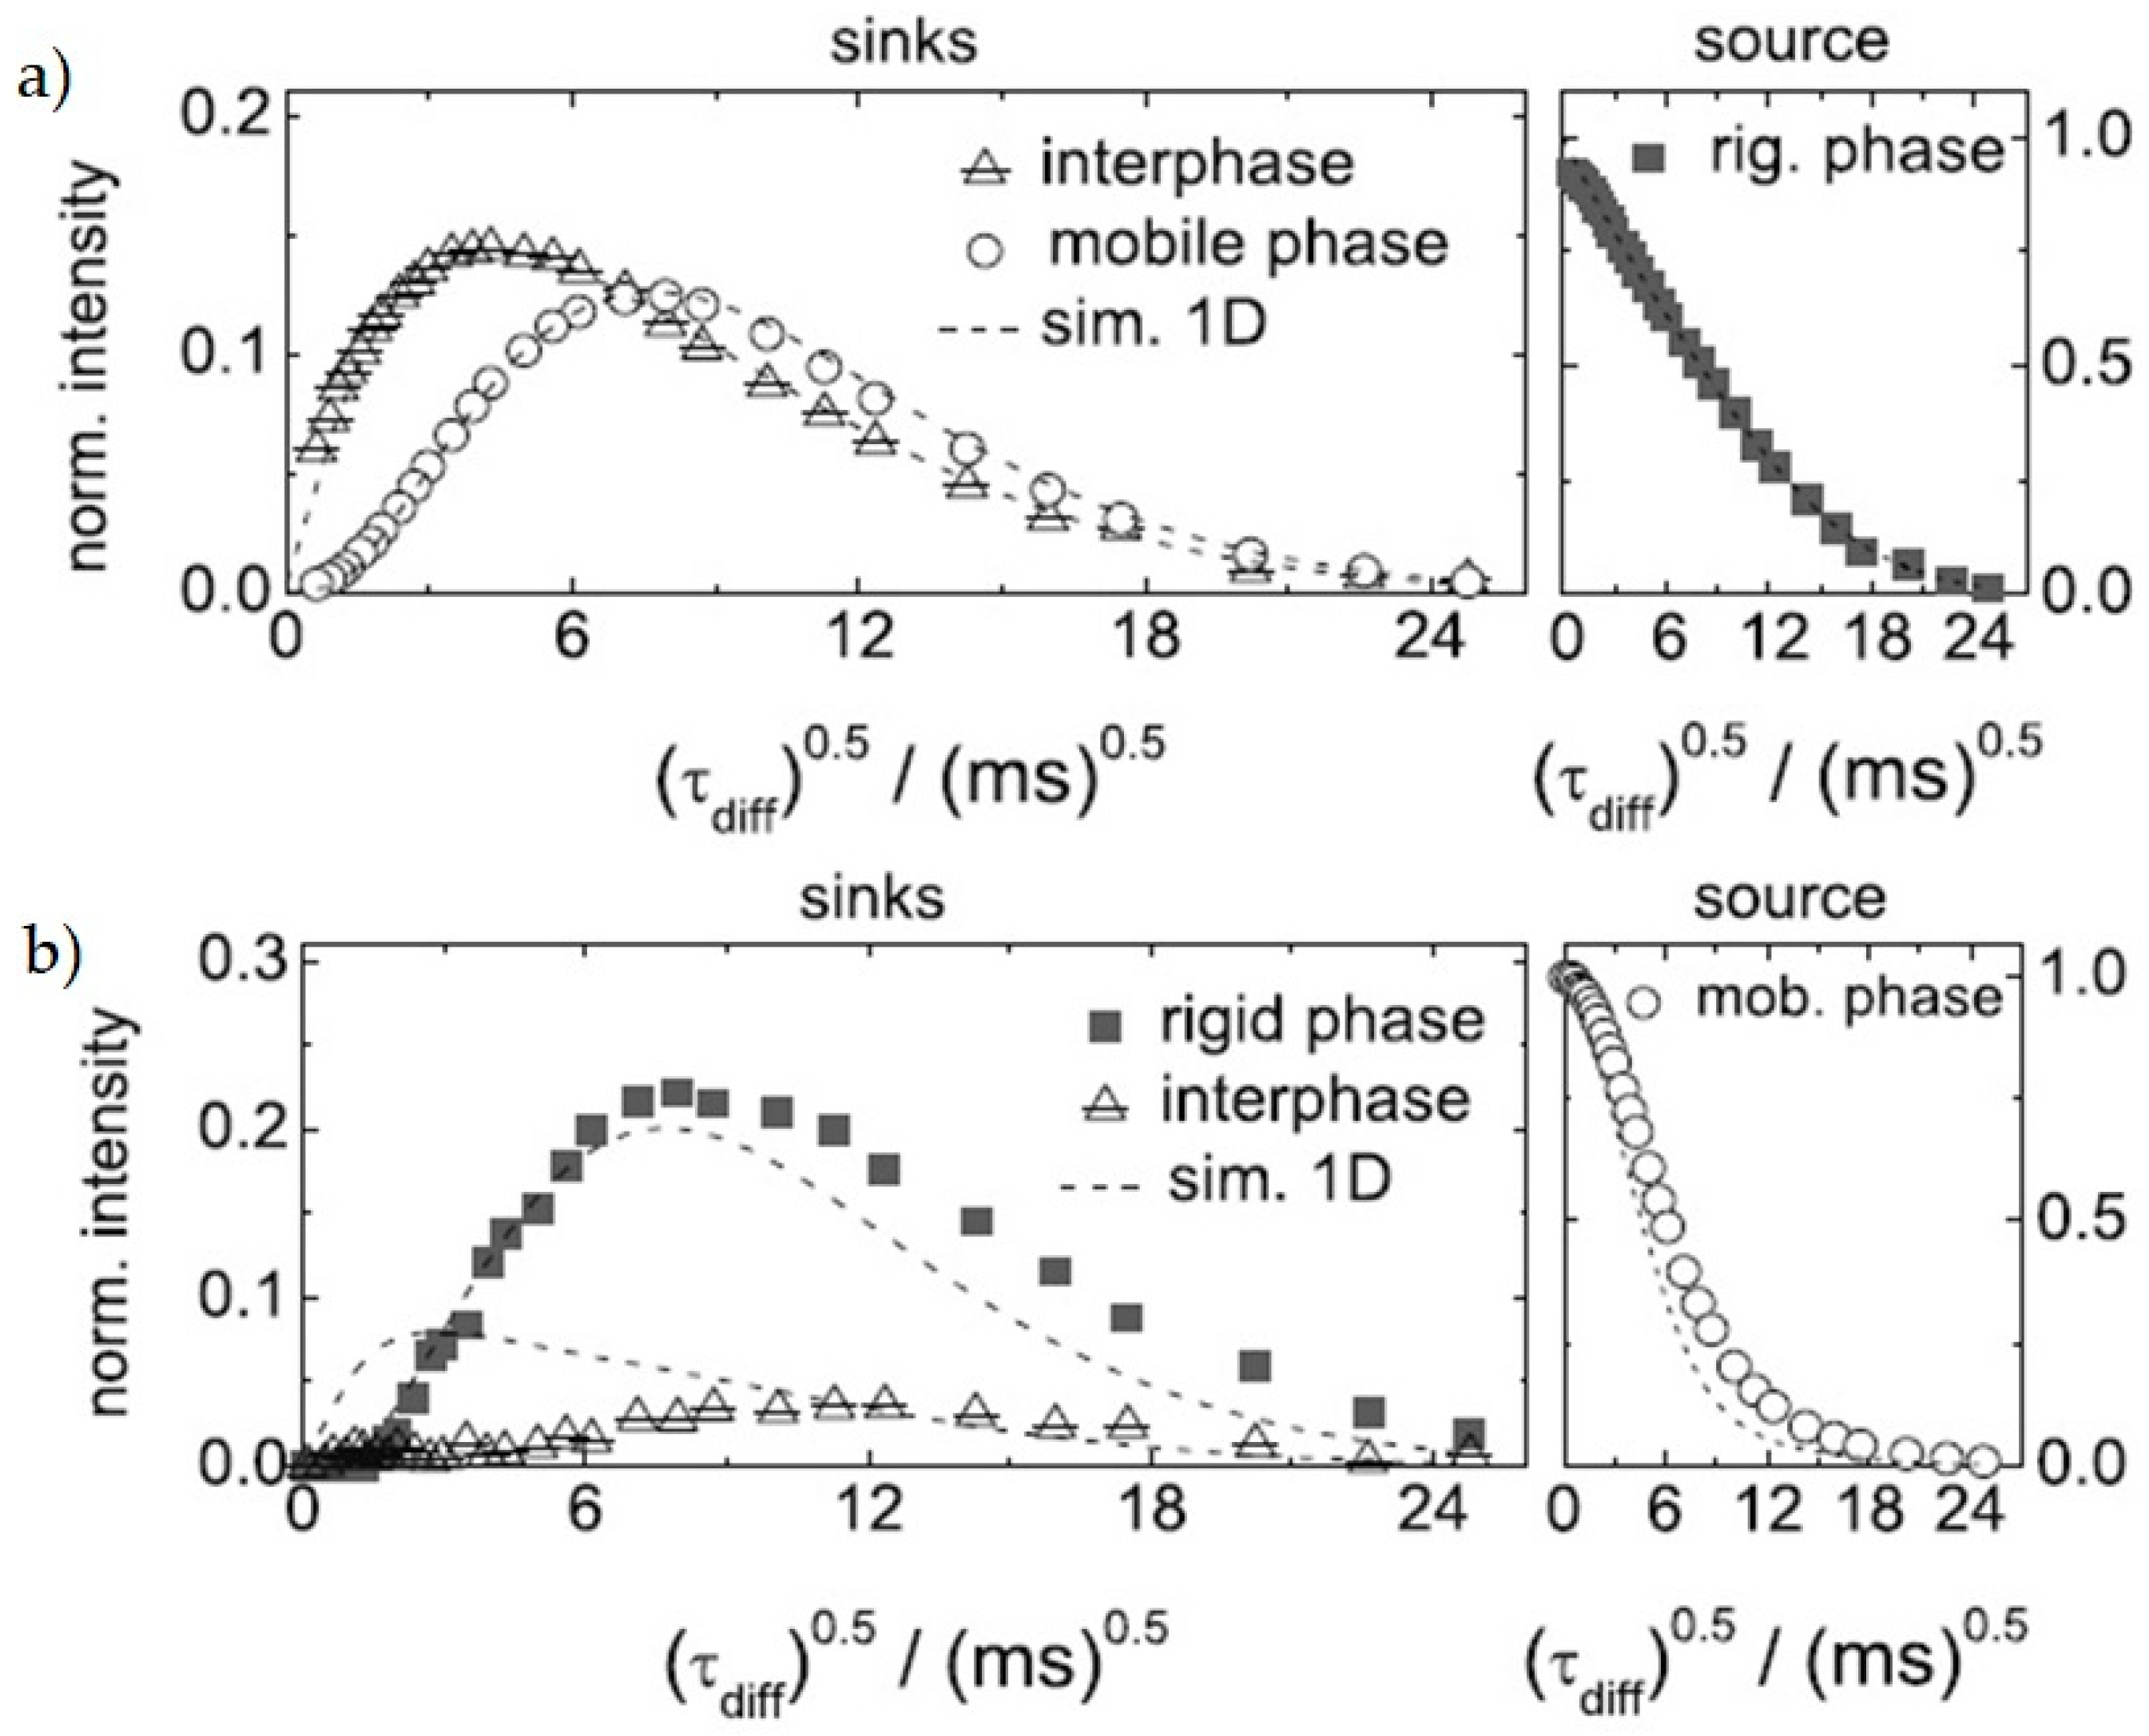
Multi-phase materials, as semi-crystalline polymers or block copolymers, possess interfaces in-between the phases which are tricky to characterize, because of their complexity, that renders them a new phase with intermediate characteristics, called “interphase”. Roos et al. [84] showed that interphase morphology possesses non-trivial arrangements between the domains. Spin-diffusion measurements were applied both to a semi-crystalline material, as PCL, and a block copolymer, as lamellar PS-PB. An asymmetry between the phase-resolved DQ (rigid phase filtered) and MAPE (mobile phase filtered) is detected (Figure 16), that is the interphase is magnetized later when MAPE is applied. That was explained assuming a direct contact between rigid and mobile phase, with the interphase not forming a contiguous in-between layer, but an island-like distribution immersed completely inside the rigid phase. Further simulations favored this vision for semi-crystalline polymers, while block copolymers were better represented by a mixed-interphase model, where dynamic inhomogeneities are present on the nanometer scale [85].
3.3. Bioplastics
Synthetic polymers are generally oil-based derivatives, so they are becoming a great environmental pollution issue. Extraction and refining of oil are very polluting processes, and plastics is not biodegradable, impacting on soil and marine life [86]. Therefore, much research is directed towards biodegradable materials, deriving from renewable resources, such as polysaccharides [87], proteins [88] and lipids [89]. These new materials need to be properly characterized, to verify their applicability as substitutes of common plastics.
One of the most studied raw materials with this purpose is starch [90,91,92], inexpensive and widely available, but with severe limitations in solubility and poor water resistance. Several strategies had been considered to improve its properties, and their consequent changes had been evaluated with the use of various techniques, among which TD-NMR.
For example, a clay, such as montmorillonite, was incorporated into starch-based films. MSE and CPMG gave insights into the morphology change upon disruption, plasticization and incorporation of clay as a filler. The formation of agglomerates at high loading proved to have detrimental effects on the composite properties. These effects were also probed through INVREC, that allowed to define two domains and, above all, to establish the dispersion degree of the filler. In fact, according to equation 1/T1,para = 1/T1,nancomp − 1/T1,polymer (where T1,nancomp is the nanocomposite relaxation time and T1,polymer is the relaxation time of the neat polymer) the contribution of the paramagnetic impurities, due to the clay, can be determined and T1,para is then directly proportional to the interlayer distance of the exfoliated or intercalated nanocomposite. Indeed, paramagnetic ions, such as manganese or iron, can be present as metallic substitutes inside the layers of the clays and their additional magnetic field is able to reduce the relaxation times of the surroundings [93,94]. Their influence is much stronger as lower is the distance between them and the protons of the polymer chains. Determination of longitudinal relaxation in the rotating frame with different spin-locking frequencies allowed to make some considerations about the changes is the molecular dynamics inside the samples [95].
Another way to improve the mechanical properties had been the blending with another biodegradable polymer, such as PLA, and the addition of fillers, such as hydrophilic and hydrophobic silicas and montmorillonite. An intermediate 1H T1 between the one for pure starch and pure PLA was found, indicating good miscibility between the two polymers. The addition of fillers promotes an increase in both the crystallinity degree, determined through MSE and 1H T1, due to greater overall rigidity. Employing ILT, the 1H T1 distributions can be obtained, which had been associated with different domains inside the materials. An increasing amount of montmorillonite appears to create a more heterogeneous system with respect to organoclays and silicas [96].
Starch can also be crosslinked with oxidized sucrose. The network structure was probed indirectly, analyzing the mobility of water molecules after swelling of the network. 1H T2 measurements pinpointed two water populations associated with bound water molecules and with extra-granular water. Crosslinking increases water mobility, confirming the improvement of hydrophilic properties [97].
Cellulose is another polysaccharide that had been evaluated as an alternative to synthetic polymers [98]. Cellulose properties are determined by its supramolecular structure, realized through hydrogen bonding between the polymer chains. The high content of hydroxyl groups makes cellulose structure highly susceptible to water, therefore TD-NMR was applied to examine the morphological changes with moisture.
MSE was employed to determine the phase composition, fitting the FID with a three components function, obtaining the water uptake, the degree of crystallinity and the amorphous content. A decrease of crystallinity and increment of the amorphous phase are observed with increasing water content. Spin diffusion was exploited to assess the linear size of fibrils. Goldman–Shen sequences were introduced at two times in the FID, corresponding to the polarization transfer from amorphous to crystalline and from water to the solid phase. The extrapolation to 0 amorphous amplitude of the initial region of the dispersion curves and the T2 for the amorphous phase allowed to calculate the domain sizes and the spin diffusion coefficient in 1D, that changes upon water uptake. Comparison with the trend of R1 = 1/T1 helped to describe the mechanism of uptake as infiltration of water inside the micropores, forming a monolayer at the surface of elementary fibrils, followed by deepening in the micropores [99].
Morphological studies with MSE were carried out on blends of PHB (polyhydroxybutyrate) and PCL, where PHB is a biodegradable polymer with properties close to PP. Three fractions (crystalline, amorphous and interphase) are identified, and their composition was hypothesized according to their dynamics: amorphous phase is constituted prevalently by PCL, while interphase pertains to both polymers. R1 gave an indication about the miscibility degree of the two components, with better miscibility at high PHB levels. These results were in agreement with DSC and XRD data [100].
Resins can also be obtained by biobased precursors, such as poly furfuryl alcohol (PFA). T2 measurements were performed by applying CPMG to monitor the curing kinetics as a function of catalyst concentration and filler type and content. R2 (=1/T2) increases with curing time, and its variation is accelerated with increasing catalyst concentration. Two models of catalysis were employed to fit the data, with a better agreement including diffusion rates at an early stage of the reaction. Nanoparticles are able to increase the reaction rate at low loadings, after that reaction rate is reduced, because of hindered diffusion and chain mobility. Even the type of filler modifiers is decisive, related to the different chemical groups interacting with the matrix chains [101].
A polysaccharide with active moieties, as chitosan (CHI), could be used as a functional material for optoelectronics or sorption, due to its metal binding properties. The mechanism of interaction with different metals has been investigated, through simultaneous T1 and T2 determination with CP-CWFP sequence as function of pH in aqueous solutions. pH has a strong effect on the relaxation profiles, with the existence of two plateaus (low T1, T2 at acidic pH and high T1, T2 at basic pH) and a transition zone between the two, indicating coagulation of CHI. Interaction between CHI and ions can be appreciated confronting the values of relaxation times for the solution containing both CHI and ion with the CHI-free solution. Interaction is apparent for Fe3+, Cu2+, and Mn2+, with the formation of a stable complex with Cu2+, as hypothesized analyzing the results of Figure 17a. Analysis of supernatant after centrifugation showed the good capability of CHI in removing metal ions from solution, evidenced by the different behavior between the supernatant of the CHI-solutions and free ions solutions (Figure 17b) [102].
3.4. Industrial Applications
So far, the review has explored mainly academic applications concerning materials at a very early stage of development or very elegant and thorough characterization for providing experimental evidence for theoretical models. However, the LF-TD-NMR methods revised in the previous sections can also be applied to draw straightforward conclusions about common polymeric materials, such as degradation state or subtle differences between similar materials or effect of processing or formulation changes, that can be easily transferred in industrial routines.
In this section, we would like to propose examples of possible industrial relevance to demonstrate a great deal of opportunities that this technique can offer as support in industrial development and quality control.
TD-NMR can represent a very fast instrument to verify the consequences of exposure of materials to environmental conditions that could affect materials’ properties, analyzing the potentially induced molecular changes.
Thermal aging, for example, can occur both in elastomers and thermoplastics after the permanence at high temperatures. FTIR results show generally the occurrence of oxidation processes at the material surface, monitored through the carbonyl index. Nitrile rubber (NBR) behavior at a prolonged exposition to temperatures above 100 °C was investigated, together with the effect of lubricating oil. The degree of oxidation and loss of additives were correlated to the steady increase of crosslink density throughout the process (Figure 18a), which was prevented partially by the presence of oils, with better protection provided by base oil. Full oil contains, in fact, additives with active moieties that could accelerate the oxidation of rubber [103]. Instead, in a thermoplastic semi-crystalline polymer, the effect of thermal aging induces an increase in the rigid fraction, with the reconstruction of crystallites, that become larger driving out defects. While simple annealing induces a concomitant increase of the mobility of the soft-amorphous phase [104,105], the additional contribution of chemical reactions, such as oxidation, causes a reduction, at short times, in the overall mobility, because of a higher confinement of the mobile-amorphous part and at longer exposure times, mobility increases because of oxidative chain cleavage [104,106]. Lately, the employment of NMR-MOUSE devices allowed to analyze the depth-dependent changes by aging, which are known to greatly compromise the mechanical properties. T2 was measured with an NMR-MOUSE for a polyamide 12 (PA12), even though this should be better defined as a T2,eff, data showed a biexponential decay. The two components were assigned to the rigid and semi-rigid fraction for the short relaxing component and to the mobile-amorphous phase for the long relaxing component. The variation of these components was more pronounced for the non-stabilized sample, reported in Figure 18b, confirming the protective action of the stabilizer and its role as a plasticizer. At the surface higher degradation and hardening occurs, with increasing exposure time the penetration depth of thermo-oxidation increases, as resulting from higher rigid fraction and lower T2,eff in both cases [106].
Similar studies were carried out on polyethylene, confirming the increase of crystalline phase with aging time and consequent decrease of T2,eff, that is of overall mobility, which changes faster at a higher temperature, incrementing at longer times, because of chain scission. Similar behavior can be observed after exposure to solvents, due to increased mobility of chains, but in the longer time the morphological changes are less strong than the reorganization attained with temperature. The impact of PE grade was also taken into consideration, showing almost no composition change for LLDPE and HDPE and instead wider thermal evolution for LDPE (Figure 18c), because of its lower melting temperature, lower crystallinity, and tertiary carbons easily subjected to attack by free-radicals [107].
Exposure of rubbers to solvents was also explored, since many rubbery materials have applications at direct contact with liquids, for example as sealing components. Commercial natural rubber (NR) susceptibility to biodiesel was investigated, exposing commercial carbon black (CB)-filled NR to a different mixture of diesel/biodiesel. CPMG measurements were recorded before and after 30 and 90 days of exposure, showing three components that steadily increase with the addition of solvent and time. To separate the effect of swelling from the actual biodiesel addition effect, MQ measurements were conducted, indicating a systematic lower DQ intensity, at same exposure times, for samples immersed in mixtures containing biodiesel, and a concurrent increase in the fraction of defects, indicating degradation of the network. A complete breakdown is reached after 90 days of sole biodiesel, where no DQ intensity is detected. MSE-FID analysis was able to detect the presence of a rigid phase in the liquid mixtures containing biodiesel after sample removal, as evidenced by the increasing signals with an immersion time of Figure 19, indicating chains with highly hindered mobility, which are attributed to CB exudation, leading to impairment of mechanical properties [108].
Even the effect of processing methodology on network structure has been analyzed. The blending method, in solution or mechanical in a two-roll mill, for NR/SBR blends with different composition has an impact on Dres difference between the experimental values and the theoretical ones, based on a mixture law. Mechanical blending gives the highest differences, meaning lower efficacy, giving rise to stronger phase separation that leads to preferential migration of curatives in the NR phase, while solution blending enhances the interface between the phases [109].
Even materials subjected to mechanical deformations can be distinguished from pristine samples. Fluorosilicone O-rings underwent accelerated aging under compression to elucidate if they had taken a compression set. A modified version of DQ NMR sequence was employed, with an evolution period of fixed time t1 to dephase completely zero and double quantum coherences and applying a π-pulse in alternate scans during this period to filter out longitudinal magnetization. A dipolar decay rate is then recorded, showing increased rates after compression sets respect to pristine samples, indicating a compression-induced order. However, the technique is not sensitive enough to discriminate between compression sets of different magnitude, because decay rates for compressed samples are quite similar [110].
However, differentiation capabilities between samples with subtle differences are attainable with other measurements, implementing statistical protocols. Detailed investigation of the limit of detection (LOD), the limit of quantification (LOQ), discriminating power (DP) of the instrument was conducted to find out almost undetectable differences in forensics traces of polyurethane (PU) samples [111]. Proton content, determined by proton counting through the maximum intensity of FID and comparison with a calibration line, previously constructed using liquid samples with known proton fraction, was calculated for each PU sample. T2 of the mobile phase, measured with a SE to refocus the magnetization of the rather constrained chains with a quite long initial echo time to exclude the contribution from the rigid phase, was also determined for each PU sample. Reporting T2 values as function of the proton content in a graph, revealed to give very scattered, uncorrelated results, that can be used to discriminate the samples (Figure 20). The DP, meaning the number of discriminated pairs respect to all possible sample pairs, was therefore calculated, applying statistical analysis methods, obtaining a 96% of DP. The degree of correlation between results conveyed by TD-NMR and other techniques, such as FTIR or TGA, has been calculated using the principal component analysis, highlighting the better performances of TD-NMR. The developed protocol could be applied in quality control analysis.
Discrimination capability can be also needed in evaluating the suitability of a material in respect to another, for a specific purpose in a specific environment. Probing the interaction existing between the material and a surrounding medium can be employed to achieve that. In fact, it proved effective in characterizing different fabrics for swimming, simply measuring MSE-FIDs of the fabrics in “dry” and “wet” conditions. T2 distributions after ILT, characterized by several peaks, were assigned to the solid component, for the lower T2, and to the subpopulation of water in the swelled sample, interacting in various ways with the fabrics’ fibers. Surfaces are, in fact, relaxation sinks, whose impact on water T2 reduction depends on water molecules interaction magnitude with the surface [112].
T2 can also inform about the effect of processing parameters, monitoring, for example, the morphology change. SE can be used, in alternative to MSE, to refocus the rigid phase. In Nylon 6 fibers, a three phases model has been considered adequate to describe the composition, with a good agreement of the crystal content with XRD. Increased drawing and winding speed of dried fibers, since water has a plasticizing effect, increase the degree of crystallinity at the expenses of the soft-amorphous phase. Nonetheless, spin-line crystallization was speculated to explain an increment of the soft-amorphous fraction at a high winding speed [113].
Morphological evaluation can also support the determination of the exact composition of polymers characterized by microphase separation, as in thermoplastic elastomers. It was attempted with SBR samples, where simple components analysis of T2 gave results compatible with the known content of butadiene only when the homopolymer blocks of styrene and butadiene were completely separated. Better resolution of the rubber fraction is achieved for blends of PS and SBR if the relaxation behavior of the rubber is known [114]. The good correspondence between the experimental T2 distributions for a 50/50 blend and the calculated one is presented in Figure 21a. The same approach is valuable to study the swelling process, for different pairs polymer-solvent/mixture of solvents. Polymer dispersions of polyurethane (PU) were swelled with mixtures of acetone and water in different proportions. Decomposition of FID signal in at least six components allowed to observe that the mechanism of swelling depends on the composition of the swelling medium [115].
An even more interesting finding was the possibility to correlate the mechanical properties of the polymer with its relaxation behavior. For the same system PS-SBR, the elastic modulus correlated with the slower T2, while the stretching exponent showed a good correlation with the elongation at break (Figure 21b) [114]. In PU foams, soft and hard components mix only to a limited extent. The degree of mixing can be calculated from the difference between the hard component proton fraction from NMR and the expected one from the formulation recipe. The T2 of the soft domain showed a correlation with the foam recovery time, i.e., a decrease with increasing T2 (Figure 21c). Another correlation was found with the viscous dampening (tanδ) with higher values at lower mobility [116]. Furthermore, stress-relaxation has been monitored with the compositional variation in semi-crystalline polymers, analyzing samples of PVDF, which has major applications in flexible risers for oil production. Stress-relaxation under strain is accompanied by a decrease in crystallinity, with a contingent increase in the rigid-amorphous phase [117]. It has a great outcome in evaluating the material stability in retaining its mechanical properties at precise operative conditions.
The improvements caused by changes in the formulation can also be studied, for example, the impact of different crosslinkers [66], stabilizers [107] or plasticizers. The introduction of new plasticizers had been the focus of Patel et al. [118] in a common resin employed as adhesive, such as hexamethylenetetramine (HMTA). T1 relaxation proved to be a viable parameter to compare the efficiency of different plasticizers and its change with concentration, according to the assumption that a higher T1 is related to more hindered mobility, thus a more rigid system, which, in this case, depends on a higher crosslinking degree [118]. Both reactive [119] and nonreactive [120] plasticizers have been taken into account, and the complete mechanism of action was further highlighted with DSC and FTIR measurements. More detailed monitoring of the crosslinking reaction at different temperatures was proposed in a subsequent paper [120]. The fundamental role of a properly solubilized plasticizer was clarified in terms of reduction of the temperature onset of crosslinking reaction and increase of the final crosslink density.
MQ measurements can also be applied to follow the progress of a chemical reaction [121], typically it can be the curing reaction, although it is necessary to employ a single-point approach, measuring at a fixed DQ time, chosen near the maximum of the DQ build-up. The increase of IDQ in this point, during reaction time under isothermal condition, is recorded and the cure degree can be defined as the ratio between the intensity at a given cure time and the intensity at “infinite” time, which is the highest obtained value for IDQ. Classical sigmoidal kinetic curves are obtained, and kinetic parameters are determined, such as induction time, vitrification time and polymerization rate. The curves were compared with kinetic curves from other methods, like rheology and DSC (Figure 22), pointed out the different sensitivity to different stages of the process that these techniques are able to sense [75].
A further method to study polymerization reactions has been proposed, using CWFP. In reference [38], it was applied on a commercial epoxy resin, which is characterized by fast polymerization kinetics. The simultaneous determination of both T1 and T2, embedded in the T* decay time measured in a single experiment, provides insights on the constraining of the liquid phase, following the curing. The reduction of both T1 and T2 is used to determine the kinetic parameters of reaction. The same approach was implemented to study the formation of a polyacrylamide hydrogel, which was investigated thoroughly with ILT contour maps of T* and MQ. T1 evolution has a maximum coinciding with the maximum conversion value, while contour maps show a displacement of T* with reaction progress. The entity of displacement results to be proportional to monomer concentration and crosslinking agent in the formulation, evidencing the great number of information that can be conveyed through this measure and exploited to check the reaction online. MQ provided evidence for the increase in crosslink density with a higher crosslinker content [122].
4. Conclusions
The review aimed to present an overview of the most recent results obtained with low-field NMR in time domain, for the characterization of polymeric materials. Special attention has been drawn to the possibilities that this technique offers both for research and for the industry. Validation of theoretical models and characterization of the properties of new materials, especially when there are not many other techniques able to do it, for example for nanostructures, are possible. The sensitivity over the chemistry and modification of polymeric items is enough to enable the technology transfer in industrial contexts for ordinary controls.
The most common methods to acquire information about phase composition, molecular dynamics, proton density, domains sizes, local order, diffusivity have been explained, taking into account sequences that measure relaxivity, multiple-quantum coherences, spin diffusion, as well as new methods that promise to be faster in determining relaxation times, such as wave free precession, or improvement of analytical elaborations with more complex models to exploit parameters that can be obtained with faster sequences to draw out further information. This point should be specially underlined in view of industrial applications, where the rapidity for results is fundamental.
Several examples have been presented in order to show that TD-NMR is a very promising analytical tool to check the impact of internal and external factors on the structure and properties of polymeric materials. The results of low-field NMR experiments correlate very well with results obtained with more traditional techniques, such as swelling or mechanical analysis, but with the advantage of not being destructive and that they require far less sample quantity, thus enabling the evaluation on traces or directly on final products with unusual geometries. This could allow the a priori rational design of polymers and development of transformation processes to meet the requested macroscopic properties, acting on the microscopic ones, which could be an important breakthrough for industrial-scale production.
Despite the already great achievements of TD-NMR, further development of sequences and analytical procedures will be necessary to match the tool performances with the routinely use, even for non-experts in the technique.
Acknowledgments
D.B. thanks Trelleborg Coated Systems Italy S.p.A for the PhD scholarship.
Conflicts of Interest
The authors declare no conflict of interest.
References
- Bicerano, J. Prediction of Polymers, 3rd ed.; Revised and Expanded; CRC Press: Boca Raton, FL, USA, 2002; ISBN 0824708210. [Google Scholar]
- Andrady, A.L.; Neal, M.A. Applications and societal benefits of plastics. Philos. Trans. R. Soc. B Biol. Sci. 2009, 364, 1977–1984. [Google Scholar] [CrossRef] [Green Version]
- Schmidt-Rohr, K.; Spiess, H.W. Multidimensional Solid-State NMR and Polymers; Elsevier: Amsterdam, The Netherlands, 2012. [Google Scholar]
- McBrierty, V.J.; Douglass, D.C. Recent advances in the NMR of solid polymers. J. Polym. Sci. Macromol. Rev. 1981, 16, 295–366. [Google Scholar] [CrossRef]
- McBrierty, V.J.; Douglass, D.C. Nuclear Magnetic-Resonance of Solid Polymers. Phys. Rep. Rev. Sec. Phys. Lett. 1980, 63, 63–147. [Google Scholar] [CrossRef]
- Eidmann, G.; Savelsberg, R.; Blümler, P.; Blümich, B. The NMR MOUSE, a Mobile Universal Surface Explorer. J. Magn. Reson. Ser. A 1996, 122, 104–109. [Google Scholar] [CrossRef]
- Goldman, M. Quantum Description of High-Resolution NMR in Liquids; Oxford University Press: Oxford, UK, 1988. [Google Scholar]
- Steele, R.M.; Korb, J.P.; Ferrante, G.; Bubici, S. New applications and perspectives of fast field cycling NMR relaxometry. Magn. Reson. Chem. 2016, 54, 502–509. [Google Scholar] [CrossRef] [PubMed]
- Hofmann, M.; Gainaru, C.; Cetinkaya, B.; Valiullin, R.; Fatkullin, N.; Rössler, E.A. Field-Cycling Relaxometry as a Molecular Rheology Technique: Common Analysis of NMR, Shear Modulus and Dielectric Loss Data of Polymers vs Dendrimers. Macromolecules 2015, 48, 7521–7534. [Google Scholar] [CrossRef]
- Håkansson, B.; Nydén, M.; Söderman, O. The influence of polymer molecular-weight distributions on pulsed field gradient nuclear magnetic resonance self-diffusion experiments. Colloid Polym. Sci. 2000, 278, 399–405. [Google Scholar] [CrossRef]
- Zhang, Y.; Xiao, L.; Liao, G.; Song, Y.Q. Direct correlation of diffusion and pore size distributions with low field NMR. J. Magn. Reson. 2016, 269, 196–202. [Google Scholar] [CrossRef] [PubMed]
- Abrami, M.; Chiarappa, G.; Farra, R.; Grassi, G.; Marizza, P.; Grassi, M. Use of low-field NMR for the characterization of gels and biological tissues. Admet Dmpk 2018, 6, 34–46. [Google Scholar] [CrossRef] [Green Version]
- Hahn, E.L. Spin echoes. Phys. Rev. 1950, 80, 580–594. [Google Scholar] [CrossRef]
- Meiboom, S.; Gill, D. Modified spin-echo method for measuring nuclear relaxation times. Rev. Sci. Instrum. 1958, 29, 688–691. [Google Scholar] [CrossRef]
- Song, Y. Categories of Coherence Pathways for the CPMG Sequence. J. Magn. Reson. 2002, 91, 82–91. [Google Scholar] [CrossRef]
- Schäler, K.; Roos, M.; Micke, P.; Golitsyn, Y.; Seidlitz, A.; Thurn-albrecht, T.; Schneider, H.; Hempel, G.; Saalwächter, K. Basic principles of static proton low-resolution spin diffusion NMR in nanophase-separated materials with mobility contrast. Solid State Nucl. Magn. Reson. 2015, 72, 50–63. [Google Scholar] [CrossRef]
- Markley, J.L.; Horsley, W.J.; Klein, M.P. Spin-Lattice Relaxation Measurements in Slowly Relaxing Complex Spectra. J. Chem. Phys. 1971, 55, 3604–3605. [Google Scholar] [CrossRef]
- Carr, H.Y.; Purcell, E.M. Effects of diffusion on free precession in nuclear magnetic resonance experiments. Phys. Rev. 1954, 94, 630–638. [Google Scholar] [CrossRef]
- Jones, G.P. Spin-Lattice Relaxation in the Rotating Frame: Weak-Collision Case. Phys. Rev. 1966, 148, 3437–3441. [Google Scholar] [CrossRef]
- Monteiro, M.; Cucinelli Neto, R.P.; Santos, I.C.S.; da Silva, E.O.; Tavares, M.I.B. Inorganic-organic hybrids based on poly (ε-Caprolactone) and silica oxide and characterization by relaxometry applying low-field NMR. Mater. Res. 2012, 15, 825–832. [Google Scholar] [CrossRef] [Green Version]
- Saalwächter, K. Multiple-Quantum NMR Studies of Anisotropic Polymer Chain Dynamics. In Modern Magnetic Resonance; Springer International Publishing AG: Cham, Switzerland, 2017; ISBN 978-3-319-28275-6. [Google Scholar]
- Baum, J.; Pines, A. NMR Studies of Clustering in Solids. J. Am. Chem. Soc. 1986, 108, 7447–7454. [Google Scholar] [CrossRef]
- Saalwächter, K. Proton multiple-quantum NMR for the study of chain dynamics and structural constraints in polymeric soft materials. Prog. Nucl. Magn. Reson. Spectrosc. 2007, 51, 1–35. [Google Scholar] [CrossRef]
- Schneider, M.; Gasper, L.; Demco, D.E.; Blümich, B. Residual dipolar couplings by 1H dipolar-encoded longitudinal magnetization, double- and triple-quantum nuclear magnetic resonance in cross-linked elastomers. J. Chem. Phys. 1999, 111, 402–415. [Google Scholar] [CrossRef]
- Voda, M.A.; Demco, D.E.; Perlo, J.; Orza, R.A.; Blümich, B. Multispin moments edited by multiple-quantum NMR: Application to elastomers. J. Magn. Reson. 2005, 172, 98–109. [Google Scholar] [CrossRef]
- Maus, A.; Hertlein, C.; Saalwächter, K. A Robust Proton NMR Method to Investigate Hard/Soft Ratios, Crystallinity, and Component Mobility in Polymers. Macromol. Chem. Phys. 2006, 207, 1150–1158. [Google Scholar] [CrossRef]
- Saalwächter, K.; Ziegler, P.; Spyckerelle, O.; Haidar, B.; Vidal, A.; Sommer, J.U. 1H multiple-quantum nuclear magnetic resonance investigations of molecular order distributions in poly(dimethylsiloxane) networks: Evidence for a linear mixing law in bimodal systems. J. Chem. Phys. 2003, 119, 3468–3482. [Google Scholar] [CrossRef]
- Buda, A.; Demco, D.E.; Bertmer, M.; Blümich, B.; Reining, B.; Keul, H.; Höcker, H. Domain sizes in heterogeneous polymers by spin diffusion using single-quantum and double-quantum dipolar filters. Solid State Nucl. Magn. Reson. 2003, 24, 39–67. [Google Scholar] [CrossRef]
- Suter, D.; Ernst, R.R. Spin diffusion in resolved solid-state NMR spectra. Phys. Rev. B 1985, 32, 5608–5627. [Google Scholar] [CrossRef] [Green Version]
- Assink, R.A. Nuclear Spin Diffusion between Polyurethane Microphases. Macromolecules 1978, 11, 1233–1237. [Google Scholar] [CrossRef]
- Goldman, M.; Shen, L. Spin-Spin Relaxation in LaF3. Phys. Rev. 1966, 144, 321–331. [Google Scholar] [CrossRef]
- Zhang, S.; Mehring, M. A Modified Goldman-Shen NMR Pulse Sequence. Chem. Phys. Lett. 1989, 160, 644–646. [Google Scholar] [CrossRef]
- Filgueiras, J.G.; da Silva, U.B.; Paro, G.; d’Eurydice, M.N.; Cobo, M.F.; DeAzevedo, E.R. Dipolar filtered magic-sandwich-echoes as a tool for probing molecular motions using time domain NMR. J. Magn. Reson. 2017, 285, 47–54. [Google Scholar] [CrossRef] [PubMed] [Green Version]
- Adams, A. Analysis of solid technical polymers by compact NMR. TrAC Trends Anal. Chem. 2016, 83, 107–119. [Google Scholar] [CrossRef]
- Schäler, K. Low-Field Nmr Studies of Structure and Dynamics in Semicrystalline Polymers. Ph.D. Thesis, Institut für Physik der Naturwissenschaftlichen Fakultät II der Martin-Luther-Universität Halle-Wittenberg, Halle, Germany, 2013. [Google Scholar]
- Mauri, M.; Thomann, Y.; Schneider, H.; Saalwa, K. Spin-diffusion NMR at low field for the study of multiphase solids. Solid State Nucl. Magn. Reson. 2008, 34, 125–141. [Google Scholar] [CrossRef]
- Moraes, T.B.; Monaretto, T.; Colnago, L.A. Rapid and simple determination of T1 relaxation times in time-domain NMR by Continuous Wave Free Precession sequence. J. Magn. Reson. 2016, 270, 1–6. [Google Scholar] [CrossRef] [PubMed]
- Venâncio, T.; Colnago, L.A. Simultaneous measurements of T1 and T2 during fast polymerization reaction using continuous wave-free precession NMR method. Magn. Reson. Chem. 2012, 50, 534–538. [Google Scholar] [CrossRef]
- Barone, P.; Ramponi, A.; Sebastiani, G. On the numerical inversion of the Laplace transform for nuclear magnetic resonance relaxometry. Inverse Probl. 2001, 17, 77–94. [Google Scholar] [CrossRef]
- McWhirter, J.G.; Pike, E.R. On the numerical inversion of the Laplace transform and similar Fredholm integral equations of the first kind. J. Phys. A. Math. Gen. 1978, 11, 1729–1745. [Google Scholar] [CrossRef]
- Moldovan, D.; Fechete, R.; Demco, D.E.; Culea, E.; Blümich, B.; Herrmann, V.; Heinz, M. Heterogeneity of nanofilled EPDM elastomers investigated by inverse laplace transform 1H NMR relaxometry and rheometry. Macromol. Chem. Phys. 2010, 211, 1579–1594. [Google Scholar] [CrossRef]
- Groetsch, C.W. The Theory of Tikhonov Regularization for Fredholm Equations of the First Kind. SIAM Rev. 2005, 28, 116–118. [Google Scholar]
- Dobrzański, L.A. Significance of materials science for the future development of societies. J. Mater. Process. Technol. 2006, 175, 133–148. [Google Scholar] [CrossRef]
- Zhang, R.; Yan, T.; Lechner, B.D.; Schröter, K.; Liang, Y.; Li, B.; Furtado, F.; Sun, P.; Saalwächter, K. Heterogeneity, segmental and hydrogen bond dynamics, and aging of supramolecular self-healing rubber. Macromolecules 2013, 46, 1841–1850. [Google Scholar] [CrossRef]
- Wittmer, A.; Wellen, R.; Saalwächter, K.; Koschek, K. Moisture-mediated self-healing kinetics and molecular dynamics in modified polyurethane urea polymers. Polymer 2018, 151, 125–135. [Google Scholar] [CrossRef]
- Malmierca, M.A.; González-Jiménez, A.; Mora-Barrantes, I.; Posadas, P.; Rodríguez, A.; Ibarra, L.; Nogales, A.; Saalwächter, K.; Valentín, J.L. Characterization of network structure and chain dynamics of elastomeric ionomers by means of 1H Low-Field NMR. Macromolecules 2014, 47, 5655–5667. [Google Scholar] [CrossRef]
- Polgar, L.M.; Hagting, E.; Raffa, P.; Mauri, M.; Simonutti, R.; Picchioni, F.; Van Duin, M. Effect of Rubber Polarity on Cluster Formation in Rubbers Cross-Linked with Diels-Alder Chemistry. Macromolecules 2017, 50, 8955–8964. [Google Scholar] [CrossRef]
- Kucinska-Lipka, J.; Sinyavsky, N.; Mershiev, I.; Kupriyanova, G.; Haponiuk, J. Study of Aliphatic Polyurethanes by the Low-Field 1H NMR Relaxometry Method with the Inversion of the Integral Transformation. Appl. Magn. Reson. 2018, 50, 347–356. [Google Scholar] [CrossRef]
- Somekawa, S.; Masutani, K.; Hsu, Y.; Mahara, A.; Kimura, Y.; Yamaoka, T. Size-Controlled Nanomicelles of Poly(lactic acid)–Poly(ethylene glycol) Copolymers with a Multiblock Configuration. Polymers 2015, 7, 1177–1191. [Google Scholar] [CrossRef] [Green Version]
- Monguzzi, A.; Vanhecke, D.; Vadrucci, R.; Meinardi, F.; Simon, Y.C.; Weder, C. Thermoresponsive low-power light upconverting polymer nanoparticles. Mater. Horizons 2016, 3, 602–607. [Google Scholar]
- Bonetti, S.; Farina, M.; Mauri, M.; Koynov, K.; Butt, H.J.; Kappl, M.; Simonutti, R. Core@shell Poly(n-butylacrylate)@polystyrene Nanoparticles: Baroplastic Force-Responsiveness in Presence of Strong Phase Separation. Macromol. Rapid Commun. 2016, 37, 584–589. [Google Scholar] [CrossRef]
- Musgrave, C.S.A.; Nazarov, W.; Bazin, N. The Effect of para-divinyl benzene on styrenic emulsion-templated porous polymers: A chemical trojan horse. J. Mater. Sci. 2017, 52, 3179–3187. [Google Scholar] [CrossRef]
- Valentín, J.L.; López, D.; Hernández, R.; Mijangos, C.; Saalwächter, K. Structure of polyvinyl alcohol cryo-hydrogels as studied by proton low-field NMR spectroscopy. Macromolecules 2009, 42, 263–272. [Google Scholar] [CrossRef] [PubMed]
- Jorge, E.; Rodrigues, R.; De, M.; Cavalcante, P.; Inês, M.; Tavares, B. Time domain NMR evaluation of poly(vinyl alcohol) xerogels. Polímeros 2016, 26, 221–227. [Google Scholar] [Green Version]
- Monguzzi, A.; Mauri, M.; Bianchi, A.; Dibbanti, M.K.; Simonutti, R.; Meinardi, F. Solid-State Sensitized Upconversion in Polyacrylate Elastomers. J. Phys. Chem. C 2016, 120, 2609–2614. [Google Scholar] [CrossRef]
- Litvinov, V.M.; Ries, M.E.; Baughman, T.W.; Henke, A.; Matloka, P.P. Chain Entanglements in Polyethylene Melts. Why Is It Studied Again? Macromolecules 2013, 46, 541–547. [Google Scholar] [CrossRef]
- De Gennes, P.G. Reptation of a polymer chain in the presence of fixed obstacles. J. Chem. Phys. 1971, 55, 572–579. [Google Scholar] [CrossRef]
- Edwards, S.F.; Doi, M. Dynamics of Concentrated Polymer Systems Part 3. J. Chem. Soc. Faraday Trans. 2 Mol. Chem. Phys. 1978, 74, 1818–1832. [Google Scholar]
- Collignon, J.; Sillescu, H.; Spiess, H.W. Pseudo-solid echoes of proton and deuteron NMR in polyethvlene melts. Colloid Polym. Sci. Kolloid Zeitschrift Zeitschrift Polym. 1981, 259, 220–226. [Google Scholar] [CrossRef]
- Vaca Chávez, F.; Saalwächter, K. Time-domain NMR observation of entangled polymer dynamics: Analytical theory of signal functions. Macromolecules 2011, 44, 1560–1569. [Google Scholar] [CrossRef]
- Vaca Chávez, F.; Saalwächter, K. Time-domain NMR observation of entangled polymer dynamics: Universal behavior of flexible homopolymers and applicability of the tube model. Macromolecules 2011, 44, 1549–1559. [Google Scholar] [CrossRef]
- Kariyo, S.; Brodin, A.; Gainaru, C.; Hermann, A.; Schick, H.; Novikov, V.N.; Rössler, E.A. From Simple Liquid to a Polymer Melt. Glassy and Polymer Dynamics Studied by Fast Field Cycling NMR Relaxometry: Low and High Molecular Weight Limit. Macromolecules 2008, 41, 5313–5321. [Google Scholar] [CrossRef]
- Hofmann, M.; Herrmann, A.; Ok, S.; Franz, C.; Kruk, D.; Saalwächter, K.; Steinhart, M.; Rössler, E.A. Polymer dynamics of polybutadiene in nanoscopic confinement as revealed by field cycling 1H NMR. Macromolecules 2011, 44, 4017–4021. [Google Scholar] [CrossRef]
- Hofmann, M.; Herrmann, A.; Abou Elfadl, A.; Kruk, D.; Wohlfahrt, M.; Rössler, E.A. Glassy, rouse, and entanglement dynamics as revealed by field cycling 1H NMR relaxometry. Macromolecules 2012, 45, 2390–2401. [Google Scholar] [CrossRef]
- Mordvinkin, A.; Saalwächter, K. Microscopic observation of the segmental orientation autocorrelation function for entangled and constrained polymer chains. J. Chem. Phys. 2017, 146. [Google Scholar] [CrossRef]
- Campise, F.; Agudelo, D.C.; Acosta, R.H.; Villar, M.A.; Vallés, E.M.; Monti, G.A.; Vega, D.A. Contribution of Entanglements to Polymer Network Elasticity. Macromolecules 2017, 50, 2964–2972. [Google Scholar] [CrossRef]
- Dibbanti, M.K.; Mauri, M.; Mauri, L.; Medaglia, G.; Simonutti, R. Probing small network differences in sulfur-cured rubber compounds by combining nuclear magnetic resonance and swelling methods. J. Appl. Polym. Sci. 2015, 132, 1–8. [Google Scholar] [CrossRef]
- Gotlib, Y.Y.; Lifshits, M.I.; Shevelev, V.A.; Lishanskii, I.S.; Balanina, I.V. The influence of the chemical crosslinking network on the spin-spin relaxation of crosslinked and swelling polymer systems. Polym. Sci. U.S.S.R. 1976, 18. [Google Scholar] [CrossRef]
- Wu, B.; Chassé, W.; Peters, R.; Brooijmans, T.; Dias, A.A.; Heise, A.; Duxbury, C.J.; Kentgens, A.P.M.; Brougham, D.F.; Litvinov, V.M. Network Structure in Acrylate Systems: Effect of Junction Topology on Cross-Link Density and Macroscopic Gel Properties. Macromolecules 2016, 49, 6531–6540. [Google Scholar] [CrossRef]
- Magusin, P.C.M.M.; Orza, R.A.; Litvinov, V.M.; Van Duin, M.; Saalwächter, K. Chain mobility in crosslinked EPDM rubbers. Comparison of 1H NMR T2 relaxometry and double-quantum 1H NMR. ACS Symp. Ser. 2011, 1077, 207–220. [Google Scholar]
- Di, X.; Che, J.; Toki, S.; Valentin, J.L.; Brasero, J.; Nimpaiboon, A.; Rong, L.; Hsiao, B.S. Chain Dynamics and Strain-Induced Crystallization of Pre- and Postvulcanized Natural Rubber Latex Using Proton Multiple Quantum NMR and Uniaxial Deformation by in Situ Synchrotron X-ray Diffraction. Macromolecules 2012, 45, 6491–6503. [Google Scholar]
- Orza, R.A.; Magusin, P.C.M.M.; Litvinov, V.M.; Van Duin, M.; Michels, M.A.J. Mechanism for Peroxide Cross-Linking of EPDM Rubber from MAS 13C NMR Spectroscopy. Macromolecules 2009, 42, 8914–8924. [Google Scholar] [CrossRef]
- Toki, S.; Sics, I.; Ran, S.; Liu, L.; Hsiao, B.S. New Insights into Structural Development in Natural Rubber during Uniaxial Deformation by In Situ Synchrotron X-ray Diffraction. Macromolecules 2002, 35, 6578–6584. [Google Scholar] [CrossRef]
- Naumova, A.; Tschierske, C.; Saalwächter, K. Orientation-dependent proton double-quantum NMR build-up function for soft materials with anisotropic mobility. Solid State Nucl. Magn. Reson. 2017, 82–83, 22–28. [Google Scholar] [CrossRef]
- Martin-Gallego, M.; Gonzàlez-Jiménez, A.; Verdejo, R.; Lopez-Manchado, M.A.; Valentin, J.L. Epoxy resin curing reaction studied by proton multiple-quantum NMR. J. Polym. Sci. Part B Polym. Phys. 2015, 53, 1324–1332. [Google Scholar] [CrossRef] [Green Version]
- Patel, J.P.; Hsu, S.L. Development of low field NMR technique for analyzing segmental mobility of crosslinked polymers. J. Polym. Sci. Part B Polym. Phys. 2018, 56, 639–643. [Google Scholar] [CrossRef]
- Litvinov, V.M.; Orza, R.A.; Klüppel, M.; Van Duin, M.; Magusin, P.C.M.M. Rubber-filler interactions and network structure in relation to stress-strain behavior of vulcanized, carbon black filled EPDM. Macromolecules 2011, 44, 4887–4900. [Google Scholar] [CrossRef]
- Papon, A.; Saalwächter, K.; Schäler, K.; Guy, L.; Lequeux, F.; Montes, H. Low-field NMR investigations of nanocomposites: Polymer dynamics and network effects. Macromolecules 2011, 44, 913–922. [Google Scholar] [CrossRef]
- Tadiello, L.; D’Arienzo, M.; Di Credico, B.; Hanel, T.; Matejka, L.; Mauri, M.; Morazzoni, F.; Simonutti, R.; Spirkova, M.; Scotti, R. The filler-rubber interface in styrene butadiene nanocomposites with anisotropic silica particles: Morphology and dynamic properties. Soft Matter 2015, 11, 4022–4033. [Google Scholar] [CrossRef] [PubMed]
- Borsacchi, S.; Sudhakaran, U.P.; Calucci, L.; Martini, F.; Carignani, E.; Messori, M.; Geppi, M. Rubber-filler interactions in polyisoprene filled with in situ generated silica: A solid state NMR study. Polymers 2018, 10, 822. [Google Scholar] [CrossRef]
- Valentìn, J.L.; Mora-Barrantes, I.; Carretero-Gonzalez, J.; Lopez-Manchado, M.A.; Sotta, P.; Long, D.R.; Saalwachter, K. Novel Experimental Approach to Evaluate Filler-Elastomer Interactions. Macromolecules 2010, 43, 334–346. [Google Scholar] [CrossRef]
- Mauri, M.; Floudas, G.; Simonutti, R. Local order and dynamics of nanoconstrained ethylene-butylene chain segments in SEBS. Polymers 2018, 10, 655. [Google Scholar] [CrossRef] [PubMed]
- Hertlein, C.; Saalwächter, K.; Strobl, G. Low-field NMR studies of polymer crystallization kinetics: Changes in the melt dynamics. Polymer 2006, 47, 7216–7221. [Google Scholar] [CrossRef]
- Roos, M.; Schäler, K.; Seidlitz, A.; Thurn-Albrecht, T.; Saalwächter, K. NMR study of interphase structure in layered polymer morphologies with mobility contrast: Disorder and confinement effects vs. dynamic heterogeneities. Colloid Polym. Sci. 2014, 292, 1825–1839. [Google Scholar] [CrossRef]
- Schneider, H.; Saalwächter, K.; Roos, M. Complex Morphology of the Intermediate Phase in Block Copolymers and Semicrystalline Polymers as Revealed by 1H NMR Spin Diffusion Experiments. Macromolecules 2017, 50, 8598–8610. [Google Scholar] [CrossRef]
- Ramakrishnan, N.; Sharma, S.; Gupta, A.; Alashwal, B.Y. Keratin based bioplastic film from chicken feathers and its characterization. Int. J. Biol. Macromol. 2018, 111, 352–358. [Google Scholar] [CrossRef]
- Zárate-Ramíreza, L.S.; Romero, A.; Bengoecheab, C.; Partalc, P.; Guerrero, A. Thermo-mechanical and hydrophilic properties of polysaccharide/gluten-based bioplastics. Carbohydr. Polym. 2014, 112, 24–31. [Google Scholar] [CrossRef]
- Liebeck, B.M.; Hidalgo, N.; Roth, G.; Popescu, C.; Böker, A. Synthesis and Characterization of Methyl Cellulose/Keratin Hydrolysate Composite Membranes. Polymers 2017, 9, 91. [Google Scholar] [CrossRef] [PubMed]
- Bernard, M. Industrial potential of polyhydroxyalkanoate bioplastic: A brief review. Univ. Saskatchewan Undergrad. Res. J. 2014, 1, 1–14. [Google Scholar] [CrossRef]
- Lörcks, J. Properties and applications of compostable starch-based plastic material. Polym. Degrad. Stab. 1998, 59, 245–249. [Google Scholar] [CrossRef]
- Gonzalez-Gutierrez, J.; Partal, P.; Garcia-Morales, M.; Gallegos, C. Development of highly-transparent protein/starch-based bioplastics. Bioresour. Technol. 2010, 101, 2007–2013. [Google Scholar] [CrossRef]
- Mose, B.R.; Maranga, S.M. A Review on Starch Based Nanocomposites for Bioplastic Materials. J. Mater. Sci. Eng. B 2011, 1, 239–245. [Google Scholar]
- Vismara, E.; Bongio, C.; Coletti, A.; Edelman, R.; Serafini, A.; Mauri, M.; Simonutti, R.; Bertini, S.; Urso, E.; Assaraf, Y.G.; et al. Albumin and hyaluronic acid-coated superparamagnetic iron oxide nanoparticles loaded with paclitaxel for biomedical applications. Molecules 2017, 22, 1030. [Google Scholar] [CrossRef] [PubMed]
- Vanderhart, D.L.; Asano, A.; Gilman, J.W. Solid-State NMR Investigation of Paramagnetic Nylon-6 Clay Nanocomposites. 1. Crystallinity, Morphology, and the Direct Influence of Fe3+ on Nuclear Spins. Chem. Mater. 2001, 13, 3781–3795. [Google Scholar] [CrossRef]
- Cucinelli Neto, R.P.; da Rocha Rodrigues, E.J.; Tavares, M.I.B. Proton NMR relaxometry as probe of gelatinization, plasticization and montmorillonite-loading effects on starch-based materials. Carbohydr. Polym. 2018, 182, 123–131. [Google Scholar] [CrossRef]
- Brito, L.M.; Sebastião, P.J.O.; Tavares, M.I.B. NMR relaxometry evaluation of nanostructured starch-PLA blends. Polym. Test. 2015, 45, 161–167. [Google Scholar] [CrossRef]
- Wang, P.; Sheng, F.; Tang, S.W.; ud-Din, Z.; Chen, L.; Nawaz, A.; Hu, C.; Xiong, H. Synthesis and Characterization of Corn Starch Crosslinked with Oxidized Sucrose. Starch Stärke 2018, 1800152. [Google Scholar] [CrossRef]
- Perotto, G.; Ceseracciu, L.; Simonutti, R.; Paul, U.C.; Guzman-Puyol, S.; Tran, T.N.; Bayer, I.S.; Athanassiou, A. Bioplastics from vegetable waste: Via an eco-friendly water-based process. Green Chem. 2018, 20, 894–902. [Google Scholar] [CrossRef]
- Grunin, L.Y.; Grunin, Y.B.; Nikolskaya, E.A.; Sheveleva, N.N.; Nikolaev, I.A. An NMR relaxation and spin diffusion study of cellulose structure during water adsorption. Biophysics 2017, 62, 198–206. [Google Scholar] [CrossRef]
- Cavalcante, M.P.; Toledo, A.L.M.M.; Rodrigues, E.J.R.; Neto, R.P.C.; Tavares, M.I.B. Correlation between traditional techniques and TD-NMR to determine the morphology of PHB/PCL blends. Polym. Test. 2017, 58, 159–165. [Google Scholar] [CrossRef]
- Vargas, M.A.; Scheubner, M.; Guthausen, G. Reaction Kinetics of Polyfurfuryl Alcohol Bioresin and Nanoparticles by 1H-NMR Transverse Relaxation Measurements. Polym. Compos. 2018, 39, 3280–3288. [Google Scholar] [CrossRef]
- Kock, F.V.C.; Monaretto, T.; Colnago, L.A. Time-domain NMR relaxometry as an alternative method for analysis of chitosan-paramagnetic ion interactions in solution. Int. J. Biol. Macromol. 2017, 98, 228–232. [Google Scholar] [CrossRef] [PubMed]
- Liu, X.; Zhao, J.; Yang, R.; Iervolino, R.; Barbera, S. Effect of lubricating oil on thermal aging of nitrile rubber. Polym. Degrad. Stab. 2018, 151, 136–143. [Google Scholar] [CrossRef]
- Sun, N.; Wenzel, M.; Adams, A. Morphology of high-density polyethylene pipes stored under hydrostatic pressure at elevated temperature. Polymer 2014, 55, 3792–3800. [Google Scholar] [CrossRef]
- Mauri, M.; Ponting, M.; Causin, V.; Pisciotti, F.; Simonutti, R. Morphological Reorganization and Mechanical Enhancement in Multilayered Polyethylene/Polypropylene Films by Layer Multiplication or Mild Annealing. J. Polym. Sci. Part B Polym. Phys. 2018, 56, 520–531. [Google Scholar] [CrossRef]
- Zhang, J.; Adams, A. Understanding thermal aging of non-stabilized and stabilized polyamide 12 using 1H solid-state NMR. Polym. Degrad. Stab. 2016, 134, 169–178. [Google Scholar] [CrossRef]
- Teymouri, Y.; Adams, A.; Blümich, B. Impact of Exposure Conditions on the Morphology of Polyethylene by Compact NMR. Macromol. Symp. 2018, 378, 1–8. [Google Scholar] [CrossRef]
- Silva, L.M.A.; Andrade, F.D.; Filho, E.G.A.; Monteiro, M.R.; de Azevedo, E.R.; Venâncio, T. NMR investigation of commercial carbon black filled vulcanized natural rubber exposed to petrodiesel/biodiesel mixtures. Fuel 2016, 186, 50–57. [Google Scholar] [CrossRef]
- Mansilla, M.A.; Valentín, J.L.; López-manchado, M.A.; González-jiménez, A.; Marzocca, A.J. Effect of entanglements in the microstructure of cured NR / SBR blends prepared by solution and mixing in a two-roll mill. Eur. Polym. J. 2016, 81, 365–375. [Google Scholar] [CrossRef]
- Harley, S.J.; Mayer, B.P.; Glascoe, E.A.; Maxwell, R.S.; Von White, G.; Bernstein, R. Multi-Method Characterization of Compression Set in Fluorosilicone O-Rings. Silicon 2014, 1–7. [Google Scholar] [CrossRef]
- Mauri, M.; Dibbanti, M.K.; Calzavara, M.; Mauri, L.; Simonutti, R.; Causin, V. Time domain nuclear magnetic resonance: A key complementary technique for the forensic differentiation of foam traces. Anal. Methods 2013, 5, 4336–4344. [Google Scholar] [CrossRef]
- Tawfilas, M.; Mauri, M.; De Trizio, L.; Lorenzi, R.; Simonutti, R. Surface Characterization of TiO2 Polymorphic Nanocrystals through 1H-TD-NMR. Langmuir 2018, 34, 9460–9469. [Google Scholar] [CrossRef]
- Litvinov, V.M.; Penning, J.P. Phase composition and molecular mobility in nylon 6 fibers as studied by proton NMR transverse magnetization relaxation. Macromol. Chem. Phys. 2004, 205, 1721–1734. [Google Scholar] [CrossRef]
- Nestle, N.; Heckmann, W.; Steininger, H.; Knoll, K. Towards quantification of butadiene content in styrene-butadiene block copolymers and their blends with general purpose polystyrene (GPPS) and the relation between mechanical properties and NMR relaxation times. Anal. Chim. Acta 2007, 604, 54–61. [Google Scholar] [CrossRef]
- Nestle, N.; Häberle, K. Non-invasive analysis of swelling in polymer dispersions by means of time-domain(TD)-NMR. Anal. Chim. Acta 2009, 654, 35–39. [Google Scholar] [CrossRef]
- Aou, K.; Ge, S.; Mowery, D.M.; Zeigler, R.C.; Gamboa, R.R. Two-domain morphology in viscoelastic polyurethane foams. Polymer 2015, 56, 37–45. [Google Scholar] [CrossRef]
- Contreras, M.M.; Nascimento, C.R.; Cucinelli Neto, R.P.; Teixeira, S.; Berry, N.; Costa, M.F.; Costa, C.A. TD-NMR analysis of structural evolution in PVDF induced by stress relaxation. Polym. Test. 2018, 68, 153–159. [Google Scholar] [CrossRef]
- Patel, J.P.; Xiang, Z.G.; Hsu, S.L.; Schoch, A.B.; Carleen, S.A.; Matsumoto, D. Characterization of the crosslinking reaction in high performance adhesives. Int. J. Adhes. Adhes. 2017, 78, 256–262. [Google Scholar] [CrossRef]
- Patel, J.P.; Deshmukh, S.; Zhao, C.; Wamuo, O.; Hsu, S.L.; Schoch, A.B.; Carleen, S.A.; Matsumoto, D. An analysis of the role of reactive plasticizers in the crosslinking reactions of a rigid resin. Polymer 2016, 107, 12–18. [Google Scholar] [CrossRef]
- Patel, J.P.; Deshmukh, S.; Zhao, C.; Wamuo, O.; Hsu, S.L.; Schoch, A.B.; Carleen, S.A.; Matsumoto, D. An analysis of the role of nonreactive plasticizers in the crosslinking reactions of a rigid resin. J. Polym. Sci. Part B Polym. Phys. 2017, 55, 206–213. [Google Scholar] [CrossRef]
- Danieli, E.; Perlo, J.; Duchateau, A.L.L.; Verzijl, G.K.M.; Litvinov, V.M.; Blümich, B.; Casanova, F. On-Line Monitoring of Chemical Reactions by using Bench-Top Nuclear Magnetic Resonance Spectroscopy. ChemPhysChem 2014, 15, 3060–3066. [Google Scholar] [CrossRef] [PubMed]
- Rodrigues, E.J.R.; Sebastião, P.J.O.; Tavares, M.I.B. 1H time domain NMR real time monitoring of polyacrylamide hydrogels synthesis. Polym. Test. 2017, 60, 396–404. [Google Scholar] [CrossRef]
Figure 1.
Behavior of T1 and T2 as a function of correlation time (in double-log scale) for ½ spins.
Figure 1.
Behavior of T1 and T2 as a function of correlation time (in double-log scale) for ½ spins.

Figure 2.
(a) Hahn-echo and (b) Carr–Purcell–Meiboon–Gill (CPMG) to measure T2, (c) inversion recovery and (d) saturation recovery sequence to measure T1, (e) spin–lock sequence to measure T1,ρ.
Figure 2.
(a) Hahn-echo and (b) Carr–Purcell–Meiboon–Gill (CPMG) to measure T2, (c) inversion recovery and (d) saturation recovery sequence to measure T1, (e) spin–lock sequence to measure T1,ρ.

Figure 3.
Graphical representation of the most common fitting functions mentioned in the text.

Figure 4.
Baum–Pines sequence to measure multiple-quantum (MQ) coherences. The two and three-pulses versions are indicated with dotted lines. All full boxes represent π/2 pulses and empty boxes denote π pulses.
Figure 4.
Baum–Pines sequence to measure multiple-quantum (MQ) coherences. The two and three-pulses versions are indicated with dotted lines. All full boxes represent π/2 pulses and empty boxes denote π pulses.

Figure 5.
Sequence for the magic sandwich echo (MSE) measurement.

Figure 6.
(a) Double-quantum (DQ) and (b) magic and polarization echo (MAPE) filter sequences. The DQ filter exemplified here is based on the two-pulse sequence. The filters are highlighted with red boxes, while the following MSE block is employed for the full recovery of the signal from rigid fractions, necessary for spin diffusion measurement.

Figure 7.
CP-CWFP sequence with the graphical representation of the progressive creation of the steady state condition.
Figure 7.
CP-CWFP sequence with the graphical representation of the progressive creation of the steady state condition.

Figure 8.
Change of residual dipolar couplings in reversible networks. (a) Increasing trapped rubber Dres with increasing MgO content in ionomeric rubbers (Reprinted with permission from reference [46]. Copyright 2014 American Chemical Society), (b) different Dres distributions for Diels–Alder cross-linked EPM (red) and EVM (blue) rubbers, where the component at higher Dres values was attributed to polar clusters of crosslinks (Reprinted with permission from reference [47]. Copyright 2017 American Chemical Society).
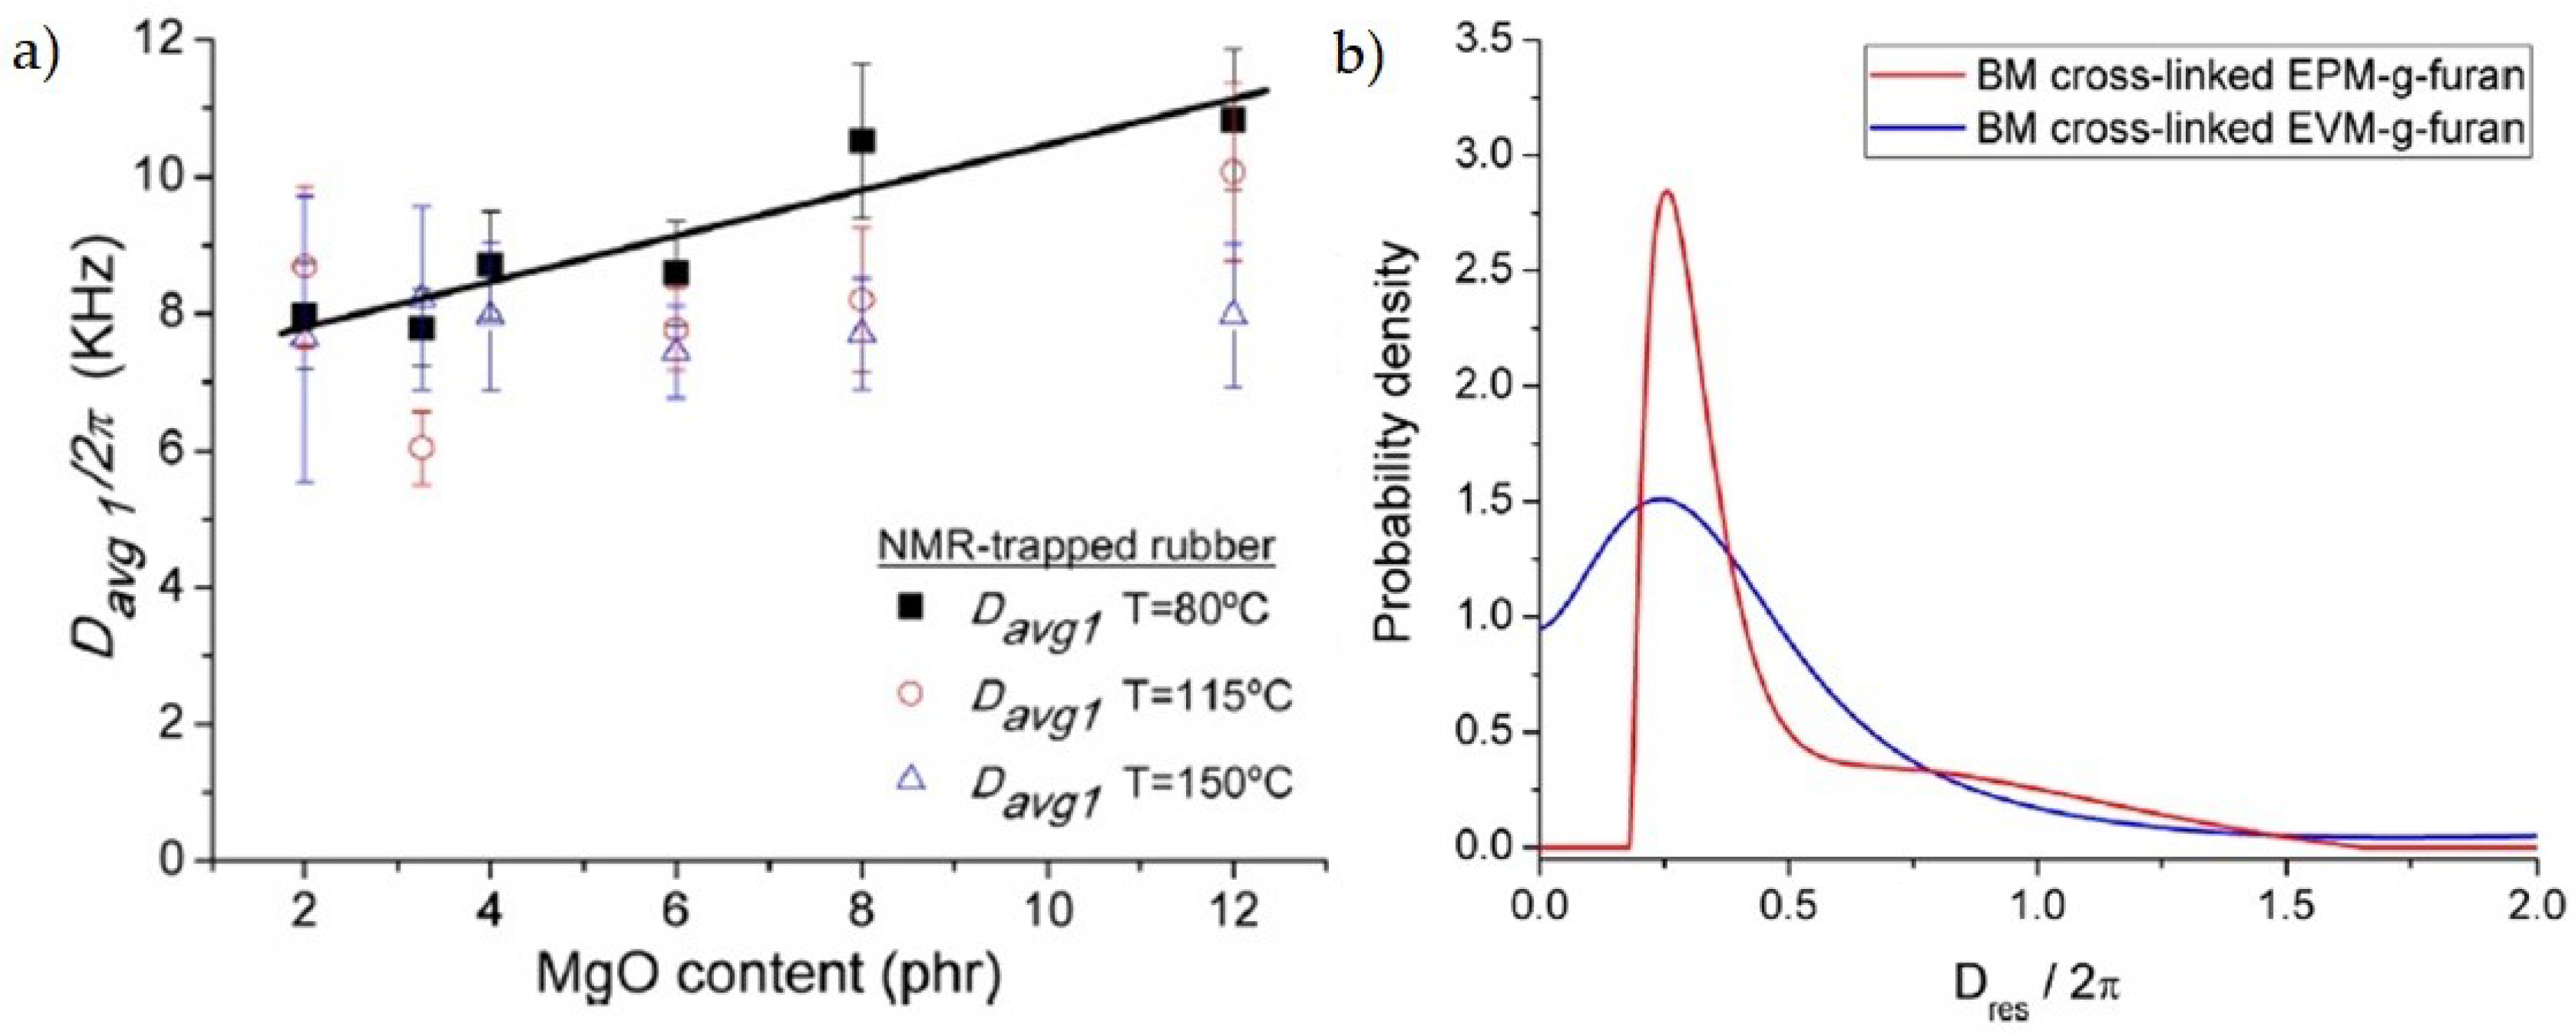
Figure 9.
Temperature dependence of PBA@PS core-shell nanoparticles rigid fraction. The inset highlights the region close to room temperature, showing an agreement of the composition with the expected composition derived from the synthesis feed, indicated by the solid line (Reprinted with permission from reference [51]. Copyright 2016 Wiley).
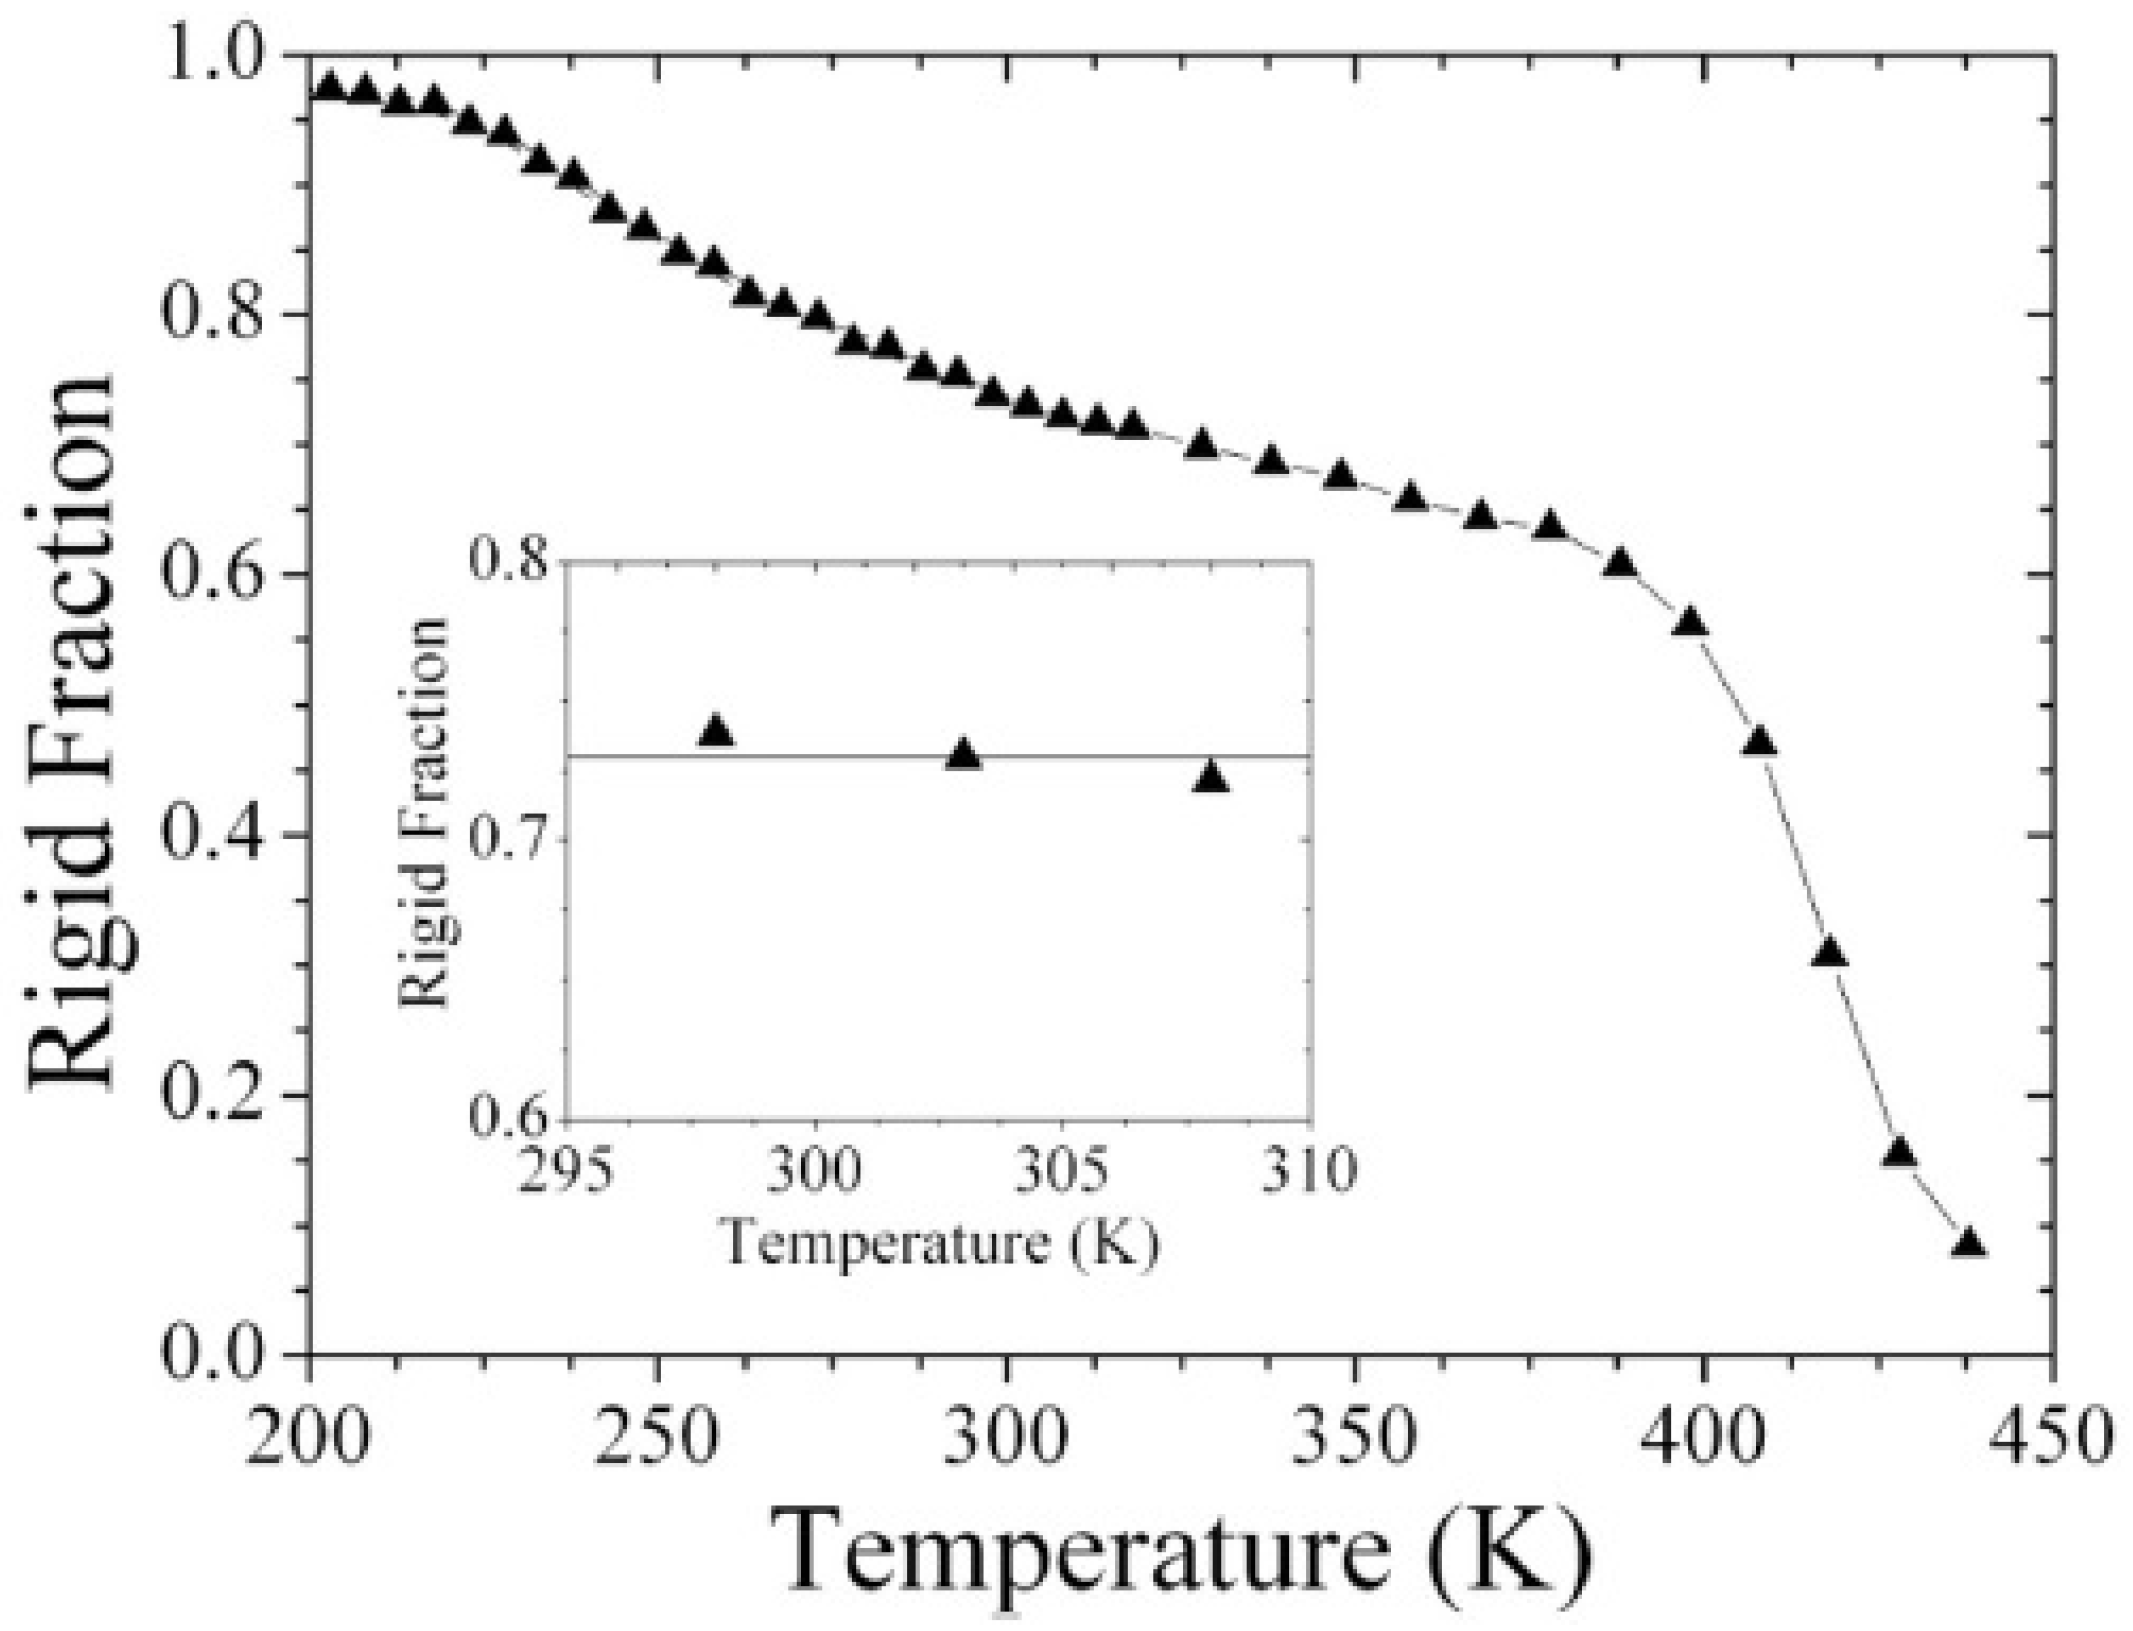
Figure 10.
Constructed correlation function for polybutadiene (PB) with a molecular weight of 87 kDa. The analytical results obtained by the experimental InDQ had been shifted according to the time–temperature superposition principle (TTS) principles, converting τDQ into t/τe by division with the theoretical τe from literature (Reprinted with permission from reference [60]. Copyright 2011 American Chemical Society).

Figure 11.
Vulcanized polybutadiene and polyisoprene crosslink density measured by both equilibrium swelling and MQ TD-NMR (arrow indicates increasing cure time). The good correlation between the two methods is indicated by the linear fitting, creating the so-called masterline. The non-zero intercepts indicate the contribution of entanglements to the NMR signal (Reprinted with permission from reference [67]. Copyright 2015 Wiley).

Figure 12.
Correlation between effective relaxation rate R2 and RDQ for sulfur- and peroxide-cured EP(D)M samples (Reprinted with permission from reference [70]. Copyright 2011 American Chemical Society).
Figure 12.
Correlation between effective relaxation rate R2 and RDQ for sulfur- and peroxide-cured EP(D)M samples (Reprinted with permission from reference [70]. Copyright 2011 American Chemical Society).

Figure 13.
Crosslinking density (a) and relative distribution width of the average Dres value (b) of various concentrations of DPTT (dipentamethylenethiuram tetrasulfide) and peroxide in natural rubber in three states: pre-vulcanization in latex state, dried film and post-vulcanization of the film itself (Reprinted with permission from reference [71]. Copyright 2012 American Chemical Society).

Figure 14.
Rubber rigid fraction at 313 K as a function of filler volume fraction for three vulcanized samples of SBR (styrene-butadiene rubber): loaded with silica (SiO2) particles with aspect ratio one (diamonds), loaded with SiO2 particles with aspect ratio two (squares) and loaded with SiO2 particles with aspect ratio five (circles) (Reprinted with permission from reference [79]. Copyright 2015 Royal Society of Chemistry).

Figure 15.
(a) T2 as a function of temperature for reported styrene-b-ethylene-co-butylene-b-styrene (SEBS) samples, measured by Hahn echo (HE), for both a sample with high butylene content and a low butylene content. The three different temperature dependence regions are separated with vertical lines. (b) Distributions of residual dipolar couplings obtained with MQ measurements at 353 K (Reprinted with permission from reference [82]. Copyright 2018 MDPI).

Figure 16.
DQ (a) and MAPE (b) spin diffusion data for PCL (at 27 °C), exhibiting non-symmetric time evolution of the interphase magnetization. The dashed lines are from simulations based upon simple 1D model of diffusion, well representing the evolution for the DQ-filtered magnetization, but less accuracy for the MAPE (Reprinted with permission from reference [84]. Copyright 2014 Springer).

Figure 17.
Relaxation profiles of T1 (full squares) and T2 (empty circles) against pH for Cu2+-CHI solutions (a) and the supernatant after centrifugation of the aqueous solution (b). Solid lines are the sigmoidal fittings for the experimental data of the Cu2+-CHI solutions, while dotted lines are the fittings for free Cu2+ ions in solution (Reprinted with permission from reference [102]. Copyright 2017 Elsevier).

Figure 18.
Effect of aging processes onto NMR parameters. (a) Increase of crosslinking density, determined with MQ, with time of NBR rubbers exposed to air, base oil and full oil (Reprinted with permission from reference [103]. Copyright 2018 Elsevier). (b) Variation of the proton effective relaxation times with depth for a non-stabilized PA12 at increasing thermal-aging time (Reprinted with permission from reference [106]. Copyright 2016 Elsevier). (c) Temperature-induced morphology changes, quantified with the proton effective relaxation time, for different PE grades (Reprinted with permission from reference [107]. Copyright 2018 Wiley-VCH).

Figure 19.
Evolution of FID-MSE signals of a biodiesel mixture, from pure fuel (zero days) and after the immersion of CB-filled vulcanized NR (Reprinted with permission from reference [108]. Copyright 2016 Elsevier).
Figure 19.
Evolution of FID-MSE signals of a biodiesel mixture, from pure fuel (zero days) and after the immersion of CB-filled vulcanized NR (Reprinted with permission from reference [108]. Copyright 2016 Elsevier).

Figure 20.
T2 relaxation time, measured with solid echo, versus % proton fraction of different polyurethane samples. No correlation is detected between the two variables (Reprinted with permission from reference [111]. Copyright 2013 Royal Society of Chemistry).
Figure 20.
T2 relaxation time, measured with solid echo, versus % proton fraction of different polyurethane samples. No correlation is detected between the two variables (Reprinted with permission from reference [111]. Copyright 2013 Royal Society of Chemistry).

Figure 21.
Connection of NMR parameters to chemical or physical properties. (a) T2 distributions (at 30 °C) have been found varying according to the composition of a rubbery component, such as SBS, in a thermoplastic matrix, such as PS. The experimental distribution can be described as a superposition of the relaxation of the neat components (Reprinted with permission from reference [114]. Copyright 2007 Elsevier). (b) Correlation between the stretching exponent b of the fitting function for T2 and the strain at break, showing a kink that has been attributed to a decreasing benefit of heterogeneity (b < 0.9) (Reprinted with permission from reference [114]. Copyright 2007 Elsevier). (c) Variation of the foam recovery time as a function of T2 for the soft component in PU foams (Reprinted with permission from reference [116]. Copyright 2015 Elsevier).

Figure 22.
Cure kinetics curves for an epoxy resin as obtained by different experimental approaches at 40 °C: DSC, NMR, and rheology (Reprinted with permission from reference [75]. Copyright 2015 Wiley Periodicals).
Figure 22.
Cure kinetics curves for an epoxy resin as obtained by different experimental approaches at 40 °C: DSC, NMR, and rheology (Reprinted with permission from reference [75]. Copyright 2015 Wiley Periodicals).

© 2019 by the authors. Licensee MDPI, Basel, Switzerland. This article is an open access article distributed under the terms and conditions of the Creative Commons Attribution (CC BY) license (http://creativecommons.org/licenses/by/4.0/).
Share and Cite
MDPI and ACS Style
Besghini, D.; Mauri, M.; Simonutti, R. Time Domain NMR in Polymer Science: From the Laboratory to the Industry. Appl. Sci. 2019, 9, 1801. https://doi.org/10.3390/app9091801
AMA Style
Besghini D, Mauri M, Simonutti R. Time Domain NMR in Polymer Science: From the Laboratory to the Industry. Applied Sciences. 2019; 9(9):1801. https://doi.org/10.3390/app9091801
Chicago/Turabian StyleBesghini, Denise, Michele Mauri, and Roberto Simonutti. 2019. "Time Domain NMR in Polymer Science: From the Laboratory to the Industry" Applied Sciences 9, no. 9: 1801. https://doi.org/10.3390/app9091801
Note that from the first issue of 2016, this journal uses article numbers instead of page numbers. See further details here.