In-Situ Observation of Adhesion Behavior During Ultrasonic Al Ribbon Bonding

1
Joining and Welding Research Institute, Osaka University, 11-1, Mihogaoka, Ibaraki, Osaka 567-0047, Japan
2
Graduate School of Engineering, Osaka University, 2-1, Yamadaoka, Suita, Osaka 567-0047, Japan
*
Author to whom correspondence should be addressed.
Appl. Sci. 2019, 9(9), 1835; https://doi.org/10.3390/app9091835
Submission received: 9 April 2019
/
Revised: 28 April 2019
/
Accepted: 28 April 2019
/
Published: 3 May 2019
(This article belongs to the Special Issue Selected Papers from the NMJ2018)
Abstract
:In-situ observation was performed on a transparent silica substrate during ultrasonic Al ribbon bonding, using a high-speed video camera with differing frame rates, 104 fps and 103 fps, to clarify the adhesion behavior. The bonding process was observed as follows. Initially, friction slip occurred, producing multiple island streaks in the direction parallel to the ultrasonic vibration. The island streaks were formed as a scratch, due to surface waviness of the Al ribbon. Momentarily, a belt-shaped bond zone was formed at the center, normally due to the ultrasonic vibration. The island streaks could be clearly observed at 104 fps. However, the central belt zone was unclear and appeared translucent at 104 fps; although it was clear when observed at 103 fps. The island streaks were unclear at 103 fps. The positional relation of the island streaks and the central belt zone was confirmed from in-situ observation results of a twist and peel test of Al ribbon bonded to silica substrate. The central belt zone was between the island streaks and the silica substrate.
1. Introduction
Solid state ultrasonic bonding renders it possible to bond similar and dissimilar materials directly and within a short duration [1,2,3,4,5,6]. Al ribbon bonding is applied to power electronics packaging as well as to Al wire bonding [1,6,7,8]. Various studies of solid state ultrasonic microjoining have been reported [1,7,8,9,10,11,12,13,14,15,16,17,18,19,20,21,22,23,24,25]. The dominant mechanism consists of friction slip, plastic deformation, frictional heating and interfacial reaction (interdiffusion) [9,10,11,12,13,14,22]. These mechanism elements influence each other; additionally, their contributions are changed by the bonding conditions (bonding force, Fb, and ultrasonic power, Pu) [1,3,9,10,11,12,13,16,17,18]. Frictional heating can soften materials when microjoining; however, the softening effect cannot be attributed to frictional heating alone [13,21]. The increase in frictional force (shear force) in a direction parallel to the bonding interface contributes to the softening effect [1,21,23,24,25], as it is related to frictional slip and interfacial adhesion.
Numerous on-line measurements and in-situ observations of temperature [3,10,18,21], interfacial frictional force (power) [9,21,23,24,25,26,27], frictional slip (relative motion) at the bonding interface [3,9,23,24,28], ultrasonic vibration [21,28,29,30], deformation behavior [29,31], contact resistance [32], and electrical signals from ultrasonic generators [33] during ultrasonic bonding have been performed. The on-line measurements and in-situ observations are extremely useful and informative for comprehension of ultrasonic microjoining. Because the bonding interface is typically invisible, it is not simple to directly observe the bonding interface during the bonding process. Therefore, in general, off-line observations of the bonded interface have been implemented [1,2,11,12,14,15,17,19,22,28]; in lieu of this, numerical analyses of bonding processes have been performed [4,13,18,34,35,36,37,38,39]. A few studies of the direct observation have been reported for Al wire bonding [1,29] and Al ribbon bonding [1]; however, these are insufficient for understanding the ultrasonic bonding process.
If the bonding condition is appropriate, the general bonding process is as follows. Immediately after ultrasonic vibration is introduced in a direction parallel to the bonding interface, the friction slip occurs initially. The surface oxide film is scrubbed by the ultrasonic vibration and locally broken [16,22]. Then, the clean metallic surface is locally created, that is, local adhesion is produced. The local adhesion indicates that the friction coefficient at the bonding interface increases, that is, an increase in the shear force [13,21,23,24,25,26]. Shear stress is a component of equivalent stress which is the driving force behind plastic deformation [34,35,36,39]. The rate sensitive bonding materials are easily deformed by the enhanced equivalent stress, causing the softening effect. The uniaxial yield stress normal to the bonding interface apparently decreases [16,31]. In ball (or wedge wire) bonding, the side surface can be folded to the substrate due to the plastic deformation facilitated by the softening effect. The apparent bonded (or contact) area grows to the peripheral area. This is the fold mechanism which is redefined as the macro fold mechanism in the present paper. The sequence mechanism from friction slip to fold was defined as “slip and fold mechanism” in a previous paper [1]. Some microslips occur at the peripheral bond area after the macro fold is complete [11,12].
As the shape of the ribbon is roughly flat, compared with that of Au ball and Al wire, the ribbon bonding exhibits a different mode from ball (or wire) bonding. The macro fold mechanism works easily and the apparent contact width rapidly increases in Al ribbon bonding. Then, numerous strips (island streaks) are formed in a direction parallel to the ultrasonic vibration; additionally, a belt-shaped bond-area (belt zone) is formed at the central bonded area normal to the direction of ultrasonic vibration. However, the adhesion behavior cannot be clearly explained using only slip and the macro fold mechanism. Therefore, in the present study, the in-situ observation of the interfacial adhering process during the ultrasonic bonding between Al ribbon and transparent silica (crystal glass) substrate is performed using a high-speed video camera with frame rates of 104 fps or 103 fps. The bonding interface can be observed directly, using a transparent silica substrate. The adhering process is discussed, comparing the results observed at 104 fps with those of 103 fps. The purpose of the present study is to understand the interfacial adhesion behavior during ultrasonic Al ribbon bonding. Furthermore, the complex adhesion behavior is discussed through the theoretical idea of the common bonding mechanism, consisting of friction slip, plastic deformation, and interfacial material reaction.
2. Experimental Procedures
Annealed pure aluminum ribbon made by Tanaka Denshi Kogyo, Japan was used in the present study. The purity was 99.99 mass%. The width and thickness were 1.0 mm and 0.20 mm, respectively. The surface roughness of the Al ribbon was measured using a stylus profilometer made by Kosaka Laboratory Limited (Ltd.), Japan. Because the surface roughness of the silica substrate was significantly lower than that of Al ribbon surface, the surface roughness of the silica substrate was ignored when local contact behavior was examined.
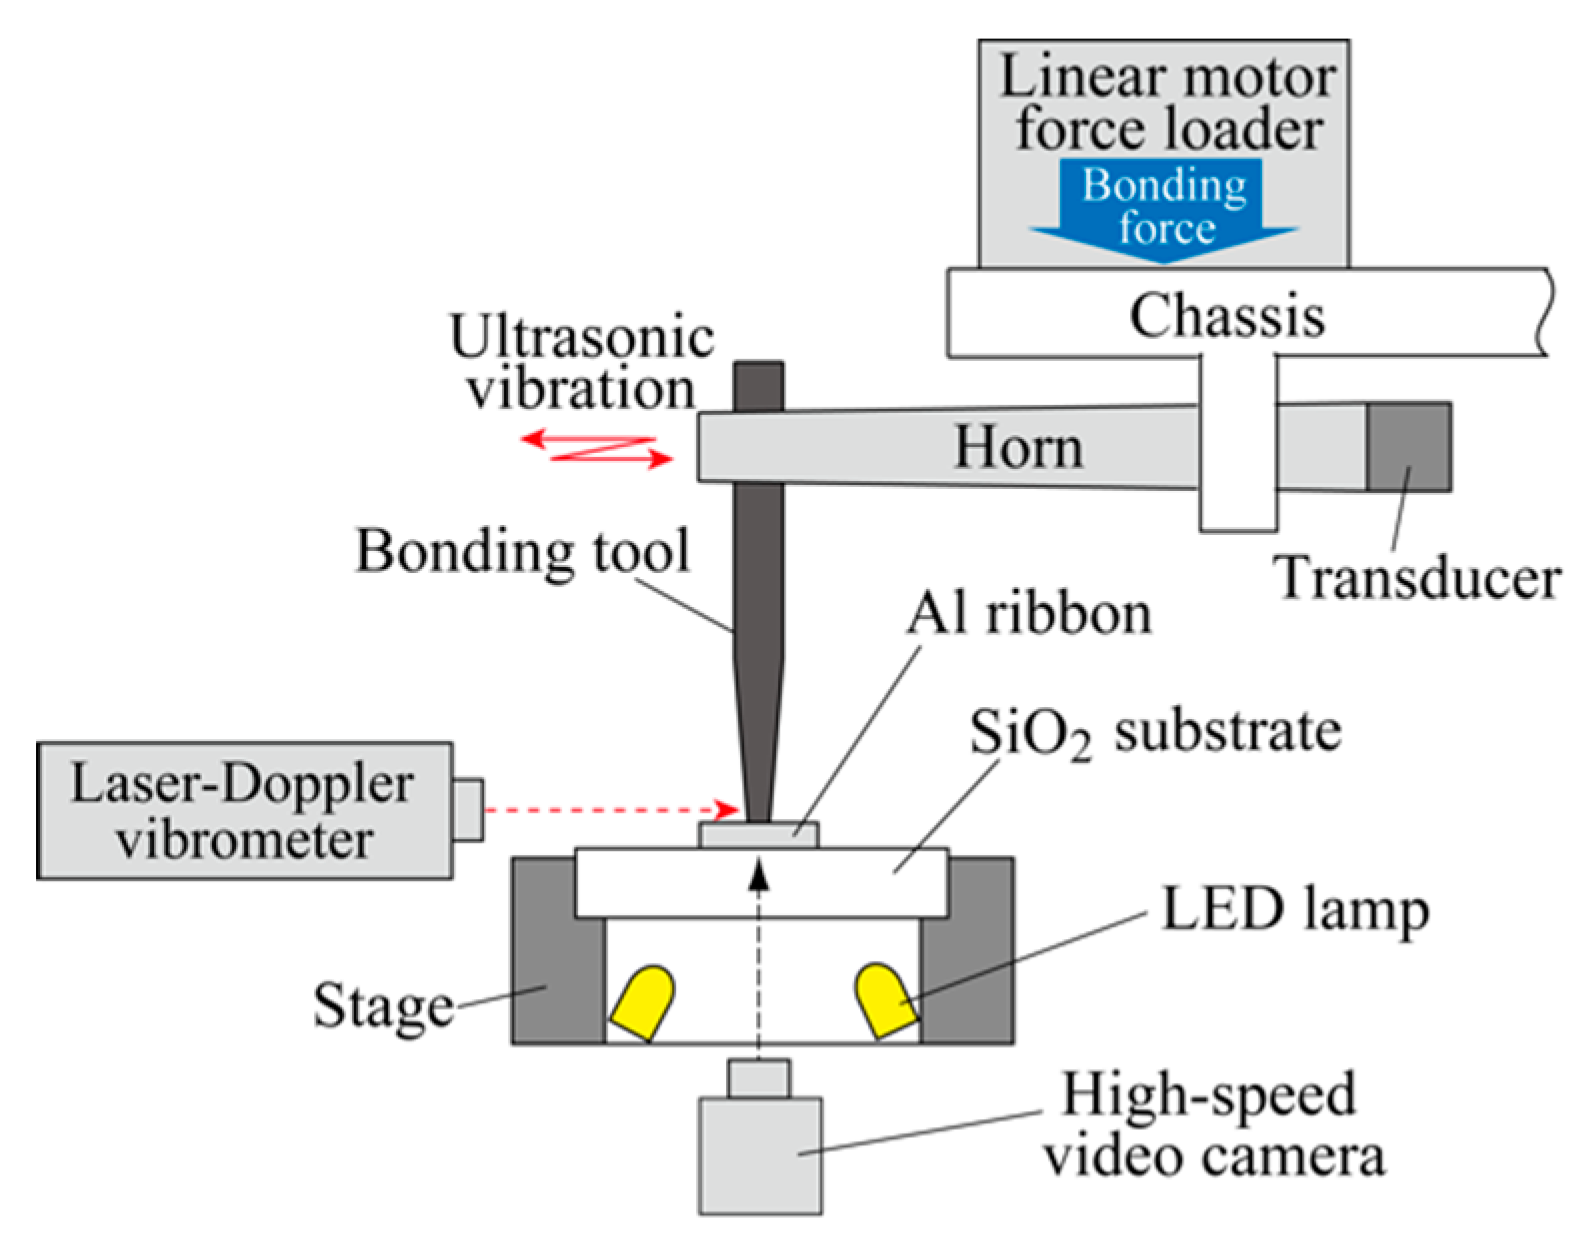
Figure 1 is a schematic illustration of the ultrasonic bonding apparatus and measuring system. The bonding tests were performed at room temperature (about 298 K). The ultrasonic frequency used was 60 kHz. The bonding force, Fb, was 7 N and the ultrasonic power, Pu, was 3 W or 4 W. A flat bonding tool was used. The chuck width was 250 µm and the maximum surface roughness of the flat chuck-face was about 0.5 µm. A very simple bonding sequence was adopted. Initially, the bonding force was applied to the ribbon. The ribbon was kept pressed on the substrate for 400 ms to damp the vibration generated by the impact of the bonding force. Then, the ultrasonic vibration was applied for 400 ms, parallel to the longitudinal direction of the Al ribbon. Finally, the bonding force was unloaded at 400 ms after stopping the ultrasonic vibration. The vibration of the tool top was measured by a laser Doppler vibrometer produced by PI-Polytec Ltd., Japan. The sampling rate was 2.56 MHz. The bonding interface image was obtained from the back of the silica substrate, using the high-speed video camera made by Nac Image Technology Ltd., Japan. The frame rate, Frate, was set at 103 or 104 fps. The shutter speeds in Frate = 103 and 104 fps were 1 ms and 5 µs, respectively. The bonding interface was illuminated with a light emitting diode (LED) ring lamps. Illumination using a spot laser pointer with a wavelength of 650 nm was added to the LED lamps, allowing for the adhesion behavior to be observed clearly at a high speed of 104 fps. The correlation coefficients, r, of pixel gray scale intensities, z (i, j), were calculated for examination of the image-matching between video captures and still images, where (i, j) was the pixel position of digital images [3,24].
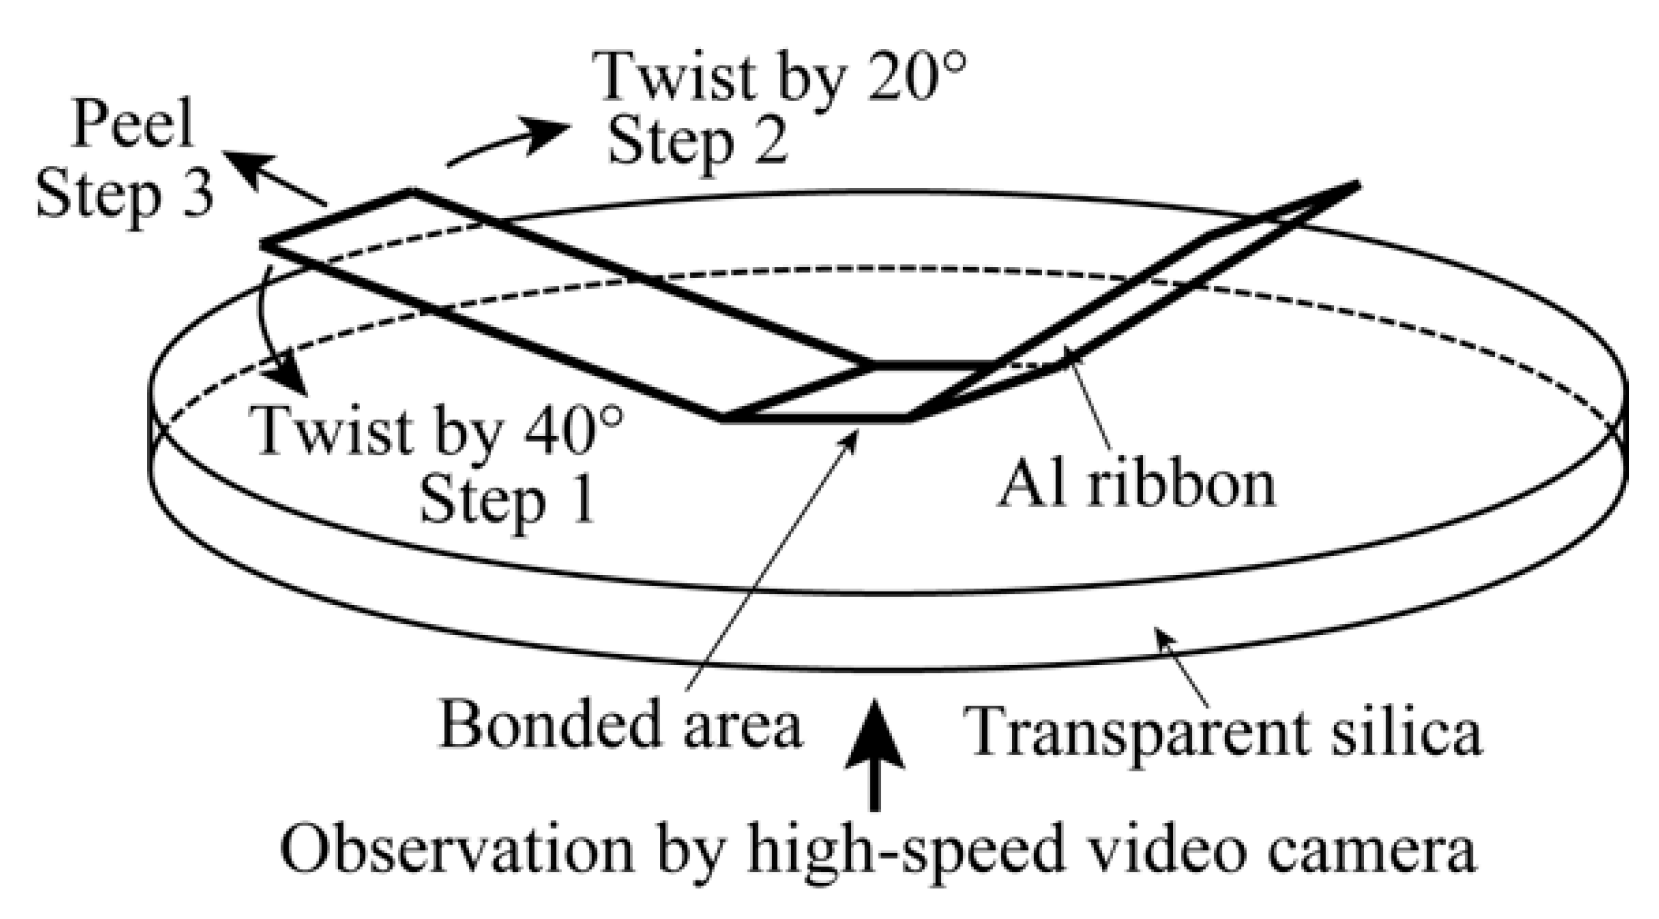
If simple peel tests were carried out [14], the fracture occurred on the Al ribbon (or the plug fracture). In the present study, a twist and peel test was performed manually allowing the fracture to occur on the bonded interface. As illustrated in Figure 2, the end of the Al ribbon was twisted by 40° in step 1, applying a poor peeling tensile force. In step 2, it was twisted by 20° in the reverse direction and a poor tensile force was applied manually. As a next step, the tensile force was increased and the Al ribbon was peeled along the surface of the silica substrate in step 3. The bonded interface during the twist and peel test was recorded through the high-speed video camera at Frate = 103 fps. The aim of the twist and peel test was to understand the origin of the interfacial fracture as well as to confirm the positional relation of the island streak and central belt zone in the direction normal to the bonding interface.
3. Results
3.1. Behavior of Ultrasonic Vibration Amplitude
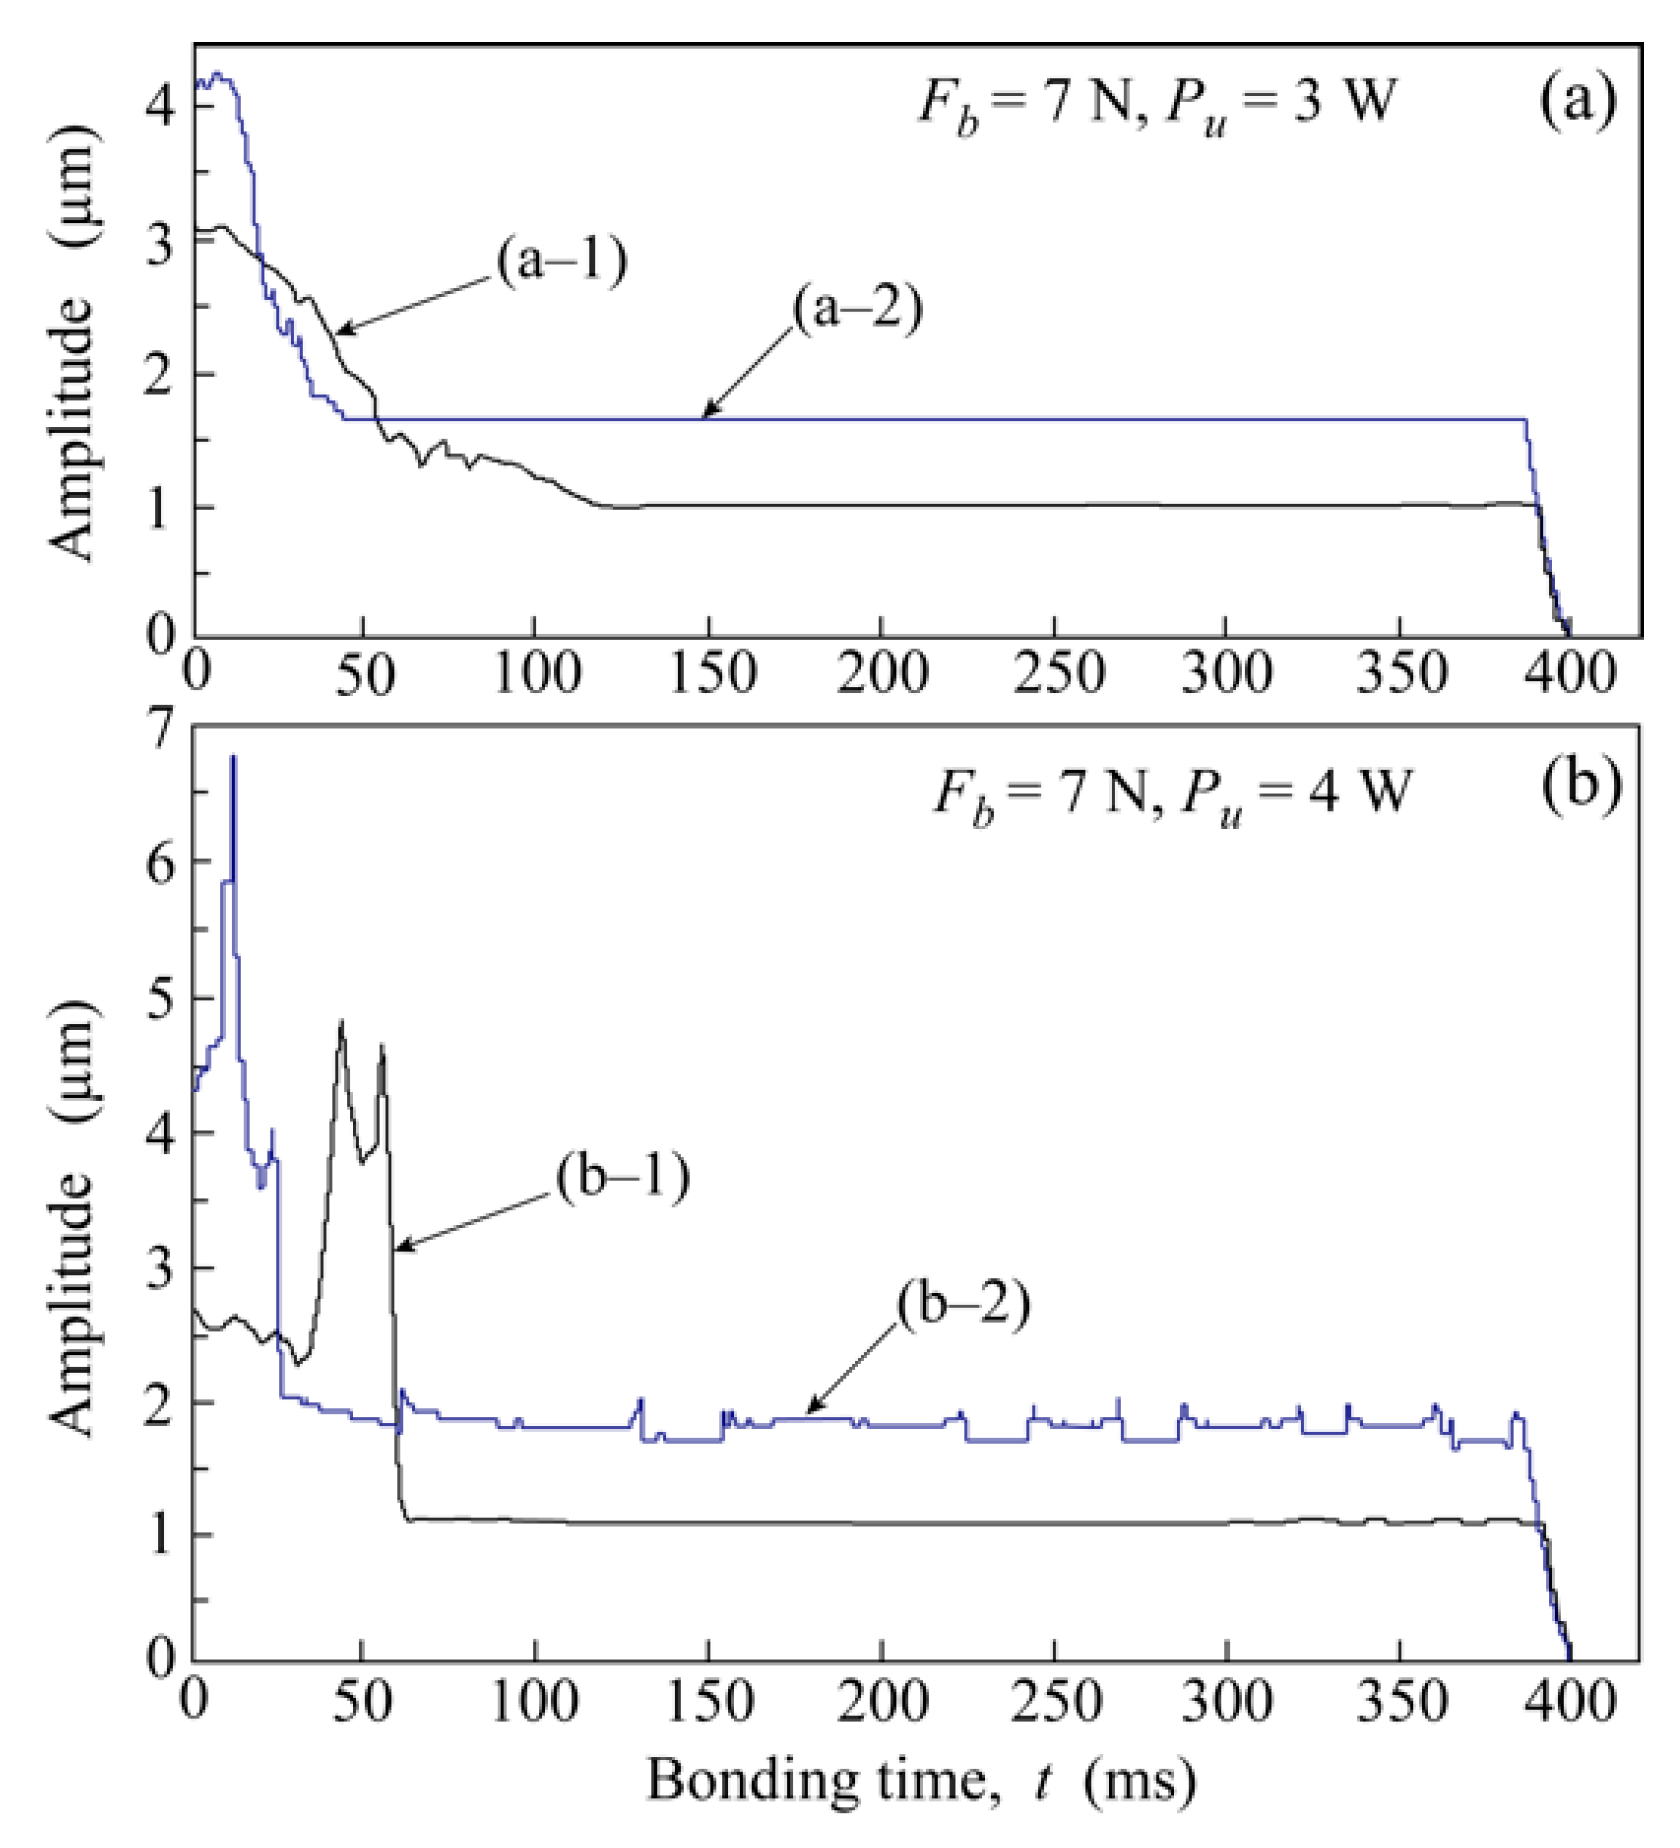
Figure 3 shows the changes in the vibration amplitude of the tool head during the ultrasonic bonding. These were measured simultaneously with the in-situ observation of the bonding interface. The vibration amplitude exhibited different transient behavior in each ultrasonic bonding test. The amplitude became larger as the ultrasonic power was increased, under identical load conditions. Different transient behavior was derived from the curved and bent shape components of the Al ribbon. The amplitude always changed with time at the early stage of bonding; however, it decreased gradually and became constant with saturated values. The slip mode at the interface between the tool head and the upper surface of the Al ribbon could have caused the difference in the transient behavior.
3.2. In-Situ Observation of Adhesion Behavior Obtained at a Frame Rate of 104 fps
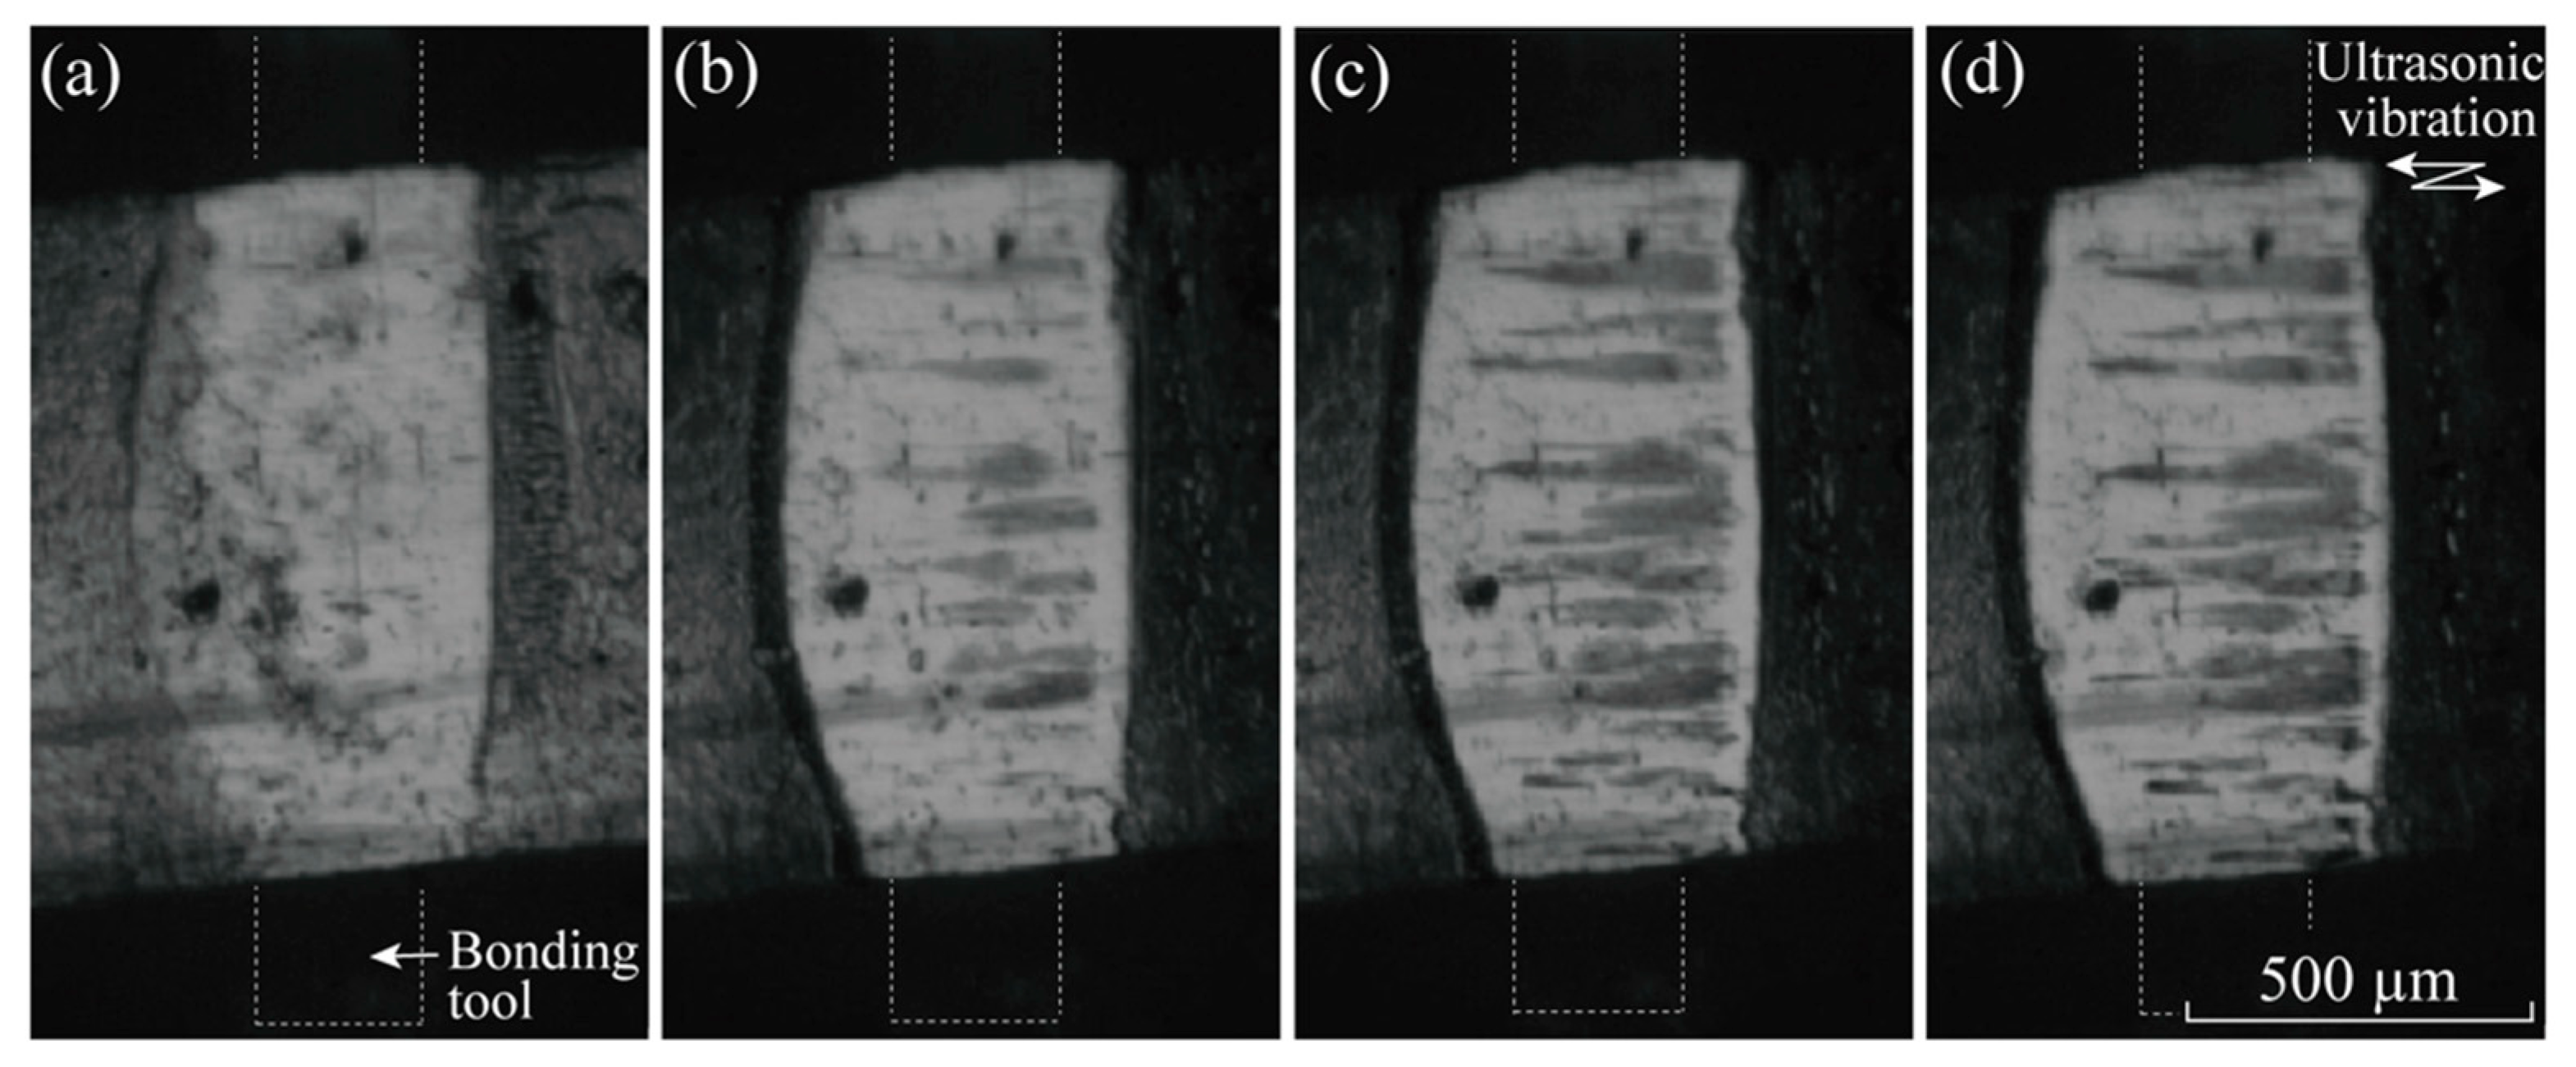
Figure 4 shows the change in the video captures obtained at Frate = 104 fps with the bonding time, t, under the bonding condition of Fb = 7 N and Pu = 3 W. Long slip marks due to initial ribbon shaking are observed in Figure 4a. 10–20 ms was required for the macro folding to complete. The apparent bonded width achieved was twice the tool width; however, the overall (apparent) bonded area does not widen after t = 20 ms. The striped pattern consisting of several island streaks was clearly observed at t = 30–50 ms, as shown in Figure 4b. The slip motion was observed even at the central area. The island streaks were dark gray and became longer with time. The number of islands increased; however, it did not appear to be copious. The appearance of the striped pattern did not change after t = 100 ms. The slip motion was scarcely observed at t > 100 ms. Both sides of the contact area appeared to repeat a touch and detach motion. No central belt zone was observed in the captures in Figure 4; however, something similar to a belt zone was vaguely observed in the video at t > 100 ms and it appeared translucent, approaching transparency.
Figure 5 shows the surface roughness along the width of the Al ribbon and the video capture at t = 100 ms in Figure 4. Figure 5a shows the surface roughness measured, without the cut-off [14]. Figure 5b,c are the profiles after removing the wavelengths less than 10 µm and 50 µm, respectively. Figure 5c expresses the surface waviness in the transverse direction of the Al ribbon. The wavelength was roughly 120 µm. The interval between the island streaks was about 60 to 140 µm as shown in Figure 5d. The initial contact of Al ribbon on the silica surface was locally formed at the high peaks of the Al surface waviness. The island streaks were produced as a long footprint, at the interface between Al and silica. The peaks with a shorter wavelength, as shown in Figure 5b, had to be placed in contact with the silica sequentially in time. The footprints of the small peaks of surface roughness were not clearly captured by the high speed video camera.
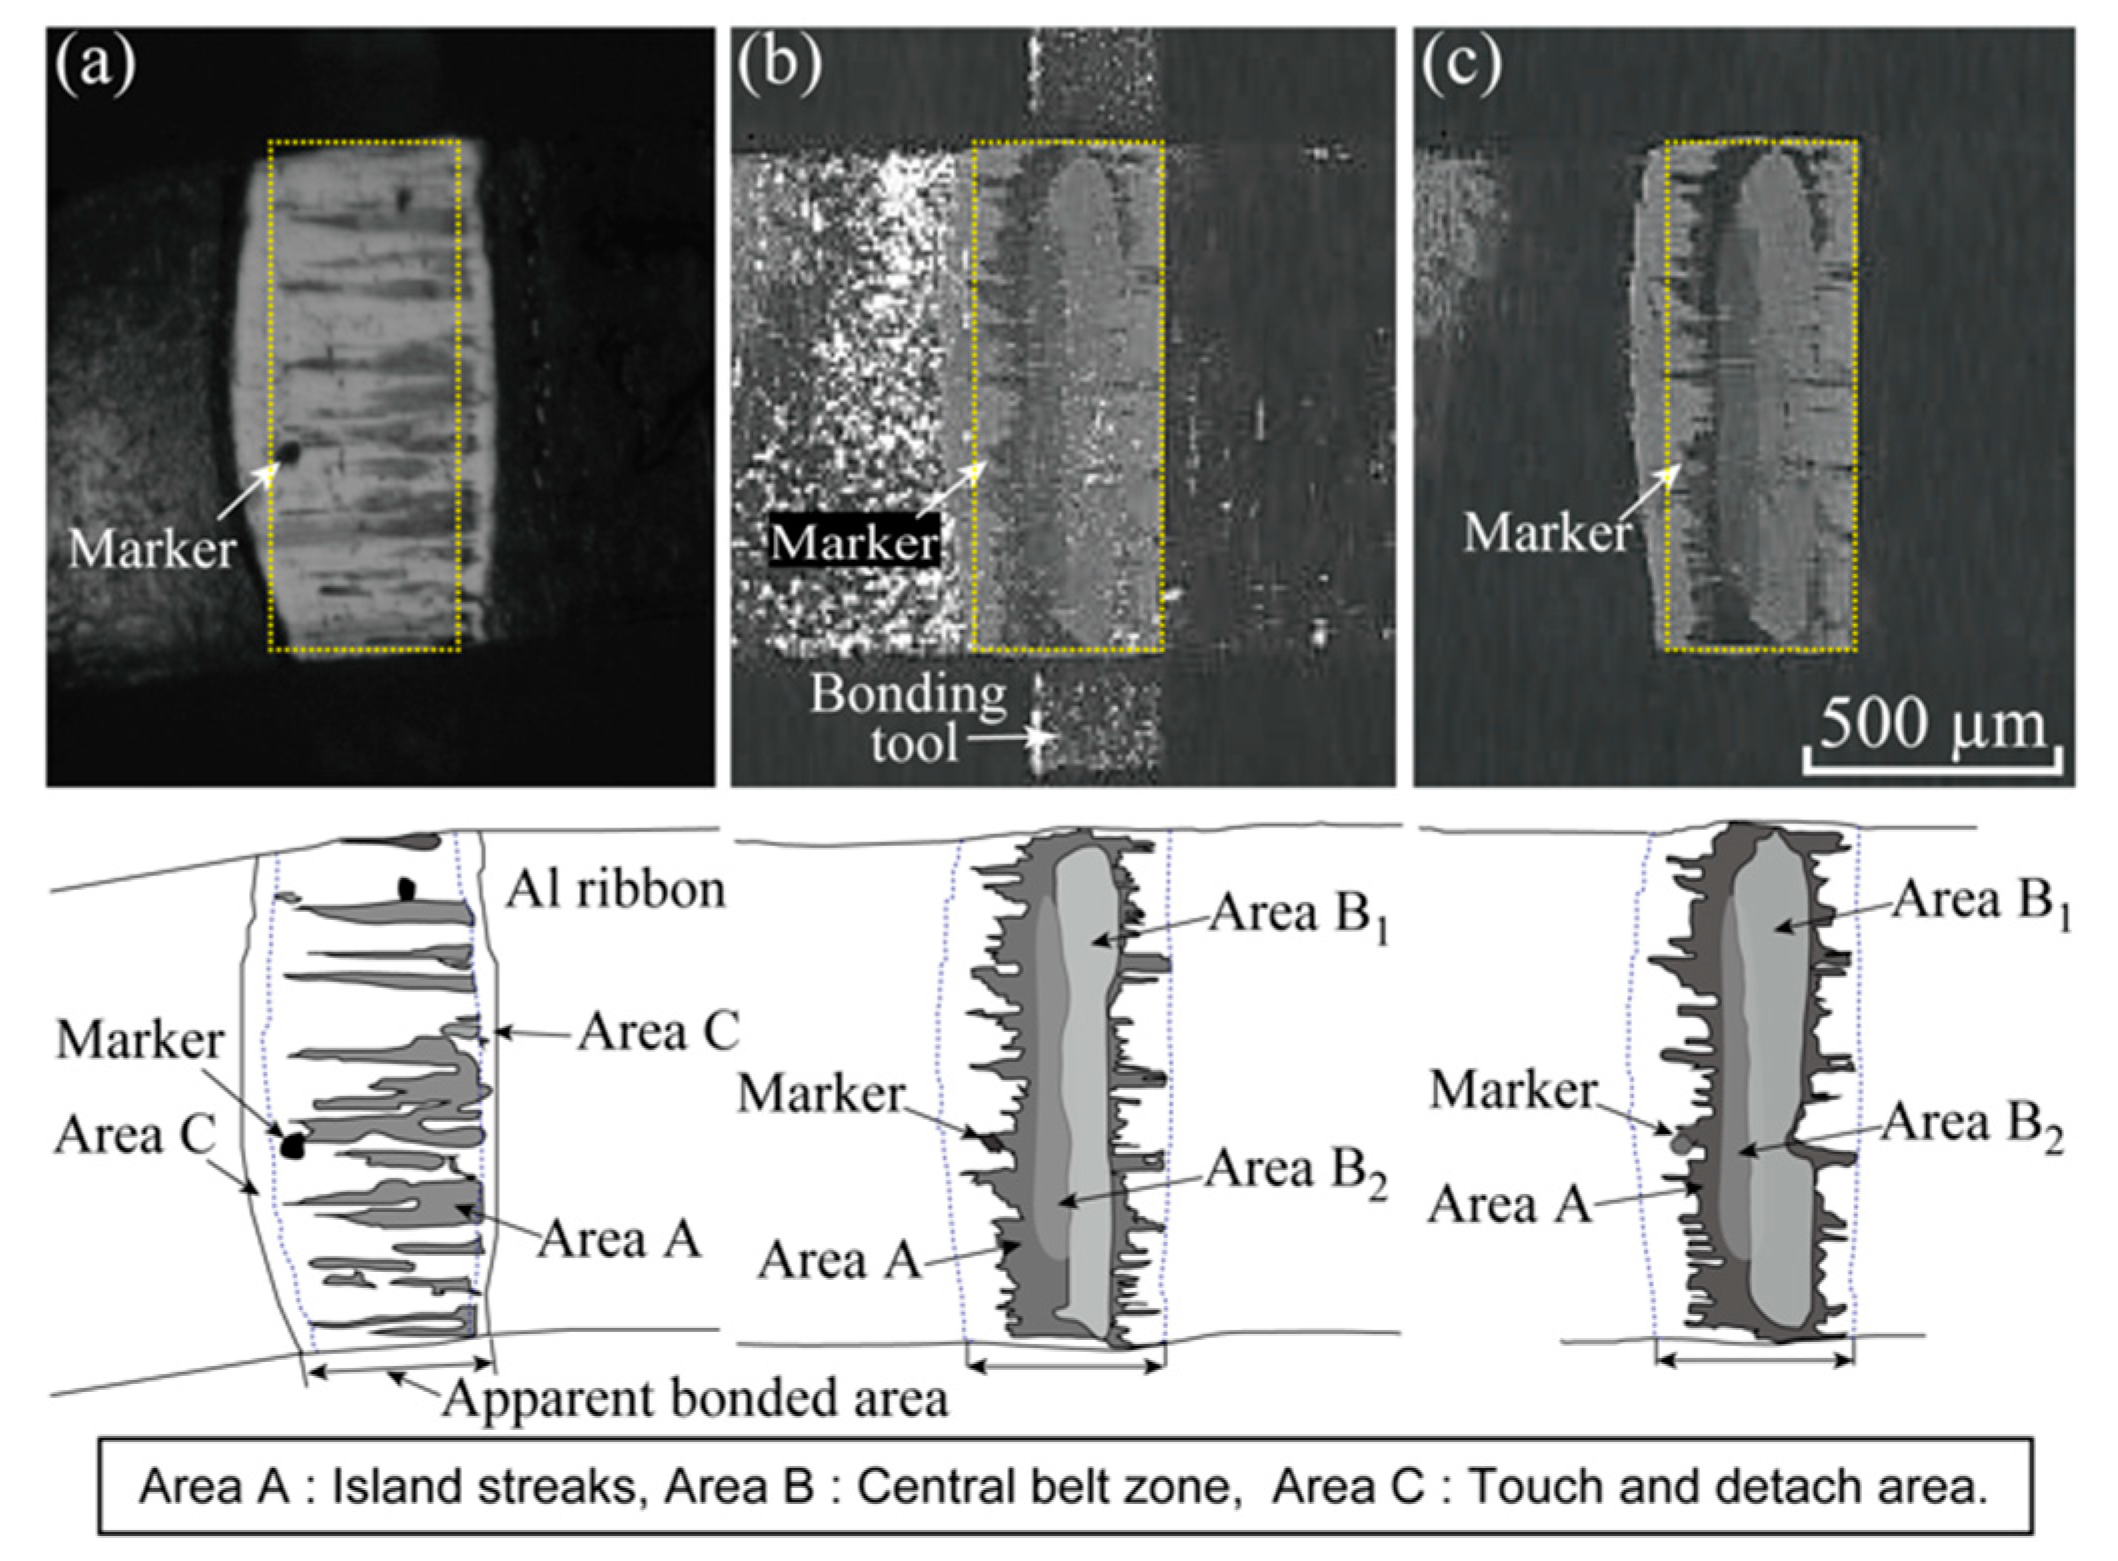
Figure 6 shows the comparison between the video image (a), immediately before bonding terminates, and two still images, (b) and (c), after bonding (cooling to the room temperature). The schematic drawings of each image are illustrated in the bottom portion of Figure 6. The illumination differs between Figure 6b,c. Areas A, B, and C are defined in the bottom portion of Figure 6. In the still images, Area B is divided into B1 and B2. A part of Area C is detached from the substrate when unloading Fb. The central belt zone is scarcely visible in image (a). However, the central belt zone is clearly observed in still images (b) and (c) captured at a low shutter speed of 1 ms. The correlation coefficients, r, are calculated between the digital images boxed by yellow dotted lines, as shown in Figure 6. The r-values are 0.17 between (a) and (b), 0.12 between (a) and (c), and 0.67 between (b) and (c). The Al ribbon in image (a) leans slightly to the left; however, the image (a) is not treated with angularity correction. Central belt zones are not observed and all island streaks are not always visible in the image (a). Therefore, the r-values become very low between video captures and still images. It is also determined from the r-value between images (b) and (c) that the illumination influences the appearance of the bonded interface.
Figure 7 shows the video captured at Frate = 104 fps under the bonding condition of Fb = 7 N and Pu = 4 W. The macro fold appears to be complete by t = 8–10 ms. The island streaks appeared clearly at t = 35 ms after the macro fold terminated, as shown in Figure 6b, and increased as shown in Figure 7c; the friction slip occurred after the macro fold was complete. The island streaks combined with one another. The central belt zone began to appear at approximately t = 50 ms; however, it appeared to be translucent. The island streaks became longer and thickened gradually at t = 100 ms as seen in Figure 7c,d. The island streaks gradually became difficult to observe at the central area. The apparent bonded area widened slightly in the period from t = 10 ms to 100 ms; however, it was noticeably constant after t = 100 ms. The friction slip became extremely small at t > 100 ms; however, a perfect stick was not achieved in all areas, that is, micro or nano slip was implied to continue, even in the later stage (t > 100 ms). The belt zone must have been very thin, although the thickness was not measured.
3.3. In-Situ Observation of Adhesion Behavior Captured at a Frame Rate of 103 fps
Figure 9 shows the in-situ observation results captured at Frate = 103 fps under bright illumination conditions. The bonding condition was Fb = 7 N and Pu = 3 W. Under this shooting condition (at the shutter speed of 1 ms), the Al ribbon was brightly captured, as shown in Figure 9a, that is, reflected light was obtained from aluminum surface roughness. The apparent contact width became greater than that of the bonding tool at t = 1 ms. Local adhesion occurred due to large sliding and is followed by the macro folding at bonding initialization. The island streaks appeared at t = 5–10 ms; however, these were not clearly visible. Both of the uncontacted sides of the Al ribbon were warped (separated from the substrate). The central belt zone was observed at t = 50 ms and it became clear at t = 100 ms. The central portions of the island streaks appeared to be covered gradually with the belt zone at t > 50 ms.
Figure 10 shows the in-situ observation results captured under Fb = 7 N and Pu = 4 W. The apparent bonded width achieved three times the tool width at t = 5 ms, as shown in Figure 10c; however, the width decreased due to Al ribbon warping, as shown in Figure 10d. Several island streaks appeared at the central area at t = 5 ms; however, the stripes became unclear at t = 20 ms. The central belt zone was then observed, as shown in Figure 10f. Another belt zone appeared in the right-hand side of the central bond area, as shown in Figure 10g. A blackish gray area became visible around the central belt zone. This blackish area corresponded to be the peripheral part of the island streaks (Area A). Another gray area appeared outside of Area A, as shown in Figure 10f–h. This corresponded to be the peripheral bond area formed by the microslip mechanism [1,11,12] after the macro fold was complete. The touch and detach area (Area C) could not be detected at 103 fps. The peripheral bond area could contain the outermost touch and detach area.
3.4. In-Situ Observation of the Fracture Process in Twist and Peel Test
Figure 11 shows the video captures during the twist and peel test. The testing sequence is from (a) to (h) in Figure 11. It is important to observe the position and manner in which the fracture occurs, to confirm the positional relation of Areas A, B, and C. Area A is divided into A1 and A2 for explaining the fracture behavior. Area B is also classified into the three parts of B1, B2, and B3. Once the rotating force was applied in a clockwise direction, the lower side of B2 discolored to dark gray, as shown in Figure 11b. The upper side of A1 and the lower side of A2 were slightly blurry. A few white fine stripes appeared in C. Therefore, Areas A and C were not only in contact with the silica substrate but also experienced a chemical adhesion with the silica. The ribbon was observed rotating along the axis of a white area marked by the asterisk in Figure 11c. Area B1 did not rotate at all and stood on the silica substrate, although partially peeled from the silica side. Conversely, B2 and B3 rotated. The central part of Area A began to appear behind the original area of B2 and B3; it was observed clearly with twisting, as shown in Figure 11c,d. Figure 11d is the video captured upon twisting by 40° in the clockwise direction (step 1 is complete). Figure 11e is the video capture at the beginning of step 2. When the Al ribbon was twisted in a counterclockwise direction, a portion of Area A appeared clearly as blackish gray in the central area. The belt zone (B1, B2, and B3) existed in front of Area A. Both of B2 and B3 were behind B1. The final fracture due to peeling (step 3) occurred in the neighborhood marked by the asterisk. As shown in Figure 11g,h, a portion of B1 almost remained on the silica substrate and appeared white, even after fracture. The peripheral edge of B2 also remained on the silica side as a blackish gray marked as D, as observed in Figure 11g.
The fracture process was as follows. Initially, Area C was broken, followed by Area A, and eventually Areas B2 and B3. Finally, Area B1 was fractured. It was determined that the positional relation of each area in the direction normal to the bonded interface was Al ribbon/Area A/Areas B2 and B3/Area B1/silica substrate. The island streaks combined with one another; however, but Area A did not change to Area B. Area B was formed by the interfacial reaction between Area A and the silica substrate [14,22].
4. Discussion
Large shaking of Al ribbon usually occurs at the initialization of Al ribbon bonding. This often fluctuated, affected by the initial fixing situation. The bonding conditions of Fb = 7 N and Pu = 3 or 4 W adopted in the present study provide some fluctuation to the initial large sliding; however, these can provide stable bonding in the early, middle, and later stages [1,5,22,23,24,25,26,27,28,29,36]. The friction slip was the dominant mechanism in the early stage. Plastic deformation became predominant in the middle stage; however, the friction slip occurred because the island streaks increased. The central belt zone grew; the interfacial reaction occurred in the later stage.
Figure 12 illustrates the interfacial adhesion process in the ultrasonic bonding between the Al ribbon and transparent silica substrate. Immediately after large sliding, a few island streaks appeared as illustrated in Figure 12a. The number of island streaks increased and several islands combined with one another in Figure 12b. The central belt zone, B, was formed in the middle stage and widened to become B1 in Figure 12c. Area B2 was formed around B1 in Figure 12c. Area C was the touch and detach area. The peripheral bond area was between Area A and Area C even in the final stage. Areas B1 and B2 must consist of thin layers formed by some material reaction between Area A and the silica substrate [14,22,39,40,41,42].
Figure 13 illustrates the mechanisms of increasing adhesion area. Figure 13a expresses the cross section of the Al ribbon and silica substrate. The macro folding was primarily produced parallel to the direction of ultrasonic vibration. Even after the macro folding was complete, the apparent contact area had multiple small voids (or gaps) [16]. As illustrated in Figure 13b, blackish gray area were island streaks. Long voids existed between the island streaks. The voids were crushed by two mechanisms of microslipping (c) and microfolding (d) after the macro folding was complete. The voids between island streaks were required to shrink due to the microfold mechanism at the void tip. The island streaks combined with one another due to the microfold mechanism. This was the interfacial plastic deformation enhanced by ultrasonic power.
A mechanical alloying could be produced at the bonding interface by ultrasonic vibration [42,43,44]. It is necessary to microscopically analyze the interfacial reaction layers at the bonded interface [42,43,44,45]. It is also important to develop monitoring systems for measuring the change in ultrasonic vibration and interfacial shear force for ensuring the bonding process [3,21,22,23,24,25,26,27,28,46,47], because the bonding interface is not always directly observed. Furthermore, fundamental studies of adhesion would be necessary to understand the adhering processes [40,41,42,48,49]. Multiple problems remain which are yet to be solved for full comprehension of the adhesion behaviors [1,16,50].
5. Conclusions
The interfacial adhesion behavior during ultrasonic bonding between an Al ribbon and transparent silica substrate has been discussed based on the in-situ observation results, using a high-speed video camera with the different frame rates of 104 fps and 103 fps. The bonded area has been classified into four parts: the island streaks, the central belt zone, the peripheral bond area, and the outermost touch and detach area. The morphologies and the appearances of each bonded area appeared to be different and affected by the frame rate and illumination (luminous intensity); however, the essential qualities of each area were identified by analyzing the in-situ observation results. The primary results obtained are as follows:
- (1)
- Immediately after introducing the ultrasonic vibration, the ribbon was largely shaken, that is, a large friction slide occurred. Initial poor adhesion was locally produced. Macro-folding arose and the apparent contact width increased.
- (2)
- The island streaks were clearly observed at 104 fps. Conversely, the central belt zone looked translucent at 104 fps; although it was clear when observed at 103 fps. The island streaks were unclear at 103 fps.
- (3)
- The island streaks were formed as a footprint derived from the Al surface waviness. The island streaks grew long and parallel to the direction of ultrasonic vibration.
- (4)
- The central belt zone was formed, normal to the direction of ultrasonic vibration. The island streaks did not change into the central belt zone. The central belt zone was clearly captured at 103 fps.
- (5)
- The central belt zone remained on the silica side after fracture in the twist and peel test.
- (6)
- The central belt zone was between the island streaks and the silica substrate. The central belt zone must be formed by the interfacial reaction.
- (7)
- Microslipping and microfolding mechanisms can occur in the ultrasonic bonding.
Author Contributions
Conceptualization, Y.T. (Yasuo Takahashi); Validation, Y.T. (Yasuo Takahashi), K.T., K.M.; Investigation, Y.T. (Yasuo Takahashi), K.T., K.M., Y.T. (Yusuke Takaoka); Writing—original draft preparation, Y.T. (Yasuo Takahashi); Writing—review and editing, Y.T. (Yasuo Takahashi).
Funding
This research received no external funding.
Conflicts of Interest
The authors declare no conflict of interest. The funders had no role in the design of the study, in the collection, analyses, or interpretation of data, in the writing of the manuscript, or in the decision to publish the results.
References
- Takahashi, Y.; Fukuda, H.; Yoneshima, Y.; Kitamura, H.; Maeda, M. Solid-state microjoining mechanisms of wire bonding and flip chip bonding. ASME J. Electron. Packag. 2017, 139, 041010-1–041010-13. [Google Scholar] [CrossRef]
- Higashi, Y.; Iwamoto, C.; Kawamura, Y. Microstructure evolution and mechanical properties of extruded Mg96Zn2Y2 alloy joints with ultrasonic spot welding. Mater. Sci. Eng. A 2016, 651, 925–934. [Google Scholar] [CrossRef]
- Sasaki, T.; Watanabe, T.; Hosokawa, Y.; Yanagisawa, A. Analysis for relative motion in ultrasonic welding of aluminium sheet. Sci. Technol. Weld. Join. 2013, 18, 19–24. [Google Scholar] [CrossRef]
- Li, H.; Cao, B.; Liu, J.; Yang, J. Modeling of high-power ultrasonic welding of Cu/Al joint. Inter. J. Adv. Manufac. Technol. 2018, 97, 833–844. [Google Scholar] [CrossRef]
- Geiβler, U.; Schneider-Ramelow, M.; Reichl, H. Hardening and softening in AlSi1 bond contacts during ultrasonic wire bonding. IEEE Trans. Compo. Packag. Technol. 2009, 32, 794–799. [Google Scholar] [CrossRef]
- Ni, Z.L.; Ye, F.X. Ultrasonic spot welding of aluminum alloys: A review. J. Manufac. Processes 2018, 35, 580–594. [Google Scholar] [CrossRef]
- Park, S.; Nagao, S.; Sugahara, T.; Suganuma, K. Mechanical stabilities of ultrasonic Al ribbon bonding on electroless nickel immersion gold finished Cu substrates. Jpn. J. Appl. Phys. 2014, 53, 04EP06-1–04EP06-6. [Google Scholar] [CrossRef]
- Nwanoro, K.C.; Lu, H.; Yin, C.; Bailey, C. An analysis of the reliability and design optimization of aluminium ribbon bonds in power electronics modules using computer simulation method. Microelectron. Reliab. 2018, 87, 1–14. [Google Scholar] [CrossRef]
- Schwizer, J.; Mayer, M.; Bolliger, D.; Paul, O.; Baltes, H. Thermosonic ball bonding: Friction model based on integrated microsensor measurements. In Proceedings of the 24th IEEE/CPMT Int’l Electronics Manufacturing Technology Symposium, Austin, TX, USA, 18–20 October 1999; pp. 108–114. [Google Scholar] [CrossRef]
- Mayer, M.; Paul, O.; Bolliger, D.; Baltes, H. Integrated temperature microsensors for characterization and optimization of thermosonic ball bonding process. IEEE Trans. Compo. Packag. Technol. 2000, 23, 393–398. [Google Scholar] [CrossRef]
- Lum, I.; Jung, J.P.; Zhou, Y. Bonding mechanism in ultrasonic gold ball bonds on copper substrate. Mettal. Mater. Trans. A 2005, 36A, 1279–1286. [Google Scholar] [CrossRef]
- Lum, I.; Mayer, M.; Zhou, Y. Footprint study of ultrasonic wedge-bonding with aluminum wire on copper substrate. J. Electron. Mater. 2006, 35, 433–442. [Google Scholar] [CrossRef] [Green Version]
- Takahashi, Y.; Suzuki, S.; Ohyama, Y.; Maeda, M. Numerical analysis of interfacial deformation and temperature rise during ultrasonic Al ribbon bonding. J. Phys. Conf. Ser. 2012, 379, 012028-1–012028-11. [Google Scholar] [CrossRef]
- Zhang, G.; Takahashi, Y.; Heng, Z.; Takashima, K.; Misawa, K. Ultrasonic weldability of Al ribbon to Cu sheet and the dissimilar joint formation mode. Mater. Trans. 2015, 56, 1842–1851. [Google Scholar] [CrossRef]
- Dohle, R.; Petzold, M.; Klengel, R.; Schulze, H.; Rudolf, F. Room temperature wedge-wedge ultrasonic bonding using aluminum coated copper wire. Microelectron. Reliab. 2011, 51, 97–106. [Google Scholar] [CrossRef]
- Long, Y.; Twiefel, J.; Wallaschek, J. A review on the mechanisms of ultrasonic wedge-wedge bonding. J. Mater. Process. Technol. 2017, 245, 241–258. [Google Scholar] [CrossRef]
- Zhou, Y.; Li, X.; Noolu, N.J. A footprint study of bond initiation in gold wire crescent bonding. IEEE Trans. Compon. Packag. Technol. 2005, 28, 810–816. [Google Scholar] [CrossRef]
- Mayer, M.; Zwart, A. Ultrasonic friction power in microelectronic wire bonding. Mater. Sci. Forum 2007, 539–543, 3920–3925. [Google Scholar] [CrossRef]
- Lee, J.; Mayer, M.; Zhou, Y.; Moon, J.T.; Persic, J. Influence of gold pick up on the hardness of copper free air ball. Microelectron. Reliab. 2011, 51, 30–37. [Google Scholar] [CrossRef]
- Sakamoto, S.; Yoneda, Y.; Yanagimoto, T.; Fujino, J.; Kikuchi, M. Development of direct Al/Cu lead terminal ultrasonic bonding technology for power semiconductor chips. J. Smart Process. Soc. Jpn. 2015, 4, 196–201. [Google Scholar] [CrossRef]
- Ando, M.; Maeda, M.; Takahashi, Y. Evolution of interfacial shear force during ultrasonic Al ribbon bonding. Mater. Trans. 2013, 54, 911–915. [Google Scholar] [CrossRef]
- Seppänen, H.; Kaskela, A.; Mustonen, K.; Oinonen, M.; Hæggström, E. Understanding ultrasound-induced aluminum oxide breakage during wire bonding. In Proceedings of the IEEE Ultrasonics Symposium, New York, NY, USA, 28–31 October 2007; pp. 1381–1384. [Google Scholar] [CrossRef]
- Gaul, H.; Schneider-Ramelow, M.; Reichl, H. Analysis of the friction processes in ultrasonic wedge/wedge-bonding. Microsyst. Technol. 2009, 15, 771–775. [Google Scholar] [CrossRef]
- Gaul, H.; Shah, A.; Mayer, M.; Zhou, Y.; Schneider-Ramelow, M.; Reichl, H. The ultrasonic wedge/wedge bonding process investigated using in situ real-time amplitudes from laser vibrometer and integrated force sensor. Microelectron. Eng. 2010, 87, 537–542. [Google Scholar] [CrossRef]
- Shah, A.; Mayer, M.; Qin, I.; Huynh, C.; Zhou, Y.; Meyer, M. Ultrasonic friction power during thermosonic Au and Cu ball bonding. J. Phys. D Appl. Phys. 2010, 43, 325301-1–325301-8. [Google Scholar] [CrossRef]
- Shah, H.; Gaul, M.; Schneider-Ramelow, M.; Reichl, H.; Mayer, M.; Zhou, Y. Ultrasonic friction power during Al wire wedge-wedge bonding. J. Appl. Phys. 2009, 106, 013503-1–013503-8. [Google Scholar] [CrossRef]
- Shah, A.; Rezvani, A.; Mayer, M.; Zhou, Y.; Persic, J.; Moon, J.T. Reduction of ultrasonic pad stress and aluminum splash in copper ball bonding. Microelectron. Reliab. 2011, 51, 67–74. [Google Scholar] [CrossRef]
- Sasaki, T.; Komiyama, K.; Pramudita, J.A. Influence of tool edge angle on the bondability of alminum in ultrasonic bonding. Mater. Process. Tech. 2018, 252, 167–175. [Google Scholar] [CrossRef]
- Maeda, M.; Yoneshima, Y.; Kitamura, H.; Yamane, K.; Takahashi, Y. Deformation behavior of thick aluminum wire during ultrasonic bonding. Mater. Trans. 2013, 54, 916–921. [Google Scholar] [CrossRef]
- Zhong, Z.W.; Goh, K.S. Investigation of ultrasonic vibrations of wire-bonding capillaries. Microelectron. J. 2006, 37, 107–113. [Google Scholar] [CrossRef]
- Shuto, T.; Asano, T. In situ observation of ultrasonic flip-chip bonding using high-speed camera. Jpn. J. Appl. Phys. 2015, 54, 030204-1–030204-5. [Google Scholar] [CrossRef]
- Seppänen, H.; Kurppa, R.; Meriläinen, A.; Hæggström, E. Real time contact resistance measurement to determine when microwelds start to form during ultrasonic wire bonding. Microelectron. Eng. 2013, 104, 114–119. [Google Scholar] [CrossRef]
- Feng, W.; Meng, Q.; Xie, Y.; Fan, H. Wire bonding quality monitoring via refining process of electrical signal from ultrasonic generator. Mech. Syst. Signal Proc. 2011, 25, 884–900. [Google Scholar] [CrossRef]
- He, J.; Guo, Y.; Lin, Z. Theoretical and numerical analysis of the effect of constant velocity on thermosonic bond strength. Microelectron. Reliab. 2008, 48, 594–601. [Google Scholar] [CrossRef]
- Takahashi, Y.; Shibamoto, S.; Inoue, K. Numerical analysis of the interfacial contact process in wire thermocompression bonding. IEEE Trans. Compon. Packag. Manuf. Technol. Part A 1996, 19, 213–223. [Google Scholar] [CrossRef]
- Takahashi, Y.; Inoue, M. Numerical study of wire bonding—Analysis of interfacial deformation between wire and pad. ASME J. Electron. Packag. 2002, 124, 27–36. [Google Scholar] [CrossRef]
- Hu, C.M.; Guo, N.; Du, H.; Li, W.H.; Chen, M. A microslip model of the bonding process in ultrasonic wire bonders, part I: Transient response. Int. J. Adv. Manuf. Technol. 2006, 29, 860–866. [Google Scholar] [CrossRef]
- Hu, C.M.; Guo, N.; Du, H.; Jian, X.M. A microslip model of the bonding process in ultrasonic wire bonders, part II: Steady state response. Int. J. Adv. Manuf. Technol. 2006, 29, 1134–1142. [Google Scholar] [CrossRef]
- He, J.; Guo, Y.; Lin, Z. Numerical and experimental analysis of thermosonic bond strength considering interfacial contact phenomena. J. Phys. D Appl. Phys. 2008, 41, 165304. [Google Scholar] [CrossRef]
- Takahashi, K.; Takahashi, Y.; Nishiguchi, K. A study about atomic interaction at the interfaces of transient-metal/ceramics. Trans. JWS 1993, 24, 70–73. [Google Scholar]
- Hong, T.; Smith, J.R.; Srolovitz, D.J. Theory of metal-ceramic adhesion. Acta Metall. Matter. 1995, 43, 2721–2730. [Google Scholar] [CrossRef]
- Matsuoka, S.; Imai, H. Direct welding of different metals used ultrasonic vibration. J. Mater. Process. Tech. 2009, 206, 954–960. [Google Scholar] [CrossRef]
- Maeda, M.; Sato, T.; Inoue, N.; Yagi, D.; Takahashi, Y. Anomalous microstructure formed at the interface between copper ribbon and tin-deposited copper plate by ultrasonic bonding. Microelectron. Reliab. 2011, 51, 130–136. [Google Scholar] [CrossRef]
- Maeda, M.; Kitamori, S.; Takahashi, Y. Interfacial microstructure between thick aluminium wires and aluminium alloy pads formed by ultrasonic bonding. Sci. Technol. Weld. Join. 2013, 18, 103–107. [Google Scholar] [CrossRef] [Green Version]
- Xu, H.; Liu, C.; Silberschmidt, V.V.; Pramana, S.S.; White, T.J.; Chen, Z.; Acoff, V.L. Behavior of aluminum oxide intermetallics and voids in Cu–Al wire bonds. Acta Mater. 2011, 59, 5661–5673. [Google Scholar] [CrossRef]
- Maeda, M.; Yamane, K.; Matsusaka, S.; Takahashi, Y. Relation between vibration of wedge-tool and adhesion of wire to substrate during ultrasoinc bonding. Q. J. JWS 2009, 27, 200s–203s. [Google Scholar] [CrossRef]
- Suzuki, J.; Yamamoto, K.; Horita, M. The study of the load applied to the wire by ultrasonic vibration during wire bonding and bondability. In Proceedings of the 24th Symposium on Microjoining and Assembly Technology in Electronics, Yokohama, Japan, 30–31 January 2018; pp. 239–242. Available online: http://sps-mste.jp/mate2018/src/images/2018_2nd.pdf (accessed on 1 April 2019).
- Takahashi, Y.; Matsusaka, S. Adhesional bonding of fine gold wires to metal substrates. J. Adhesion Sci. Technol. 2003, 17, 435–451. [Google Scholar] [CrossRef]
- Takahashi, Y.; Uesugi, K. Stress induced diffusion along adhesional contact interfaces. Acta Mater. 2003, 51, 2219–2234. [Google Scholar] [CrossRef]
- Zhang, Z.W. Overview of wire bonding using copper wire or insulated wire. Microelectron. Reliab. 2011, 51, 4–12. [Google Scholar] [CrossRef]
Figure 1.
Schematic illustration of ultrasonic bonding apparatus and in-situ observation system.

Figure 2.
Schematic illustration of twist and peel test of Al ribbon bonded on silica substrate.

Figure 3.
Change in ultrasonic vibration amplitude of tool head during ultrasonic bonding: (a) Under the bonding condition of Fb = 7 N and Pu = 3 W. (a–1) Result measured simultaneously with the video taken at Frate = 104 fps. (a–2) Result measured simultaneously with the video taken at Frate = 103 fps; (b) Under the bonding condition of Fb = 7 N and Pu = 4 W. (b–1) Result measured simultaneously with the video taken at Frate = 104 fps. (b–2) Result measured simultaneously with the video taken at Frate = 103 fps.

Figure 4.
In-situ observation results (video captures) of the bonding interface between Al ribbon and silica substrate obtained at Frate = 104 fps. The bonding condition is Fb = 7 N and Pu = 3 W. Simultaneous measurement result of ultrasonic vibration amplitude is shown in Figure 3 (a–1): (a) t = 3 ms; (b) t = 50 ms; (c) t = 100 ms; (d) t = 400 ms.

Figure 5.
Comparison between surface roughness and video capture at t = 100 ms. The surface roughness is that of the Al ribbon surface, measured in the width-direction of Al ribbon: (a) As measured surface roughness; (b) Surface profile after cutting off wavelength less than 10 µm; (c) After cutting off wavelength less than 50 µm; (d) Video capture at t = 100 ms under Fb = 7 N and Pu = 3 W.
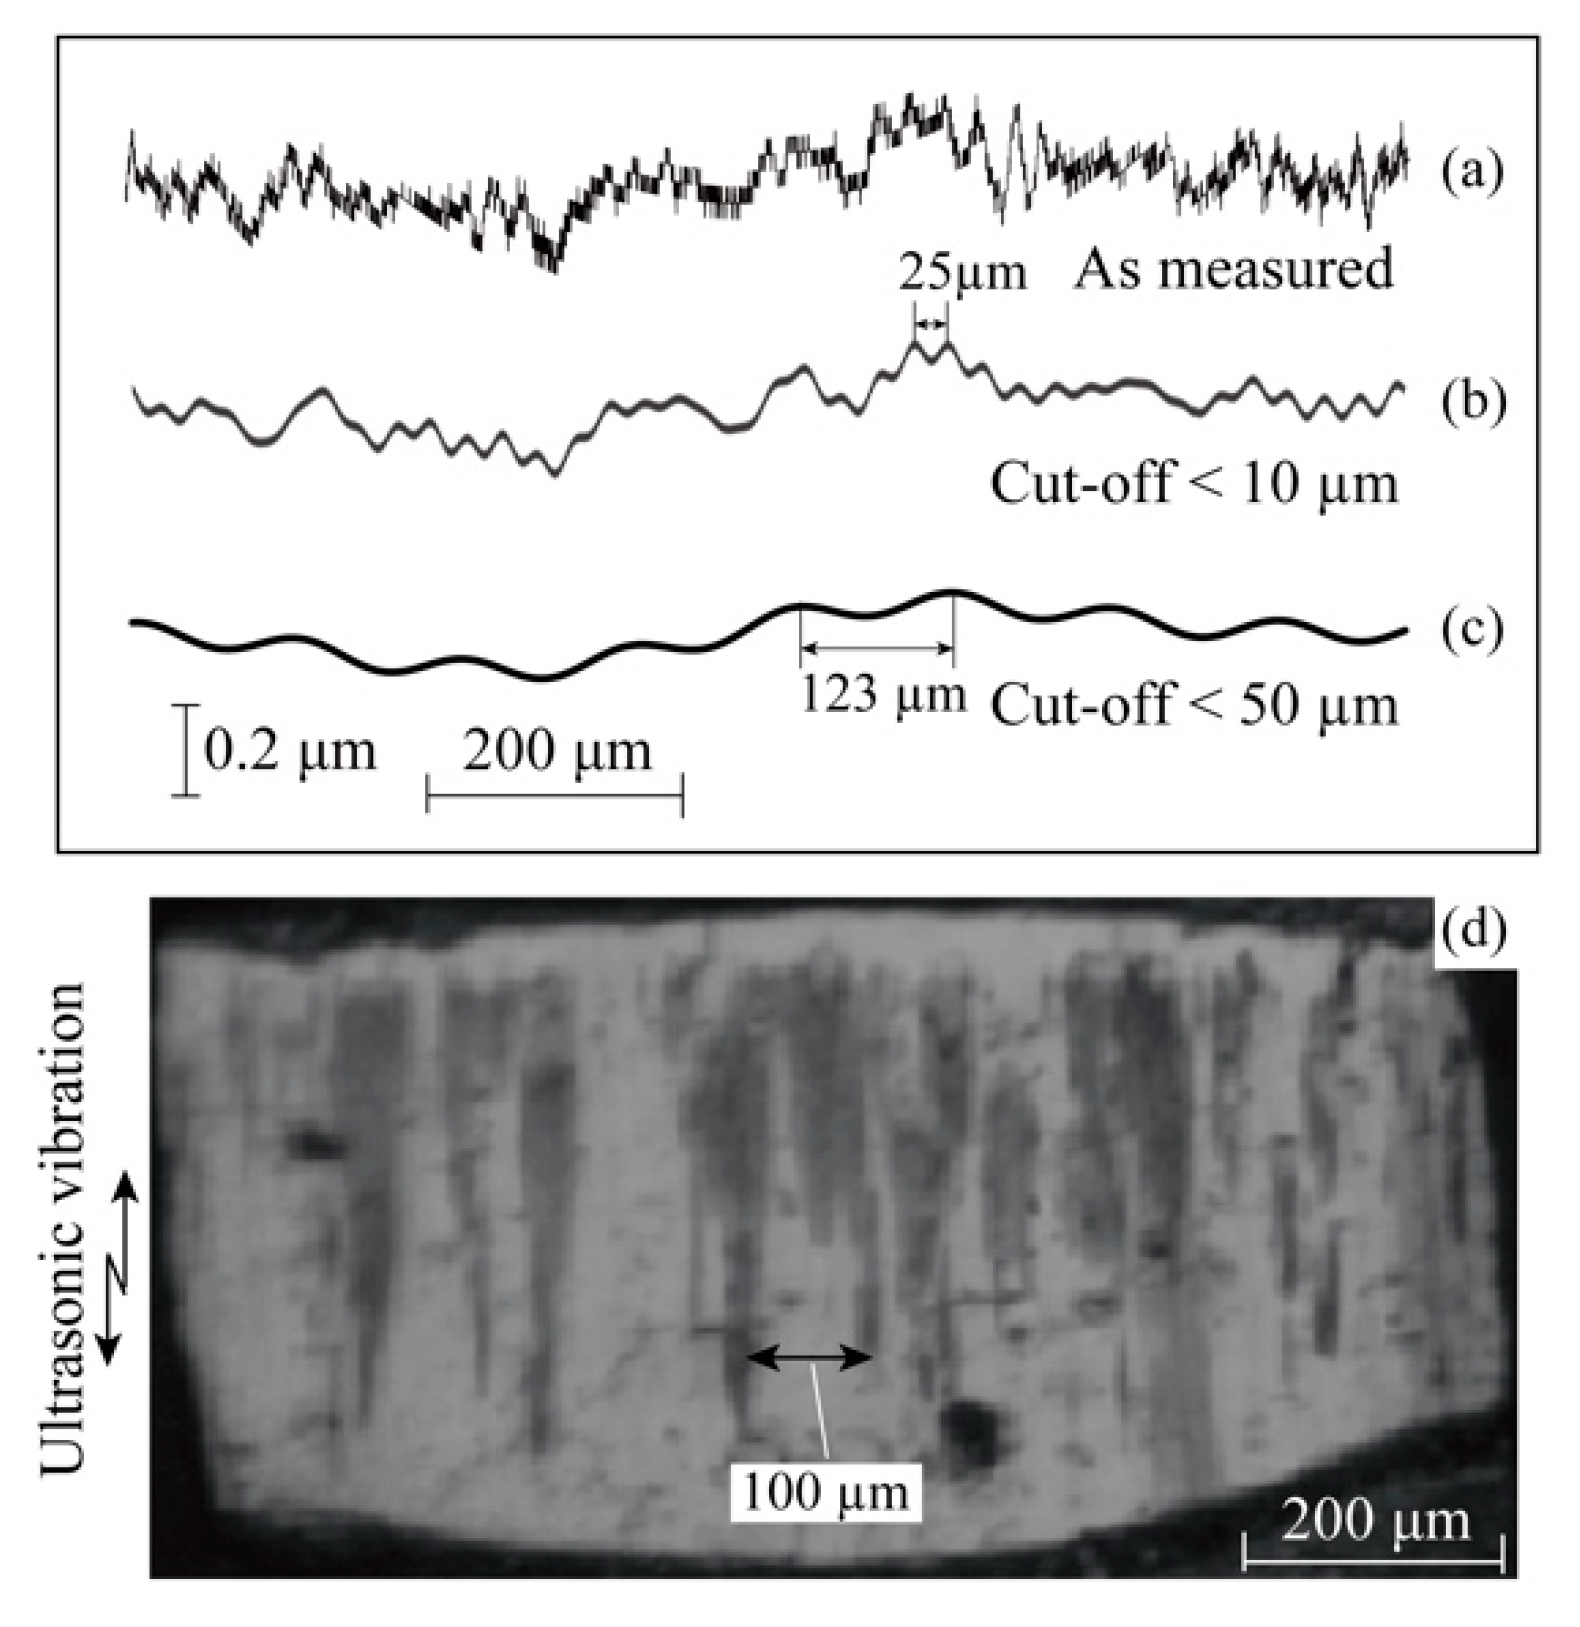
Figure 6.
Comparison between video capture and two still images. The bonding condition is Fb = 7 N and Pu = 3 W: (a) Video capture at t = 400 ms taken at shutter speed of 5 µs; (b) Still image of bonded interface taken under bright illumination (light emitting diode (LED) ring lights + laser pointer); (c) Still image taken under dark illumination (only the LED lamps).

Figure 7.
In-situ observation results (video captures) of the bonding interface between Al ribbon and silica substrate obtained at Frate = 104 fps. The bonding condition is Fb = 7 N and Pu = 4 W. Simultaneous measurement result of ultrasonic vibration amplitude is shown in Figure 3 (b–1): (a) t = 3 ms; (b) t = 50 ms; (c) t = 100 ms; (d) t = 400 ms.

Figure 8.
Explanation of Areas A, B, and C by illustrating the video capture at t = 400 ms under Fb = 7 N and Pu = 4 W: (a) Video capture at t = 100 ms; (b) Schematic illustration of the video capture.
Figure 8.
Explanation of Areas A, B, and C by illustrating the video capture at t = 400 ms under Fb = 7 N and Pu = 4 W: (a) Video capture at t = 100 ms; (b) Schematic illustration of the video capture.
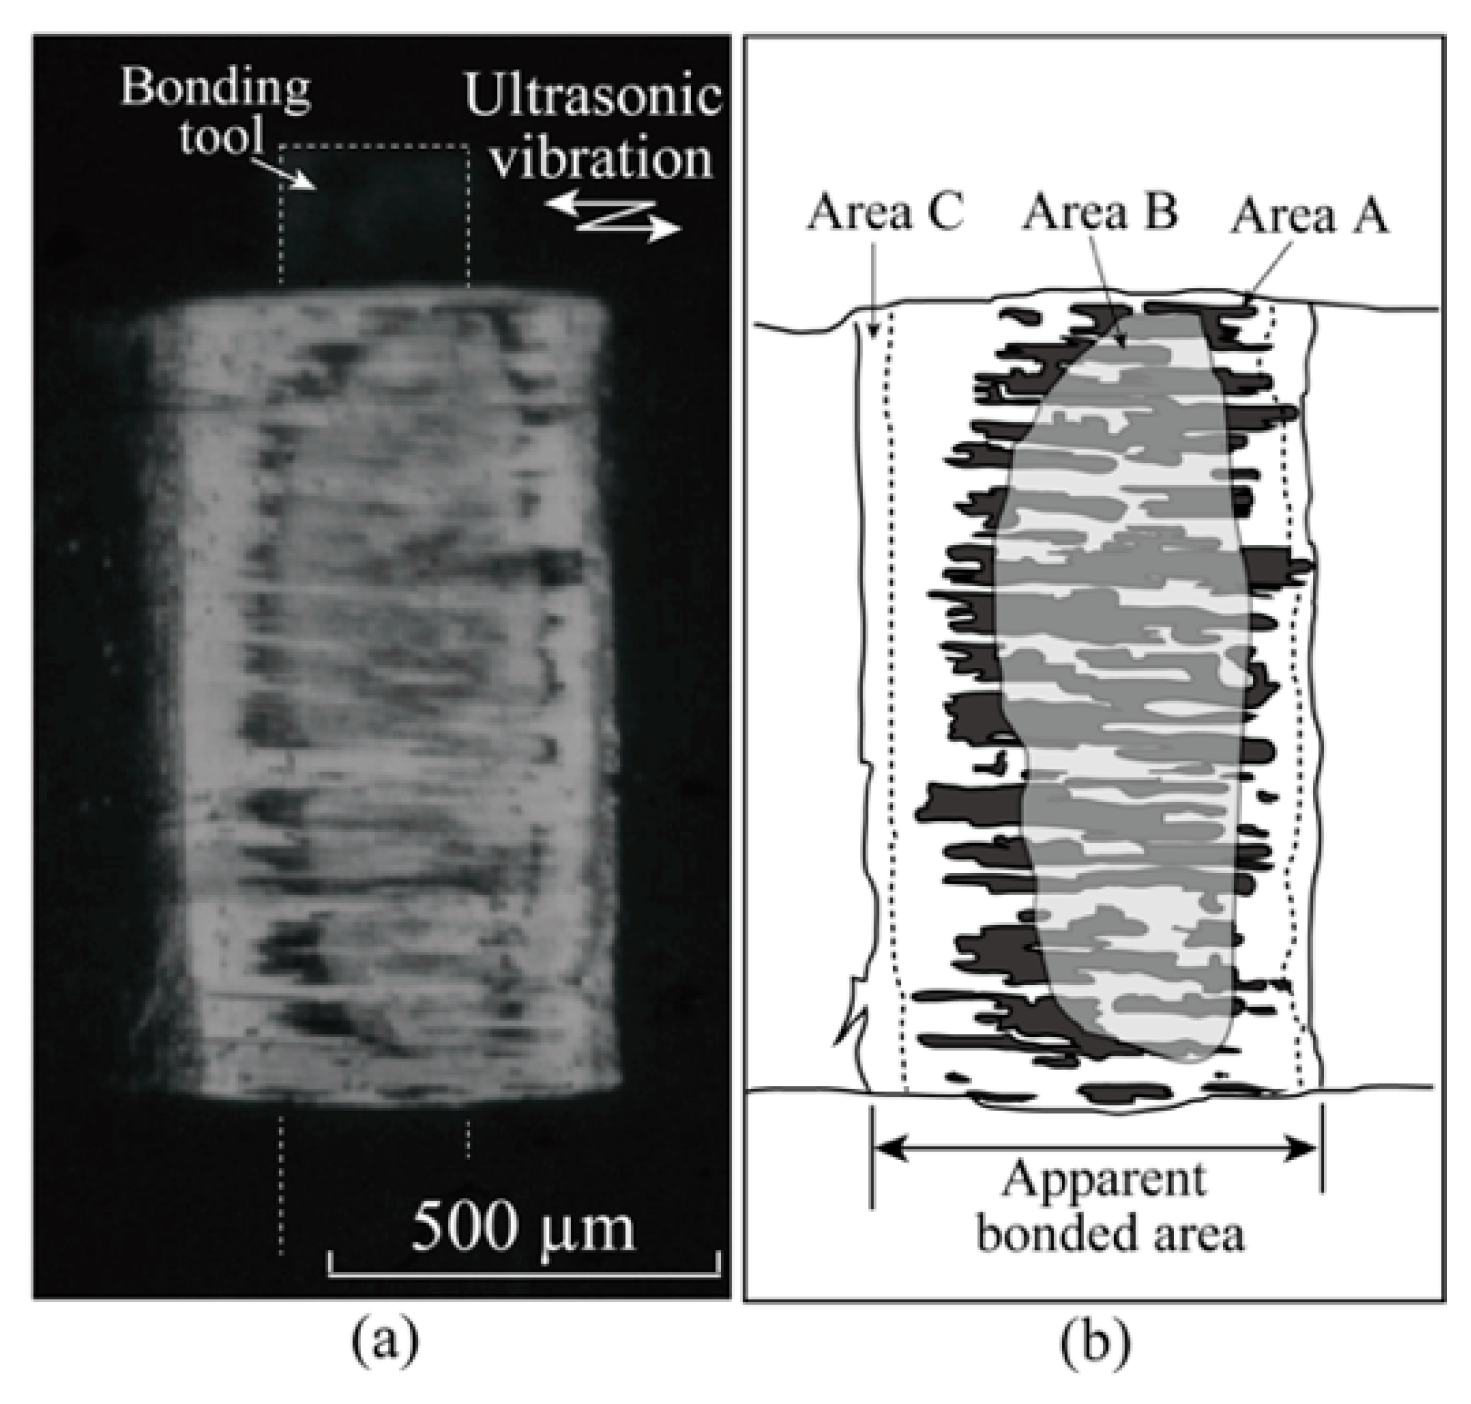
Figure 9.
In-situ observation results (video captures) of the bonding interface between Al ribbon and silica substrate obtained at Frate = 103 fps. The bonding condition was Fb = 7 N and Pu = 3 W. Simultaneous measurement result of ultrasonic vibration amplitude is shown in Figure 3 (a–2): (a) t = 0 ms without ultrasonic vibration (US); (b) t = 1 ms immediately after introducing US; (c) Island streaks began to appear at t = 5 ms; (d) t = 10 ms; (e) t = 20 ms; (f) Central belt zone began to be observed at t = 50 ms; (g) t = 100 ms; (h) t = 400 ms.

Figure 10.
In-situ observation results (video captures) of the bonding interface between Al ribbon and silica substrate obtained at Frate = 103 fps. The bonding condition was Fb = 7 N and Pu = 4 W. Simultaneous measurement result of ultrasonic vibration amplitude is shown in Figure 3 (b–2): (a) t = 0 ms without ultrasonic vibration (US); (b) t = 1 ms immediately after introducing US; (c) Apparent bonded area increased at t = 5 ms; (d) Apparent bonded area decreased at t = 10 ms due to Al ribbon warping; (e) t = 20 ms; (f) Central belt zone began to be observed at t = 50 ms; (g) t = 100 ms; (h) t = 400 ms.
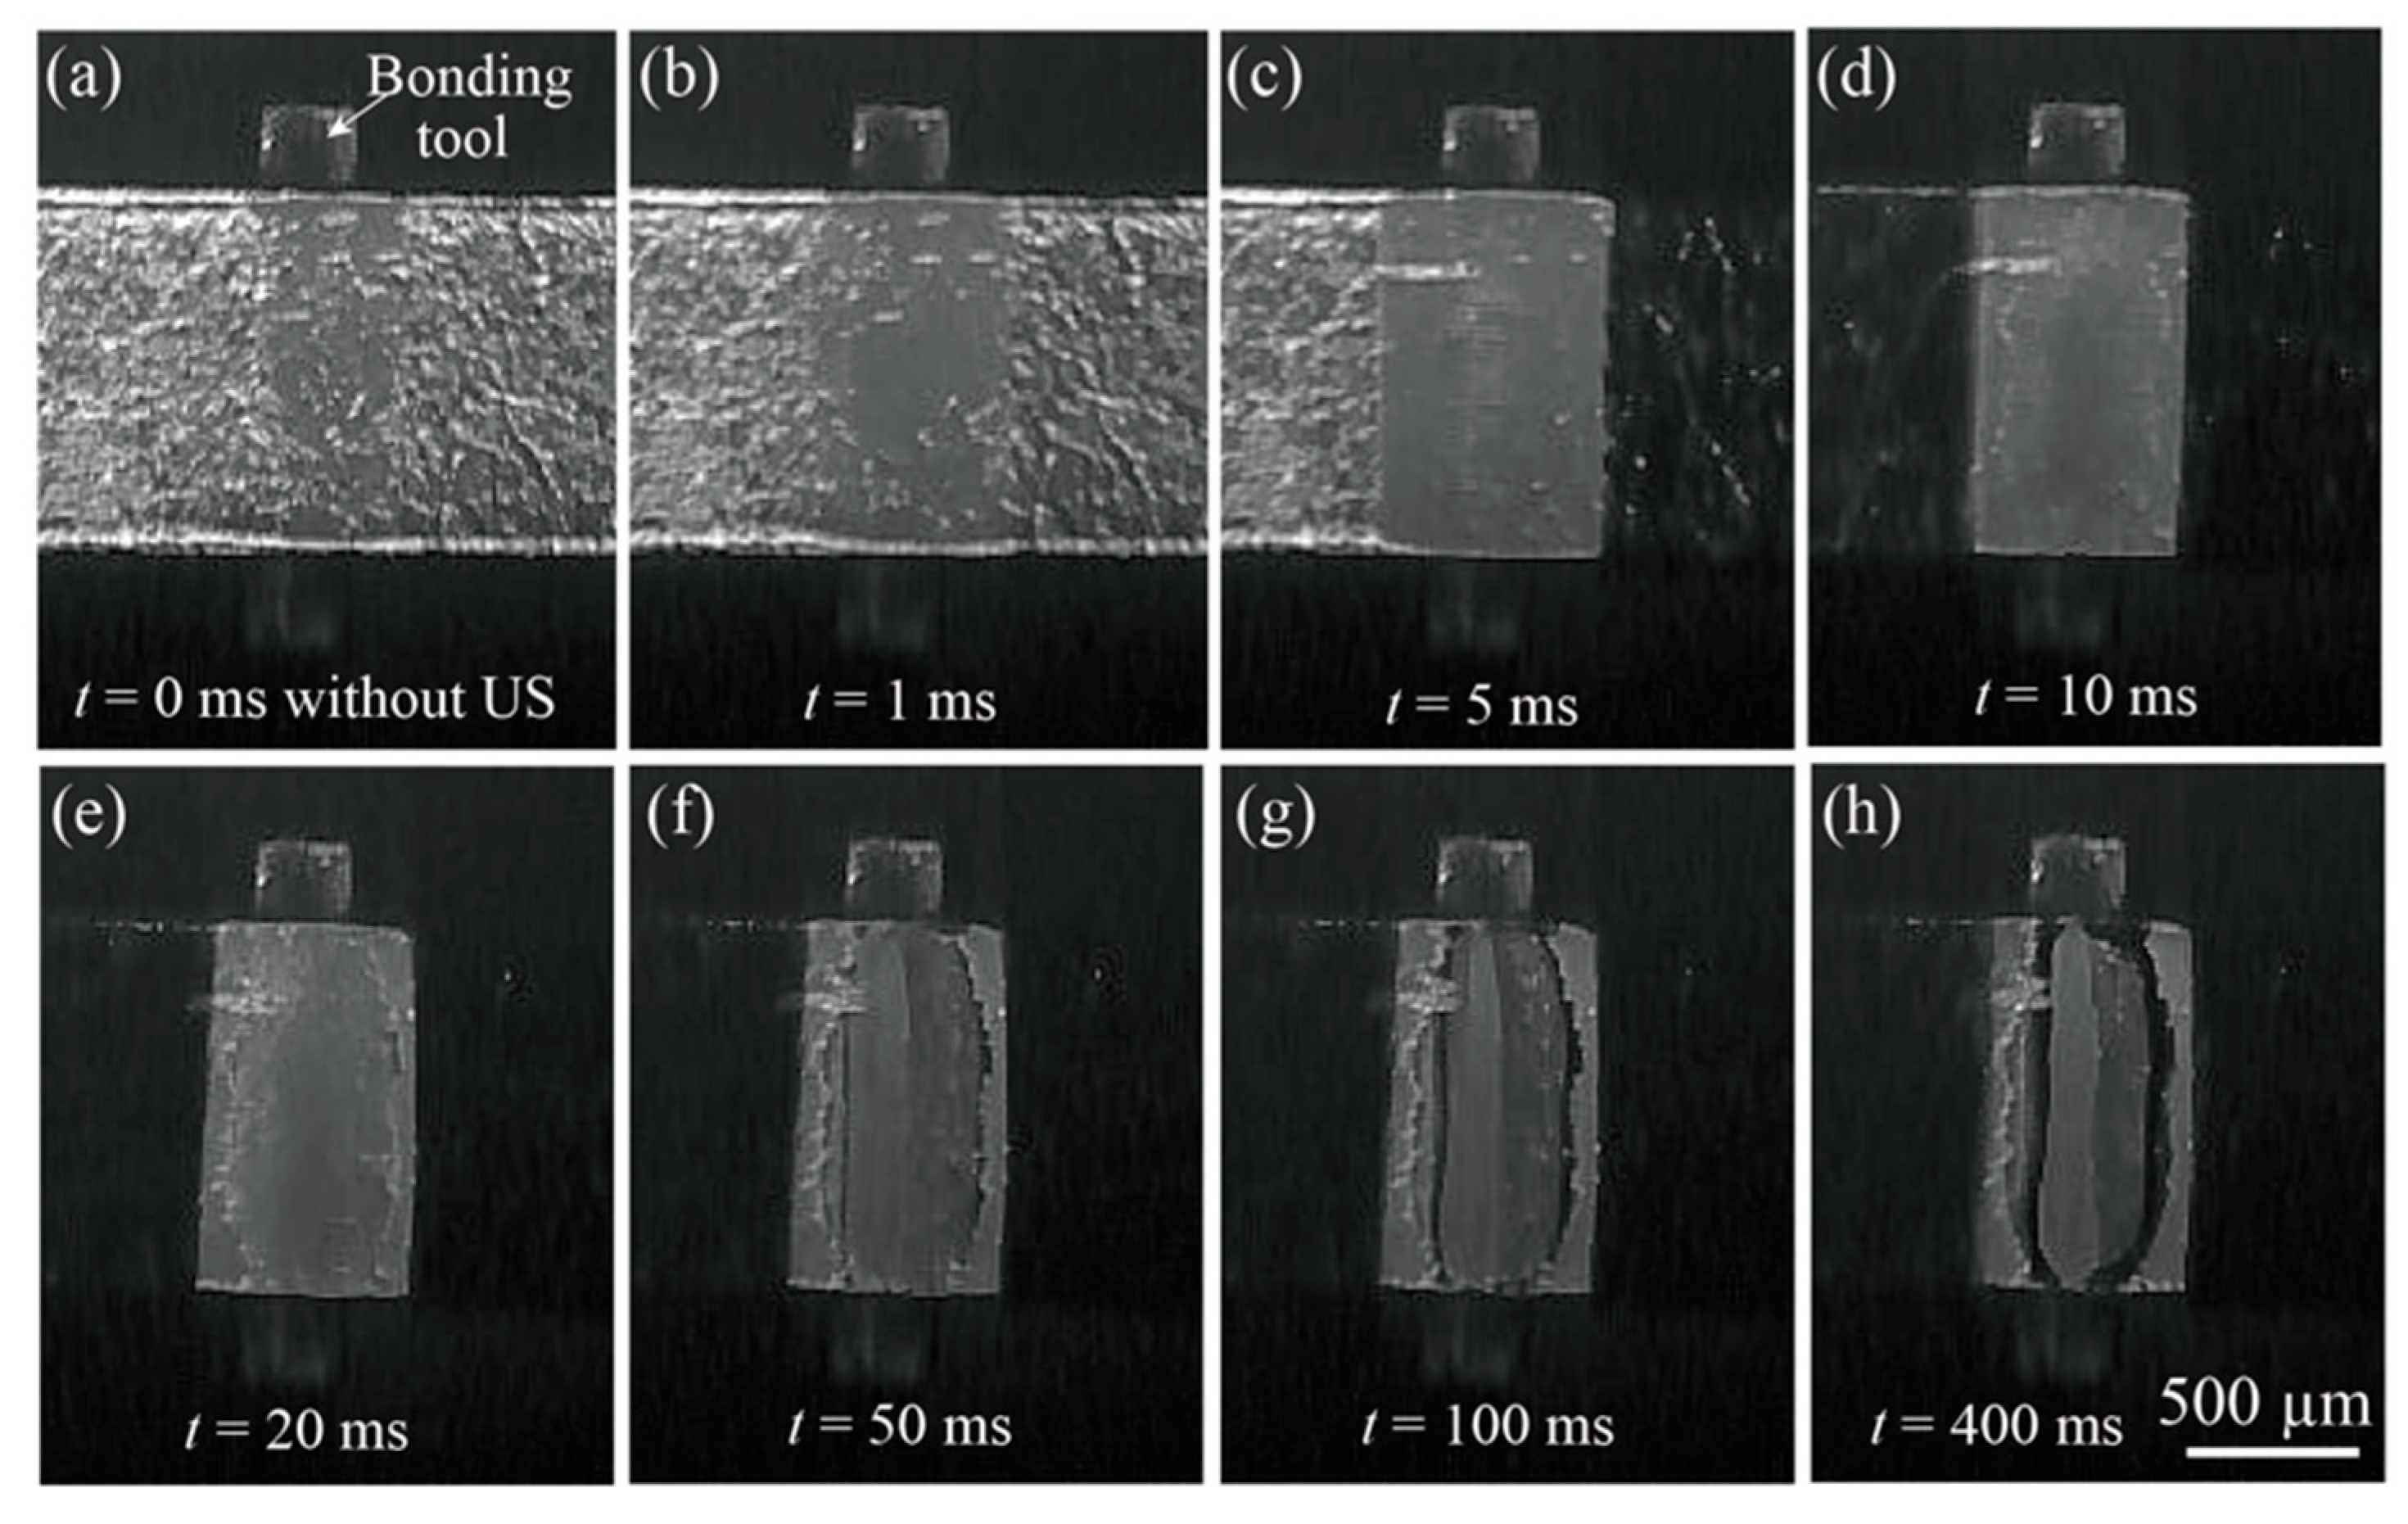
Figure 11.
Twist and peel test of ultrasonic bonded interface between Al ribbon and silica substrate (Fb = 7 N and Pu = 4 W): (a) Before twisting; (b) Immediately after twisting Al ribbon (start time of stage 1); (c) When twisting Al ribbon by 25° in clockwise direction; (d) Twisting by 40° when step 1 is complete; (e) At the beginning of step 2 in counterclockwise direction; (f) Twisting by ~18° in step 2; (g) Immediately after fracture occurs due to peeling (step 3); (h) After fracture. Mark D and Area B1 remain on silica side.

Figure 12.
Schematic illustrations of interfacial bonding process between Al ribbon and silica substrate, which are observed from silica side; (a) Early stage after large sliding; (b) Middle stage in which island streaks increase and central belt zone B forms; (c) Later or final stage in which B2 appears around B1. B2 is behind B1.

Figure 13.
Schematic illustrations of bonded interface between Al ribbon and silica substrate; (a) Cross section parallel to US direction; (b) Drawing of bonded interface and island streaks; (c) Microslipping produced in longitudinal direction of Al ribbon; (d) Microfolding at void tip produced in width-direction of Al ribbon.

© 2019 by the authors. Licensee MDPI, Basel, Switzerland. This article is an open access article distributed under the terms and conditions of the Creative Commons Attribution (CC BY) license (http://creativecommons.org/licenses/by/4.0/).
Share and Cite
MDPI and ACS Style
Takahashi, Y.; Takashima, K.; Misawa, K.; Takaoka, Y. In-Situ Observation of Adhesion Behavior During Ultrasonic Al Ribbon Bonding. Appl. Sci. 2019, 9, 1835. https://doi.org/10.3390/app9091835
AMA Style
Takahashi Y, Takashima K, Misawa K, Takaoka Y. In-Situ Observation of Adhesion Behavior During Ultrasonic Al Ribbon Bonding. Applied Sciences. 2019; 9(9):1835. https://doi.org/10.3390/app9091835
Chicago/Turabian StyleTakahashi, Yasuo, Kazumasa Takashima, Kouta Misawa, and Yusuke Takaoka. 2019. "In-Situ Observation of Adhesion Behavior During Ultrasonic Al Ribbon Bonding" Applied Sciences 9, no. 9: 1835. https://doi.org/10.3390/app9091835
Note that from the first issue of 2016, this journal uses article numbers instead of page numbers. See further details here.