Luminescence Tuning of Fluorinated Bistolanes via Electronic or Aggregated-Structure Control


1
Faculty of Molecular Chemistry and Engineering, Kyoto Institute of Technology, Matsugasaki, Sakyo-ku, Kyoto 606-8585, Japan
2
Department of Quantum Beam Science, Graduate School of Science and Engineering, Ibaraki University, 4-12-1 Nakanarusawa, Hitachi, Ibaraki 316-8511, Japan
*
Author to whom correspondence should be addressed.
Appl. Sci. 2019, 9(9), 1905; https://doi.org/10.3390/app9091905
Submission received: 25 April 2019
/
Revised: 6 May 2019
/
Accepted: 6 May 2019
/
Published: 9 May 2019
(This article belongs to the Section Chemical and Molecular Sciences)
Abstract
:Organic luminescent materials have a wide range of practical applications, but the understanding of the relationship between molecular structure and luminescent behavior is lacking. Herein, we synthesized fluorinated bistolanes with an electron-donating alkoxy substituent at one terminal and an electron-withdrawing substituent at the other to realize systematic control of the electron-density distribution. Evaluation of the phase transition behavior revealed that most of the fluorinated bistolanes showed liquid-crystalline (LC) behavior, with the phase transition temperature depending on the terminal substituents. Additionally, the fluorinated luminophores displayed intense photoluminescence (PL) in solution and in their crystal phases. Remarkably, the PL color shifted dramatically depending on the dipole moment (μ||) along the long molecular axis; thus, PL tuning can be achieved through electronic modulation by precise control of the μ|| of the luminophore. Interestingly, in the LC phases under thermal conditions, the maximum PL band shifted by 0.210 eV upon phase transition from the crystal to smectic A LC phases, indicating that PL tuning can also be achieved by controlling the aggregated structure. These results offer a new molecular design for easily tunable PL materials using the molecular properties or external stimuli for promising applications, including light-emitting displays and PL sensing materials.

1. Introduction
Organic luminescent materials can be broadly classified into two groups: solution-state and solid-state luminophores. Solution-state luminophores, such as rhodamine and fluorescein, are applicable in biomedical imaging and optical probes [1,2,3,4], whereas solid-state luminophores are typically employed in lighting devices, light-emitting diodes, and electroluminescence devices [5,6,7,8,9]. To realize practical applications, significant efforts have been devoted to the discovery of novel luminescent materials, and as a result, various kinds of luminescent molecules have been developed [10,11]. However, there have been few systematic studies on the relationship between molecular structure and luminescent behavior, even though luminescence tuning is a key feature for practical light-emitting applications.
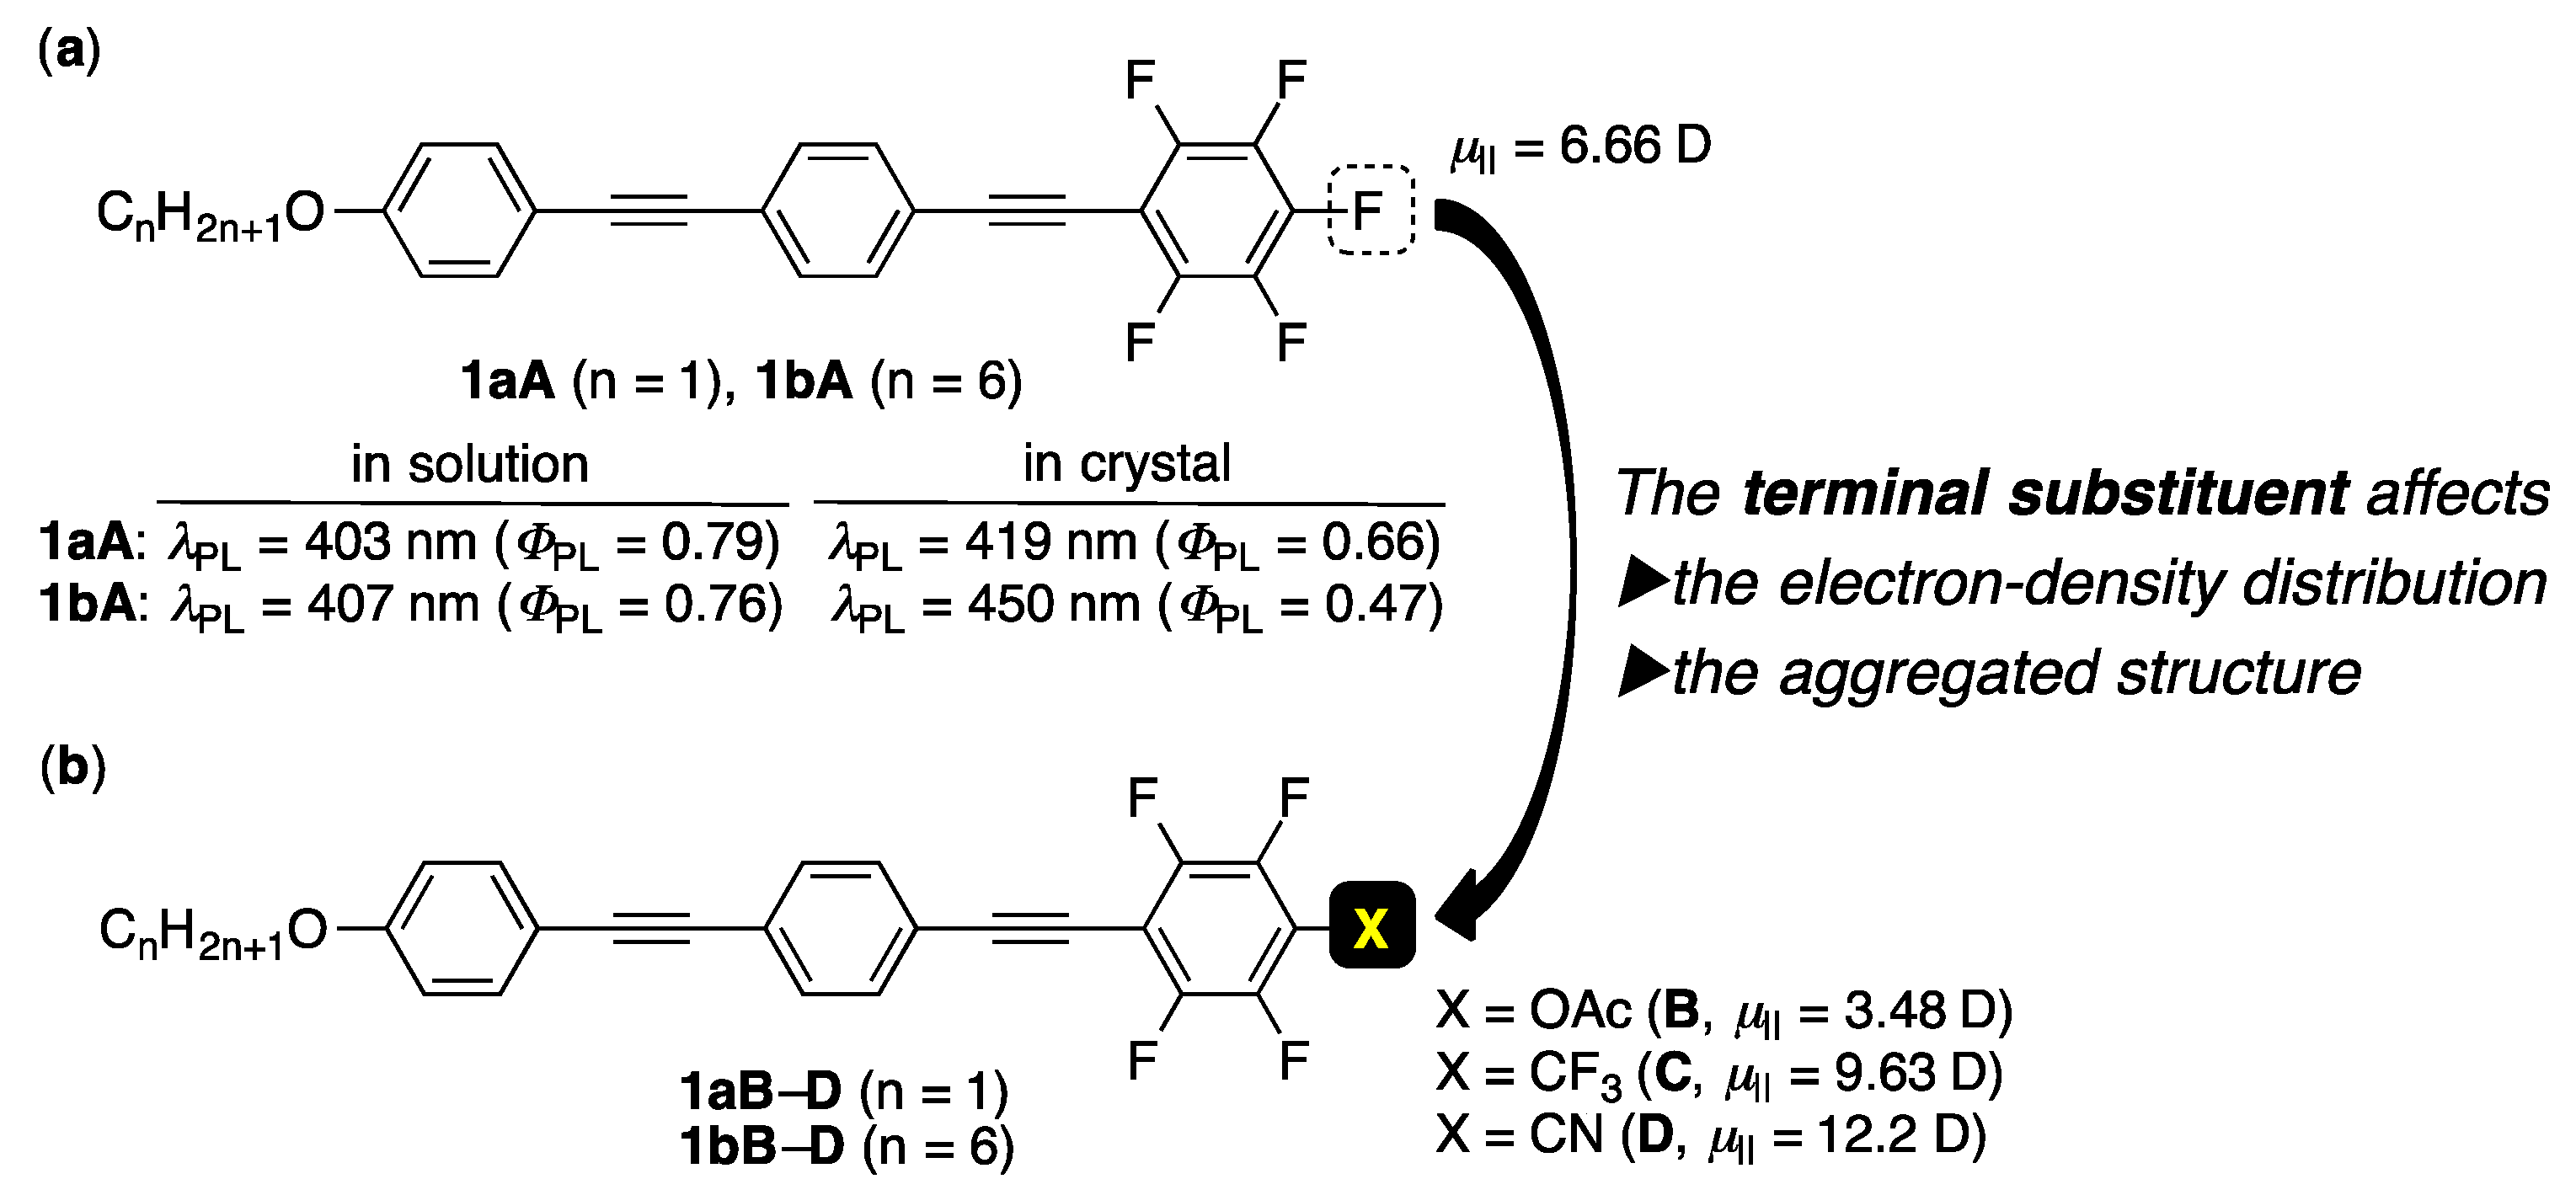
Over the past few decades, numerous fluorine-containing organic materials have been developed because chemical reactivity and material properties are dramatically influenced by the unique characteristics of fluorine, e.g., the largest electronegativity of all elements, the second smallest atom next to hydrogen, and the strong dissociation energy of C–F bonds [12,13]. Our group has extensively studied efficient synthetic protocols for organofluorine molecules containing CF3 groups [14,15] and CF2CF2 fragments [16,17]. More recently, we have also developed a significant interest in functional materials, e.g., liquid-crystalline (LC) and photoluminescence (PL) materials, based on fluorinated π-conjugated molecules such as pentafluorophenyl-containing tolane [18] and bistolane molecules [19,20,21,22,23]. Intriguingly, bistolanes 1aA and 1bA (Figure 1a) exhibited blue-light PL in solution as well as in crystalline (Cr) phases [23]. Remarkably, 1aA and 1bA in the LC phases under thermal conditions also displayed PL behavior, with the PL intensity and color reversibly changing during the thermal Cr ⇄ LC phase transition.
Previous studies by our research group on fluorinated bistolane-type luminophores have demonstrated that the PL behavior depends on the electron-density distribution or aggregated structure. To gain deeper insights into the PL behavior, in this study, we designed six fluorinated bistolanes, viz., 1aB–D and 1bB–D, by systematically modulating the electron-density distribution. Herein, we describe the molecular design and synthesis of these fluorinated bistolane-type luminophores as well as their LC and PL behaviors. Additionally, the effect of precisely modulating the electron-density distribution or aggregated structure on the PL behavior is discussed.
2. Materials and Methods
2.1. General
1H and 13C NMR spectra were recorded using a Bruker AVANCE III 400 NMR spectrometer (1H: 400 MHz and 13C: 100 MHz, Bruker Corporation, Rheinstetten, Germany) in chloroform-d (CDCl3) solution, and the chemical shifts are reported in parts per million (ppm) using the residual proton in the NMR solvent (δH = 7.26 ppm for CHCl3 and δC = 77 ppm for CDCl3). 19F NMR (376 MHz) spectra were recorded using a Bruker AVANCE III 400 NMR spectrometer in CDCl3 solution with CFCl3 (δF = 0 ppm) as an internal standard. Infrared (IR) spectra were acquired via the KBr method using a JASCO FT/IR-4100 type A spectrometer (JASCO Corporation, Tokyo, Japan); all spectra are reported in wavenumbers (cm−1). High-resolution mass spectroscopy (HRMS) was performed using a JEOL JMS-700MS spectrometer (JEOL Ltd., Tokyo, Japan) via fast atom bombardment (FAB). All reactions were performed using dried glassware with a magnetic stirrer bar. All chemicals were of reagent grade and, if necessary, were purified in the usual manner prior to use. Column chromatography was conducted on silica gel (Wako-gel® 60N, 38–100 μm, FUJIFILM Wako Pure Chemical Corporation, Osaka, Japan) and thin layer chromatography (TLC) was performed on silica gel TLC plates (Merck, Silica gel 60F254, FUJIFILM Wako Pure Chemical Corporation, Osaka, Japan).
2.2. Synthesis
Fluorinated bistolanes 1aB–D and 1bB–D were synthesized according to the synthetic procedure shown in Scheme 1. Acetoxy (AcO)-substituted bistolanes 1aB and 1bB were prepared by the Pd(0)-catalyzed Sonogashira cross-coupling reaction of 4-[2-(4-alkoxyphenyl)ethyn-1-yl]phenylacetylene 3a or 3b, readily accessible from the corresponding (4-alkoxyphenyl)acetylene 2a or 2b [21,23], with 4-acetoxy-2,3,5,6-tetrafluoroiodobenzene (B). Derivatives 1aC or 1bC with a trifluoromethyl (CF3) group and 1aD or 1bD with a cyano (CN) group were prepared by the nucleophilic addition of a lithium acetylide, generated from 3a or 3b and n-butyllithium, to perfluorotoluene (C) or perfluorobenzonitrile (D), followed by elimination of lithium fluoride. The following sections provide typical synthetic procedures for the preparation of bistolanes 1aB–D with a methoxy (CH3O) substituent.
2.3. Preparation of AcO-Substituted Bistolane 1aB
In a 50 mL two-necked round-bottomed flask were placed Cl2Pd(PPh3)2 (0.051 g, 0.050 mmol), PPh3 (0.015 g, 0.050 mmol), CuI (0.031 g, 0.10 mmol), 4-[2-(4-methoxyphenyl)ethyn-1-yl]phenylacetylene (3a, 0.24 g, 1.0 mmol), and 4-acetoxy-2,3,5,6-tetrafluoroiodobenzene (B, 0.41 g, 1.2 mmol) in Et3N (10 mL) and THF (5 mL). The mixture was stirred at reflux temperature overnight. The precipitate formed in the reaction mixture was separated by atmospheric filtration and the filtrate was poured into saturated aqueous NH4Cl solution (20 mL). The crude product was extracted using AcOEt (20 mL, three times) and washed with brine (20 mL, once). The organic layer was dried over anhydrous Na2SO4, filtered, and concentrated using a rotary evaporator. The resultant crude product was purified by silica-gel column chromatography using hexane/AcOEt (20:1, v/v) as an eluent, providing coupling product 1aB (0.21 g, 0.48 mmol) in 48% yield as a white solid. This product was recrystallized by slow evaporation from CH2Cl2/MeOH (1:1, v/v) to obtain 1aB in crystalline form.
2.3.1. 1-Acetoxy-2,3,5,6-tetrafluoro-4-[2-[4-[2-(4-methoxyphenyl)ethyn-1-yl]phenyl]ethyn-1-yl]benzene (1aB)
Yield: 48% (white solid); mp: 159 °C determined by differential scanning calorimetry (DSC); 1H NMR (CDCl3): δ 2.42 (s, 3H), 3.84 (s, 3H), 6.88–6.91 (m, 2H), 7.47–7.57 (m, 6H); 13C NMR (CDCl3): δ 20.0, 55.4, 75.3 (t, J = 4.0 Hz), 87.8, 92.3, 101.6 (t, J = 3.8 Hz), 102.3 (t, J = 18.0 Hz), 114.0, 114.9, 121.0, 125.1, 129.3 (tt, J = 14.7, 2.9 Hz), 131.6, 132.0, 133.3, 139.5–142.2 (m, CAr-F, 1C), 145.6–148.4 (m, CAr-F, 1C), 160.1, 166.6; 19F NMR (CDCl3): δ − 137.34 (dd, J = 23.9, 9.9 Hz, 2F), −153.66 (dd, J = 23.9, 9.9 Hz, 2F); IR (KBr): ν 2362, 2210, 1792, 1596, 1491, 1394, 1315 cm−1; HRMS (FAB+) m/z [M]+ calcd for C25H14O3F4: 438.0879; found: 438.0881.
2.3.2. 1-Acetoxy-2,3,5,6-tetrafluoro-4-[2-[4-[2-(4-hexyloxyphenyl)ethyn-1-yl]phenyl]ethyn-1-yl]benzene (1bB)
Yield: 54% (white solid); mp: 143 °C determined by DSC; 1H NMR (CDCl3): δ 0.91 (t, J = 7.0 Hz, 3H), 1.32–1.37 (m, 4H), 1.43–1.50 (m, 2H), 1.76–1.83 (m, 2H), 3.42 (s, 3H), 3.98 (t, J = 6.6 Hz, 2H), 6.87–6.89 (m, 2H), 7.45–7.48 (m, 2H), 7.50–7.56 (m, 4H); 13C NMR (CDCl3): δ 14.2, 20.1, 22.7, 25.8, 29.3, 31.7, 68.3, 75.3 (t, J = 4.3 Hz), 87.7, 92.5, 101.6 (t, J = 4.3 Hz), 102.4 (t, J = 18.1 Hz), 114.8, 121.0, 125.2, 129.3 (tt, J = 17.6, 2.9 Hz), 131.6, 132.0, 133.3, 139.5–142.0 (m, CAr-F, 1C), 145.7–148.3 (m, CAr-F, 1C), 159.7, 166.6 (one sp-carbon was overlapped with another alkyne carbon); 19F NMR (CDCl3): δ − 137.90 (dd, J = 23.1, 9.8 Hz, 2F), −154.22 (dd, J = 23.1, 9.8 Hz, 2F); IR (KBr): ν 2962, 2860, 2367, 2208, 1795, 1597, 1495, 1405 cm−1; HRMS (FAB+) m/z [M]+ calcd for C30H24O3F4: 508.1662; found: 508.1655.
2.4. Preparation of CF3-Substituted Bistolane 1aC
In a 50 mL two-necked round-bottomed flask was placed 4-[2-(4-methoxyphenyl)ethyn-1-yl]phenylacetylene (3a, 0.46 g, 2.0 mmol) in THF (30 mL). The solution was cooled to 0 °C and then n-BuLi (1.6 mol L−1 hexane solution, 1.3 mL, 2.0 mmol) was added. The mixture was stirred at 0 °C for 0.5 h. Then, perfluorotoluene (C, 0.42 mL, 3.0 mmol) was added dropwise at 0 °C and the resultant solution was continuously stirred at room temperature overnight. The reaction mixture was poured into saturated aqueous NH4Cl solution (40 mL). The crude product was extracted using AcOEt (40 mL, three times) and washed with brine (40 mL, once). The organic layer was dried over anhydrous Na2SO4, filtered, and concentrated using a rotary evaporator. The resultant crude product was purified by silica-gel column chromatography using hexane/AcOEt (20:1, v/v) as an eluent, yielding coupling product 1aC (0.32 g, 0.72 mmol) in 36% yield as a white solid. This product was recrystallized by slow evaporation from CH2Cl2/MeOH (1:1, v/v) to obtain 1aC in crystalline form.
2.4.1. 1-Trifluoromethyl-2,3,5,6-tetrafluoro-4-[2-[4-[2-(4-methoxyphenyl)ethyn-1-yl]phenyl]ethyn-1-yl]benzene (1aC)
Yield: 36% (white solid); mp: 168 °C determined by DSC; 1H NMR (CDCl3): δ 3.84 (s, 3H), 6.88–6.91 (m, 2H), 7.47–7.50 (m, 6H); 13C NMR (CDCl3): δ 55.5, 74.9 (t, J = 3.7 Hz), 87.7, 92.8, 104.7, 108.8–109.3 (m), 109.7–109.8 (m, 1C), 114.3, 114.9, 120.7 (q, J = 273.6 Hz), 120.3, 125.9, 131.7, 132.2, 133.4, 142.9–145.7 (m), 145.8–148.3 (m), 160.2; 19F NMR (CDCl3): δ − 56.67 (t, J = 23.2 Hz, 3F), −135.09 (ddd, J = 18.1, 18.1, 5.7 Hz, 2F), −141.27 (m, 2F); IR (KBr): ν 2360, 2210, 1660, 1643, 1595, 1493, 1404, 1345 cm−1; HRMS (FAB+) m/z [M]+ calcd for C24H11OF7: 448.0698; found: 448.0699.
2.4.2. 1-Trifluoromethyl-2,3,5,6-tetrafluoro-4-[2-[4-[2-(4-hexyloxyphenyl)ethyn-1-yl]phenyl]ethyn-1-yl]benzene (1bC)
Yield: 32% (white solid); mp: 133 °C determined by DSC; 1H NMR (CDCl3): δ 0.91 (t, J = 7.0 Hz, 3H), 1.33–1.37 (m, 4H), 1.43–1.50 (m, 2H), 1.76–1.83 (m, 2H), 3.98 (t, J = 6.6 Hz, 2H), 6.87–6.89 (m, 2H), 7.45–7.48 (m, 2H), 7.52–7.59 (m, 4H); 13C NMR (CDCl3): δ 14.1, 22.7, 25.8, 29.3, 31.7, 68.3, 74.9 (t, J = 7.2 Hz), 87.6, 93.0, 104.7 (t, J = 4.2 Hz), 108.9–109.2 (m, 1C), 114.6, 114.8, 120.7 (q, J = 273.6 Hz), 120.2, 125.9, 131.6, 132.2, 133.3, 143.0–145.6 (m, 1C), 145.8–148.3 (m, 1C), 159.8 (one sp-carbon was overlapped with another alkyne carbon); 19F NMR (CDCl3): δ − 56.77 (t, J = 23.2 Hz, 3F), −135.13 (ddd, J = 18.2, 18.2, 5.9 Hz, 2F), −141.39 (m, 2F); IR (KBr): ν 2957, 2894, 2360, 2211, 1659, 1606, 1594 cm−1; HRMS (FAB+) m/z [M]+ calcd for C29H21OF7: 518.1481; found: 518.1484.
2.5. Preparation of CN-Substituted Bistolane 1aD
In a 50 mL two-necked round-bottomed flask was placed 4-[2-(4-methoxyphenyl)ethyn-1-yl]phenylacetylene (3a, 0.47 g, 2.0 mmol) in THF (30 mL). The solution was cooled to 0 °C and then n-BuLi (1.6 mol L−1 hexane solution, 1.3 mL, 2.0 mmol) was added. The mixture was stirred at 0 °C for 0.5 h. Then, perfluorobenzonitrile (D, 0.30 mL, 2.4 mmol) was added dropwise at 0 °C, and the resultant solution was continuously stirred at room temperature overnight. The reaction mixture was poured into saturated aqueous NH4Cl solution (40 mL). The crude product was extracted using AcOEt (40 mL, three times) and washed with brine (40 mL, once). The organic layer was dried over anhydrous Na2SO4, filtered, and concentrated using a rotary evaporator. The resultant crude product was purified by silica-gel column chromatography using hexane/AcOEt (20:1, v/v) as an eluent, yielding coupling product 1aD (0.26 g, 0.64 mmol) in 32% yield as a yellow solid. This product was recrystallized by slow evaporation from CH2Cl2/MeOH (1:1, v/v) to obtain 1aD in crystalline form.
2.5.1. 1-Cyano-2,3,5,6-tetrafluoro-4-[2-[4-[2-(4-methoxyphenyl)ethyn-1-yl]phenyl]ethyn-1-yl]benzene (1aD)
Yield: 32% (yellow solid); mp: 195 °C determined by DSC; 1H NMR (CDCl3): δ 3.84 (s, 3H), 6.87–6.92 (m, 2H), 7.47–7.50 (m, 6H), 7.52–7.61 (m, 4H); 13C NMR (CDCl3): δ 55.5, 75.2, 87.7, 93.1, 93.3, 107.1 (dt, J = 84.9, 4.9 Hz), 110.5 (d, J = 2.3 Hz), 111.2 (t, J = 2.8 Hz), 114.3, 114.9, 120.0, 126.3, 131.7, 132.3, 133.4, 145.3–146.0 (m), 147.8–148.7 (m), 160.2; 19F NMR (CDCl3): δ − 133.19 (ddd, J = 18.0, 18.0, 6.7 Hz, 2F), −133.90 (ddd, J = 18.0, 17.9, 6.1 Hz, 2F); IR (KBr): ν 2351, 2207, 1643, 1595, 1487, 1478 cm−1; HRMS (FAB+) m/z [M]+ calcd for C24H11NOF4: 405.0777; found: 405.0780.
2.5.2. 1-Cyano-2,3,5,6-tetrafluoro-4-[2-[4-[2-(4-hexyloxyphenyl)ethyn-1-yl]phenyl]ethyn-1-yl]benzene (1bD)
Yield: 17% (yellow solid); mp: 154 °C determined by DSC; 1H NMR (CDCl3): δ 0.91 (t, J = 6.9 Hz, 3H), 1.32–1.37 (m, 4H), 1.44–1.48 (m, 2H), 1.79 (quin, J = 7.0 Hz, 2H), 3.98 (t, J = 6.6 Hz, 2H), 6.87–6.90 (m, 2H), 7.45–7.48 (m, 2H), 7.52–7.59 (m, 4H); 13C NMR (CDCl3): δ 14.2, 22.7, 25.8, 29.3, 31.7, 68.3, 75.5, 87.9, 93.3 (m), 93.3, 106.6–108.3 (m), 110.0, 111.3 (m), 114.6, 114.8, 119.9, 126.3, 131.7, 132.3, 133.4, 143.5–143.8 (m), 144.9–145.1 (m), 159.91; 19F NMR (CDCl3): δ − 133.24 (ddd, J = 19.5, 17.8, 6.3 Hz, 2F), −133.94 (ddd, J = 19.5, 17.8, 6.3 Hz, 2F); IR (KBr): ν 2944, 2872, 2210, 1645, 1606, 1596, 1520, 1474, 1416 cm−1; HRMS (FAB+) m/z [M]+ calcd for C29H21NOF4: 475.1559; found: 475.1549.
2.6. X-ray Crystallography
Single crystals of 1aB and 1aC were obtained by a double purification protocol using column chromatography, followed by recrystallization (CH2Cl2/MeOH = 1:1, v/v or CH2Cl2/hexane = 1:1, v/v). The obtained single crystals were mounted on a glass fiber. X-ray diffraction data were recorded using a Rigaku XtaLab mini diffractometer (Rigaku Corporation, Tokyo, Japan) or a Rigaku Saturn 724 diffractometer (Rigaku Corporation, Tokyo, Japan) equipped with a VariMax Mo optic system using MoKα (λ = 0.71075 Å). The reflection data were integrated, scaled, and averaged using CrysAlisPro (ver. 1.171.38.46, Rigaku Oxford Diffraction, Rigaku Corporation, Tokyo, Japan, 2015). Empirical absorption corrections were applied using the SCALE3 ABSPACK scaling algorithm (CrysAlisPro, Rigaku Corporation, Tokyo, Japan). The structures were solved by a direct method (SHELXT-2014/5) and refined using a full-matrix least-squares method on F2 for all reflections (SHELXL-2014/7) [24]. The crystallographic data were deposited into the Cambridge Crystallographic Data Centre (CCDC) database (CCDC 1908239 for 1aB and 1908240 for 1aC). These data can be obtained free of charge from the CCDC via www.ccdc.cam.ac.uk/data_request/cif.
2.7. Computations
All density functional theory (DFT) computations were performed using the Gaussian 09 (Revision C.01) package [25]. Geometry optimizations were executed using the CAM-B3LYP hybrid functional [26,27] and the 6-31+G(d) basis set with an implicit solvation model, namely, the conductor-like polarizable continuum model (CPCM) [28,29,30], for CH2Cl2. The vertical excitation energies and dipole moments of the optimized structures were calculated using the time-dependent (TD)-DFT method at the same level as in the theory. To obtain the optimized structures in the excited (S1) state, geometry optimizations were carried out using the TD-DFT method.
2.8. Phase Transition Behavior
The phase transition behavior of the fluorinated bistolanes was observed by polarizing optical microscopy (POM) using an Olympus BX53 microscope (Olympus Corporation, Tokyo, Japan) equipped with a cooling and heating stage (Linkam Scientific Instruments, 10002L, Surrey, UK). The thermodynamic behavior was determined using differential scanning calorimeter (DSC, Shimadzu, DSC-60 Plus, Kyoto, Japan) at heating and cooling rates of 5.0 °C min−1 under a N2 atmosphere.
2.9. Photophysical Behavior
Ultraviolet-visible (UV-vis) absorption spectra were recorded using a JASCO V-500 (JASCO Corporation, Tokyo, Japan) absorption spectrometer. Steady-state PL spectra were obtained using a JASCO FP-8500 (JASCO Corporation, Tokyo, Japan) or a Hitachi F-7000 fluorometer (Hitachi Ltd., Tokyo, Japan). The absolute PL quantum yields were recorded using a calibrated integrating sphere with a Hamamatsu Photonics C11347-01 Absolute PL Quantum Yield Measurement System (Hamamatsu Photonics KK, Hamamatsu, Japan).
3. Results and Discussion
3.1. Molecular Design
Using DFT and TD-DFT calculations in the Gaussian 09 suite of programs, we examined the effect of the terminal substituent in each designed molecule on the electron-density distribution over the entire molecule. The geometries of 1aB–D in the ground (S0) and excited (S1) states were optimized at the CAM-B3LYP/6-31+G(d) level of theory with the implicit solvation CPCM model for CH2Cl2. Figure 2 shows the structures of 1aB–D and their calculated electrostatic potential maps, dipole moments along the long molecular axis (μ||), isodensity surfaces, and orbital energies for the highest occupied molecular orbital (HOMO) and lowest unoccupied molecular orbital (LUMO).
The electrostatic potential maps of 1aB–D reveal that the electron density at the fluorinated aromatic ring decreases in the following order: 1aB > 1aC > 1aD. The dipole moment (μ||) along the long molecular axis can be used to assess the electron-density distribution over the entire molecule quantitatively. AcO-substituted 1aB had the smallest μ|| value (3.48 D), and this value increased when the AcO group was replaced by a CF3 or CN group (μ|| = 9.63 D for 1aB and 12.2 D for 1aC). These results clearly confirm that the incorporation of AcO, CF3, and CN groups into the fluorinated bistolane scaffold can be used to systematically change the electron-density distribution over the entire molecule. The electron-density distribution also affected the molecular orbitals, with the orbital lobes in the HOMO largely localized on the relatively electron-rich aromatic rings, whereas the LUMO lobes were relatively localized on the electron-deficient aromatic rings. The orbital separation between the HOMO and LUMO in the S1 state may contributable to unique PL behavior through intramolecular charge transfer [31]. The energy differences (ΔEH-L) between HOMO and LUMO levels were 5.08 eV for 1aB, 4.89 eV for 1aC, and 4.67 eV for 1aD. Thus, 1aD is expected to show a PL band in the long-wavelength region, with the PL wavelength shifting towards shorter wavelengths as the transition energy increases, i.e., 1aB > 1aC. Theoretical calculations for 1bB–D, bearing long alkoxy substituents, also provided similar μ|| and HOMO/LUMO distributions (see Supplementary Materials), assuming that the alkoxy-substituent does not affect in the electron density distribution. Consequently, systematic control of the electron-density distribution induced by modulating the electronic character of the terminal substituent should realize luminescence tuning for the fluorinated luminophores. According to our previous study, modulation of terminal substituents also influences the LC behavior [21,23], not only through changes in the electron-density distribution but also in the steric bulkiness of the substituent. Thus, systematic modulation of the terminal substituent in 1aB–D may also allow control of the LC behavior.
3.2. Synthesis and Crystal Structure
Based on the aforementioned molecular design, fluorinated bistolanes 1aB–C with a CH3O group and 1bB–D with a hexyloxy (C6H13O) moiety were synthesized according to the procedure shown in Scheme 1. AcO-substituted 1aB was obtained in 48% yield by the Pd(0)-catalyzed Sonogashira cross-coupling reaction of 3a, readily accessible from 2a [21,23], with B. In contrast, CF3-substituted 1aC and CN-substituted 1aD were obtained in 36% or 32% yield, respectively, by nucleophilic aromatic substitution of the in situ generated lithium acetylide derived from 3a with perfluorotoluene and perfluorobenzonitrile, respectively [32]. In a similar manner, C6H13O-substituted analogue 1bB was prepared in 54% yield through a Sonogashira cross-coupling reaction and 1bC and 1bD were prepared in 32% and 17% yields, respectively, through nucleophilic substitution reactions. Each fluorinated bistolane was purified by column chromatography and recrystallization from a 1:1 solution of CH2Cl2 (good solvent) and MeOH or hexane (poor solvent). The structure of each compound was confirmed by 1H, 13C, and 19F NMR, IR, and HRMS and the spectra indicated that the purity was sufficient to evaluate the LC and PL behaviors.
Among the fluorinated bistolanes, AcO-substituted 1aB and CF3-substituted 1aC furnished single crystals appropriate for X-ray crystallographic analysis. 1aB crystalized with a monoclinic crystal structure in the P 21 space group with two molecular units in the unit cell. As shown in Figure 3a, the three aromatic rings were found to be almost coplanar, although there may be a rapid equilibrium between the coplanar and twisted conformations through free rotation of the Csp–Csp2 single bonds [33]. The packing structure (Figure 3b) revealed several close contacts that were shorter than the sums of the van der Waals radii (carbon: 170 pm, hydrogen: 120 pm, and fluorine: 148 pm) [34]: Halkyl···Csp2 (288 pm), Haryl···Csp (284 pm), Haryl···F (253 pm), Halkyl···F (246 pm), Haryl···O (257 pm). Thus, the crystal lattice of 1aB contains two CH–π interactions and three hydrogen bonding interactions. In contrast, 1aC crystalized with a monoclinic crystal structure in the P 21/c space group with four molecular units in the unit cell. As shown in Figure 3c, each 1aC molecule was also found to be coplanar with several short contacts (Figure 3d), such as Csp2···Csp2 (332 pm), Haryl···F (251 pm), Csp2···F (314 pm), and F···F (265 pm). Thus, 1aC also formed a tight packing structure with one π–π interaction, one hydrogen bonding interaction, and one lone-pair–π interaction [35,36].
3.3. Phase Transition Behavior
The phase transition behavior of fluorinated bistolanes 1aB–D and 1bB–D was investigated using POM and DSC. Figure 4 shows the phase transition behavior observed during the 2nd heating cooling processes and the microphotographic images of the LC phases.
Among 1aB–D with a methoxy group at one molecular terminal and an electron-withdrawing substituent at the other, AcO-substituted 1aB exhibited no LC behavior, as evidenced by the dramatic change in the POM images from nonfluidic bright-viewing to fluidic dark-viewing fields during both the heating and cooling processes. The steric hindrance of the AcO group and the dipole moment (μ⊥) along the short molecular axis induced by the carbonyl moiety in the AcO group likely make it difficult to order structures in the condensed phase, resulting in a direct phase transition to the isotropic (Iso) phase. In contrast, the POM images of 1aC with a CF3 group and 1aD with a CN group displayed fluidic bright-viewing fields between the crystal (Cr) and Iso phases; POM and DSC measurements only revealed a single LC phase for 1aC and 1aD. As the microphotographic images of 1aC and 1aD display a four-brushed Schlieren texture, which is typical of nematic (N) LC phases, the single LC phases of 1aC and 1aD are assigned as N phases. The melting temperature (Tm, defined as the phase transition temperature between the Cr and LC phases) and the clearing temperature (Tc, defined as the phase transition temperature between the LC an Iso phases) are much higher for 1aD than for 1aC (Figure 3a). This behavior is consistent with the linear and rigid structure of the CN group, which induces tight packing in an antiparallel direction owing to the large μ|| value [37,38,39].
Changing the length of the flexible chain at the molecular terminal by replacing CH3O with C6H13O affected the LC behavior. 1bB–D all showed LC phases, and the Tm and Tc values for 1bB–D were dramatically decreased compared with the corresponding values for 1aB–D. Typically, such stabilization of LC phases can be attributed to the introduction of a longer flexible unit [23]. The POM and DSC measurements revealed that AcO-substituted 1bB and CN-substituted 1bD displayed only a N LC phase owing to the steric bulkiness of AcO and the rigid linear rigid structure of CN with a large μ|| value. However, CF3-substituted 1bC exhibited both SmA and N LC phases, analogous to those previously reported for 1bA. Thus, a suitable choice of substituent at the molecular terminal is important for achieving precise control of the LC behavior, including the LC phase, phase transition temperature, and LC temperature range.
3.4. PL Behavior in the Solution Phase
Next, we examined the photophysical behavior of the fluorinated bistolanes. First, we investigated the absorption and PL behavior in CH2Cl2 solution (~1.0 × 10⁻⁵ mol L−1 for absorption and 1.0 × 10⁻⁶ mol L−1 for PL). Figure 5a,b shows the absorption and PL spectra, respectively, of 1aB–D (solid lines) and 1bB–D (dashed lines). Figure 5c shows photographs of the PL colors and the corresponding Commission Internationale d’Eclairage (CIE) chromaticity diagram. The photophysical data are listed in Table 1.
In CH2Cl2 solution, CH3O-Substituted 1aB–D each exhibited a single absorption band and the maximum absorption wavelength (λabs) varied significantly depending on the electron-withdrawing substituent: 333 nm (AcO-substituted 1aB), 341 nm (CF3-substituted 1aC), and 356 nm (CN-substituted 1aD) (Figure 5a), in which the λmax in the calculated UV-Vis spectra obtained from TD-DFT calculation resulted in a similar tendency: 338 nm (AcO-substituted 1aB), 347 nm (CF3-substituted 1aC), and 360 nm (CN-substituted 1aD) (Figure S21). As listed in Table 1, the μ|| values in the S0 state were calculated to be 1aB (1.91 D) < 1aC (7.22 D) < 1aD (9.67 D), indicating a strong correlation between the λabs and μ|| values. Upon excitation at λabs, 1aB–D in CH2Cl2 each displayed a single PL band at a maximum PL wavelength (λPL) of 410–488 nm with a high PL efficiency (ФPL = 0.85–0.91) (Figure 5b). As shown in Figure 5c, 1aB–D emitted deep-blue, blue PL, light-green PL, respectively, and the PL colors can also be quantitatively evaluated using the CIE chromaticity diagram. Similar to λabs, λPL also exhibited a shift towards longer wavelengths depending on the μ|| value. Replacing the CH3O substituent with the longer C6H13O unit did not change the absorption or PL spectra significantly owing to the similar μ|| values. These results clearly demonstrate that the electron-density distribution induced by the electron-withdrawing substituent is an important parameter for controlling the photophysical properties in the solution phase.
TD-DFT calculations revealed that the HOMO→LUMO transition corresponded with the lowest-energy excitation with a large oscillator strength. Considering that the energy gap between the HOMO and LUMO (ΔEH-L) in the S0 state decreases in the order 1aB (5.69 eV) > 1aC (5.55 eV) > 1aD (5.28 eV), increasing the μ|| value results in a narrower ΔEH-L and a shift of λabs towards longer wavelengths: 1aB (338 nm) < 1aC (347 nm) < 1aD (360 nm). ΔEH-L in the S1 state exhibited a similar tendency (1aB > 1aC > 1aD), corresponding to the order of the μ|| values. Thus, these results clearly indicate that the electronic transitions for absorption and PL can be controlled by tuning μ||.
The PL colors of luminophores with large μ|| values have often been reported to show obvious variations depending on the solvent polarity [40]. Therefore, we tested the PL sensing properties of CF3-substituted 1bC as a representative fluorinated bistolane in various solvents. Figure 6 shows the observed PL behavior, and the photophysical data are summarized in Table 2.
Irradiating 1bC at 343 nm in less polar toluene (ε = 2.38, where ε is a dielectric constant at 25 °C and an indicator of solvent polarity [40]) produced deep-blue PL with a single PL band at λPL = 409 nm, which was shifted towards shorter wavelengths by 0.282 eV compared with the λPL in CH2Cl2 (ε = 8.93). In contrast, dramatic shifts towards longer wavelengths were observed when more polar solvents, e.g., MeCN (ε = 35.9) and DMF (ε = 36.7), were employed; based on the CIE diagram, greenish-yellow PL was observed in both cases. Although THF (ε = 7.58) is less polar than CH2Cl2, the PL band (λPL = 482 nm) was shifted towards longer wavelengths by 0.177 eV. The unique PL behavior in THF is likely due to the oxygen atom, which allows THF to easily solvate 1bC with its large μ|| value through intermolecular interactions, such as hydrogen bonding, and may promote the nonradiative deactivation from the S1 to the S0 state [41,42,43]. Consequently, it was successfully demonstrated that the fluorinated bistolanes can be applied as PL sensing materials for solvent polarity.
3.5. PL Behavior in the Crystal Phase
To our delight, we found that 1aB–D and 1bB–D crystals prepared by recrystallization via a slow evaporation technique exhibited PL. Figure 7 shows the obtained PL spectra acquired, and the photophysical data are listed in Table 3.
As shown in Figure 7a,b, λPL changed dramatically depending on the electron-withdrawing substituent, even in crystals: 414–420 nm (deep-blue PL) for AcO-substituted 1aB and 1bB, 459–479 nm (blue to light-blue PL) for CF3-substituted 1aC and 1bC, and 500–526 nm (yellowish-green PL) for CN-substituted 1aD and 1bD. Compared with the λPL values in CH2Cl2 solution, those observed for the crystals were slightly shifted towards longer wavelengths, which may be due to quick deactivation via nonradiative processes owing to intermolecular interactions in the condensed phases. As discussed above, exchanging the CH3O group for a longer C6H13O moiety did not have a significant effect on the electronic structure; however, an intriguing band shift of 0.113 eV for 1aC vs. 1bC and 0.123 eV for 1aD vs. 1bD was observed. According to our previous reports [21,23], this change in the PL behavior likely originates from a dramatic change in the aggregated structure induced by the difference in alkoxy chain length. Similar to the trend observed for the PL in CH2Cl2 solution, a relatively strong correlation was observed between μ|| and λPL in the crystals. These results demonstrate that the PL behavior of the fluorinated bistolanes can also be modulated in crystal by controlling μ|| via the electron-withdrawing character of the terminal substituent.
3.6. PL Behavior in the LC Phase
Finally, owing to the fluorinated bistolanes possessing LC phases and unique PL characteristics, we examined the PL behavior in the LC phase under thermal conditions. As representative examples, frozen LC samples of 1bB, 1bC, and 1bD were obtained by rapid cooling in a dry-ice bath after a suitable LC phase was observed. The obtained PL spectra are shown in Figure 8.
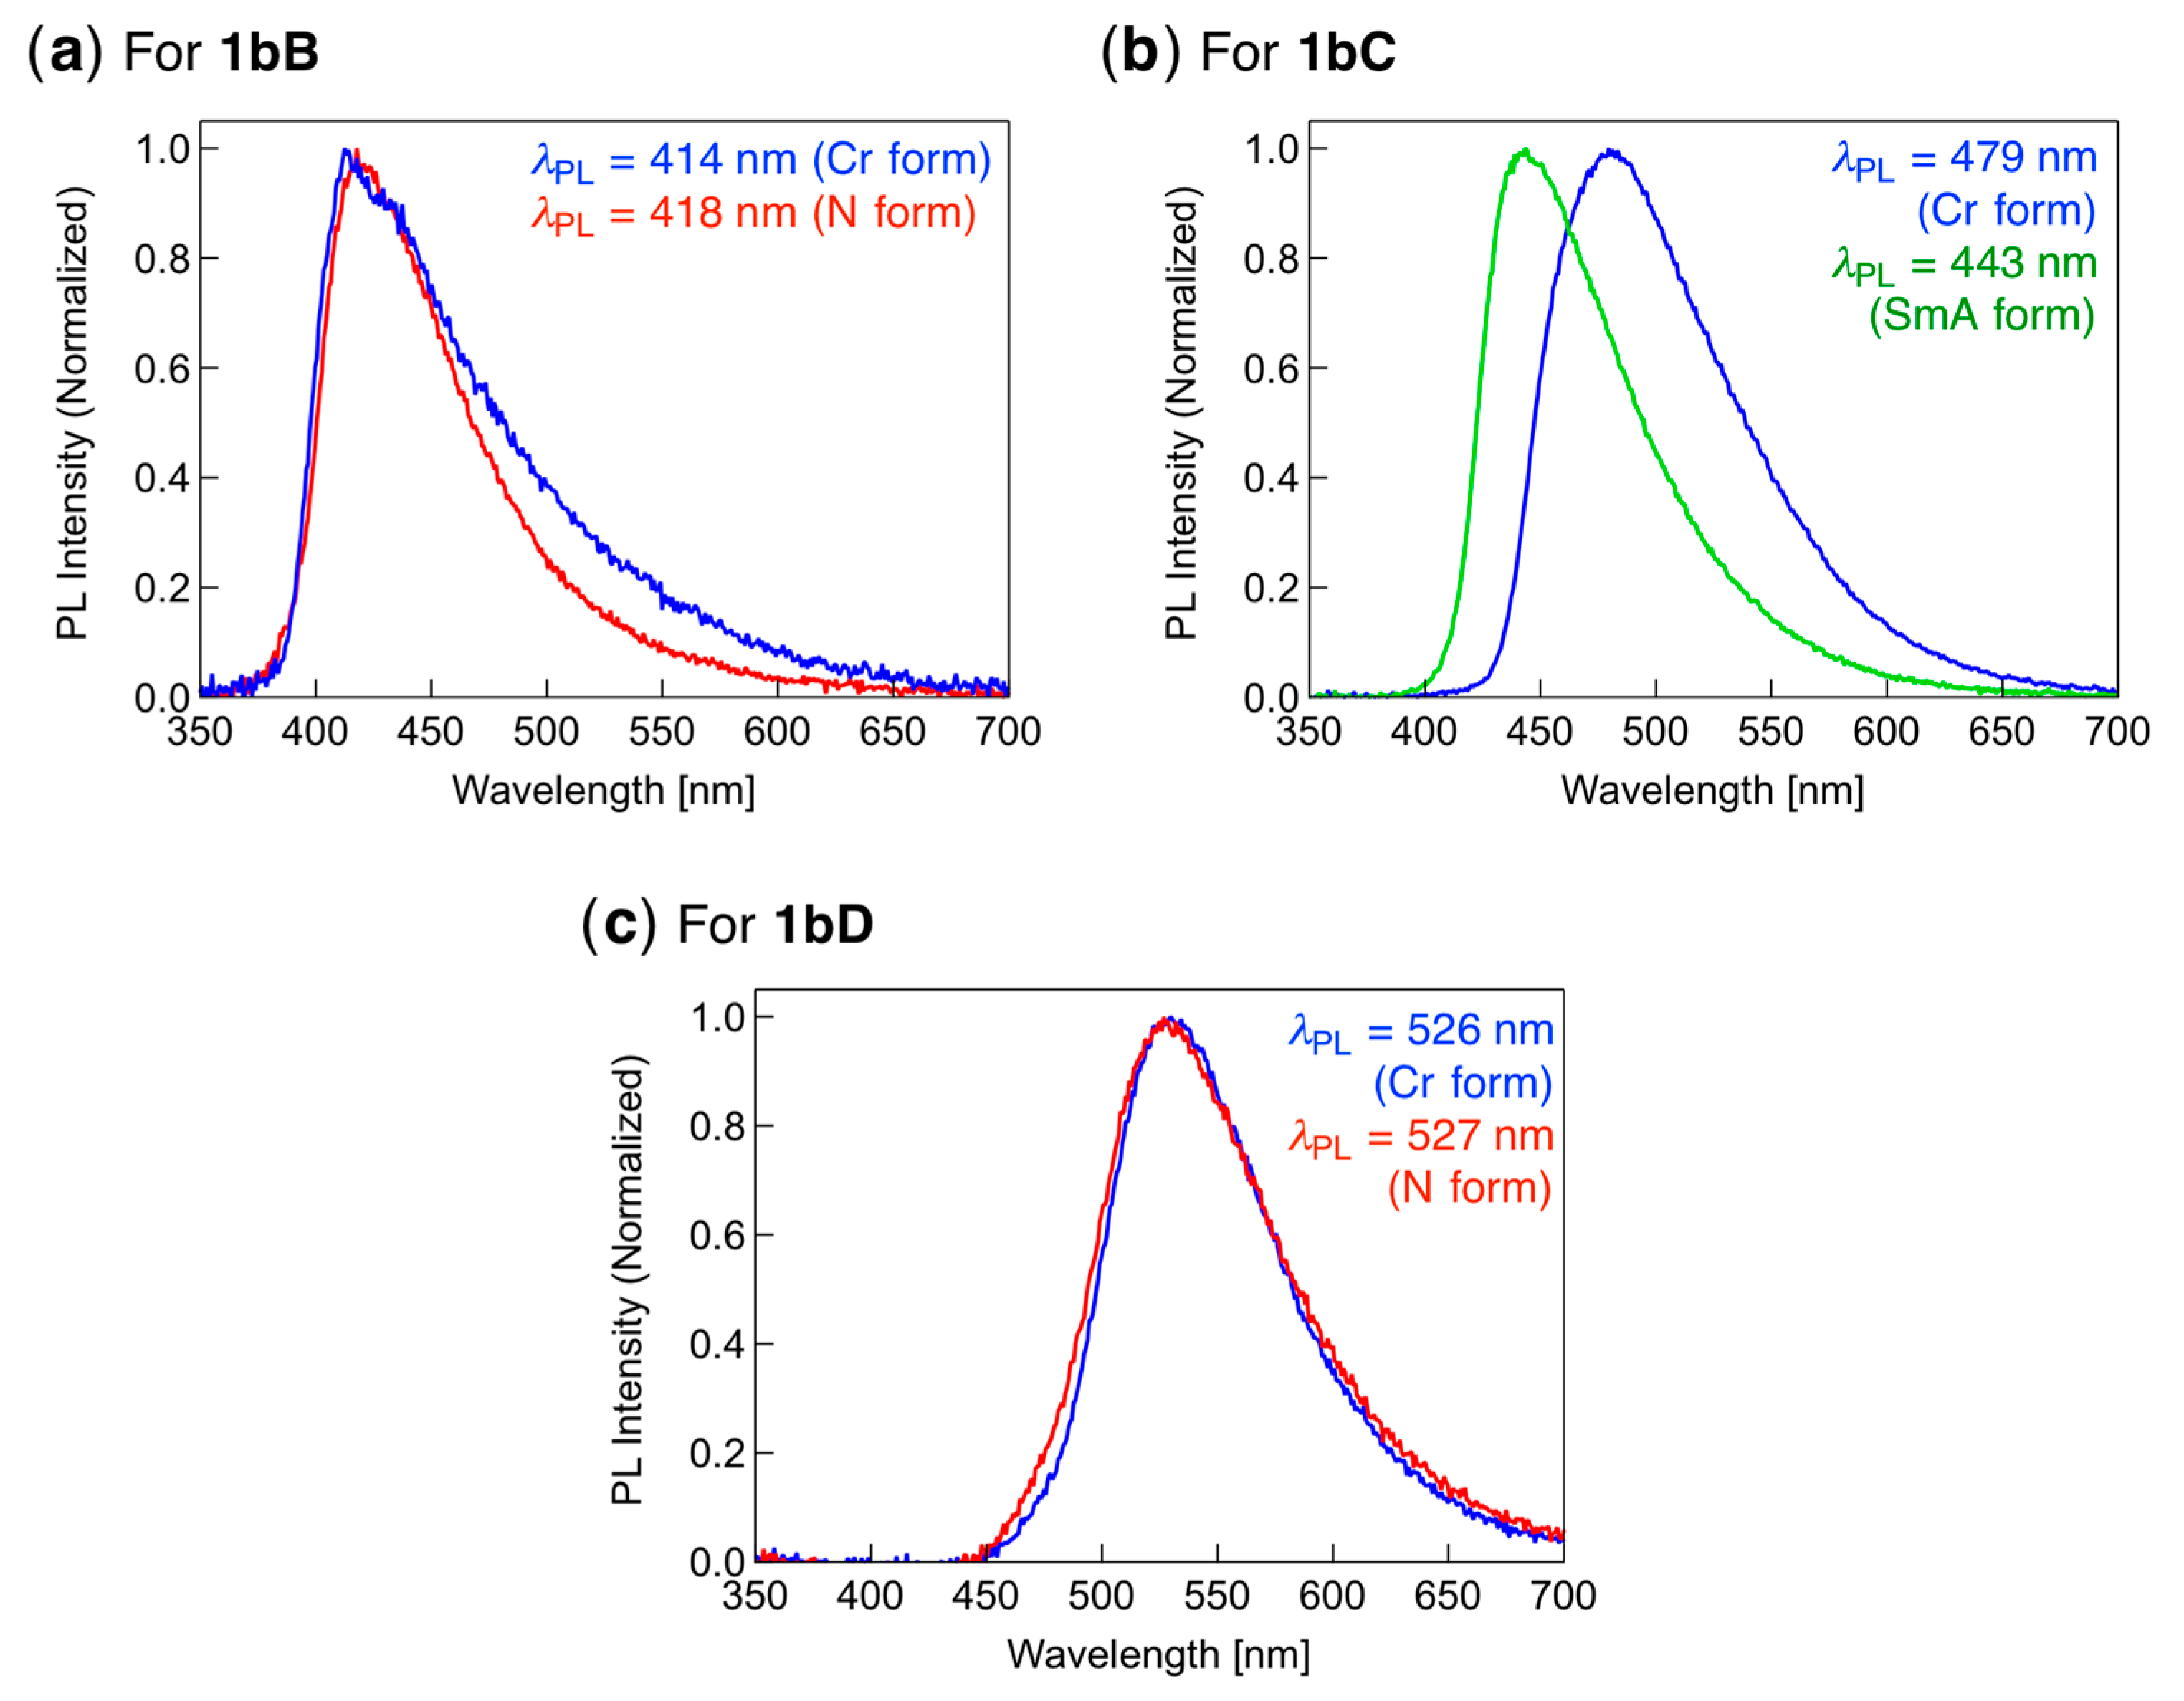
When the N LC samples of AcO-substituted 1bB and CN-substituted 1bD were irradiated at 320 nm light, single PL bands were observed at λPL = 418 and 527 nm, respectively, which were almost identical to those in the Cr phase (Figure 8a,c). Interestingly, as shown in Figure 8b, the initial Cr sample of CF3-substituted 1bC showed light-blue PL (λPL = 479 mm), but a significant shift to shorter wavelengths was observed after the phase transition to the SmA phase, leading to deep-blue PL (λPL = 443 nm), which is almost identical to that in CH2Cl2 solution. It is anticipated that rearrangement of the molecular aggregates during the Cr → SmA phase transition results in loose molecular packing owing to thermally activated molecular motion and monomeric emission characteristics. Accordingly, it can be concluded that the PL of fluorinated bistolanes can be controlled not only by tuning the electron-density distribution but also by modulating molecular aggregation through thermal phase transitions, which is a promising approach for realizing functional PL sensing materials, such as PL thermometers.
4. Conclusions
In conclusion, we designed and synthesized fluorinated bistolanes with an alkoxy substituent at one molecular terminal and various electron-withdrawing substituent at the other terminal via a four-step protocol. The phase transition temperatures of the fluorinated bistolanes were found to depend significantly on the terminal substituent, with the LC behavior affected by both the steric and electronic nature of the substituent. The PL behavior in solution clearly revealed that both λPL and the PL color changed dramatically depending on the μ|| value. The present fluorinated bistolanes also showed relatively strong PL in the crystal phase, with the PL behavior modulated not only by μ|| but also by molecular aggregation. Notably, the PL emission of a CF3-substituted fluorinated bistolane was significantly shifted towards shorter wavelengths by 0.210 eV via a phase transition from the Cr to the SmA LC phase. As the PL behavior of the fluorinated bistolanes can be tuned by the electron-density distribution as well as the aggregated structure in condensed phases, this molecular design approach offers a useful method for fabricating PL materials that can be easily tuned by using molecular properties or external stimuli.
Supplementary Materials
The following are available online at https://www.mdpi.com/2076-3417/9/9/1905/s1, Figures S1–S18: NMR spectra, Table S1: crystallographic data, Figure S19: DSC thermograms, Tables S2–S6: phase transition behavior and thermodynamic parameter, Figure S20: photophysical spectra in solution, Figure S21: comparison between calculated and experimental UV-vis spectra, Figure S22: photophysical spectra in crystal, Figure S23: PL spectra in LC phases, Figures S24–S34: HOMO and LUMO diagram, Tables S7–S18: cartesian coordinate for calculated molecules.
Author Contributions
Conceptualization, S.Y.; methodology, S.Y. and M.M.; investigation, S.Y., M.M., T.A., T.K. (Toshio Kubota) and T.K. (Tsutomu Konno); writing—original draft preparation, S.Y., M.M. and T.K. (Tsutomu Konno); writing—review and editing, S.Y., M.M., T.A., T.K. (Toshio Kubota) and T.K. (Tsutomu Konno); visualization, S.Y. and M.M.; supervision, S.Y.; project administration, S.Y.; funding acquisition, S.Y.
Funding
This research was funded by JSPS KAKENHI, Grant-in-Aid for Scientific Research (C) (Grant No. JP18K05262).
Acknowledgments
We sincerely acknowledge Kensuke Naka and Hiroaki Imoto (Kyoto Institute of Technology) and Osamu Tsutsumi (Ritsumeikan University) for the PL measurements in the crystal phase.
Conflicts of Interest
The authors declare no conflict of interest.
References
- Yang, Y.; Zhao, Q.; Feng, W.; Li, F. Luminescent chemodosimeters for bioimaging. Chem. Rev. 2013, 113, 192–270. [Google Scholar] [CrossRef]
- Bünzli, J.-C.G. Lanthanide luminescence for biomedical analyses and imaging. Chem. Rev. 2010, 110, 2729–2755. [Google Scholar] [CrossRef]
- Hemmer, E.; Acosta-Mora, P.; Méndez-Ramos, J.; Fischer, S. Optical nanoprobes for biomedical applications: Shining a light on upconverting and near-infrared emitting nanoparticles for imaging, thermal sensing, and photodynamic therapy. J. Mater. Chem. B 2017, 5, 4365–4392. [Google Scholar] [CrossRef]
- Hou, J.-T.; Ren, W.X.; Li, K.; Seo, J.; Sharma, A.; Yu, X.-Q.; Kim, J.S. Fluorescent bioimaging of pH: From design to applications. Chem. Soc. Rev. 2017, 46, 2076–2090. [Google Scholar] [CrossRef]
- Zhou, J.; Feng, W.; Sun, Y.; Li, F. Upconversion luminescent materials: Advances and applications. Chem. Rev. 2015, 115, 395–465. [Google Scholar] [CrossRef]
- Bui, T.-T.; Goubard, F.; Ibrahim-Ouali, M.; Gigmes, D.; Dumur, F. Recent advances on organic blue thermally activated delayed fluorescence (TADF) emitters for organic light-emitting diodes (OLEDs). Beilstein J. Org. Chem. 2018, 14, 282–308. [Google Scholar] [CrossRef] [Green Version]
- Jhulki, S.; Moorthy, J.N. Small molecular hole-transporting materials (HTMs) in organic light-emitting diodes (OLEDs): Structural diversity and classification. J. Mater. Chem. C 2018, 6, 8280–8325. [Google Scholar] [CrossRef]
- Grimsdale, A.C.; Chan, K.L.; Martin, R.E.; Jokisz, P.G.; Holmes, A.B. Synthesis of light-emitting conjugated polymers for applications in electroluminescent devices. Chem. Rev. 2009, 109, 897–1091. [Google Scholar] [CrossRef]
- Leung, N.L.C.; Xie, N.; Yuan, W.; Liu, Y.; Wu, Q.; Peng, Q.; Miao, Q.; Lam, J.W.Y.; Tang, B.Z. Restriction of intramolecular motions: The general mechanism behind aggregation-induced emission. Chem. Eur. J. 2014, 20, 15349–15353. [Google Scholar] [CrossRef]
- Shen, P.; Zhuang, Z.; Zhao, Z.; Tang, B.Z. AIEgens based on main group heterocycles. J. Mater. Chem. C 2018, 6, 11835–11852. [Google Scholar] [CrossRef]
- He, Z.; Ke, C.; Tang, B.Z. Journey of aggregation-induced emission research. ACS Omega 2018, 3, 3267–3277. [Google Scholar] [CrossRef]
- Kirsch, P. Modern Fluoroorganic Chemistry: Synthesis, Reactivity, Applications, 2nd ed.; Wiley-VCH: Weinheim, Germany, 2013; pp. 7–21. [Google Scholar]
- O’Hagan, D. Understanding organofluorine chemistry. An introduction to the C–F bond. Chem. Soc. Rev. 2008, 37, 308–319. [Google Scholar] [CrossRef]
- Konno, T. Trifluoromethylated internal alkynes: Versatile building blocks for the preparation of various fluorine-containing molecules. Synlett 2014, 25, 1350–1370. [Google Scholar] [CrossRef]
- Konno, T. Trifluoromethyl (CF3) group insertion methods in stereoselective synthesis. In Stereoselective Synthesis of Drugs and Natural Products; Andrunshko, V., Andrunshko, N., Eds.; John Wiley & Sons: Hoboken, NJ, USA, 2013; pp. 769–806. [Google Scholar]
- Yamada, S.; Konno, T. New types of negative dielectric anisotropy liquid crystals: Synthesis of CF2CF2-carbocyclic mesogens and an evaluation of their liquid crystal characteristics. In Chemical Elements (Fluorine, Rhodium and Rubidium): Properties, Synthesis and Applications; Huff, A., Ed.; Nova Science Publishers: New York, NY, USA, 2018; pp. 53–92. [Google Scholar]
- Tamamoto, K.; Yamada, S.; Konno, T. Practical tetrafluoroethylene fragment installation through a coupling reaction of (1,1,2,2-tetrafluorobut-3-en-1-yl)zinc bromide with various electrophiles. Beilstein J. Org. Chem. 2018, 14, 2375–2383. [Google Scholar] [CrossRef]
- Yamada, S.; Mitsuda, A.; Miyano, K.; Tanaka, T.; Morita, M.; Agou, T.; Kubota, T.; Konno, T. Development of novel solid-state light-emitting materials based on pentafluorinated tolane fluorophores. ACS Omega 2018, 3, 9105–9113. [Google Scholar] [CrossRef]
- Yamada, S.; Miyano, K.; Agou, T.; Kubota, T.; Konno, T. 2-Chloroalkoxy-substituted pentafluorinated bistolanes as novel light-emitting liquid crystals. Crystals 2019, 9, 195. [Google Scholar] [CrossRef]
- Yamada, S.; Tanaka, T.; Ichikawa, T.; Konno, T. Novel V- and Y-shaped light-emitting liquid crystals with pentafluorinated bistolane-based luminophores. ACS Omega 2019, 4, 3922–3932. [Google Scholar] [CrossRef]
- Yamada, S.; Morita, M.; Agou, T.; Kubota, T.; Ichikawa, T.; Konno, T. Thermoresponsive luminescence properties of polyfluorinated bistolane-type light-emitting liquid crystals. Org. Biomol. Chem. 2018, 16, 5609–5617. [Google Scholar] [CrossRef] [PubMed]
- Yamada, S.; Morita, M.; Konno, T. Multi-color photoluminescence induced by electron-density distribution of fluorinated bistolane derivatives. J. Fluorine Chem. 2017, 202, 54–64. [Google Scholar] [CrossRef]
- Yamada, S.; Miyano, K.; Konno, T.; Agou, T.; Kubota, T.; Hosokai, T. Fluorine-containing bistolanes as light-emitting liquid crystalline molecules. Org. Biomol. Chem. 2017, 15, 5949–5958. [Google Scholar] [CrossRef]
- Sheldrick, G.M. Crystal structure refinement with SHELXL. Acta Crystallogr. 2015, C71, 3–8. [Google Scholar] [CrossRef]
- Frish, M.J.; Trucks, G.W.; Schlegel, H.B.; Scuseria, G.E.; Robb, M.A.; Cheeseman, J.R.; Scalmani, G.; Barone, V.; Mennucci, B.; Peterson, G.A.; et al. Gaussian 09, Revision C.01; Gaussian, Inc.: Wallingford, CT, USA, 2013. [Google Scholar]
- Yanai, T.; Tew, D.P.; Handy, N.C. A new hybrid exchange–correlation functional using the Coulomb-attenuating method (CAM-B3LYP). Chem. Phys. Lett. 2004, 393, 51–57. [Google Scholar] [CrossRef] [Green Version]
- Okuno, K.; Shigeta, Y.; Kishi, R.; Nakano, M. Non-empirical tuning of CAM-B3LYP functional in time-dependent density functional theory for excitation energies of diarylethene derivatives. Chem. Phys. Lett. 2013, 585, 201–206. [Google Scholar] [CrossRef]
- Andzelm, J.; Kölmel, C.; Klamt, A. Incorporation of solvent effects into density functional calculations of molecular energies and geometries. J. Chem. Phys. 1995, 103, 9312–9320. [Google Scholar] [CrossRef]
- Barone, V.; Cossi, M. Quantum calculation of molecular energies and energy gradients in solution by a conductor solvent model. J. Phys. Chem. A 1998, 102, 1995–2001. [Google Scholar] [CrossRef]
- Cossi, M.; Rega, N.; Scalmani, G.; Barone, V. Energies, structures, and electronic properties of molecules in solution with the C-PCM solvation model. J. Comput. Chem. 2003, 24, 669–681. [Google Scholar] [CrossRef]
- Misra, R.; Bhattacharyya, S.P. Intramolecular Charge Transfer: Theory and Applications; Wiley-VCH: Weinheim, Germany, 2018; pp. 4–19. [Google Scholar]
- Liu, C.; Zhao, H.; Zhao, H.; Wang, Z.; Zhang, B. Base-promoted direct and highly selective alkynylation of electron-deficient ocatafluorotoluene. RSC Adv. 2015, 5, 31993–31997. [Google Scholar] [CrossRef]
- Levitus, M.; Schmieder, K.; Ricks, H.; Shimizu, K.D.; Bunz, U.H.F.; Garcia-Garibay, M.A. Steps to demarcate the effects of chromophore aggregation and planarization in poly(phenyleneethynylene)s. 1. Rotationally interrupted conjugation in the excited states of 1,4-bis(phenylethynyl)benzene. J. Am. Chem. Soc. 2001, 123, 4259–4265. [Google Scholar] [CrossRef]
- Bondi, A. van der Waals volumes and radii. J. Phys. Chem. 1964, 68, 441–451. [Google Scholar] [CrossRef]
- Mooibroek, T.J.; Gamez, P.; Reedijk, J. Lone pair–π interactions: A new supramolecular bond? CrystEngComm 2008, 10, 1501–1515. [Google Scholar] [CrossRef]
- Neel, A.J.; Hilton, M.J.; Sigman, M.S.; Toste, F.D. Exploiting non-covalent π interactions for catalyst design. Nature 2017, 543, 637–646. [Google Scholar] [CrossRef] [Green Version]
- Hird, M.; Toyne, K.J.; Goodby, J.W.; Gray, G.W.; Minter, V.; Tuffin, R.P.; McDonnell, D.G. Synthesis, mesomorphic behaviour and optical anisotropy of some novel materials for nematic mixtures of high birefringence. J. Mater. Chem. 2004, 14, 1731–1743. [Google Scholar] [CrossRef]
- Seed, A.J.; Toyne, K.J.; Goodby, J.W.; Hird, M. Synthesis, transition temperatures, and optical properties of various 2,6-disubstituted naphthalenes and related 1-benzothiophenes with butylsulfanyl and cyano or isothiocyanato terminal groups. J. Mater. Chem. 2000, 10, 2069–2080. [Google Scholar] [CrossRef]
- Seed, A.J.; Toyne, K.J.; Goodby, J.W. Synthesis of the series of monofluoro-substituted 4-butylsulfanyl-4’-cyanobiphenyls and effect of the position of fluorine within the core on refractive indices, optical anisotropies, polarisabilities and order parameters. J. Mater. Chem. 1995, 5, 2201–2207. [Google Scholar] [CrossRef]
- Misra, R.; Bhattacharyya, S.P. Intramolecular Charge Transfer: Theory and Applications; Wiley-VCH: Weinheim, Germany, 2018; pp. 115–144. [Google Scholar]
- Li, M.; Han, J.; Zhao, H.; Liu, Z.; Ma, L.; Sun, C.; Yin, H.; Shi, Y. Investigation of the intermolecular hydrogen bonding effects on the intramolecular charge transfer process of coumarin 340 in tetrahydrofuran solvent. J. Cluster Sci. 2018, 29, 585–592. [Google Scholar] [CrossRef]
- Kukhta, N.A.; Volyniuk, D.; Grazulevicius, J.V.; Sini, G. Blue versus yellow emission in bipolar fluorenone derivatives: The impact of aggregation and hydrogen bonding. J. Mater. Chem. C 2018, 6, 1679–1692. [Google Scholar] [CrossRef]
- Kukhta, N.A.; da Silva Filho, D.A.; Volyniuk, D.; Grazulevicius, J.V.; Sini, G. Can fluorenone-based compounds emit in the blue region? Impact of the conjugation length and the ground-state aggregation. Chem. Mater. 2017, 29, 1695–1707. [Google Scholar] [CrossRef]
Figure 1.
Molecular structures used in (a) a previous study and (b) the present work. μ||: Calculated dipole moment along the long molecular axis.
Figure 1.
Molecular structures used in (a) a previous study and (b) the present work. μ||: Calculated dipole moment along the long molecular axis.
Scheme 1.
Synthetic procedures for fluorinated bistolanes 1aB–D and 1bB–D.
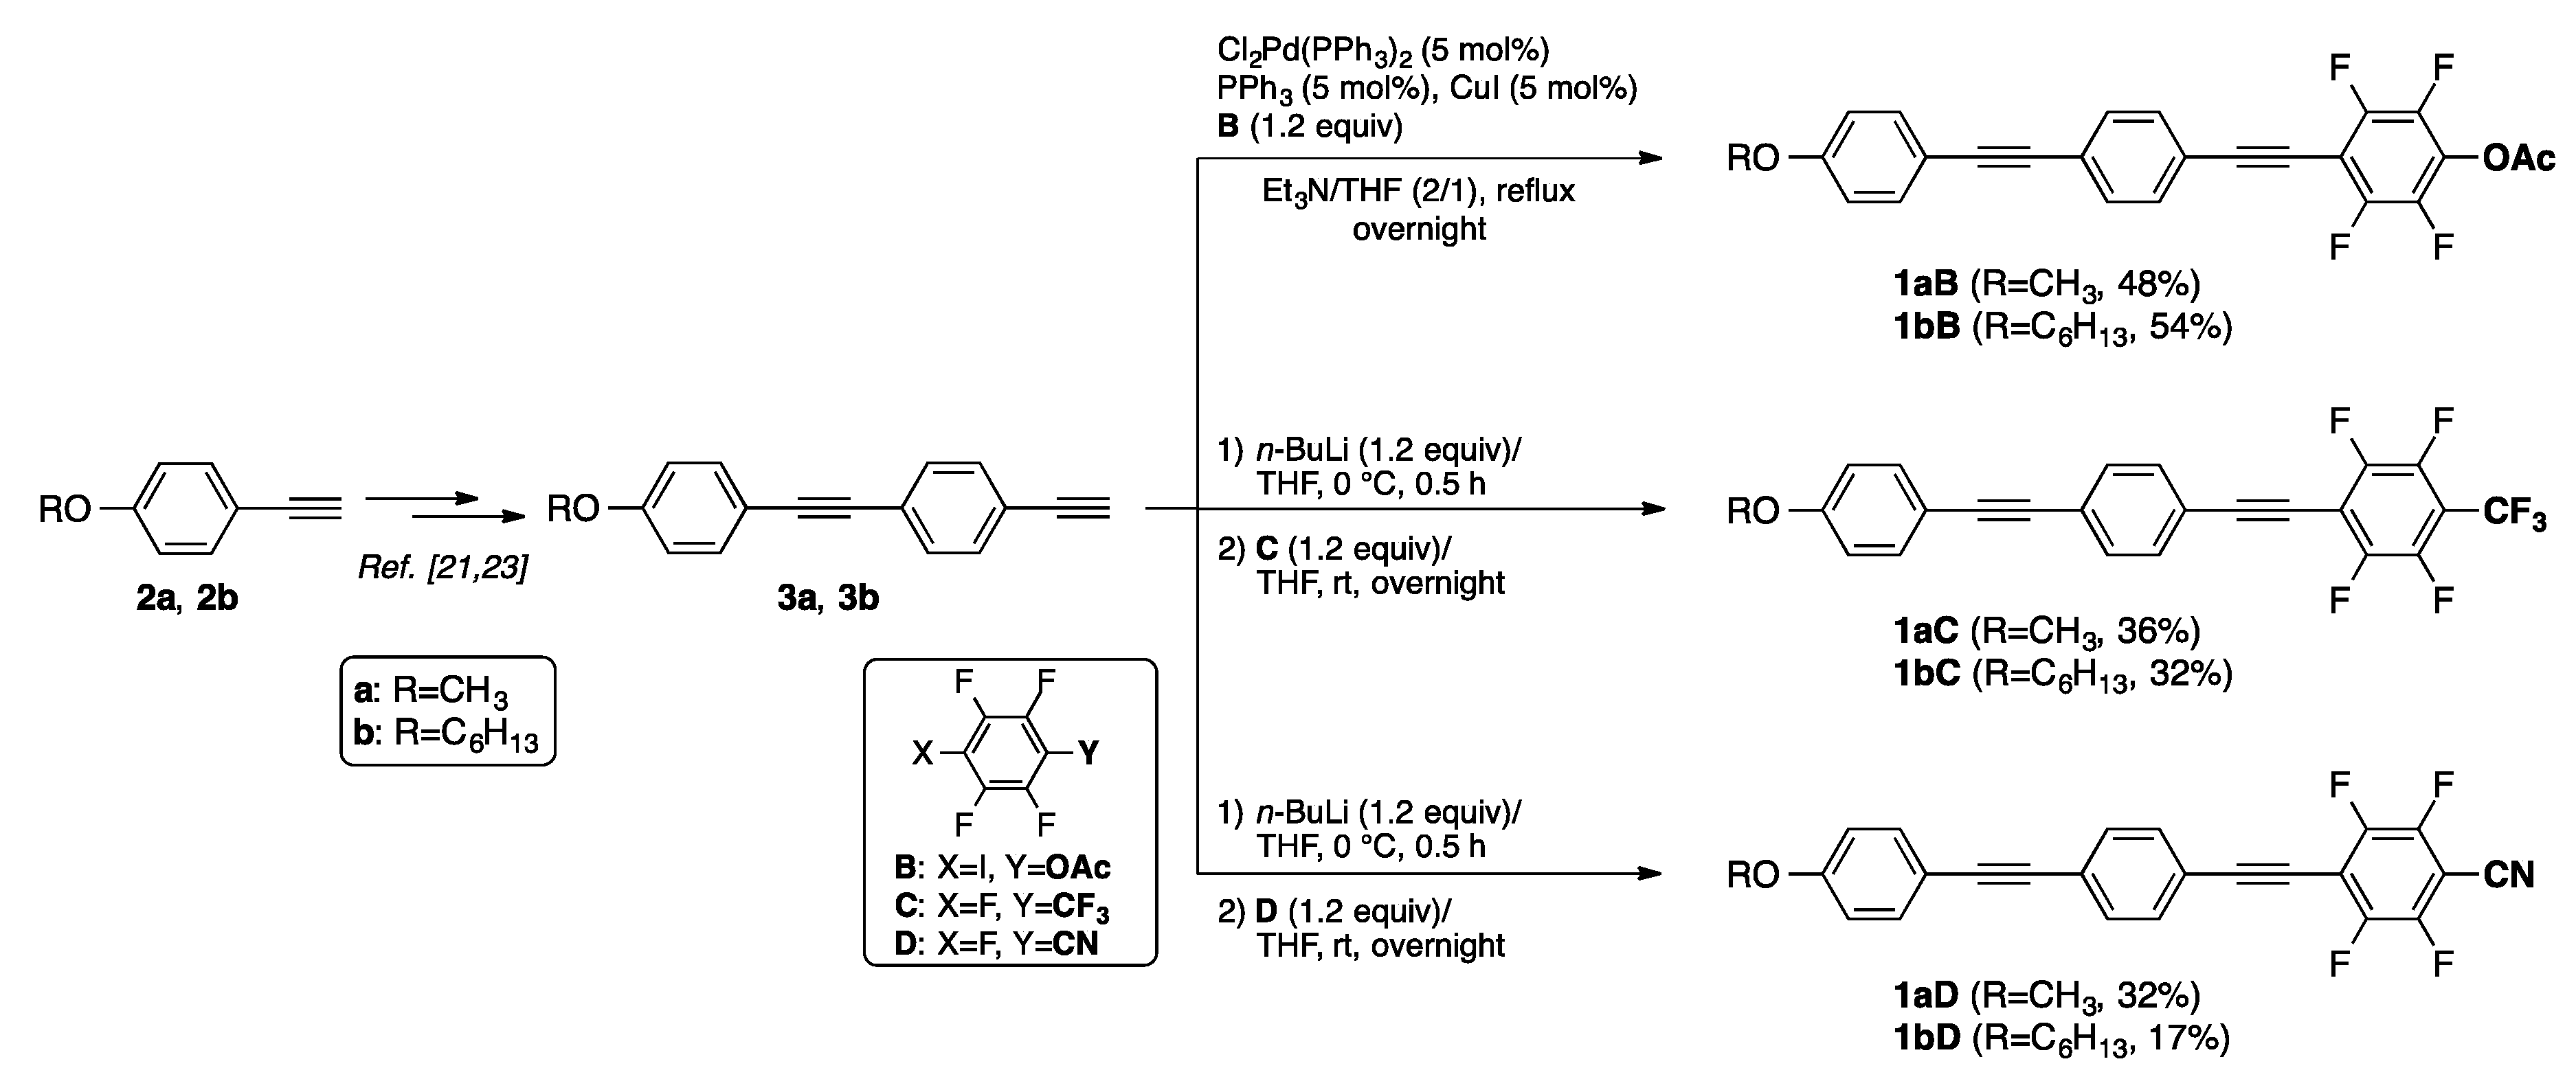
Figure 2.
Chemical structures of 1aB–D and their electrostatic potential maps, dipole moments (μ||) along the long molecular axis, isodensity surfaces with the color-bar (isovalue = 0.0004), and orbital energies for the HOMO and LUMO in the S1 state.
Figure 2.
Chemical structures of 1aB–D and their electrostatic potential maps, dipole moments (μ||) along the long molecular axis, isodensity surfaces with the color-bar (isovalue = 0.0004), and orbital energies for the HOMO and LUMO in the S1 state.

Figure 3.
Molecular and crystal structures of (a) 1aB and (c) 1aC. Packing structures of (b) 1aB and (d) 1aC. The light-blue lines in the packing structures indicate close contacts shorter than the sum of van der Waals radii (C: 170 pm, H: 120 pm, F: 148 pm).
Figure 3.
Molecular and crystal structures of (a) 1aB and (c) 1aC. Packing structures of (b) 1aB and (d) 1aC. The light-blue lines in the packing structures indicate close contacts shorter than the sum of van der Waals radii (C: 170 pm, H: 120 pm, F: 148 pm).
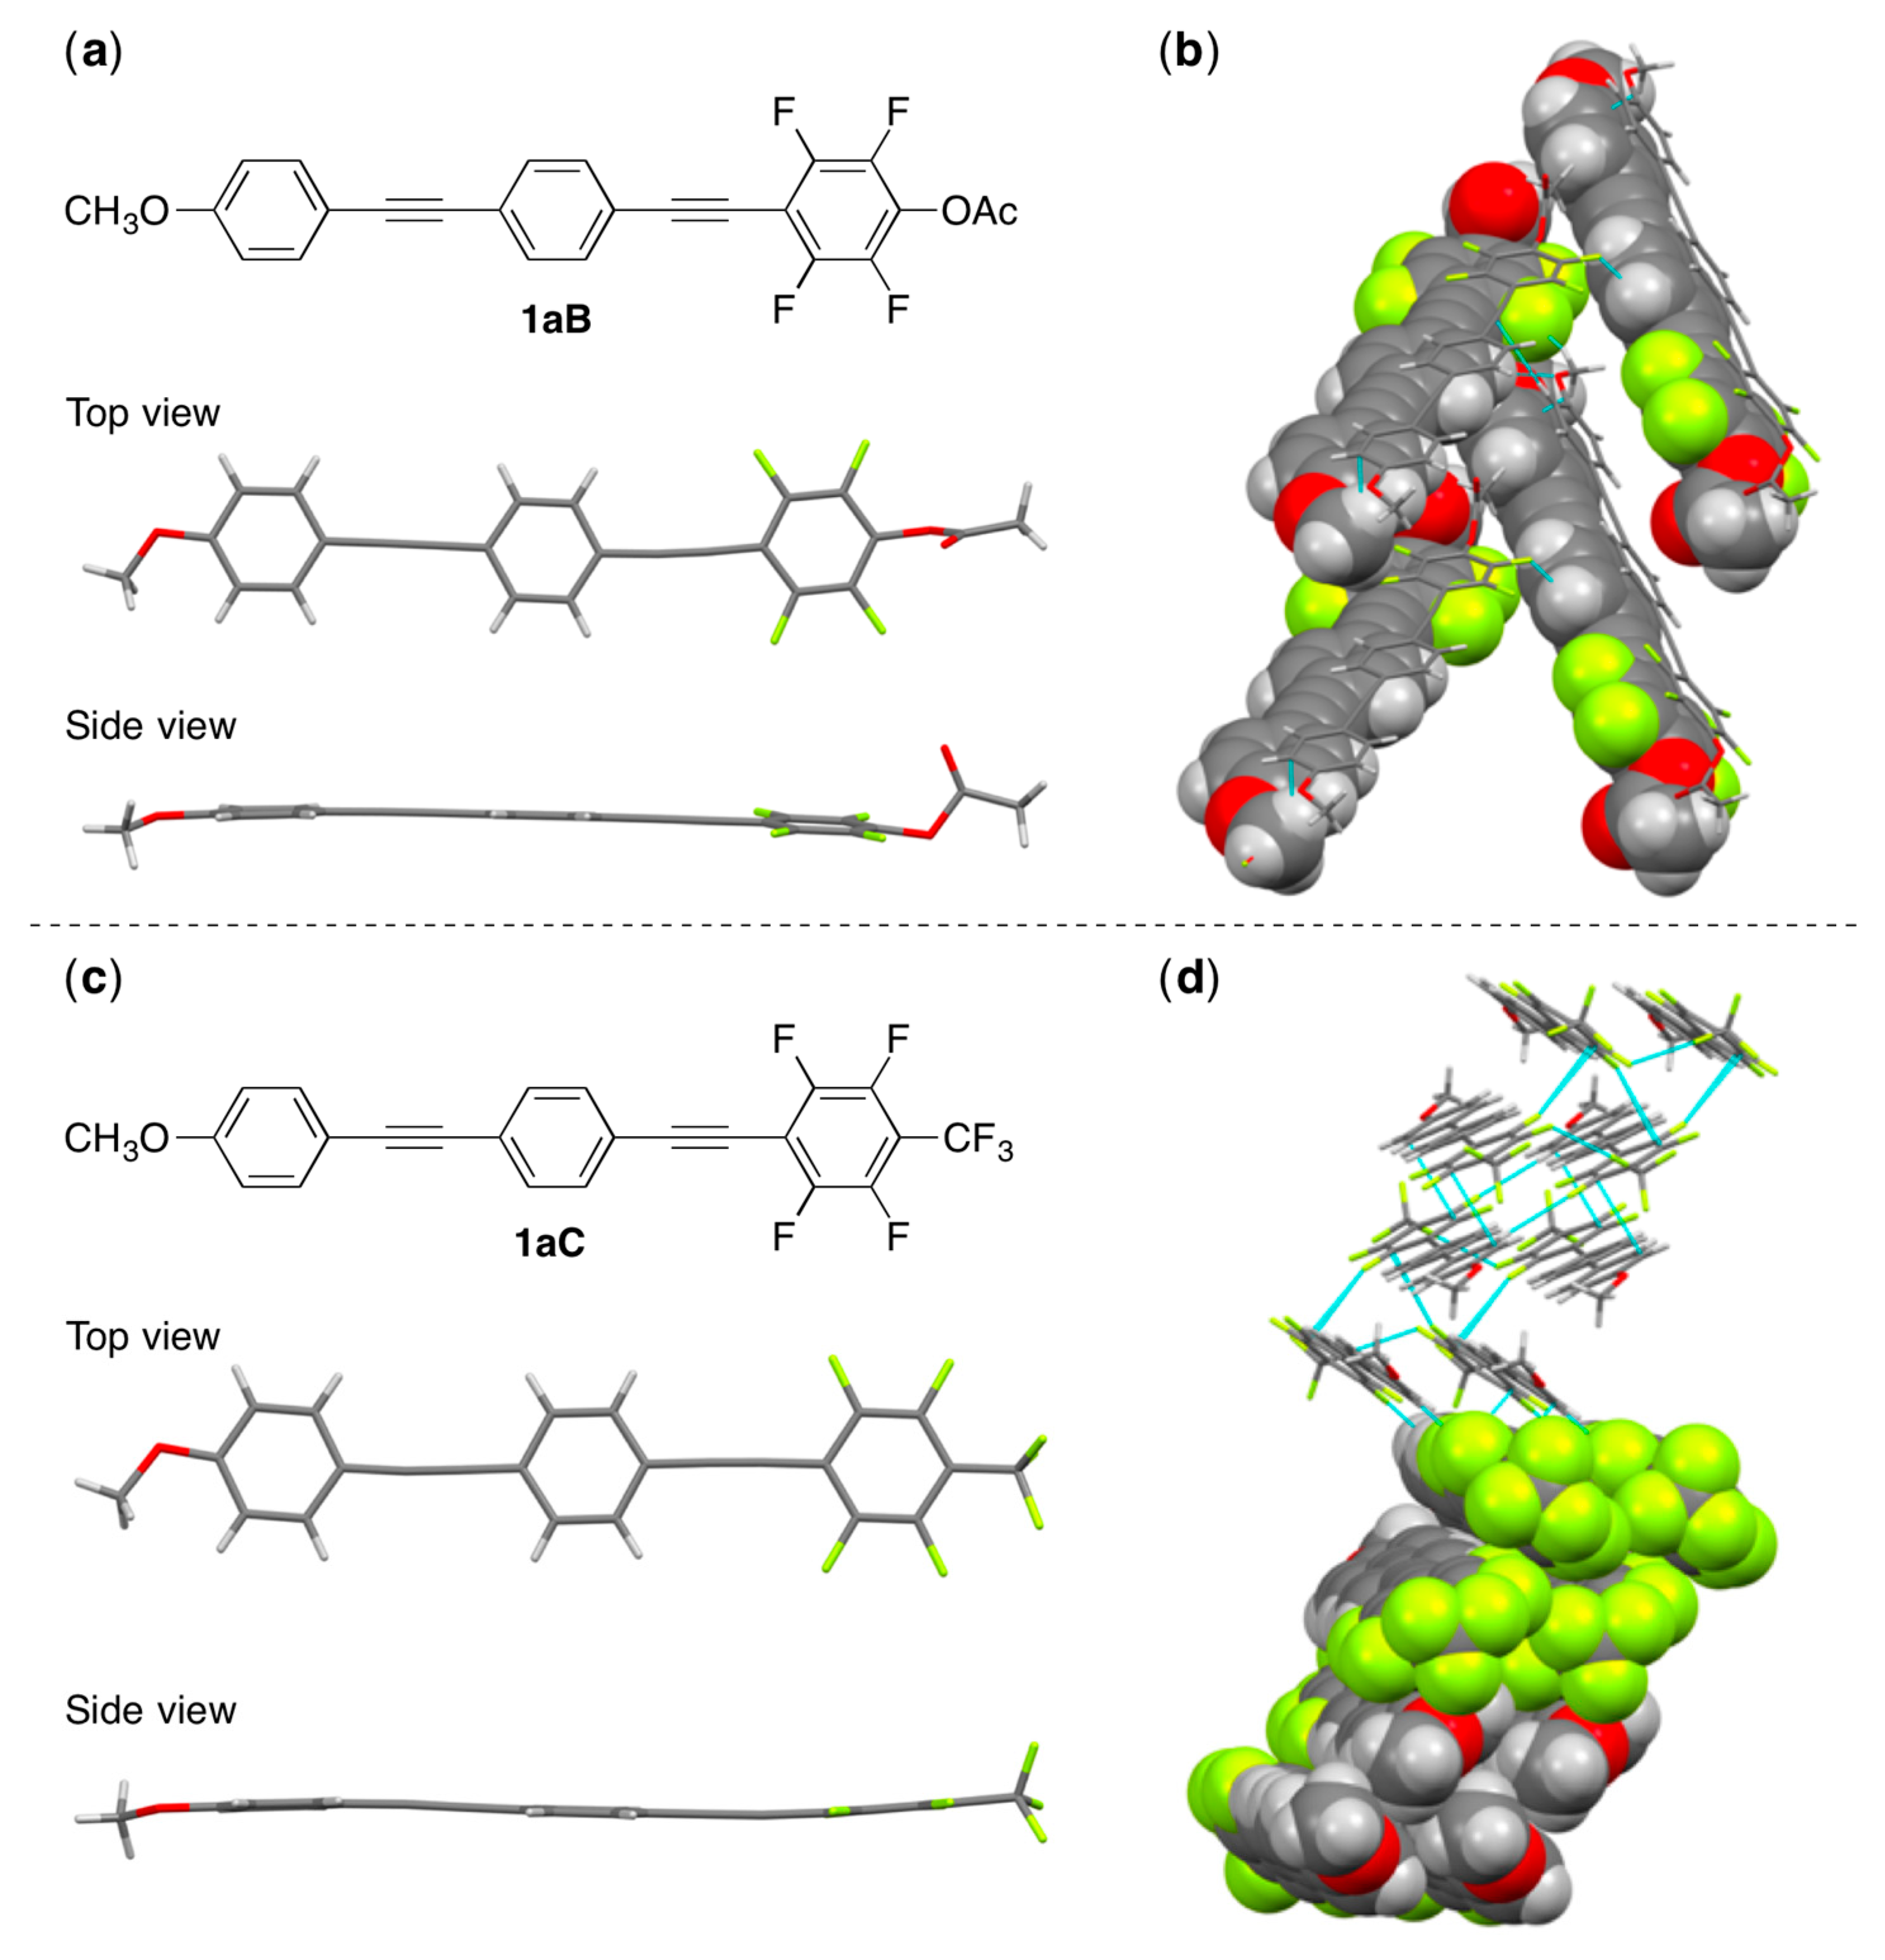
Figure 4.
Phase transition behavior of (a) 1aB–D and (b) 1bB–D during the 2nd heating [H] and cooling [C] processes. Abbreviations: Cr, crystal; SmA, smectic A; N, nematic; and Iso, isotropic phases. (c) Microphotographic images recorded by POM during the cooling process.
Figure 4.
Phase transition behavior of (a) 1aB–D and (b) 1bB–D during the 2nd heating [H] and cooling [C] processes. Abbreviations: Cr, crystal; SmA, smectic A; N, nematic; and Iso, isotropic phases. (c) Microphotographic images recorded by POM during the cooling process.

Figure 5.
(a) Absorption spectra of 1aB–D (solid lines) and 1bB–D (dashed lines) in CH2Cl2 (1.0 × 10⁻⁵ mol L−1); (b) photoluminescence (PL) spectra of 1aB–D (solid lines) and 1bB–D (dashed lines) in CH2Cl2 (1.0 × 10⁻⁶ mol L−1); (c) photographs under ultraviolet (UV) irradiation (λex = 365 nm) and CIE chromaticity diagram for the PL in CH2Cl2 solution.

Figure 6.
(a) PL spectra of 1bC in various solvents (concentration: 1.0 × 10⁻⁶ mol L−1); (b) photographs under UV irradiation (λex = 365 nm) and CIE chromaticity diagram for the PL in various solvents.
Figure 6.
(a) PL spectra of 1bC in various solvents (concentration: 1.0 × 10⁻⁶ mol L−1); (b) photographs under UV irradiation (λex = 365 nm) and CIE chromaticity diagram for the PL in various solvents.

Figure 7.
PL spectra of (a) 1aB–D and (b) 1bB–D crystals; (c) CIE chromaticity diagram calculated from the corresponding PL spectra.
Figure 7.
PL spectra of (a) 1aB–D and (b) 1bB–D crystals; (c) CIE chromaticity diagram calculated from the corresponding PL spectra.
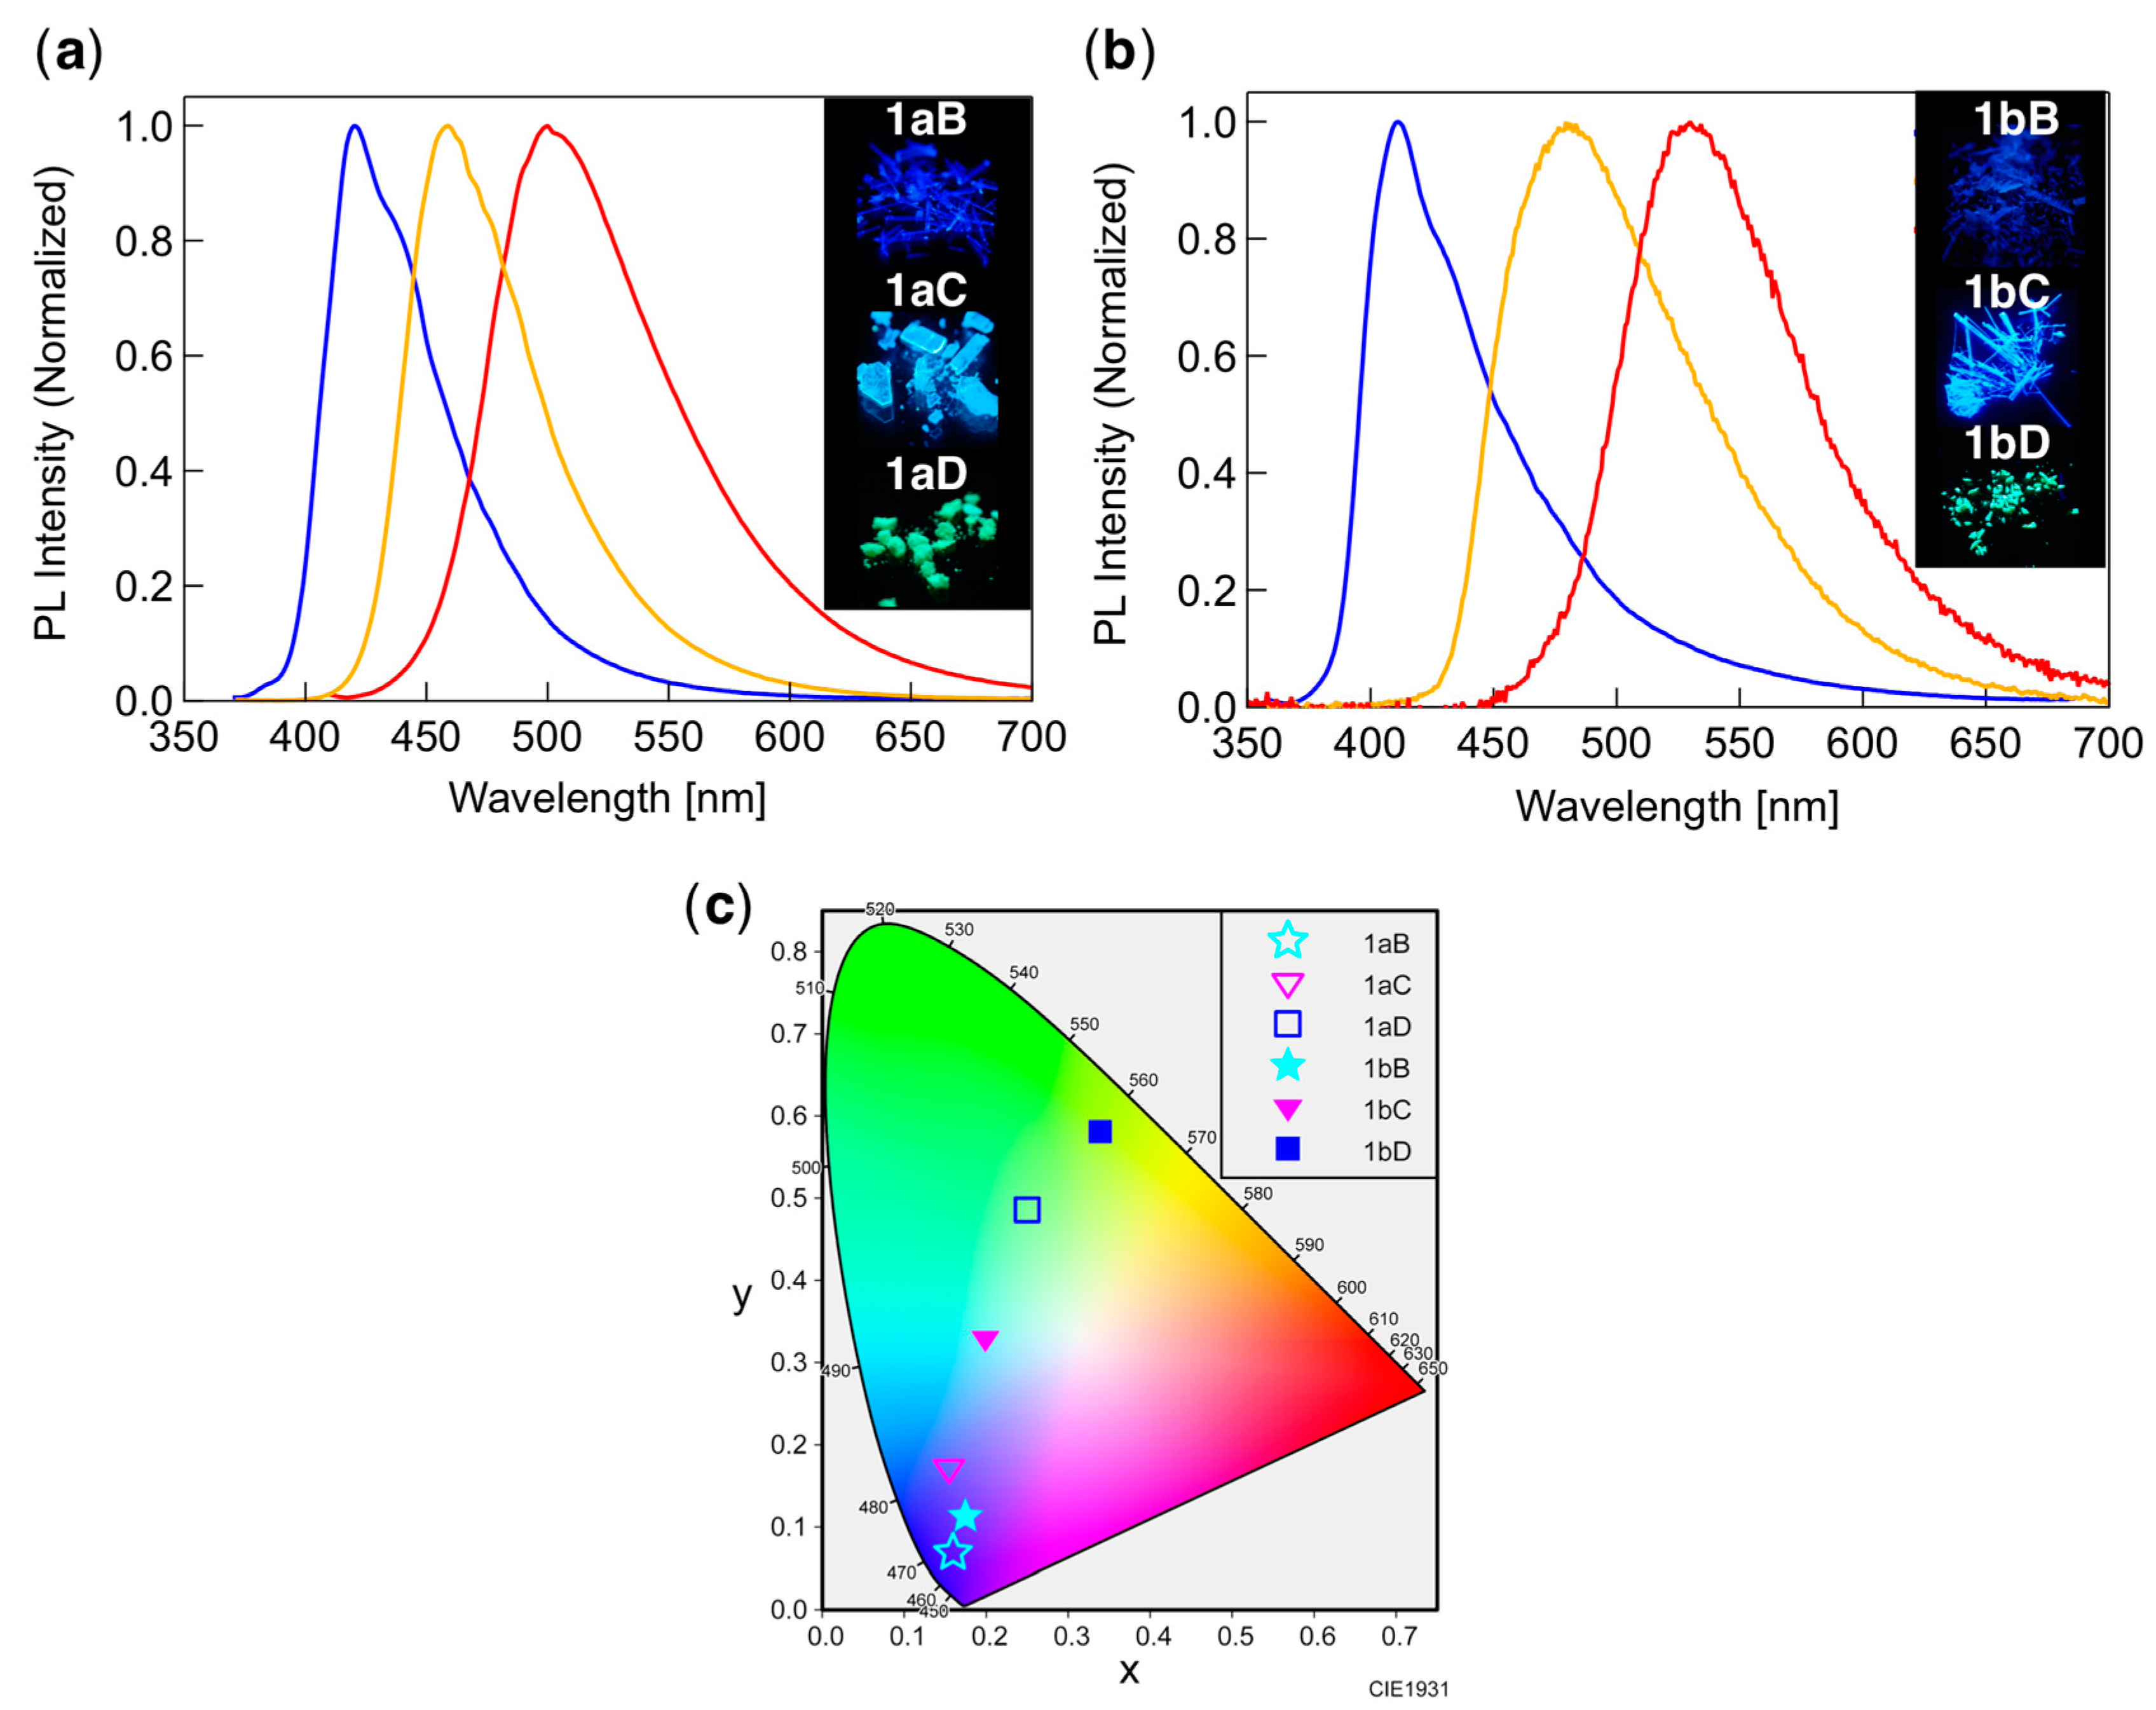
Figure 8.
PL spectra of the Cr and LC phases of (a) 1bB, (b) 1bC, and (c) 1bD upon excitation at 320 nm.
Figure 8.
PL spectra of the Cr and LC phases of (a) 1bB, (b) 1bC, and (c) 1bD upon excitation at 320 nm.

Table 1.
Photophysical data for 1aB–D and 1bB–D in CH2Cl2 solution.
| λabs (nm) 1 (ε) 2 | Ground (S0) State 3 | λPL (nm) 4 (ФPL) 4,5 | Excited (S1) State 6 | |||
|---|---|---|---|---|---|---|
| μ|| (D) | HOMO/LUMO (eV) | μ|| (D) | HOMO/LUMO (eV) | |||
| 1aB | 333 (55.2) | 1.91 | −7.09/−1.30 | 410 (0.85) | 3.48 | −6.74/−1.66 |
| 1aC | 341 (48.1) | 7.22 | −7.13/−1.58 | 444 (0.99) | 9.63 | −6.83/−1.94 |
| 1aD | 356 (46.7) | 9.67 | −7.15/−1.87 | 488 (0.91) | 12.2 | −6.86/−2.19 |
| 1bB | 335 (54.5) | 2.27 | −7.07/−1.29 | 414 (0.86) | 3.93 | −6.72/−1.65 |
| 1bC | 343 (52.5) | 7.51 | −7.12/−1.58 | 451 (0.95) | 10.0 | −6.81/−1.94 |
| 1bD | 360 (44.8) | 9.95 | −7.13/−1.86 | 493 (0.87) | 12.6 | −6.84/−2.19 |
1 Concentration of the solution: 1.0 × 10⁻⁵ mol L−1. 2 Molar extinction coefficient (10−3 L mol−1 cm−1). 3 Obtained by DFT calculations at the CAM-B3LYP/6-31+G(d) level of theory. 4 Concentration of the solution: 1.0 × 10⁻⁶ mol L−1. 5 Measured using a calibrated integrating sphere system. 6 Obtained by TD-DFT calculations at the CAM-B3LYP/6-31+G(d) level of theory.
Table 2.
Photophysical properties of 1bC in various solvents.
| Solvent (ε) 1 | Toluene (2.38) | THF (7.58) | CH2Cl2 (8.93) | MeCN (35.9) | DMF (36.7) |
|---|---|---|---|---|---|
| λPL (nm) 2 | 409 | 482 | 451 | 518 | 523 |
| ФPL 3 | 0.79 | 0.55 | 0.95 | 0.58 | 0.40 |
1 ε: Dielectric constant at 25 °C. 2 Concentration of the solution: 1.0 × 10⁻⁶ mol L−1. 3 Measured using a calibrated integrating sphere system.
Table 3.
Photophysical properties of 1aB–D and 1bB–D crystals.
| Compound | λPL (nm) 1 | ФPL 2 |
|---|---|---|
| 1aB | 420 | 0.48 |
| 1aC | 459 | 0.80 |
| 1aD | 500 | 0.36 |
| 1bB | 414 (418) | 0.17 |
| 1bC | 479 (443) | 0.73 |
| 1bD | 526 (527) | 0.31 |
1 Upon excitation at 358 nm for 1aB, 361 nm for 1aC, 400 nm for 1aD, and 320 nm for 1bB–D. The values in parentheses are the PL maximum wavelengths in the LC state upon excitation at 320 nm. 2 Measured using a calibrated integrating sphere system.
© 2019 by the authors. Licensee MDPI, Basel, Switzerland. This article is an open access article distributed under the terms and conditions of the Creative Commons Attribution (CC BY) license (http://creativecommons.org/licenses/by/4.0/).
Share and Cite
MDPI and ACS Style
Morita, M.; Yamada, S.; Agou, T.; Kubota, T.; Konno, T. Luminescence Tuning of Fluorinated Bistolanes via Electronic or Aggregated-Structure Control. Appl. Sci. 2019, 9, 1905. https://doi.org/10.3390/app9091905
AMA Style
Morita M, Yamada S, Agou T, Kubota T, Konno T. Luminescence Tuning of Fluorinated Bistolanes via Electronic or Aggregated-Structure Control. Applied Sciences. 2019; 9(9):1905. https://doi.org/10.3390/app9091905
Chicago/Turabian StyleMorita, Masato, Shigeyuki Yamada, Tomohiro Agou, Toshio Kubota, and Tsutomu Konno. 2019. "Luminescence Tuning of Fluorinated Bistolanes via Electronic or Aggregated-Structure Control" Applied Sciences 9, no. 9: 1905. https://doi.org/10.3390/app9091905
Note that from the first issue of 2016, this journal uses article numbers instead of page numbers. See further details here.