Article

NLRP12 Inflammasome Expression in the Rat Brain in Response to LPS during Morphine Tolerance

1
Institute of NeuroImmune Pharmacology, Seton Hall University, 400 South Orange Avenue, South Orange, NJ 07079, USA
2
Department of Biological Sciences, Seton Hall University, 400 South Orange Avenue, South Orange, NJ 07079, USA
*
Author to whom correspondence should be addressed.
Brain Sci. 2017, 7(2), 14; https://doi.org/10.3390/brainsci7020014
Submission received: 22 June 2016 / Revised: 11 January 2017 / Accepted: 16 January 2017 / Published: 6 February 2017
(This article belongs to the Special Issue Advances in Neuroimmunology)

Abstract

:
Morphine, an effective but addictive analgesic, can profoundly affect the inflammatory response to pathogens, and long-term use can result in morphine tolerance. Inflammasomes are protein complexes involved in the inflammatory response. The nucleotide-binding oligomerization domain-like receptor (NLR) Family Pyrin Domain Containing (NLRP) 12 (NLRP12) inflammasome has been reported to have anti-inflammatory activity. In this study, we examined the expression of NLRP12 inflammasome related genes in the adult F344 rat brain in response to the bacterial endotoxin lipopolysaccharide (LPS) in the presence and absence of morphine tolerance. Morphine tolerance was elicited using the 2 + 4 morphine-pelleting protocol. On Day 1, the rats were pelleted subcutaneously with 2 pellets of morphine (75 mg/pellet) or a placebo; on Days 2 and 4 pellets were given. On Day 5, the animals were randomly assigned to receive either 250 µg/kg LPS or saline (i.p.). The expression of 84 inflammasome related genes in the rat brain was examined using a Ploymerase Chain Reaction (PCR) array. In response to LPS, there was a significant increase in the expression of the pro-inflammatory cytokine/chemokine genes interleukin-1 beta (Il-1β), interleukin-6 (Il-6), C-C motif chemokine ligand 2 (Ccl2), C-C motif chemokine ligand 7 (Ccl7), C-X-C motif chemokine ligand 1 (Cxcl1), and C-X-C motif chemokine ligand 3 (Cxcl3) and a significant decrease in the anti-inflammatory NLRP12 gene in both morphine-tolerant and placebo-control rats compared to saline-treated rats, although the changes were greater in the placebo-control animals. The Library of Integrated Network-Based Cellular Signatures’ (LINCS) connectivity map was used to analyze the list of affected genes to identify potential targets associated with the interactions of LPS and morphine tolerance. Our data indicate that, in the morphine tolerant state, the expression of NLRP12 and its related genes is altered in response to LPS and that the Vacuolar protein-sorting-associated protein 28 (VPS28), which is involved in the transport and sorting of proteins into sub-cellular vesicles, may be the key regulator of these alterations.

1. Introduction

Morphine is a potent analgesic that is widely used clinically for pain management. However, long-term use of morphine can lead to morphine tolerance and addiction [1]. In addition, morphine can profoundly and detrimentally affect the body’s immune system, at both the cellular and molecular levels. Morphine suppresses lymphocyte trafficking; decreases natural killer cell activity; inhibits the production of pro-inflammatory cytokines, such as tumor necrosis factor-alpha (TNF-α) and interleukin-1 beta (IL-1β) [2,3,4]; and induces atrophy of immune organs, such as the spleen and thymus [5,6,7,8,9].
Morphine-induced immunosuppression significantly increases the risk of bacterial infection [10]. Although the immunosuppressive effects of morphine have been widely studied, the mechanisms involved in the body’s inflammatory response to pathogens during morphine tolerance have not been fully investigated.
Inflammasomes are multi-protein complexes assembled from nucleotide oligomerization domain receptor proteins known as nucleotide-binding oligomerization domain (NOD)-like receptors (NLR) [11]. They function as important mediators of innate immunity. Inflammasomes play a key role in the regulation of inflammation and immune responses by participating in the production of pro-inflammatory cytokines, including IL-1β and interleukin-18 (IL-18) [11,12,13]. Both IL-1β and IL-18 produce a wide variety of biological effects associated with infection, inflammation, and autoimmune processes.
There have been about 20 NLR inflammasomes identified in humans. The most commonly studied ones include NLR Family Pyrin Domain Containing 1 (NLPR1), NLR family apoptosis inhibitory protein 6 (NAIP2), NLR Family Pyrin Domain Containing 3 (NLRP3), NLR Family Pyrin Domain Containing 5 (NLRP5), NLR Family Pyrin Domain Containing 6 (NLRP6), NLR Family Pyrin Domain Containing 12 (NLRP12), NLR family member X1 (NLRPX1), and NLR Family CARD Domain Containing 4 (NLRC4) [14]. Inflammasomes have been sub-divided into two groups; pro-inflammatory inflammasomes and anti-inflammatory inflammasomes. The pro-inflammatory inflammasomes include NLRP3 and NLRC4, and their functions have been widely studied. The anti-inflammatory inflammasomes include NLRP12, NLRX1, NLRC3, and NLRC5. They appear to function by limiting or suppressing a pro-inflammatory response; however, this group has not been well studied to date.
There have been a few recent reports characterizing the anti-inflammatory properties of NLRP12 [15,16]. NLRP12 can inhibit NF-κB signaling through both the canonical and non-canonical pathways, which are important in the control and regulation of innate immune responses [15,16]. NLRP12 inhibits IL-1 receptor-associated kinase 1 (IRAK1), a downstream component of the pathogen activated Toll-like receptor (TLR) pathway, which, in turn, decreases the signaling of the canonical NF-κB pathway [17]. In the non-canonical NF-κB pathway, NLRP12 interacts with and rapidly degrades NF-κB-inducing kinase (NIK), thereby suppressing NF-κB signaling [18].
The Library of Integrated Network-Based Cellular Signatures (LINCS) [19] is a database which implements a biological network-based strategy to make assessments regarding the impact of drugs, genetics, and related biological perturbations (alterations induced by external or internal mechanisms) on cellular states. The library database is based on the philosophy that typical human pathology, biology, and pharmacology are most aptly understood using a systems-level approach. It was constructed to generate a robust approach for perturbing a diversity of cell types, measuring cellular responses, integrating and analyzing data, and visualizing and interrogating the database for a variety of biomedical research applications [19]. This library allows researchers to access a wide variety of data by using a matrix consisting of cell type by experimental treatment by phenotypic assay. Using LINCS, researchers are able to inquire about information regarding mechanism-based relationships among the effects of different drug responses and their targets (perturbents) as well as associations among responding cellular components, in the format of network interactions and structure-function relationships [20].
In this study, we used an inflammasome PCR array containing 84 inflammasome-related genes to investigate the expression of inflammasomes during an inflammatory response to the bacterial endotoxin, lipopolysaccharide (LPS), in the rat brain during morphine tolerance. LINCS was then used to project possible candidate targets from the mRNA gene expression profiles generated from the PCR array analysis.

2. Materials and Methods

2.1. Animals

Fisher/NHsd 344 (F344) rats were purchased from Harlan Laboratories (Indianapolis, IN, USA). The animals were housed in groups of 3–5 animals in a temperature controlled (21 °C–22 °C) animal holding room, under a 12-h light/12-h dark illumination cycle (lights on at 7:00 a.m.). Food and tap water were provided ad libitum. The Institutional Animal Care and Use Committee (IACUC) at Seton Hall University, South Orange, NJ, USA approved the experimental protocol.

2.2. Morphine and LPS Administration

A 2 + 4 regimen was used to produce morphine tolerance in 7–8 mo old (250–350 g) male F344 rats [5,21,22,23,24]. The rats (n = 16) were randomly assigned into two groups. The morphine-tolerant group received two 75 mg morphine sulfate pellets (NIDA, Rockville, MD, USA) on Day 1 via subcutaneous (s.c.) implantation and four pellets on Day 2, whereas the control group received placebo pellets on both days. On Day 5, the two groups were randomly assigned to receive either LPS (250 µg/kg, Sigma, St. Louis, MO, USA) or saline (vehicle) [5,21,22,23,24]. Thus, the four experimental groups were placebo-control + saline, placebo-control + LPS, morphine-tolerant + saline, and morphine-tolerant + LPS. Two hours after the treatment with LPS or saline, the animals were euthanized and the brains were harvested.

2.3. RNA Isolation and Preparation of cDNA

Total RNA was extracted from the brain tissue using TRIZOL (Invitrogen, Carlsbad, CA, USA), following the manufacturer’s protocol. To remove contaminating DNA, the total RNA samples were treated with RNase-free DNase (Qiagen, Valencia, CA, USA), followed by further purification using an RNeasy Mini Kit (Qiagen, Valencia, CA, USA). The RNA quality and quantity were assessed using a nanodrop spectrophotometer (Thermo Scientific, Waltham, MA, USA). An equal amount of RNA (400 ng) from each sample was then converted into first-strand cDNA using a RT2 First Strand Kit (SABiosciences, Frederick, MD, USA) for a PCR array.

2.4. Real-Time PCR Array

The expression of 84 key genes involved in the function of inflammasomes, general NLR signaling, and cytokine and chemokine genes was quantified using a custom PCR array and RT2 SYBR Green Fluorescein qPCR Master Mix (SABiosciences, Frederick, MD, USA), according to the manufacturer’s protocol. Using an ABI Prism 7900HT Fast Detection System (Applied Biosystems, Foster, CA, USA), real-time PCR was performed by first denaturing the PCR mix at 95 °C for 10 min, followed by 40 cycles at 95 °C for 15 s and at 60 °C for 1 min.

2.5. PCR Array Data Analysis

The expression of each gene was normalized to housekeeping genes and calculated using the ∆∆Ct method. The threshold and baseline values were set manually, and the resulting threshold cycle values (Ct) were analyzed using the PCR array data analysis template supplied on the manufacturer’s website [25]. The mean fold change in mRNA expression from 3 to 5 biological replicates was considered significant at p < 0.05. The gene profile signatures were created for every two groups compared.

2.6. LINCS Analysis

The differentially expressed genes were input into the Query App (apps.lincscloud.org/query), as described previously [26,27]. Based on the LINCS database, LincsCloud utilized gene profile signatures generated from the PCR array to generate a report, including probability outcomes in terms of gene knockdown effects and drug mimics. The scores given in the report evaluated how much a particular set of gene regulation features (named pertubagens) was likely to be connected with the genes listed in the LINCS report. Positive readings in the Consensus Knockdown Connections in the report indicate that knockdown of the genes listed in the LINCS report would match the gene changes input into the Query App, and thus the genes with high scores represent potential target genes for the experimental treatment.

3. Results

3.1. Expression Profile of Inflammasome-Related Genes Following an LPS Challenge, with and without Morphine Tolerance

Alterations in gene expression were measured in rats challenged with LPS, with and without morphine tolerance, using a PCR array containing 84 genes related to inflammasome activation and function. NLRP12 expression was significantly decreased in response to LPS in both the morphine-tolerant (morphine-tolerant + LPS) and control (placebo-control + LPS) rats, compared to the rats given saline (morphine-tolerant + saline and placebo-control + saline) (Figure 1, Table 1). However, the decrease was greater in the placebo-control rats (−7.3 fold; p < 0.01) than in the morphine-tolerant rats (−4.5 fold; p < 0.05).

3.2. Expression Profile of Inflammasome-Related Downstream Signaling Genes Following an LPS Challenge, With and Without Morphine Tolerance

With a few exceptions, there were no significant changes in expression of the downstream signaling genes in response to LPS in either the morphine-tolerant rats (morphine-tolerant + LPS) or the control animals (placebo-control + LPS), compared to the rats given saline (morphine-tolerant + saline and placebo-control + saline) (Table 1). However, Baculoviral IAP Repeat-Containing 3 (Birc3), an important regulator gene involved in the downstream effects of inflammasomes, was significantly increased in response to LPS in both the morphine-tolerant (21.5 fold; p < 0.05) and control (21 fold; p < 0.01) groups, compared to the rats given saline (Figure 2, Table 2). In addition, NF-Kappa-B Inhibitor Alpha (Nfkbia), an inhibitor protein of NF-κB, was increased in both groups given LPS (morphine-tolerant + LPS, 3.4 fold, p < 0.01; placebo-control + LPS, 3.9 fold, p < 0.01) (Figure 2, Table 2).

3.3. Expression Profile of Inflammasome-Related Chemokine and Cytokine Genes after an LPS Challenge, with and without Morphine Tolerance

Cytokine and chemokine gene expression in response to LPS was greater in the control rats (placebo-control + LPS) compared to the morphine-tolerant animals (morphine-tolerant + LPS) (Table 3). The cytokines IL-1β and IL-6 were significantly increased 7- and 12-fold, respectively (p < 0.01–0.001), in the control rats given LPS (placebo-control + LPS), whereas in the morphine-tolerant group (morphine-tolerant + LPS) the fold changes were not statistically significant (3- and 7-fold, respectively) compared to the rats given saline (Figure 3, Table 3).
Similarly, Ccl2, Ccl7, Cxcl1, and Cxcl3 chemokine expression was significantly increased 24-, 11-, 37-, and 8-fold, respectively (p < 0.01–0.001), in response to LPS in the control rats (placebo-control + LPS), whereas in the morphine-tolerant (morphine-tolerant + LPS) group the fold changes (9-, 7-, 14-, and 3-fold, respectively) were not statistically significant (Figure 4, Table 3).

3.4. LINCS Analysis of the Differentially Expressed Genes

Differentially expressed genes in the morphine-tolerant + saline versus morphine-tolerant + LPS rats and in the placebo-control + saline versus placebo-control + LPS rats as well as gene changes in rats the placebo-control + saline versus morphine-tolerant + saline rats were input into the Query App (apps.lincscloud.org/query). One report was generated by LINCS for each set of genes input. The genes with a high positive score in Consensus Knockdown Connections were considered to be potential gene targets (Table 4). In the placebo-control + saline versus placebo-control + LPS report, VPS28, protein C receptor (PROCR), and charged multivesicular body protein 2A (CHMP2A) were the top three with the highest scores. VPS28 is an ESCRT-I complex subunit that functions in the transport and sorting of proteins into sub-cellular vesicles. PROCR is endothelial protein C receptor involved in the blood coagulation pathway. CHMP2A is a component of the endosomal sorting complex required for transport III, which is involved in the degradation of surface receptor proteins and the formation of endocytic multivesicular bodies.
In the placebo-control + saline versus morphine-tolerant + saline report, SWI/SNF related, matrix associated, actin dependent regulator of chromatin, subfamily e, member 1 (SMARCE1), aryl-hydrocarbon receptor repressor (AHRR), and glutathione peroxidase 7 (GPX7) were the most likely targets predicted by LINCS. SMARCE1 is required for the transcriptional activation of genes normally repressed by chromatin. AHRR mediates dioxin toxicity and is involved in the regulation of cell growth and differentiation. GPX7 is involved with cellular senescence and insulin secretion.
In the morphine-tolerant + saline versus morphine-tolerant + LPS group, AHR (aryl hydrocarbon receptor), UBE2L6 (ubiquitin-conjugating enzyme E2L 6), and PAFAH1B3 (platelet-activating factor acetylhydrolase 1b, Catalytic Subunit 3) were the top three candidates. AHR is involved in the regulation of biological responses to planar aromatic hydrocarbons; UBE2L6 targets abnormal or short-lived proteins for degradation; and PAFAH1B3 functions in brain development and is associated with mental retardation, ataxia, and atrophy of the brain.
The predicted potential targets in each group were different from those in other groups, both in targets and their possibility rankings. VPS28 was the only one that appeared in both the Top 100 lists of placebo-control + saline versus placebo-control + LPS (No. 1 in Table 4) and morphine-tolerant + saline versus morphine-tolerant + LPS (No. 4 in Table 4).
Table 4 shows the top three potential target genes from each set of gene comparisons. There was no similarity in the gene rankings in the three sets of gene comparisons.

4. Discussion

Inflammasomes recognize a variety of pathogen-associated molecular patterns (PAMPs), including endotoxins such as LPS. Depending on the NLR proteins that constitute inflammasomes, an inflamasome can be pro-inflammatory or anti-inflammatory in nature [28]. For pro-inflammatory inflammasomes such as NLRP3, in vitro studies have shown that the activation and release of pro-inflammatory cytokines requires two signals. The first signal, triggered by PAMPs, leads to the activation of inflammasomes, which then provide the second signal. The activated inflammasomes, through caspase 1 activation, promote the production of the pro-inflammatory cytokines, IL-1β and IL-18. However, the signaling pathways during infection or inflammation in vivo are not yet completely defined [29], and the characteristics of anti-inflammatory inflammasomes such as NLRP12 have not yet been extensively investigated. To our knowledge, our study is one of the first to report the modulation of NLRP12 expression in response to LPS and morphine in vivo.
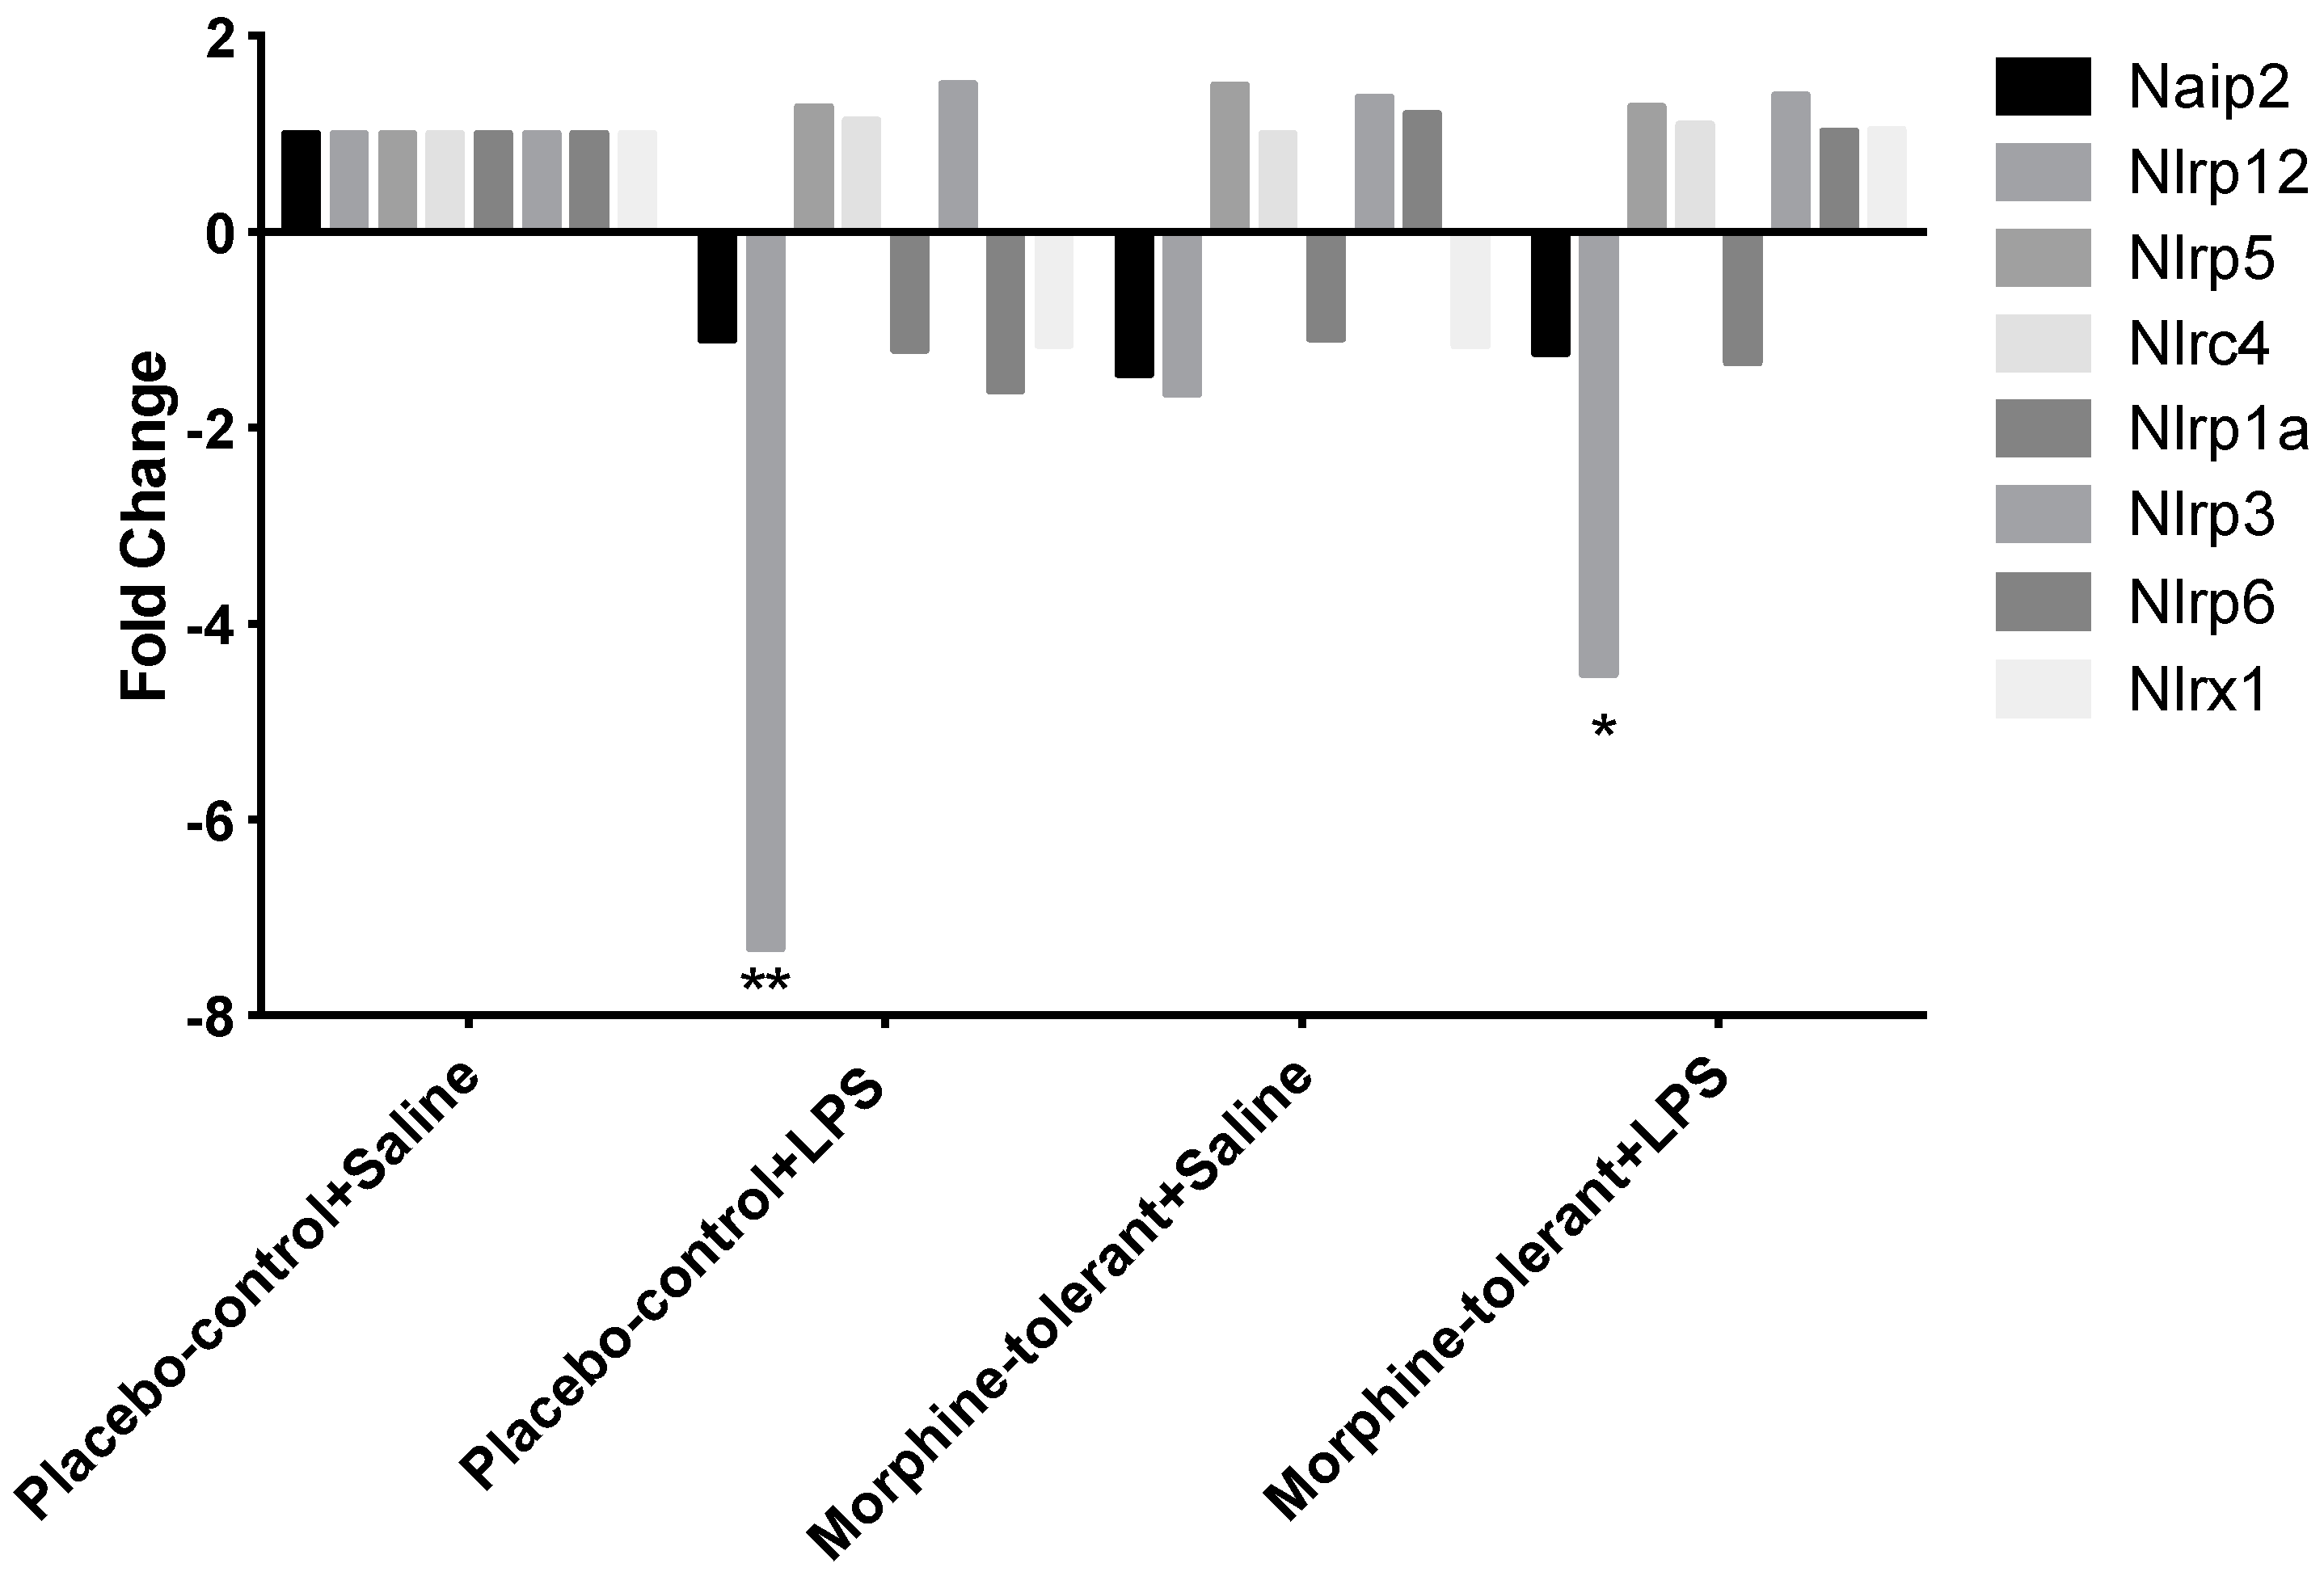
Recently, NLRP12 was designated as an anti-inflammatory NLR inflammasome protein. It is believed to be a negative regulator of the NF-κB signaling pathway by inhibiting downstream signaling of TLRs, particularly IRAK-1 [28,30]. Our results showed that NLRP12 expression decreased in the brains of both the control (placebo-control + LPS) and morphine-tolerant (morphine-tolerant + LPS) rats in response to an LPS challenge, indicating that one of the mechanisms by which LPS induces an inflammatory response is by inhibiting the expression of the anti-inflammatory NLRP12 inflammasome.
Although NLRP12 expression was decreased in both groups given LPS, the decrease was significantly greater in the control rats than in the morphine-tolerant rats, which suggests that the LPS-induced NLRP12 decrease is countered during morphine tolerance. Hence morphine may also modulate NLRP12 activity, directly or indirectly, thereby exerting its immunosuppressive effects and opposing the LPS-induced decrease in NLRP12 in the presence of morphine tolerance.
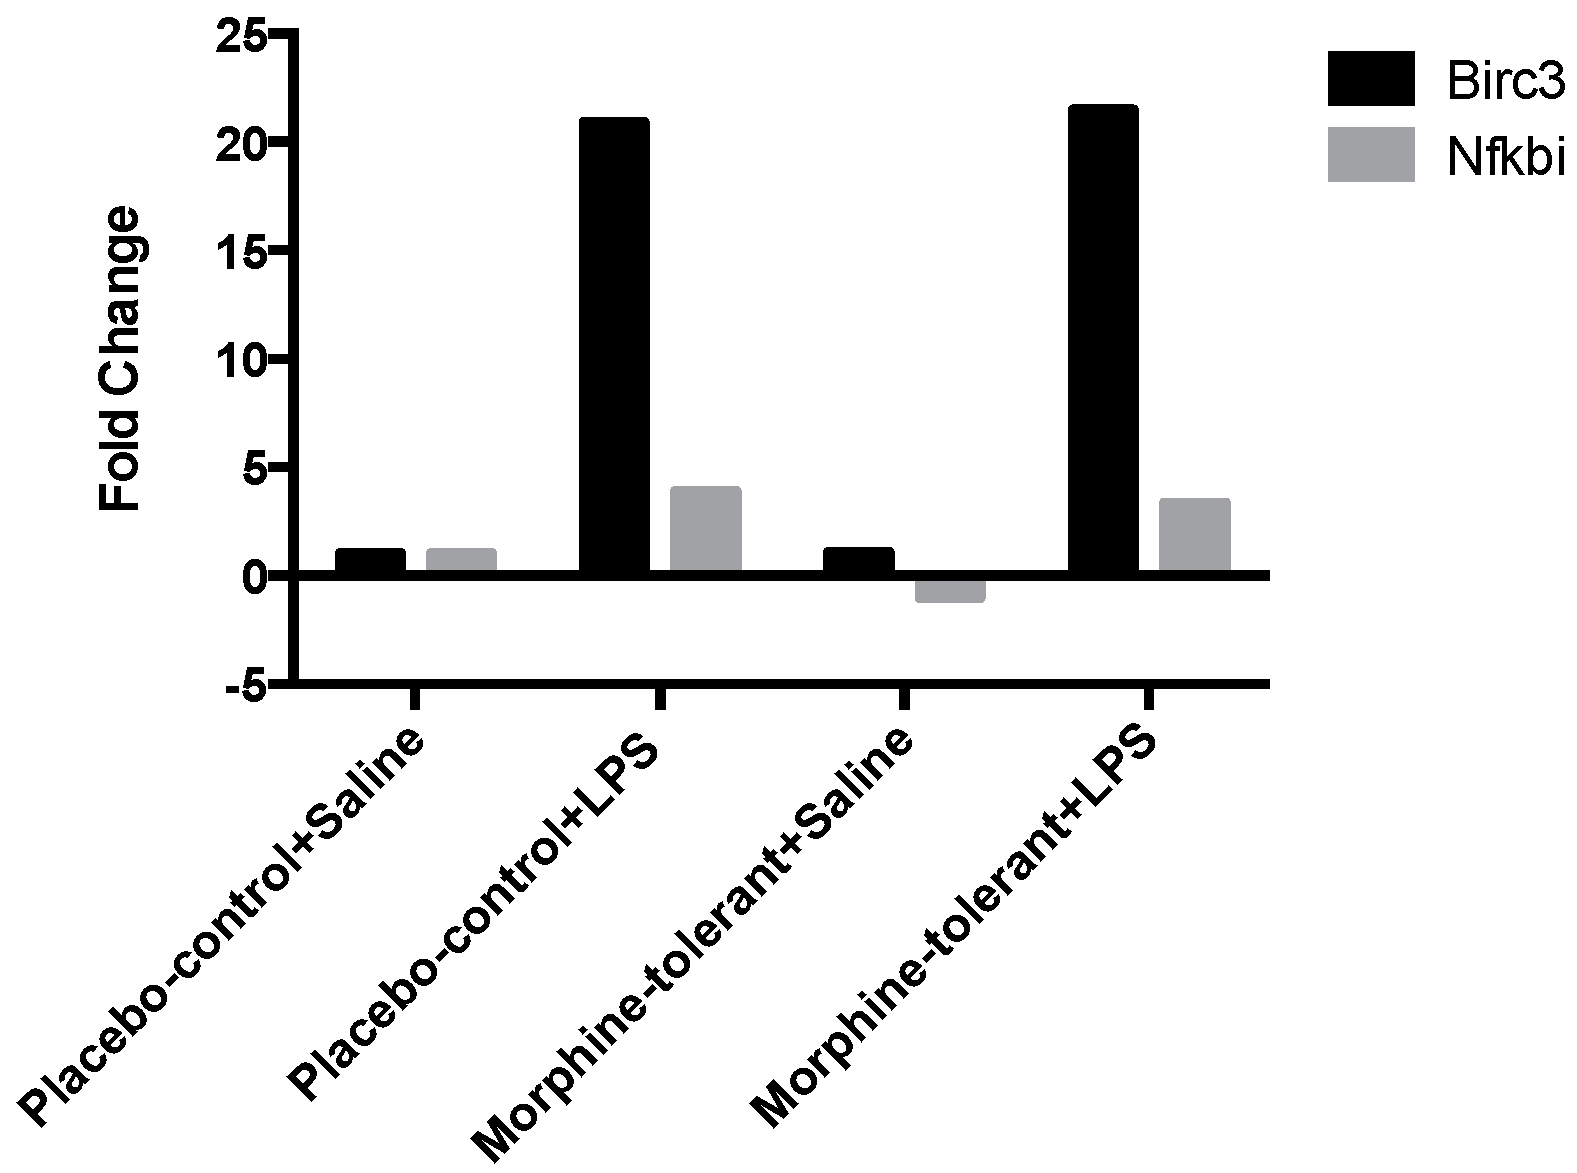
Birc3, a downstream regulator of inflammasome signaling, is essential for controlling the synthesis of cytokines and chemokines in the inflammatory Mapk and NF-κB pathways. It is also required for inflammasome activation, subsequent caspase 1 activity, and IL-1β formation [31]. In our study, Birc3 expression was significantly increased in both the placebo-control and morphine-tolerant rats in response to LPS, indicating that LPS is able to induce an inflammatory response through Birc3 activity, following inhibition of the anti-inflammatory NLRP12. However, in response to LPS, Birc3 expression in the morphine-tolerant rats did not change in comparison to the placebo-control rats. This indicates that morphine may not be able to modulate Birc3 expression, and therefore there is no change, increase or decrease, in its expression in the morphine tolerant state.
NF-κB is important in the activation of inflammatory mediators such as cytokines and chemokines [16]. Previous studies have reported that NLRP12 inhibits both canonical and non-canonical NF-κB activation [16,28] and that Nfkbia, a downstream regulator of inflammasomes, inhibits the activity of dimeric NF-κB/Rel complexes [32]. In our study, Nfkbia was significantly increased in response to LPS in both the placebo-control and morphine-tolerant rats. During an inflammatory response, one would expect the expression and activity of a positive regulator of inflammation to be increased, whereas that of a negative regulator would be decreased. However, from a physiological standpoint, there is a constant effort to balance pro- and anti-inflammatory activity [33,34]. This quest to balance the pro- and anti-inflammatory responses could be one of the reasons for an increase in Nfkbia, which is known to inhibit the activity of the pro-inflammatory dimeric NF-κB/REL, thus reducing the production of pro-inflammatory mediators.
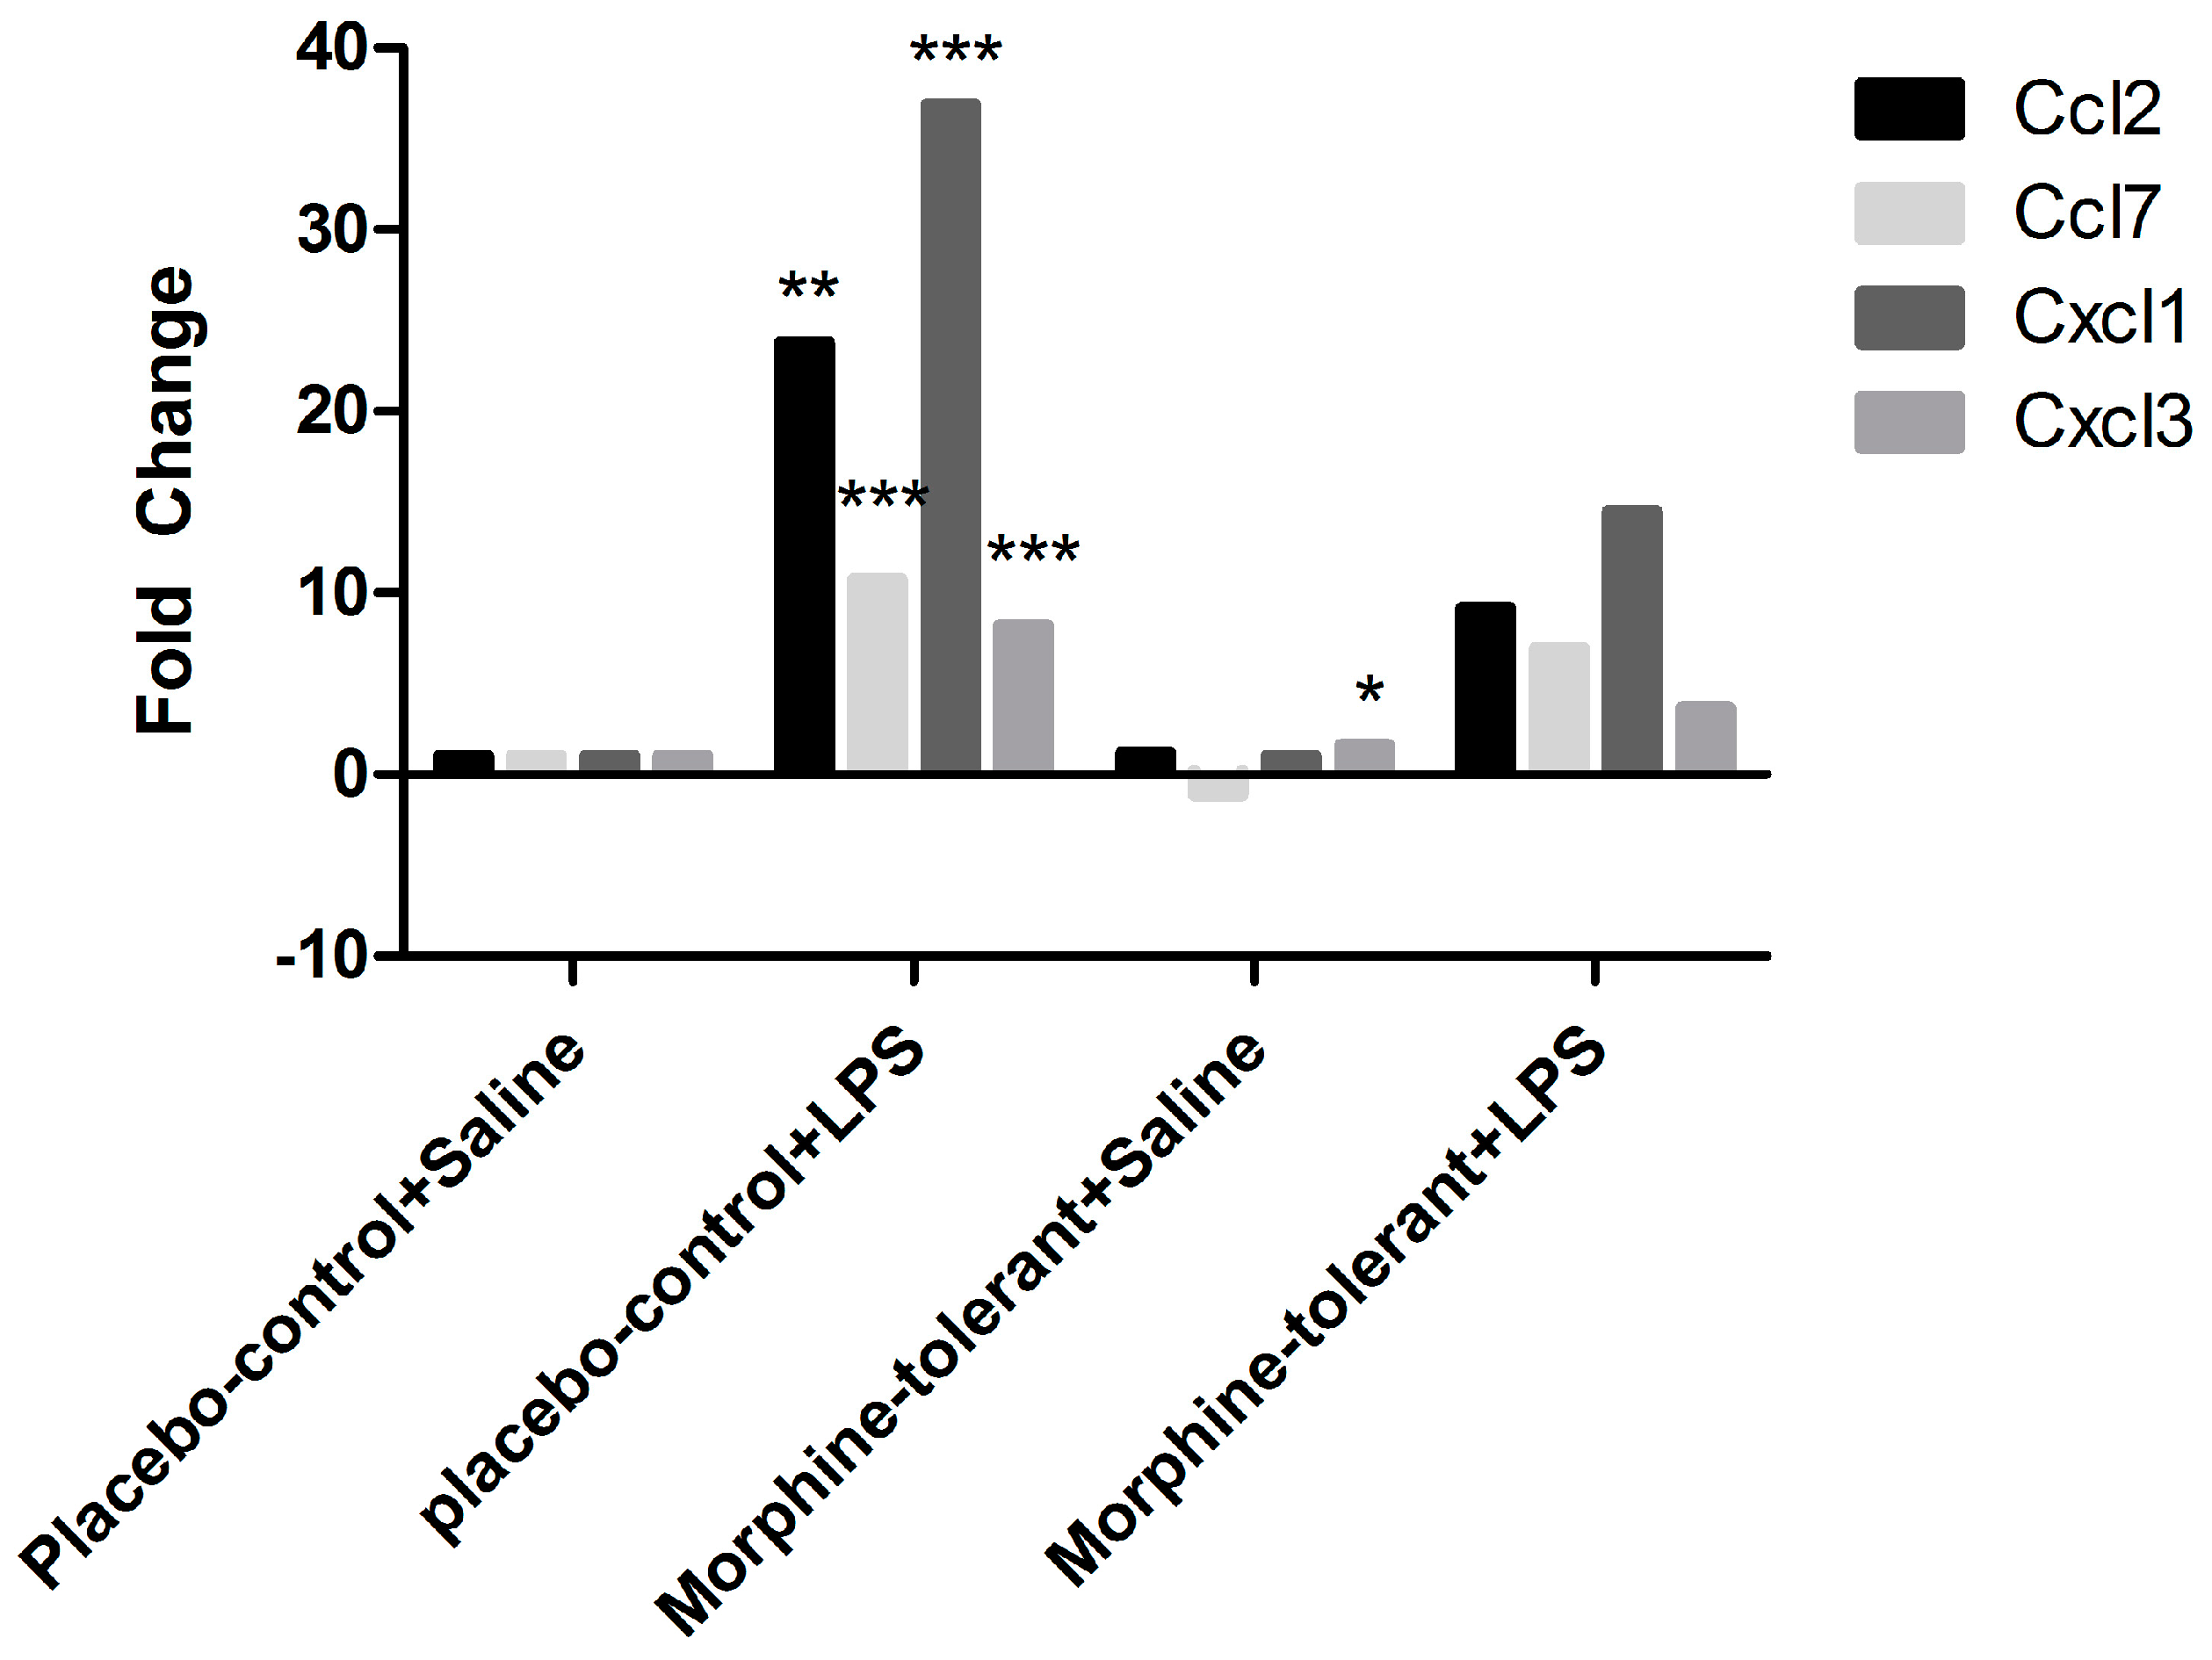
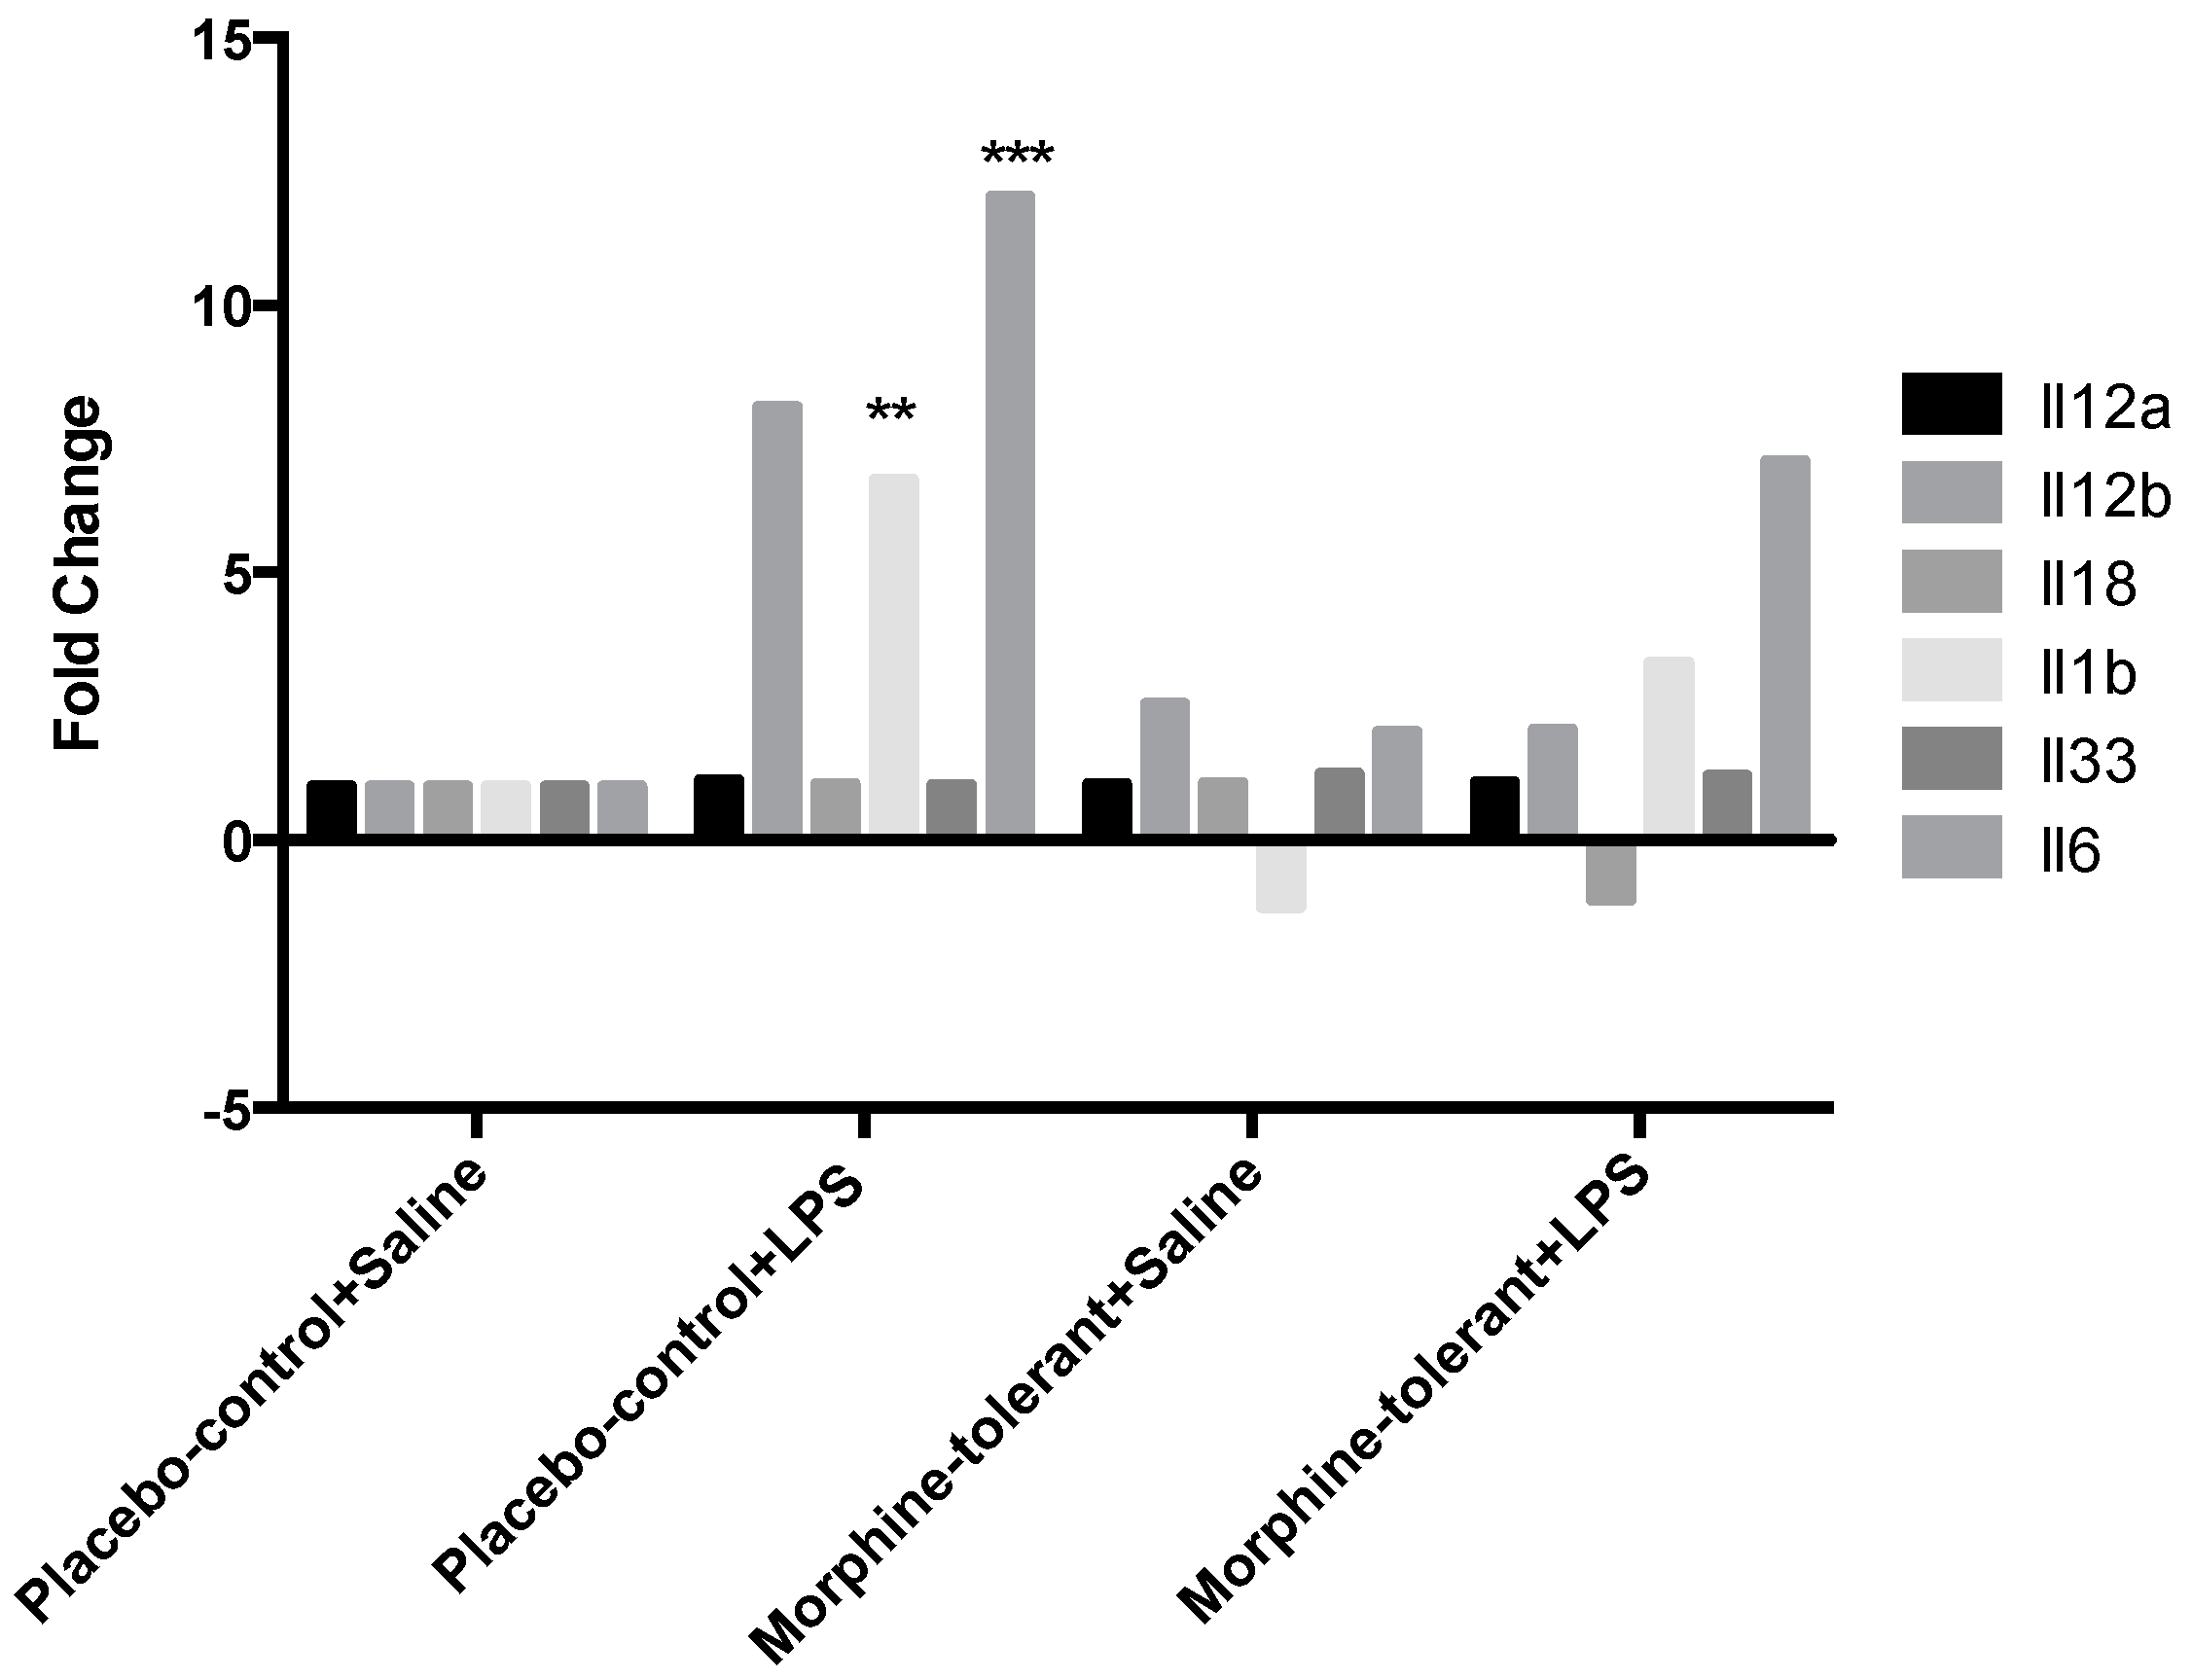
As expected, we found that the expression of pro-inflammatory cytokines (IL-1β and IL-6) and chemokines (Ccl2, Ccl7, Cxcl1, and Cxcl3) was increased in response to LPS in the placebo-control rats [35,36,37]. In the morphine-tolerant rats, however, the LPS-induced cytokine and chemokine expression levels were lower, suggesting that NLRP12 inhibition in response to LPS may be opposed or subdued in the morphine tolerant state.
In a previous study, we observed that, in peripheral immune organs such as the spleen, NLRP3 expression, but not NLRP12 expression, is altered in response to LPS, with and without morphine tolerance [38], suggesting that the mechanism(s) of inflammasome activation in response to pathogens may be different in peripheral immune organs, compared to the central nervous system. During morphine tolerance, the LPS-induced expression of NLRP3, as well as that of cytokines and chemokines, is reduced in comparison to the placebo-control rats given LPS [38]. These observations are consistent with previous studies showing that immune activation, including an inflammatory response, is diminished during morphine tolerance [39]. Therefore, the data from the present study, as well as from our previous report [38], collectively indicate that morphine may exert its effects through both pro- and anti-inflammatory inflammasomes.
LINCS analysis is able to predict potential target genes based on a certain treatment and the gene profile signatures in its database. In our study, LINCS was able to generate a report of potential targets with a p value of <0.05 from the list of genes with altered expression in response to LPS in control rats (placebo-control + saline versus placebo-control + LPS) but not from the other two comparisons (placebo-control + saline versus morphine-tolerant + saline, morphine-tolerant + saline versus morphine-tolerant + LPS), because there were not enough significant gene features in those two groups. When enlarging the set of gene features for the comparison of placebo-control + saline versus placebo-control + LPS to a p-value of <0.1, LINCS generated a report with similar potential targets. Thus, the gene features were then studied with a p-value of <0.1 on all three sets of comparisons. VPS28, PROCR, and CHMP2A were the top three with the highest scores in LINCS report generated based on placebo-control + saline versus placebo-control + LPS gene alternations, suggesting that Vps28, Procr and Chmp2a were potential targets of LPS. In the report for placebo-control + saline versus morphine-tolerant + saline, SMARCE1, AHRR, and GPX7 were the most likely targets altered in morphine tolerance predicted by LINCS. In the morphine-tolerant + saline versus morphine-tolerant + LPS report, AHR, UBE2L6, and PAFAH1B3 were the top three candidates that potentially responsible for the LPS-induced immune responses during morphine tolerance in rats. In the LINCS reports, the listed potential targets had different rankings using the different sets of gene features. This confirms that the response to LPS by those inflammosome-related genes could be affected by morphine tolerance.
Moreover, among the targets listed above, while VPS28 was No. 1 in the control rats in response to LPS, it was No. 4 in morphine-tolerant rats (Table 4). The VPS28 protein functions in transporting and sorting proteins into sub-cellular vesicles. In our study, LINCS analysis suggests that the actions of VPS28 in response to LPS could be dampened during morphine tolerance.

5. Conclusions

The results from our study indicate that, in the rat brain, LPS-induced inflammation involves both the inhibition of the NLRP12 anti-inflammatory inflammasome and the stimulation of downstream regulators such as Birc3, thereby increasing the expression of pro-inflammatory chemokines and cytokines. However, in the morphine tolerant state, the response to LPS is dampened, as indicated by the reduced expression of inflammasome-related genes. LINCS analysis confirmed that the response to LPS is altered during morphine tolerance and indicated that VPS28 may be one of the genes responsible for the alterations associated with morphine tolerance.

Acknowledgments

The authors thank Louaine L. Spriggs for her excellent editorial assistance. Funding for this study was provided, in part, by National Institutes of Health (NIH)/National Institute on Drug Abuse (NIDA) grants R01 DA007058 and K02 DA016149 to Sulie L. Chang.

Author Contributions

Sulie L. Chang designed the studies, participated in data collection, data analysis, and manuscript preparation, and approved the manuscript submission. Wenfei Wang conducted the LINCS analysis and participated in manuscript preparation. Sabroni Sarkar participated in the PCR array data analysis and in manuscript preparation. Xin Ma conducted the animal treatments, tissue collection, and PCR array analysis.

Conflicts of Interest

The authors declare no conflicts of interest.

Appendix A

Table A1. Genes analyzed in PCR Array.
Gene SymbolFull NamemRNA Entry
Card6caspase recruitment domain family, member 6NM_001106413.1
Casp1caspase 1NM_012762.2
Casp12caspase 12NM_130422.1
Casp8caspase 8NM_022277.1
Naip2NLR family, apoptosis inhibitory protein 6XM_008760697.2
Nlrp12NLR family, pyrin domain containing 12NM_001169142.1
Nlrp5NLR family, pyrin domain containing 5NM_001107474.1
Nlrc4NLR family, CARD domain containing 4NM_001309432.1
Nlrp1aNLR family, pyrin domain containing 1ANM_001145755.2
Nlrp3NLR family, pyrin domain containing 3NM_001191642.1
Nlrp6NLR family, pyrin domain containing 6NM_134375.3
Nlrx1NLR family member X1NM_001025010.1
Nod2nucleotide-binding oligomerization domain containing 2NM_001106172.1
PycardPYD and CARD domain containingNM_172322.1
Bcl2BCL2, apoptosis regulatorNM_016993.1
Bcl2l1BCL2 like 1NM_001033670.1
Birc2baculoviral IAP repeat-containing 2NM_021752.2
Birc3baculoviral IAP repeat-containing 3NM_023987.3
CflarCASP8 and FADD-like apoptosis regulatorNM_001033864.2
Chukconserved helix-loop-helix ubiquitous kinaseNM_001107588.1
Ciitaclass II, major histocompatibility complex, transactivatorNM_001270803.1
Ctsbcathepsin BNM_022597.2
FaddFas associated via death domainNM_152937.2
Hsp90aa1heat shock protein 90, alpha (cytosolic), class A member 1NM_175761.2
Hsp90ab1heat shock protein 90 alpha family class B member 1NM_001004082.3
Ikbkbinhibitor of kappa light polypeptide gene enhancer in B-cells, kinase betaNM_053355.2
Ikbkginhibitor of kappa light polypeptide gene enhancer in B-cells, kinase gammaNM_199103.1
Irak1interleukin-1 receptor-associated kinase 1NM_001127555.1
Map3k7mitogen activated protein kinase kinase kinase 7NM_001107920.2
Map3k7ip1TGF-beta activated kinase 1/MAP3K7 binding protein 1NM_001109976.2
Map3k7ip2TGF-beta activated kinase 1/MAP3K7 binding protein 2NM_001012062.1
Mapk1mitogen activated protein kinase 1NM_053842.2
Mapk11mitogen-activated protein kinase 11NM_001109532.2
Mapk12mitogen-activated protein kinase 12NM_021746.1
Mapk13mitogen activated protein kinase 13NM_019231.2
Mapk14mitogen activated protein kinase 14NM_031020.2
Mapk3mitogen activated protein kinase 3NM_017347.2
Mapk8mitogen-activated protein kinase 8 NM_053829.2
Mapk9mitogen-activated protein kinase 9NM_001270544.1
MefvMediterranean feverNM_031634.1
Myd88myeloid differentiation primary response 88NM_198130.1
Nfkb1nuclear factor kappa B subunit 1 NM_001276711.1
NfkbiaNFKB inhibitor alphaNM_001105720.2
NfkbibNFKB inhibitor betaNM_030867.2
P2rx7purinergic receptor P2X 7NM_019256.1
Panx1Pannexin 1NM_001270548.1
Pea15aphosphoprotein enriched in astrocytes 15NM_001013231.1
Pstpip1proline-serine-threonine phosphatase-interacting protein 1NM_001106824.2
Ptgs2prostaglandin-endoperoxide synthase 2NM_017232.3
RageMOK protein kinaseNM_001010965.1
RelaRELA proto-oncogene, NF-kB subunitNM_199267.2
Ripk2receptor-interacting serine-threonine kinase 2NM_001191865.1
Sugt1SGT1 homolog, MIS12 kinetochore complex assembly cochaperoneNM_001013051.1
TirapTIR domain containing adaptor proteinXM_017596001.1
Hsp90b1heat shock protein 90 beta family member 1NM_001012197.2
Traf6TNF receptor associated factor 6NM_001107754.2
Txnipthioredoxin interacting proteinNM_001008767.1
XiapE3 ubiquitin-protein ligase XIAPNM_022231.2
Ccl11C-C motif chemokine ligand 11NM_019205.1
Ccl12chemokine (C-C motif) ligand 12NM_001105822.1
Ccl2C-C motif chemokine ligand 2NM_031530.1
Ccl5C-C motif chemokine ligand 5NM_031116.3
Ccl7C-C motif chemokine ligand 7NM_001007612.1
Cxcl1C-X-C motif chemokine ligand 1NM_030845.1
Cxcl3C-X-C motif chemokine ligand 3NM_138522.1
Cd40lgCD40 ligandNM_053353.1
Ifnb1interferon beta 1NM_019127.1
Ifnginterferon gammaNM_138880.2
Il12ainterleukin 12ANM_053390.1
Il12binterleukin 12BNM_022611.1
Il18interleukin 18NM_019165.1
Il1binterleukin 1 betaNM_031512.2
Il33interleukin 33NM_001014166.1
Il6interleukin 6NM_012589.2
Irf1interferon regulatory factor 1NM_012591.1
Irf2interferon regulatory factor 2NM_001047086.1
Irf3interferon regulatory factor 3NM_001006969.1
Irf4interferon regulatory factor 4NM_001106108.1
Irf5interferon regulatory factor 5NM_001106586.1
Irf6interferon regulatory factor 6NM_001108859.1
Tnfsf11tumor necrosis factor superfamily member 11NM_057149.1
Tnfsf14tumor necrosis factor superfamily member 14NM_001191803.1
Tnfsf4tumor necrosis factor superfamily member 4NM_053552.1
Table A2. Top 10 scored Genes in LINCS report.
Gene SymbolFull name
VPS28VPS28, ESCRT-I subunit
PROCRprotein C receptor
CHMP2Acharged multivesicular body protein 2A
MBmyoglobin
ZNF768zinc finger protein 768
RBPJrecombination signal binding protein for immunoglobulin kappa J region
WARS2tryptophanyl tRNA synthetase 2 (mitochondrial)
TBX2T-box 2
MRPS2mitochondrial ribosomal protein S2
MAP3K14mitogen-activated protein kinase kinase kinase 14
SMARCE1SWI/SNF related, matrix associated, actin dependent regulator of chromatin, subfamily e, member 1
AHRRaryl-hydrocarbon receptor repressor
GPX7glutathione peroxidase 7
ATP5F1ATP synthase, H+ transporting, mitochondrial Fo complex subunit B1
CALRcalreticulin
GPR110G protein-coupled receptor 110
ELF4E74 like ETS transcription factor 4
FGFR1fibroblast growth factor receptor 1
F7coagulation factor VII
AHRaryl hydrocarbon receptor
UBE2L6ubiquitin-conjugating enzyme E2L 6
PAFAH1B3platelet-activating factor acetylhydrolase 1b, catalytic subunit 3
JUNBJunB proto-oncogene, AP-1 transcription factor subunit
RYKreceptor-like tyrosine kinase
ARG1arginase 1
ZNF324zinc finger protein 324
ATP5DATP synthase, H+ transporting, mitochondrial F1 complex, delta subunit

References

  1. Ossipov, M.H.; Lai, J.; King, T.; Vanderah, T.W.; Malan, T.P., Jr.; Hruby, V.J.; Porreca, F. Antinociceptive and nociceptive actions of opioids. J. Neurobiol. 2004, 61, 126–148. [Google Scholar] [CrossRef] [PubMed]
  2. Bonnet, M.P.; Beloeil, H.; Benhamou, D.; Mazoit, J.X.; Asehnoune, K. The μ opioid receptor mediates morphine-induced tumor necrosis factor and interleukin-6 inhibition in toll-like receptor 2-stimulated monocytes. Anesth. Analg. 2008, 106, 1142–1149. [Google Scholar] [CrossRef] [PubMed]
  3. Hutchinson, M.R.; Coats, B.D.; Lewis, S.S.; Zhang, Y.; Sprunger, D.B.; Rezvani, N.; Baker, E.M.; Jekich, B.M.; Wieseler, J.L.; Somogyi, A.A.; et al. Proinflammatory cytokines oppose opioid-induced acute and chronic analgesia. Brain Behav. Immun. 2008, 22, 1178–1189. [Google Scholar] [CrossRef] [PubMed]
  4. Mohan, S.; Davis, R.L.; DeSilva, U.; Stevens, C.W. Dual regulation of mu opioid receptors in SK-N-SH neuroblastoma cells by morphine and interleukin-1beta: Evidence for opioid-immune crosstalk. J. Neuroimmunol. 2010, 227, 26–34. [Google Scholar] [CrossRef] [PubMed]
  5. Ocasio, F.M.; Jiang, Y.; House, S.D.; Chang, S.L. Chronic morphine accelerates the progression of lipopolysaccharide-induced sepsis to septic shock. J. Neuroimmunol. 2004, 149, 90–100. [Google Scholar] [CrossRef] [PubMed]
  6. Flores, L.R.; Wahl, S.M.; Bayer, B.M. Mechanisms of morphine-induced immunosuppression: Effect of acute morphine administration on lymphocyte trafficking. J. Pharmacol. Exp. Ther. 1995, 272, 1246–1251. [Google Scholar] [PubMed]
  7. Gomez-Flores, R.; Weber, R.J. Inhibition of interleukin-2 production and downregulation of IL-2 and transferrin receptors on rat splenic lymphocytes following pag morphine administration: A role in natural killer and T cell suppression. J. Interferon Cytokine Res. 1999, 19, 625–630. [Google Scholar] [CrossRef] [PubMed]
  8. Patel, N.A.; Romero, A.A.; Zadina, J.E.; Chang, S.L. Chronic exposure to morphine attenuates expression of interleukin-1 beta in the rat hippocampus. Brain Res. 1996, 712, 340–344. [Google Scholar] [CrossRef]
  9. Roy, S.; Charboneau, R.G.; Barke, R.A. Morphine synergizes with lipopolysaccharide in a chronic endotoxemia model. J. Neuroimmunol. 1999, 95, 107–114. [Google Scholar] [CrossRef]
  10. Hilburger, M.E.; Adler, M.W.; Truant, A.L.; Meissler, J.J., Jr.; Satishchandran, V.; Rogers, T.J.; Eisenstein, T.K. Morphine induces sepsis in mice. J. Infect. Dis. 1997, 176, 183–188. [Google Scholar] [CrossRef] [PubMed]
  11. Martinon, F.; Burns, K.; Tschopp, J. The inflammasome: A molecular platform triggering activation of inflammatory caspases and processing of proil-beta. Mol. Cell 2002, 10, 417–426. [Google Scholar] [CrossRef]
  12. Guarda, G.; Zenger, M.; Yazdi, A.S.; Schroder, K.; Ferrero, I.; Menu, P.; Tardivel, A.; Mattmann, C.; Tschopp, J. Differential expression of NLRP3 among hematopoietic cells. J. Immunol. 2011, 186, 2529–2534. [Google Scholar] [CrossRef] [PubMed]
  13. Martinon, F.; Mayor, A.; Tschopp, J. The inflammasomes: Guardians of the body. Annu. Rev. Immunol. 2009, 27, 229–265. [Google Scholar] [CrossRef] [PubMed]
  14. Strowig, T.; Henao-Mejia, J.; Elinav, E.; Flavell, R. Inflammasomes in health and disease. Nature 2012, 481, 278–286. [Google Scholar] [CrossRef] [PubMed]
  15. Allan, S.M.; Tyrrell, P.J.; Rothwell, N.J. Interleukin-1 and neuronal injury. Nat. Rev. Immunol. 2005, 5, 629–640. [Google Scholar] [CrossRef] [PubMed]
  16. Allen, I.C.; Wilson, J.E.; Schneider, M.; Lich, J.D.; Roberts, R.A.; Arthur, J.C.; Woodford, R.M.; Davis, B.K.; Uronis, J.M.; Herfarth, H.H.; et al. NLRP12 suppresses colon inflammation and tumorigenesis through the negative regulation of noncanonical NF-kappab signaling. Immunity 2012, 36, 742–754. [Google Scholar] [CrossRef] [PubMed]
  17. Williams, K.L.; Lich, J.D.; Duncan, J.A.; Reed, W.; Rallabhandi, P.; Moore, C.; Kurtz, S.; Coffield, V.M.; Accavitti-Loper, M.A.; Su, L.; et al. The caterpiller protein monarch-1 is an antagonist of toll-like receptor-, tumor necrosis factor alpha-, and mycobacterium tuberculosis-induced pro-inflammatory signals. J. Biol. Chem. 2005, 280, 39914–39924. [Google Scholar] [CrossRef] [PubMed]
  18. Lich, J.D.; Williams, K.L.; Moore, C.B.; Arthur, J.C.; Davis, B.K.; Taxman, D.J.; Ting, J.P. Monarch-1 suppresses non-canonical NF-kappab activation and P52-dependent chemokine expression in monocytes. J. Immunol. 2007, 178, 1256–1260. [Google Scholar] [CrossRef] [PubMed]
  19. National Institute of Health (NIH) Library of Network-Based Cellular Signatures (LINCS) Program. Available online: http://www.lincsproject.org/ (accessed on 11 June 2016).
  20. Lamb, J.; Crawford, E.D.; Peck, D.; Modell, J.W.; Blat, I.C.; Wrobel, M.J.; Lerner, J.; Brunet, J.P.; Subramanian, A.; Ross, K.N.; et al. The connectivity map: Using gene-expression signatures to connect small molecules, genes, and disease. Science 2006, 313, 1929–1935. [Google Scholar] [CrossRef] [PubMed]
  21. Chang, S.L.; Moldow, R.L.; House, S.D.; Zadina, J.E. Morphine affects the brain-immune axis by modulating an interleukin-1 beta dependent pathway. Adv. Exp. Med. Biol. 1996, 402, 35–42. [Google Scholar] [PubMed]
  22. Graf, J.A.; Patel, J.A.; Chang, S.L. Chronic exposure to morphine, but not ethanol, attenuates the expression of interleukin-1 beta converting enzyme in rat spleen. Immunol. Lett. 1997, 58, 153–157. [Google Scholar] [CrossRef]
  23. Zadina, J.E.; Kastin, A.J.; Harrison, L.M.; Ge, L.J.; Chang, S.L. Opiate receptor changes after chronic exposure to agonists and antagonists. Ann. N. Y. Acad. Sci. 1995, 757, 353–361. [Google Scholar] [CrossRef] [PubMed]
  24. House, S.D.; Mao, X.; Wu, G.; Espinelli, D.; Li, W.X.; Chang, S.L. Chronic morphine potentiates the inflammatory response by disrupting interleukin-1beta modulation of the hypothalamic-pituitary-adrenal axis. J. Neuroimmunol. 2001, 118, 277–285. [Google Scholar] [CrossRef]
  25. RT2 Profiler PCR Array Date Analysis version 3.5. Available online: http://pcrdataanalysis.sabiosciences.com/pcr/arrayanalysis.php (accessed 22 January 2017).
  26. Ma, J.; Malladi, S.; Beck, A.H. Systematic analysis of sex-linked molecular alterations and therapies in cancer. Sci. Rep. 2016, 6, 19119. [Google Scholar] [CrossRef] [PubMed]
  27. Siavelis, J.C.; Bourdakou, M.M.; Athanasiadis, E.I.; Spyrou, G.M.; Nikita, K.S. Bioinformatics methods in drug repurposing for Alzheimer’s disease. Brief. Bioinform. 2016, 17, 322–335. [Google Scholar] [CrossRef] [PubMed]
  28. Allen, I.C.; Lich, J.D.; Arthur, J.C.; Jania, C.M.; Roberts, R.A.; Callaway, J.B.; Tilley, S.L.; Ting, J.P. Characterization of NLRP12 during the development of allergic airway disease in mice. PLoS ONE 2012, 7, e30612. [Google Scholar] [CrossRef] [PubMed]
  29. Dostert, C.; Guarda, G.; Romero, J.F.; Menu, P.; Gross, O.; Tardivel, A.; Suva, M.L.; Stehle, J.C.; Kopf, M.; Stamenkovic, I.; et al. Malarial hemozoin is a NALP3 inflammasome activating danger signal. PLoS ONE 2009, 4, e6510. [Google Scholar] [CrossRef] [PubMed]
  30. Zaki, M.H.; Vogel, P.; Malireddi, R.K.; Body-Malapel, M.; Anand, P.K.; Bertin, J.; Green, D.R.; Lamkanfi, M.; Kanneganti, T.D. The nod-like receptor NLRP12 attenuates colon inflammation and tumorigenesis. Cancer Cell 2011, 20, 649–660. [Google Scholar] [CrossRef] [PubMed]
  31. Beug, S.T.; Cheung, H.H.; LaCasse, E.C.; Korneluk, R.G. Modulation of immune signalling by inhibitors of apoptosis. Trends Immunol. 2012, 33, 535–545. [Google Scholar] [CrossRef] [PubMed]
  32. Scherer, D.C.; Brockman, J.A.; Chen, Z.; Maniatis, T.; Ballard, D.W. Signal-induced degradation of I kappa B alpha requires site-specific ubiquitination. Proc. Natl. Acad. Sci. USA 1995, 92, 11259–11263. [Google Scholar] [CrossRef] [PubMed]
  33. Homji, N.F.; Mao, X.; Langsdorf, E.F.; Chang, S.L. Endotoxin-induced cytokine and chemokine expression in the HIV-1 transgenic rat. J. Neuroinflamm. 2012, 9, 3. [Google Scholar] [CrossRef] [PubMed]
  34. Del Fresno, C.; Garcia-Rio, F.; Gomez-Pina, V.; Soares-Schanoski, A.; Fernandez-Ruiz, I.; Jurado, T.; Kajiji, T.; Shu, C.; Marin, E.; Gutierrez del Arroyo, A.; et al. Potent phagocytic activity with impaired antigen presentation identifying lipopolysaccharide-tolerant human monocytes: Demonstration in isolated monocytes from cystic fibrosis patients. J. Immunol. 2009, 182, 6494–6507. [Google Scholar] [CrossRef] [PubMed]
  35. Fang, H.; Pengal, R.A.; Cao, X.; Ganesan, L.P.; Wewers, M.D.; Marsh, C.B.; Tridandapani, S. Lipopolysaccharide-induced macrophage inflammatory response is regulated by ship. J. Immunol. 2004, 173, 360–366. [Google Scholar] [CrossRef] [PubMed]
  36. Martich, G.D.; Boujoukos, A.J.; Suffredini, A.F. Response of man to endotoxin. Immunobiology 1993, 187, 403–416. [Google Scholar] [CrossRef]
  37. Porter, K.J.; Gonipeta, B.; Parvataneni, S.; Appledorn, D.M.; Patial, S.; Sharma, D.; Gangur, V.; Amalfitano, A.; Parameswaran, N. Regulation of lipopolysaccharide-induced inflammatory response and endotoxemia by beta-arrestins. J. Cell Physiol. 2010, 225, 406–416. [Google Scholar] [CrossRef] [PubMed]
  38. Mao, X.; Sarkar, S.; Chang, S.L. Involvement of the NLRP3 inflammasome in the modulation of an LPS-induced inflammatory response during morphine tolerance drug and alcohol dependence. Drug Alcohol Depend. 2013, 132, 38–46. [Google Scholar] [CrossRef] [PubMed]
  39. Limiroli, E.; Gaspani, L.; Panerai, A.E.; Sacerdote, P. Differential morphine tolerance development in the modulation of macrophage cytokine production in mice. J. Leukoc. Biol. 2002, 72, 43–48. [Google Scholar] [PubMed]
Figure 1. Inflammasome-related gene expression in the rat brain in response to lipopolysaccharide (LPS), with and without morphine tolerance. The expression of the inflammasome-related NOD-like receptor (NLR) genes (Naip2, Nlrp12, Nlrp5, Nlrc4, Nlrp1a, Nlrp3, Nlrp6, And Nlrx1) in the brains of rats given an i.p. injection of either 250 µg/kg LPS or saline, with and without morphine tolerance (n = 3–5 rats per group), was determined using a PCR array. Data were calculated using the ΔΔCT method, relative to the control group (placebo-control +saline), and are represented as a fold change. * p < 0.05, ** p < 0.01. Naip2: NLR family, apoptosis inhibitory protein 6; Nlrp12: NLR Family Pyrin Domain Containing 12; Nlrp5: NLR Family Pyrin Domain Containing 5; Nlrc4: NLR Family CARD Domain Containing 4; Nlrp1a: NLR family, pyrin domain containing 1A; Nlrp3: NLR Family Pyrin Domain Containing 3; Nlrp6: NLR Family Pyrin Domain Containing 6; Nlrpx1: NLR family member X1.
Brainsci 07 00014 g001
Figure 2. Inflammasome-related downstream gene expression in the rat brain in response to Lipopolysaccharides (LPS), with and without morphine tolerance. The expression of the inflammasome-related downstream signaling genes Baculoviral IAP Repeat-Containing 3 (Birc3) and NF-Kappa-B Inhibitor Alpha (Nfkbia) in the brains of rats given an i.p. injection of either 250 µg/kg LPS or saline, with and without morphine tolerance (n = 3–5 rats per group), was determined using a Polymerase Chain Reaction (PCR) array. The data were calculated using the ΔΔCT method relative to the control group (placebo-control + saline) and are represented as fold change.
Brainsci 07 00014 g002
Figure 3. Cytokine gene expression in the rat brain in response to lipopolysaccharides (LPS), with and without morphine tolerance. Gene expression of interleukins Interleukin (Il)-1β, Il-6, Il-12a, Il-12b, Il-18, and Il-33 in the brains of rats, with and without morphine tolerance, following an i.p. injection of either 250 µg/kg LPS or saline (n = 3–5 rats per group) was determined using a Polymerase Chain Reaction (PCR) array. Data were calculated using the ΔΔCT method relative to the control group (placebo-control + saline) and are represented as a fold change. * p < 0.05, ** p < 0.01, *** p < 0.001
Brainsci 07 00014 g003
Figure 4. Chemokine gene expression in the rat brain in response to Lipopolysaccharides (LPS), with and without morphine tolerance. Gene expression of the chemokines C-C motif chemokine ligand (Ccl)2, Ccl5, Ccl7, Ccl11, Ccl12, C-X-C motif chemokine ligand (Cxcl)1, and Cxcl3 in the brains of rats with and without morphine tolerance, following an i.p. injection of either 250 µg/kg LPS or saline (n = 3–5 rats per group), was determined using a Polymerase Chain Reaction (PCR) array. Data were calculated using the ΔΔCT method relative to the control group (placebo-control + saline) and are represented as a fold change. * p < 0.05, ** p < 0.01, *** p < 0.001
Brainsci 07 00014 g004
Table 1. Expression profile of inflammasomes and NLR genes in the rat brain in response to lipopolysaccharides (LPS), with and without morphine tolerance.
morphine-tolerant + saline/placebo control + salineplacebo control + LPS/placebo control + salinemorphine-tolerant + LPS/morphine-tolerant + saline
GeneFold Changep-value *Fold Change **p-value *Fold Change **p-value *
Card6−1.23470.078926−1.52920.004159−1.7140.017499
Casp11.15050.2992991.21320.2765931.27640.02969
Casp121.09720.4623471.54220.0036141.42490.092085
Casp8−1.04020.612597−1.13630.391056−1.26520.139999
Naip2−1.44830.067329−1.10310.619799−1.23160.25758
Nlrp12−1.65040.674422−7.310.002731−4.51240.025372
Nlrp51.4940.0548761.2740.207861.28190.027352
Nlrc41.00280.9157921.13490.1597121.10030.445719
Nlrp1a−1.08980.470844−1.20270.001147−1.33080.1379
Nlrp31.37730.1346471.51140.0545651.39560.02407
Nlrp61.2050.420019−1.62250.3589971.02930.784547
Nlrx1−1.15740.24832−1.14940.1910261.0390.679959
Nod2−1.62570.6501521.09010.8119461.28260.50395
Pycard−1.05750.610143−1.02850.797363−1.23630.030115
* For p-value, letters in red mean p < 0.05. ** For Fold Change, letters in red mean fold change >2 and letters in blue mean the fold change <−2. For the color lines, Brainsci 07 00014 i001: 6–10 fold decrease; Brainsci 07 00014 i002: 2–5 fold decrease; Brainsci 07 00014 i003: <2 fold; Brainsci 07 00014 i004: 2–5 fold increase; Brainsci 07 00014 i005: 6–10 fold increase; Brainsci 07 00014 i006: 11–30 fold increase; Brainsci 07 00014 i007: 31–50 fold increase.
Table 2. Expression profile of inflammasome-related downstream signaling genes in the rat brain in response to lipopolysaccharides (LPS), with and without morphine tolerance. Full name of the genes were provided in Appendix Table A1.
morphine-tolerant + saline/placebo control + salineplacebo control + LPS/placebo control + salinemorphine-tolerant + LPS/morphine-tolerant + saline
GeneFold Changep-value *Fold Change **p-value *Fold Change **p-value *
Bcl21.04690.8632331.05860.8452541.23980.339246
Bcl2l1−1.12560.011111.05720.476643−1.02910.671184
Birc21.05090.586337−1.02810.6224871.06990.531417
Birc31.06480.58751320.93560.01106521.50250.001873
Cflar1.02260.6973461.30210.0047481.21550.140978
Chuk1.18670.119108−1.02330.7548911.15930.073058
Ciita−1.06170.7508791.06190.8733631.46780.39646
Ctsb−1.00090.978499−1.06560.617885−1.10460.493204
Fadd−1.12610.2588841.12350.2524861.03060.71174
Hsp90aa11.27740.1143491.03910.7433751.1890.149024
Hsp90ab11.07520.376876−1.09680.3054271.15790.18515
Ikbkb1.07180.550623−1.00110.9629921.17990.201955
Ikbkg1.09240.324904−1.04020.4927251.14190.079202
Irak11.15490.0626481.02870.7553951.22130.242955
Map3k7−1.24950.002404−1.10080.434596−1.24970.114056
Map3k7ip1−1.03350.664499−1.11510.3692261.020.864431
Map3k7ip2−1.28690.000867−1.11690.456355−1.34270.007785
Mapk1−1.05270.468581−1.08870.1590971.03160.724595
Mapk11−1.06730.530192−1.07060.578016−1.06330.571223
Mapk121.14240.4206841.18890.372287−1.02550.780819
Mapk13−1.16290.924422−1.54230.3558261.05040.651078
Mapk141.00180.940725−1.03180.817951.03350.709962
Mapk3−1.12940.224192−1.1210.372958−1.04950.76638
Mapk81.03830.883566−1.02150.7982671.00370.911563
Mapk9−1.12520.03886−1.00750.87718−1.08050.288977
Mefv1.25720.2788071.25820.4634961.91920.028283
Myd881.02110.7911371.01030.9174161.21850.03802
Nfkb11.10980.2791161.29190.0898811.33230.033357
Nfkbia−1.02940.8350213.8850.0012153.37440.001348
Nfkbib−1.14730.330475−1.01530.762037−1.11670.643504
P2rx7−1.15860.4284921.07420.6255491.05780.661519
Panx1−1.0760.2755751.14550.4068631.11010.334734
Pea15a−1.09430.291531−1.0430.625202−1.08020.492135
Pstpip1−1.10410.527175−1.10180.680263−1.02320.87342
Ptgs2−1.080.4993641.51260.0005711.17620.323717
Rage1.07290.478448−1.12730.174231.18540.16574
Rela1.01710.8047441.18010.4178061.25040.106174
Ripk2−1.10570.2377621.29130.0280061.11990.389288
Sugt11.00630.918273−1.10230.519396−1.12640.106262
Tirap−1.30980.094434−1.09710.5357211.08090.374146
Hsp90b11.04750.680071−1.03340.69801−1.08770.314466
Traf6−1.03440.915204−1.01710.9433041.09880.437323
Txnip−1.07610.70951−1.07180.699702−1.01870.789181
Xiap1.05720.503462−1.05580.4715241.00890.93573
* For p-value, letters in red mean p < 0.05. ** For Fold Change, letters in red mean fold change >2 and letters in blue mean the fold change <−2. For the color line, Brainsci 07 00014 i008: 6–10 fold decrease; Brainsci 07 00014 i009: 2–5 fold decrease; Brainsci 07 00014 i010: <2 fold; Brainsci 07 00014 i011: 2–5 fold increase; Brainsci 07 00014 i012: 6–10 fold increase; Brainsci 07 00014 i013: 11–30 fold increase; Brainsci 07 00014 i014: 31–50 fold increase.
Table 3. Expression profile of the cytokine and chemokine genes in the rat brain in response to LPS, with and without morphine tolerance.
morphine-tolerant + saline/placebo control + salineplacebo control + LPS/placebo control + salinemorphine-tolerant + LPS/morphine-tolerant + saline
GeneFold Change **p-value *Fold Change **p-value *Fold Change **p-value *
Ccl11−2.46620.023104−2.86390.16576−2.73460.249229
Ccl12−1.43620.6465292.02140.2190152.11080.399119
Ccl21.17560.52141223.78450.0013549.14970.106064
Ccl5−1.1050.4724341.29090.290174−1.09490.766893
Ccl7−1.08410.68816710.71880.0002596.95280.163034
Cxcl11.01310.94485436.8609014.47180.130008
Cxcl31.62080.0196738.19090.0000763.64770.170486
Cd40lg−2.27960.2157531.11190.704126−2.40540.273798
Ifnb11.25190.9364191.68990.3913021.56950.513801
Ifng1.53550.2904131.16980.7678822.26150.088346
Il12a1.050.575571.11780.338551.08370.456191
Il12b2.55870.268288.10550.1023412.0770.198782
Il181.0680.600151.04840.707002−1.11510.48359
Il1b−1.24760.2845016.73660.0013833.31360.089312
Il331.23420.0546151.04070.5838231.19780.072613
Il62.0230.4593712.03030.0080587.09430.083969
Irf11.12990.5211563.45750.0003863.41040.01276
Irf2−1.14810.0507821.00270.9164811.05560.593809
Irf3−1.28240.024657−1.32250.225481−1.24780.088625
Irf4−1.14910.43182−1.05570.8468661.02630.858979
Irf5−1.10240.38296−1.14680.3769531.03910.841777
Irf61.10550.4134631.0120.7920251.1180.272222
Tnfsf11−1.60770.800779−1.3620.519436−1.32660.965379
Tnfsf14−1.3960.243156−1.84450.126355−1.42780.629476
Tnfsf4−1.01750.997398−1.08870.790199−1.34220.420711
* For p-value, letters in red mean p < 0.05. ** For Fold Change, letters in red mean fold change >2 and letters in blue mean the fold change <−2. For the color lines, Brainsci 07 00014 i015: 6–10 fold decrease; Brainsci 07 00014 i016: 2–5 fold decrease; Brainsci 07 00014 i017: <2 fold; Brainsci 07 00014 i018: 2–5 fold increase; Brainsci 07 00014 i019: 6–10 fold increase; Brainsci 07 00014 i020: 11–30 fold increase; Brainsci 07 00014 i021: 31–50 fold increase.
Table 4. LINCS Consensus Knockdown Connections from differentially expressed genes in the rat brain in response to lipopolysaccharides (LPS), with and without morphine tolerance. (A) Top 10 Consensus Knockdown Connections in the three sets of gene comparisons; (B) Rankings of the top three Consensus Knockdown Connections in the three sets of gene comparisons. Full name of the genes were provided in Appendix Table A2.
(A)Rankplacebo-Saline vs. Placebo-LPSPlacebo-Saline vs. Morphine-Tolerant-SalineMorphine-Tolerant-Saline vs. Morphine-Tolerant-LPS
1VPS28SMARCE1AHR
2PROCRAHRRUBE2L6
3CHMP2AGPX7PAFAH1B3
4MBATP5F1VPS28
5ZNF768CALRJUNB
6RBPJGPR110RYK
7WARS2CHMP2AARG1
8TBX2ELF4PROC
9MRPS2FGFR1ZNF324
10MAP3K14F7ATP5D
(B)Gene RankPlacebo-Saline vs. Placebo-LPSPlacebo-Saline vs. Morphine-Tolerant-SalineMorphine-Tolerant-Saline vs. Morphine-Tolerant-LPS
VPS281424
PROCR2491681
CHMP2A37177
SMARCE1-16751504
AHRR23832460
GPX748832137
AHR467691
UBE2L6895452
PAFAH1B3956223

