
Field-Scale Testing of a High-Efficiency Membrane Reactor (MR)—Adsorptive Reactor (AR) Process for H2 Generation and Pre-Combustion CO2 Capture


Abstract
:1. Introduction
- The lab-scale experimental MR-AR system was designed, constructed, and tested, appropriate CMSM, adsorbents, and catalysts were selected and characterized, and experimentally validated relevant multi-scale mathematical models were developed. Subsequently, the proposed process was experimentally tested using a simulated gasifier off-gas (from both air-blown and oxygen-blown coal gasifiers), and based on the lab-scale results, an initial technical and economic feasibility study was completed.
- For use in the lab-scale experiments, “state-of-the-art” leading CMSMs we prepared with exceptional performance meeting all the original project targets (set forth by US DOE, which funded the laboratory study): H2 permeance (1 to 1.5 m3/m2/h/bar, or 370.3 to 555.5 GPU) and a H2/CO selectivity of >80 in the relevant temperature (up to 300 °C) and pressure conditions (up to 25 bar). The CMSMs exhibited very robust and stable performances during a continuous long-term run (over >500 h of H2S exposure at 25 bar of pressure) and maintained high He/N2 (~126) and H2/CO (~100) selectivities over a total of 742 h of H2S exposure. The same type of CMSM but with a larger length was utilized in the pilot-scale project.
- Hydrotalcite (HTC) adsorbents were prepared and characterized in high (up to 30 bar) pressure conditions. These materials showed maximum CO2 uptake capacities of >10 wt.% and working capacities under cyclic AR conditions of ~3 wt.% and exhibited stable performance during CO2 cycling in various atmospheres, including a >500-h continuous MR-AR run. A commercial sour-shift catalyst was utilized in the lab-scale experiments, and data-validated global rate expressions were developed to simulate the lab-scale MR-AR system as well as in the generation of a preliminary process technoeconomic analysis (TEA). The same adsorbents and catalysts were used in the field-scale project.
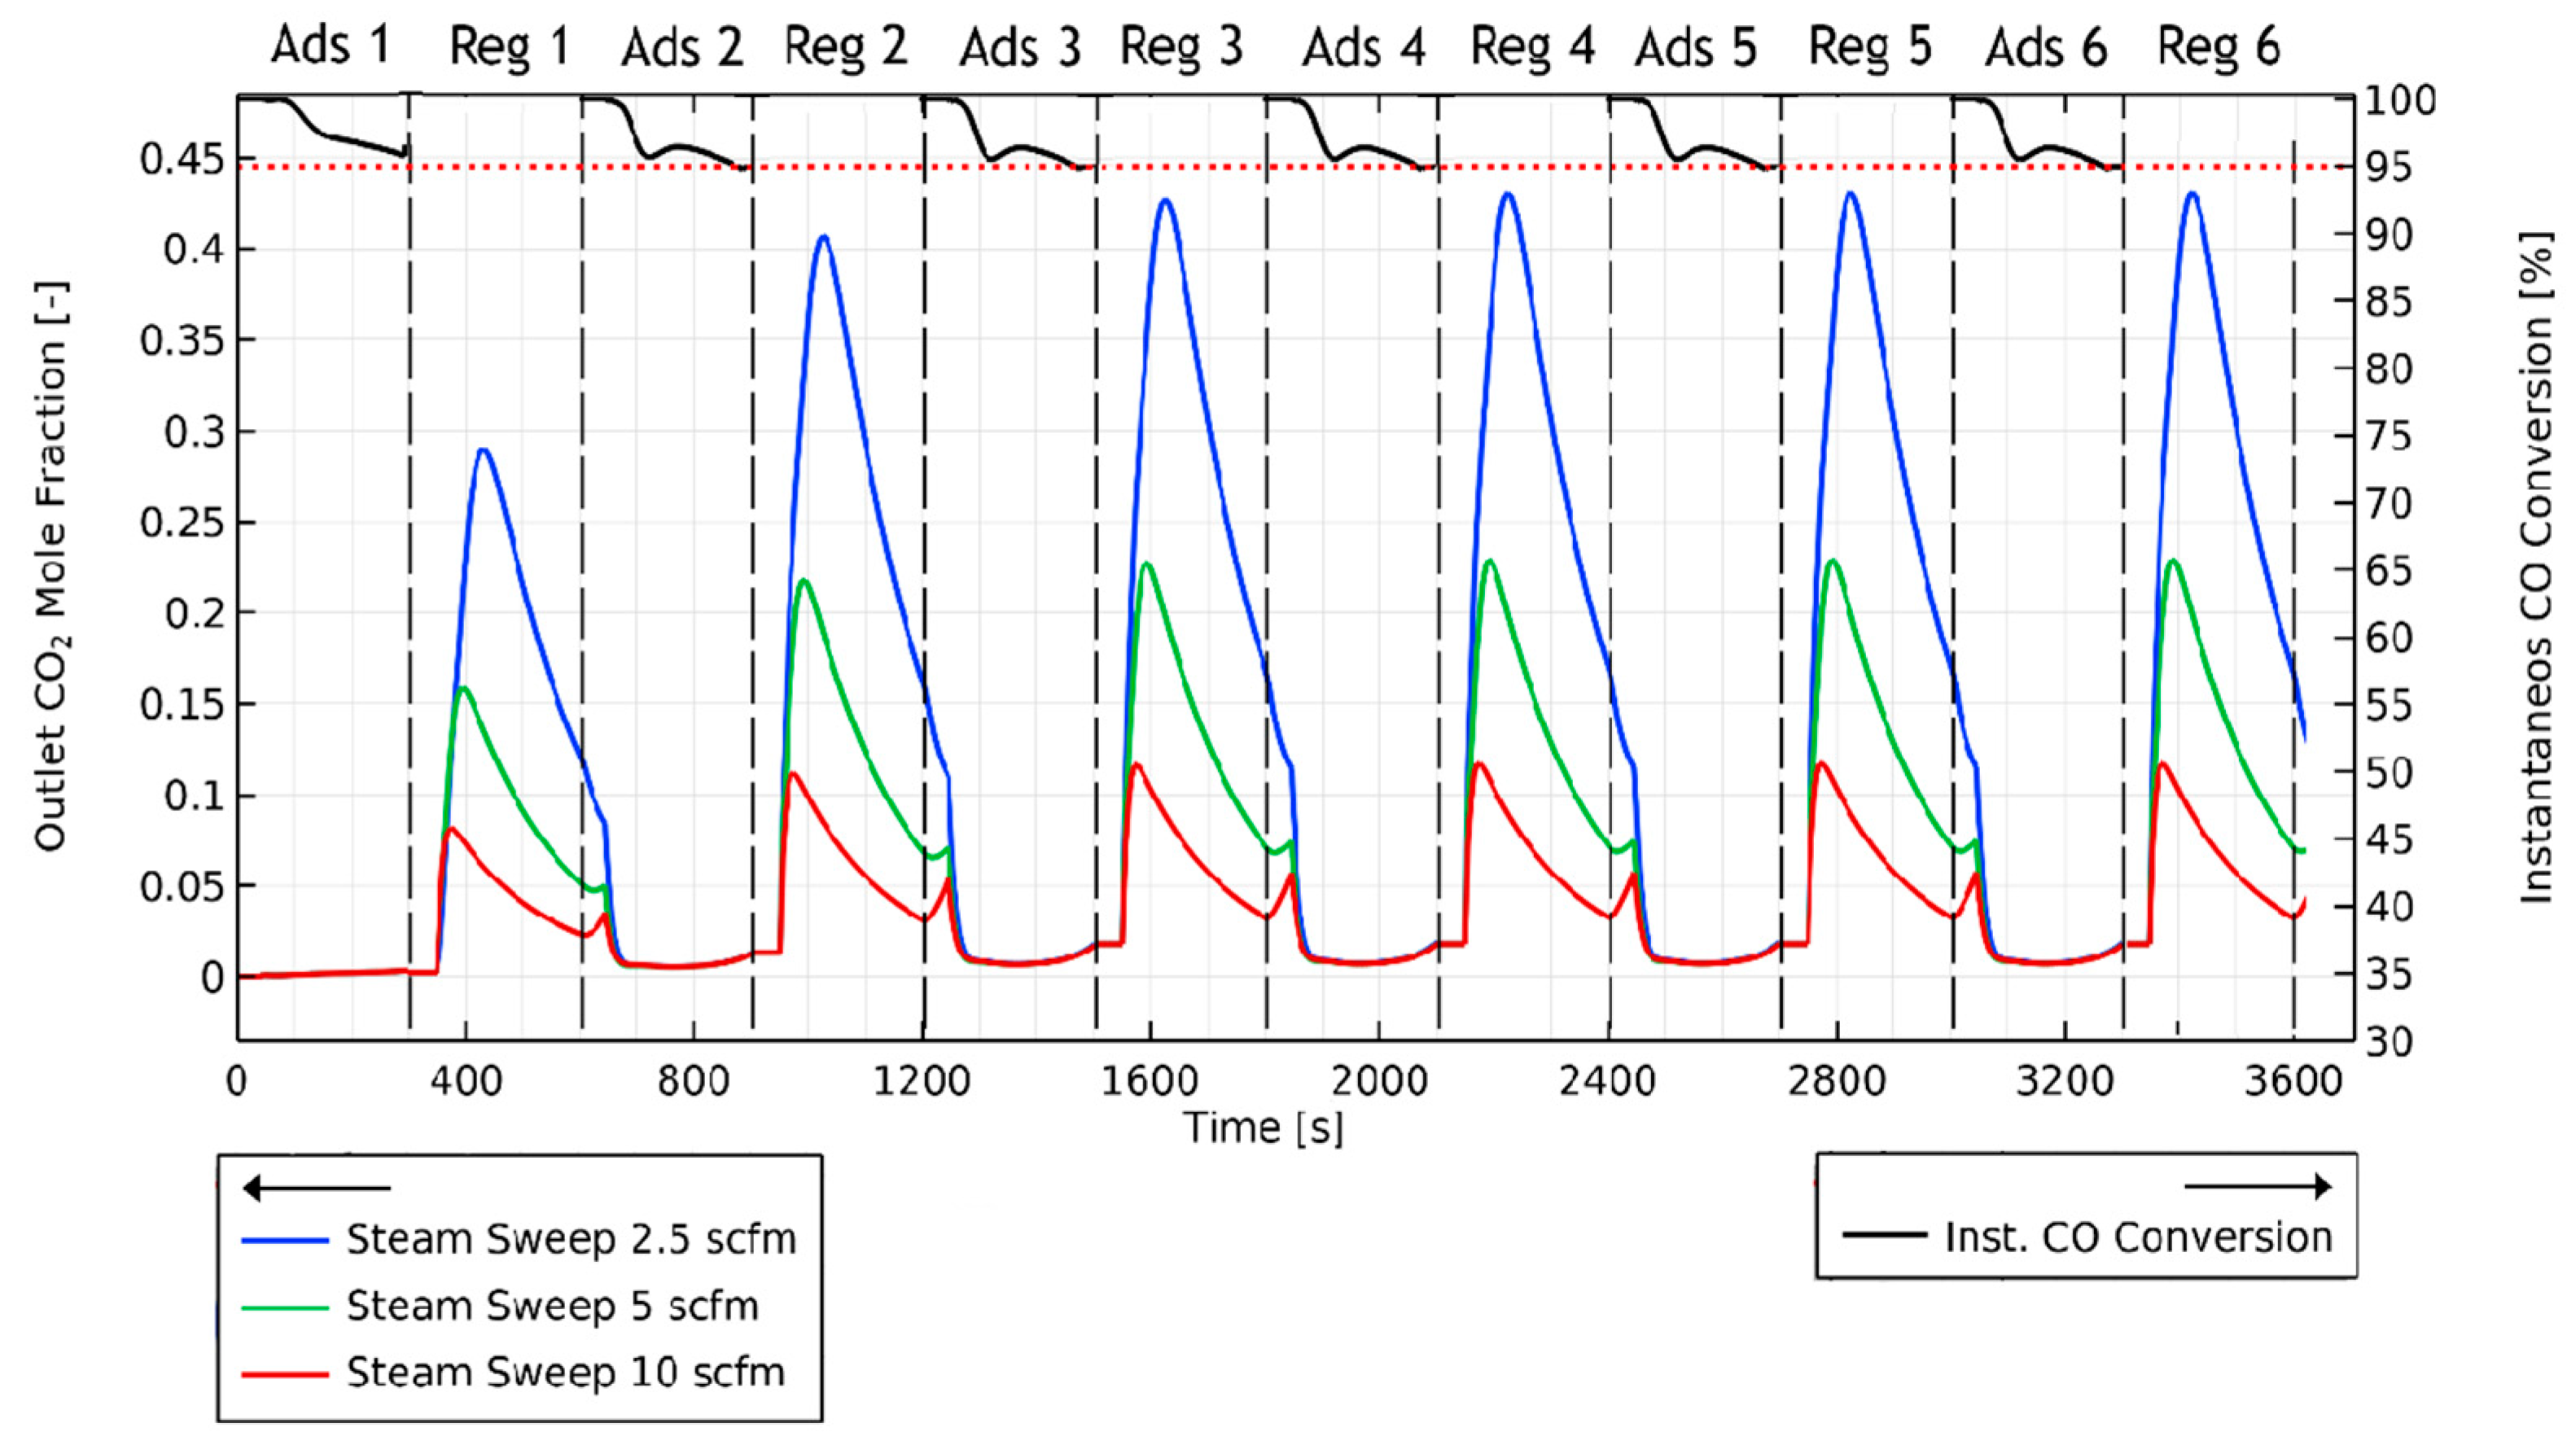
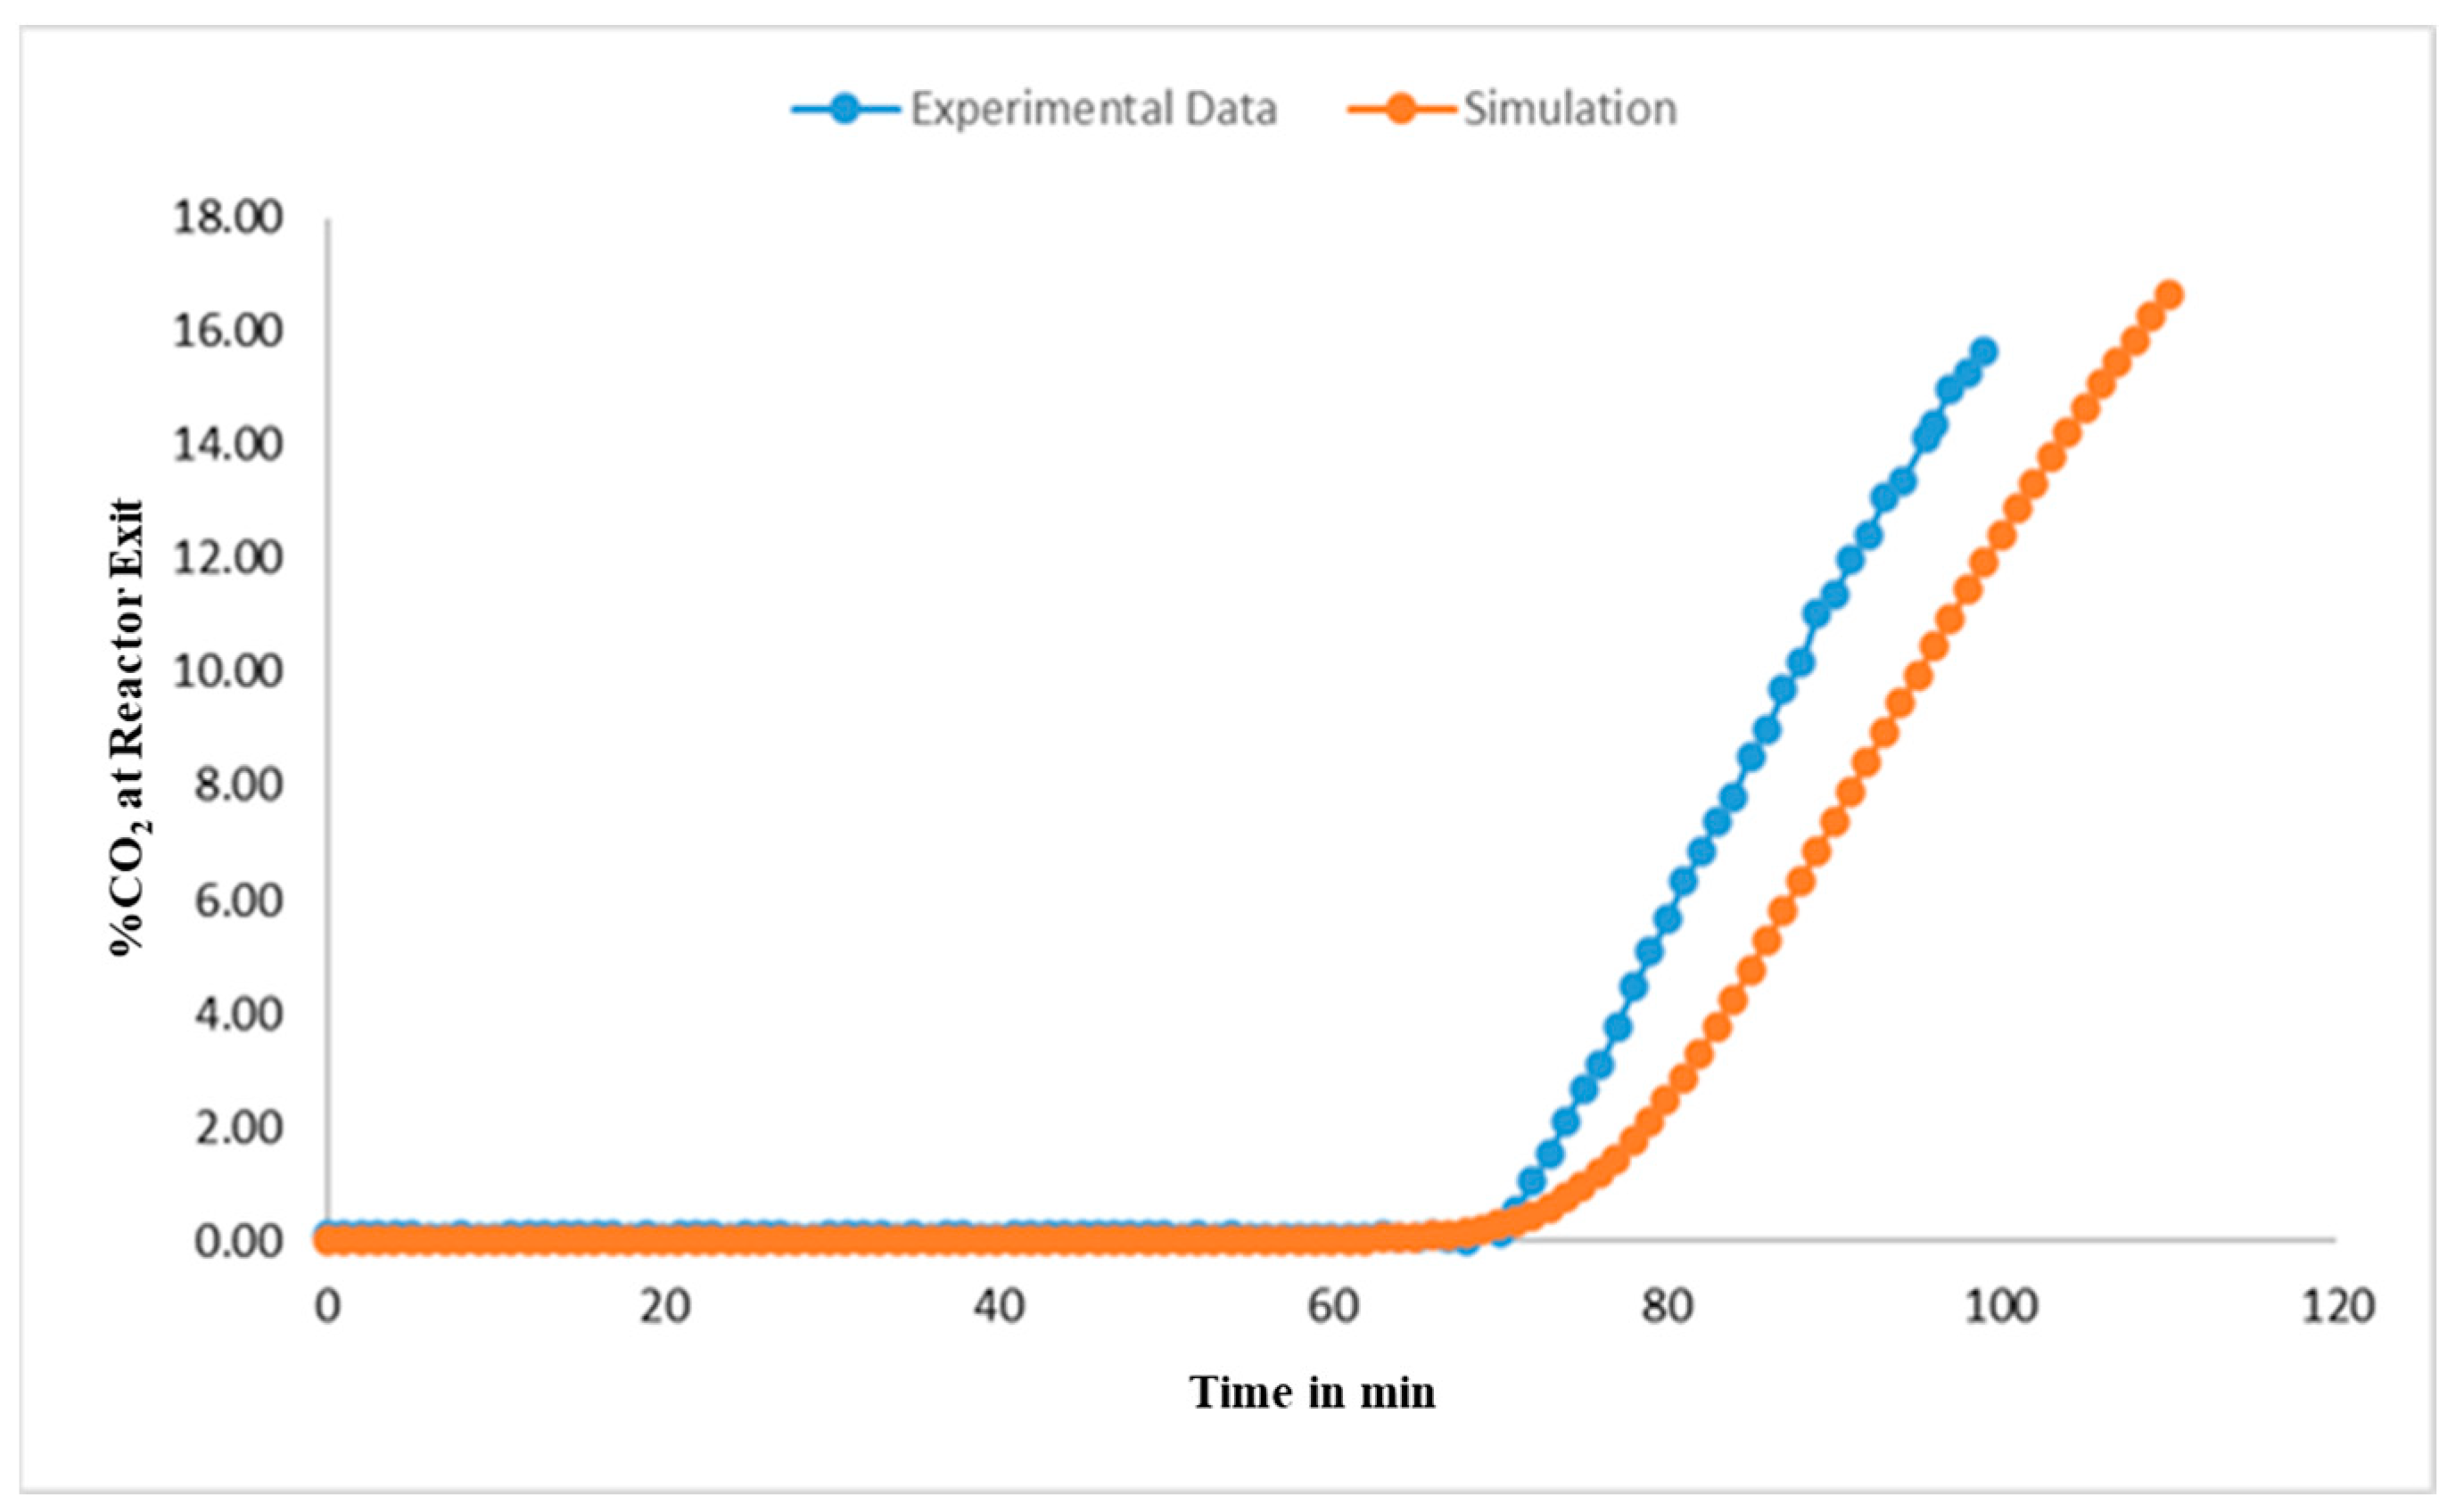
- The integrated MR-AR lab-scale system was tested during numerous multiple-cycle runs with simulated gasifier off-gas and displayed superior performance to that of a conventional packed bed reactor (PBR) generating a high-purity H2 product, which is directly usable in a hydrogen turbine for power generation. A key conclusion from the lab-scale study that motivated the field-scale efforts was that the CMSM, catalyst, and adsorbent were very robust and stable under the large H2S concentration, high-temperature, and high-pressure IGCC-like environment during the long-period lab-scale MR-AR multiple-cycle run (similar in duration to the field-scale test).
2. Results and Discussion
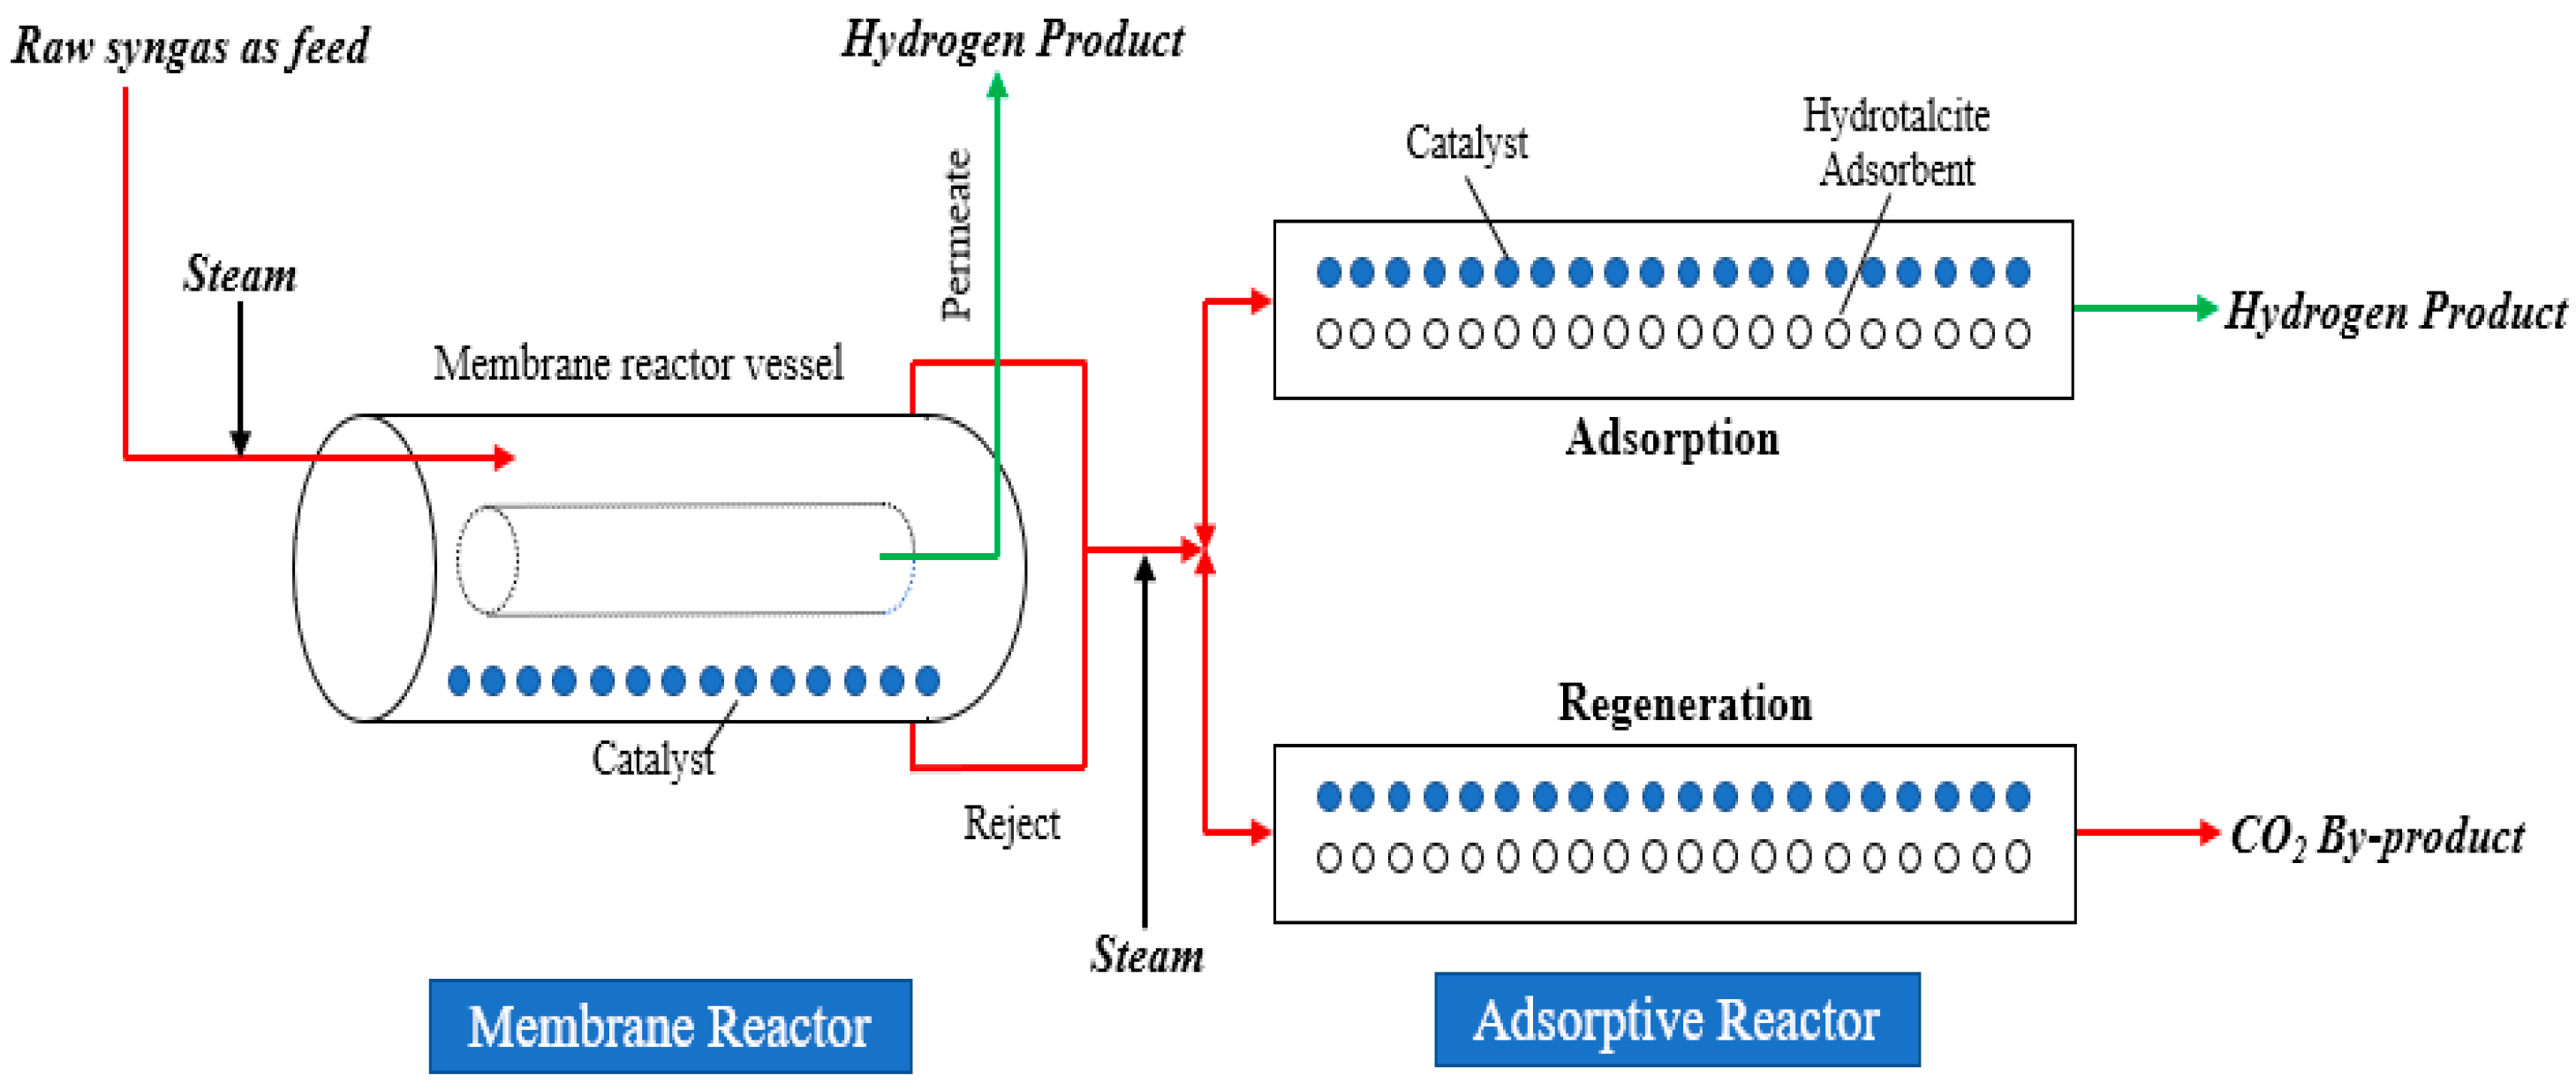
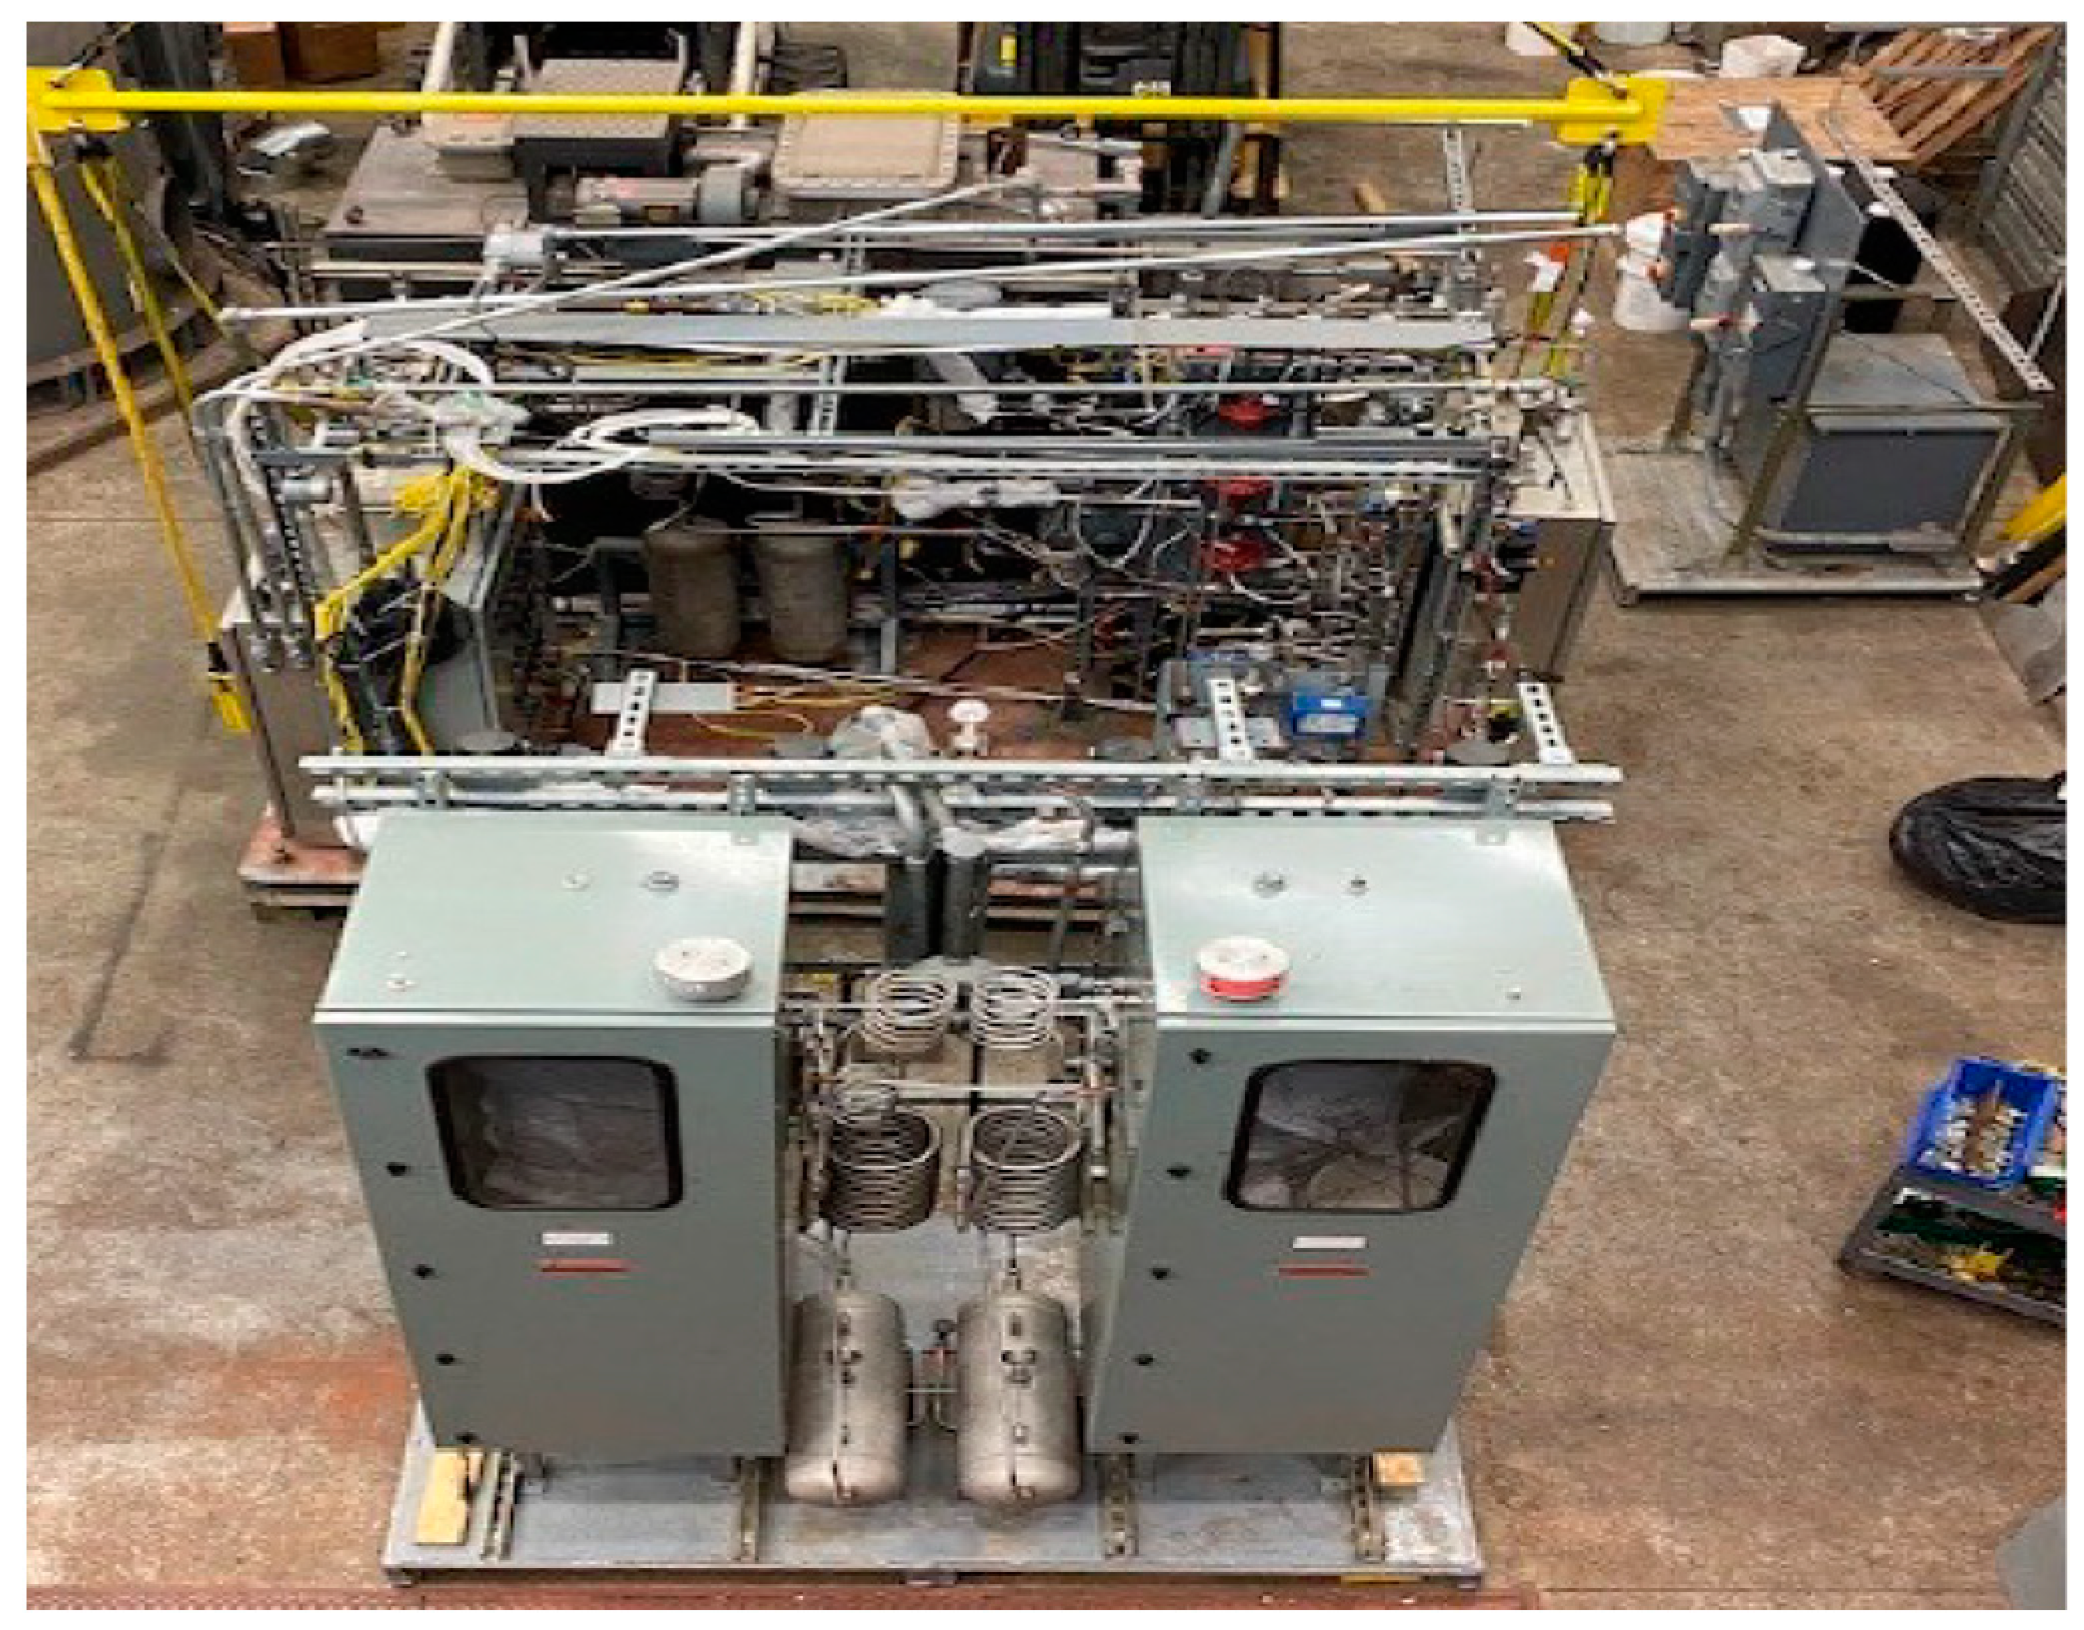
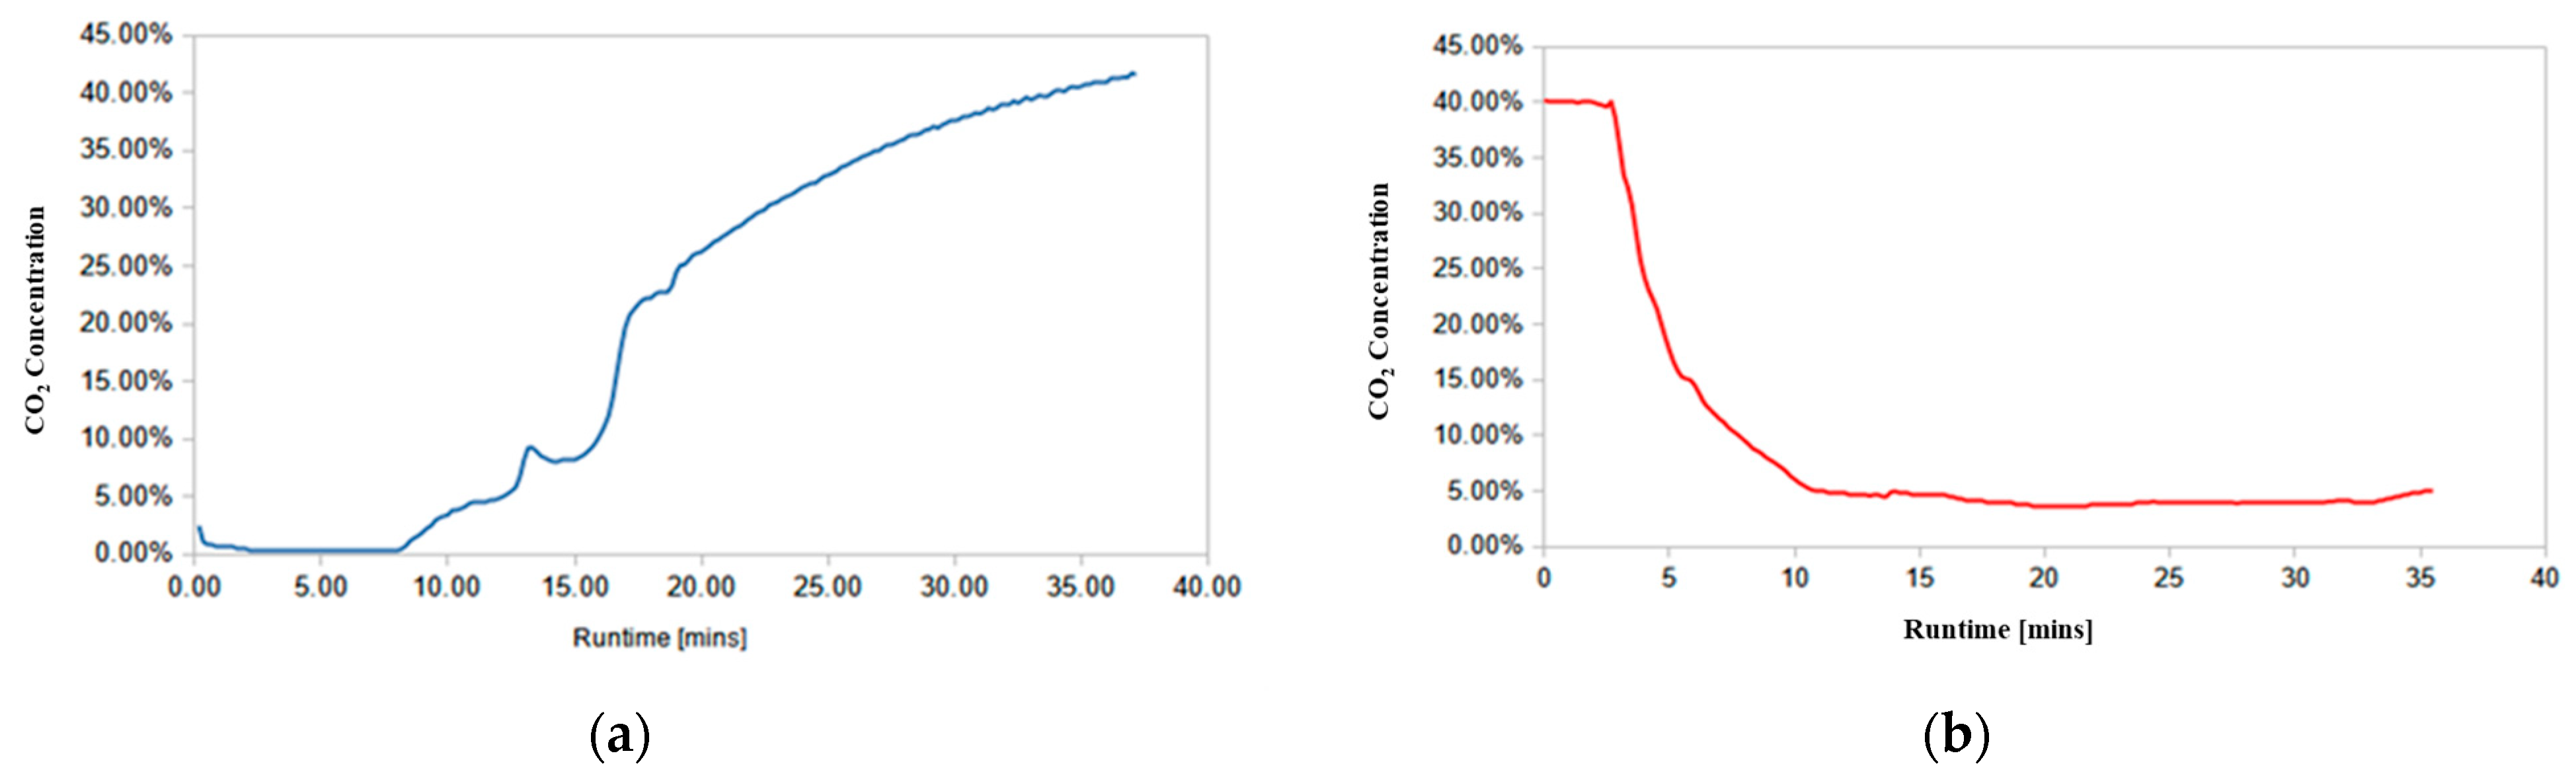
2.1. Design, Construction, Assembly, and Preliminary Testing of the Field-Scale Unit
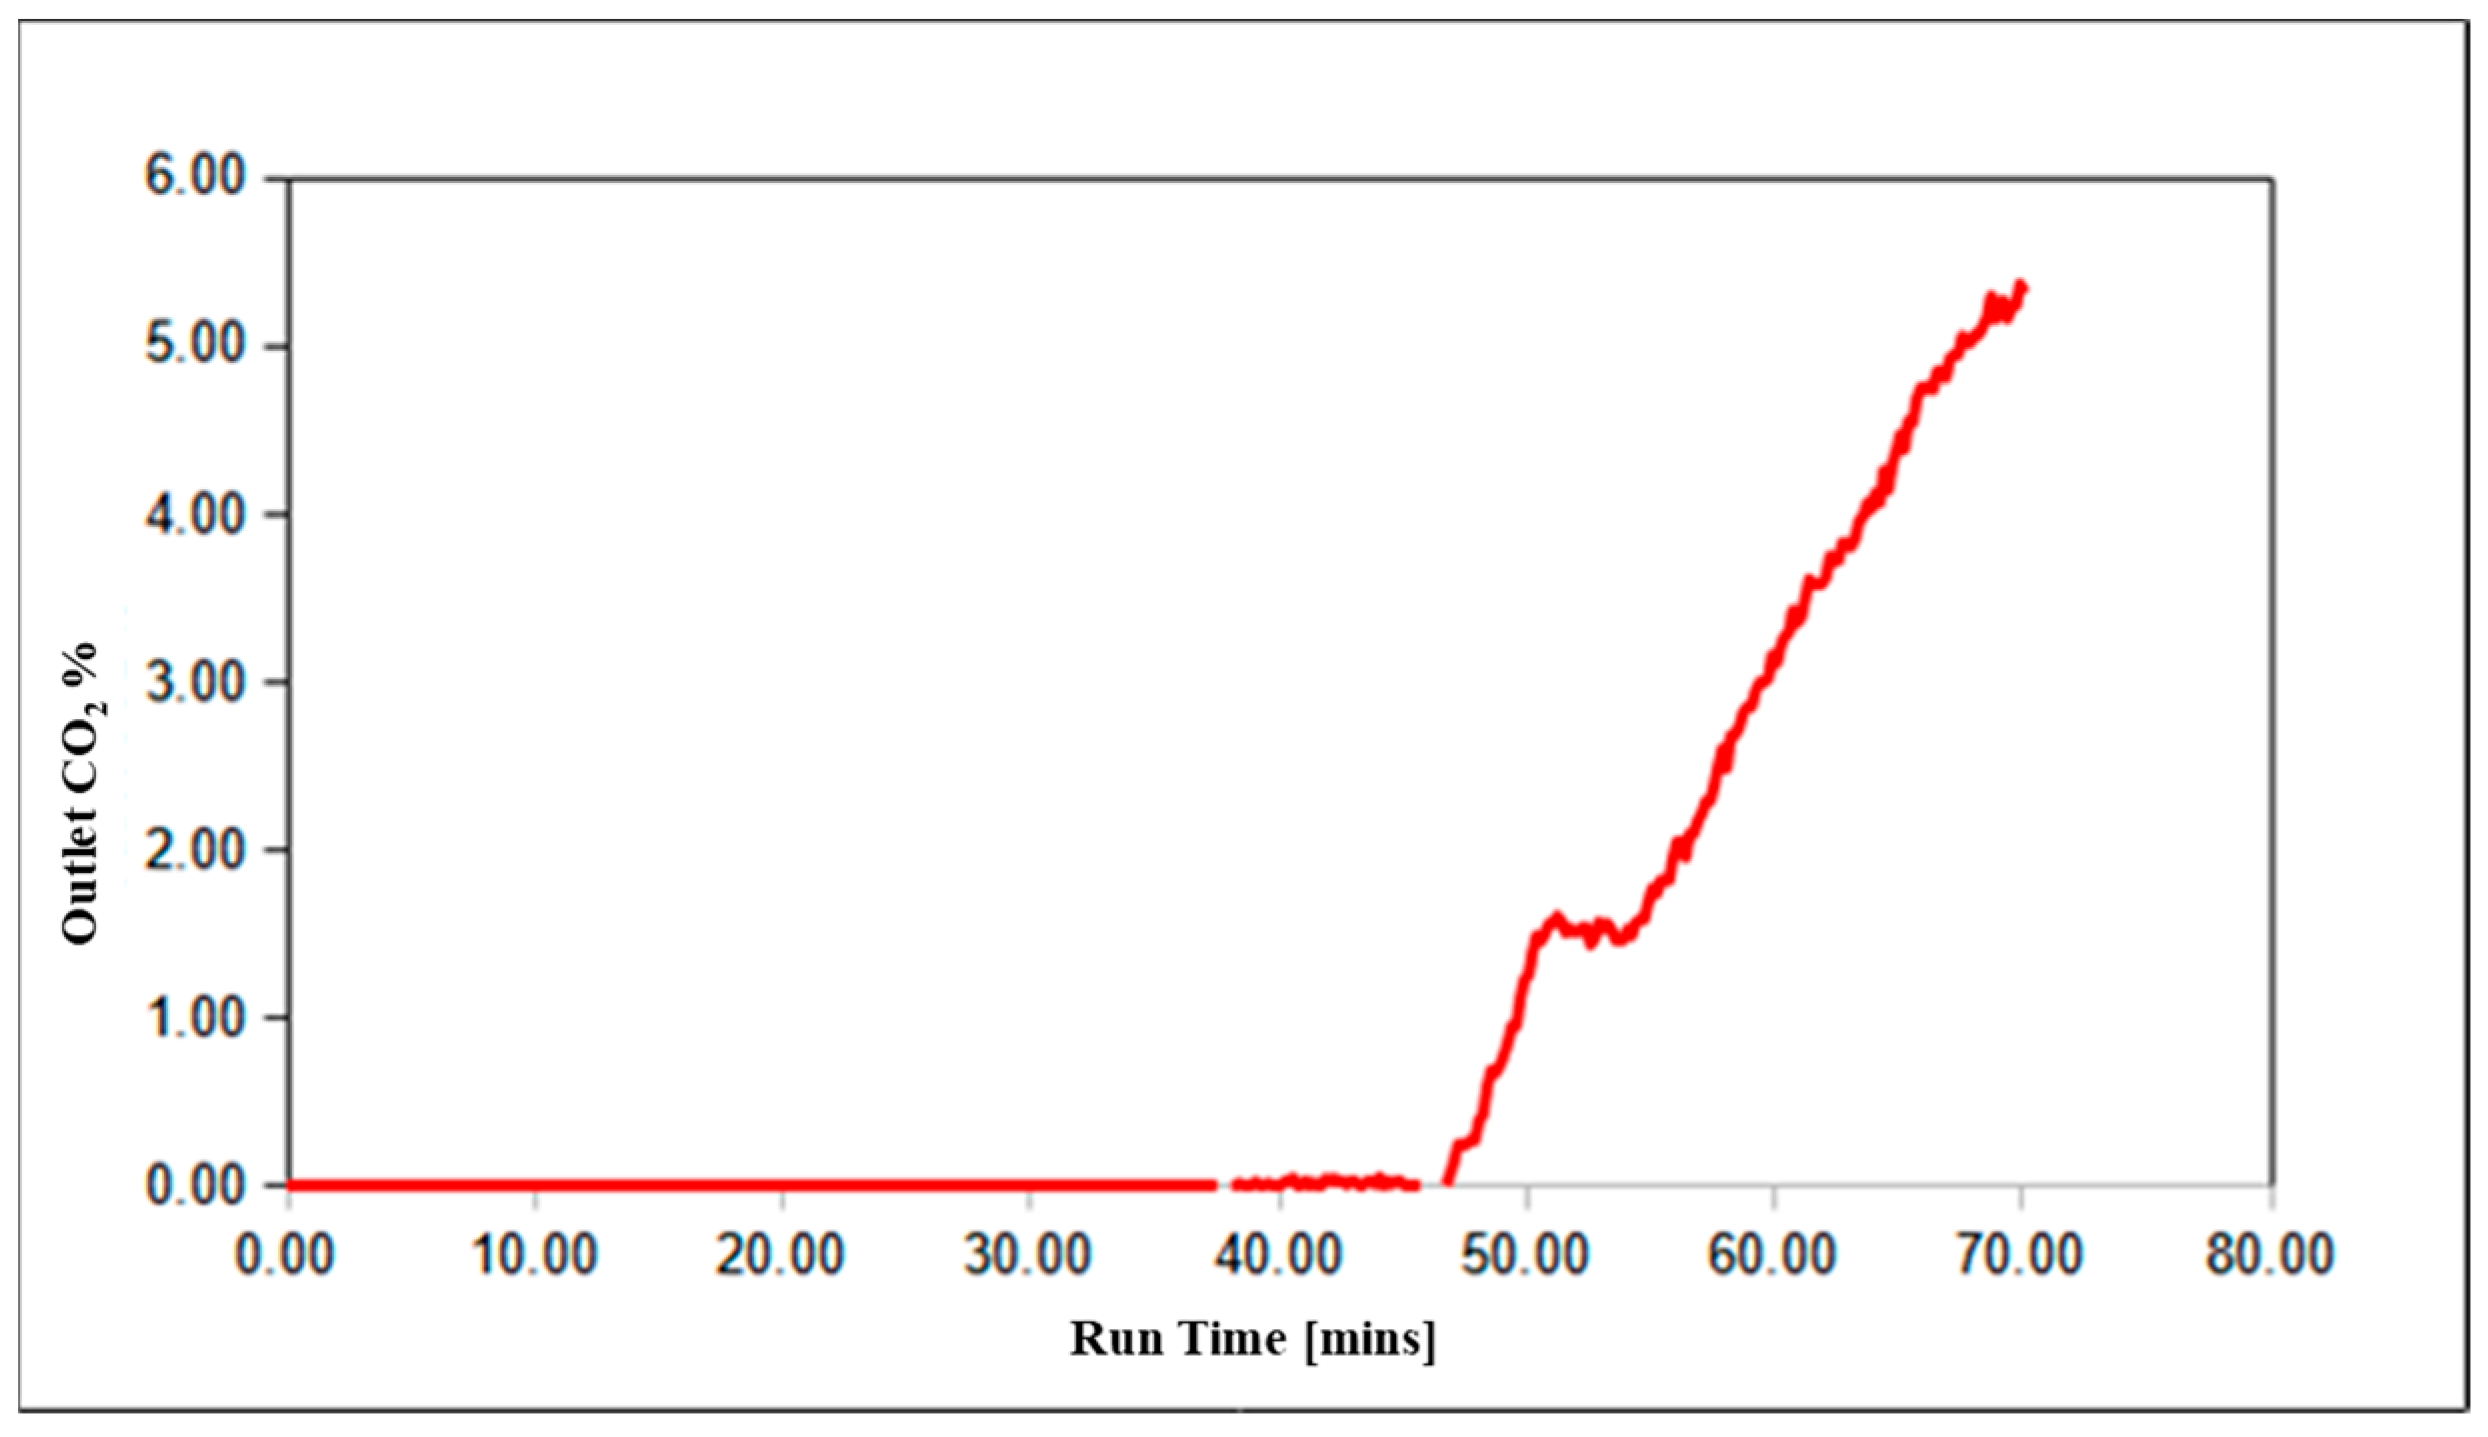
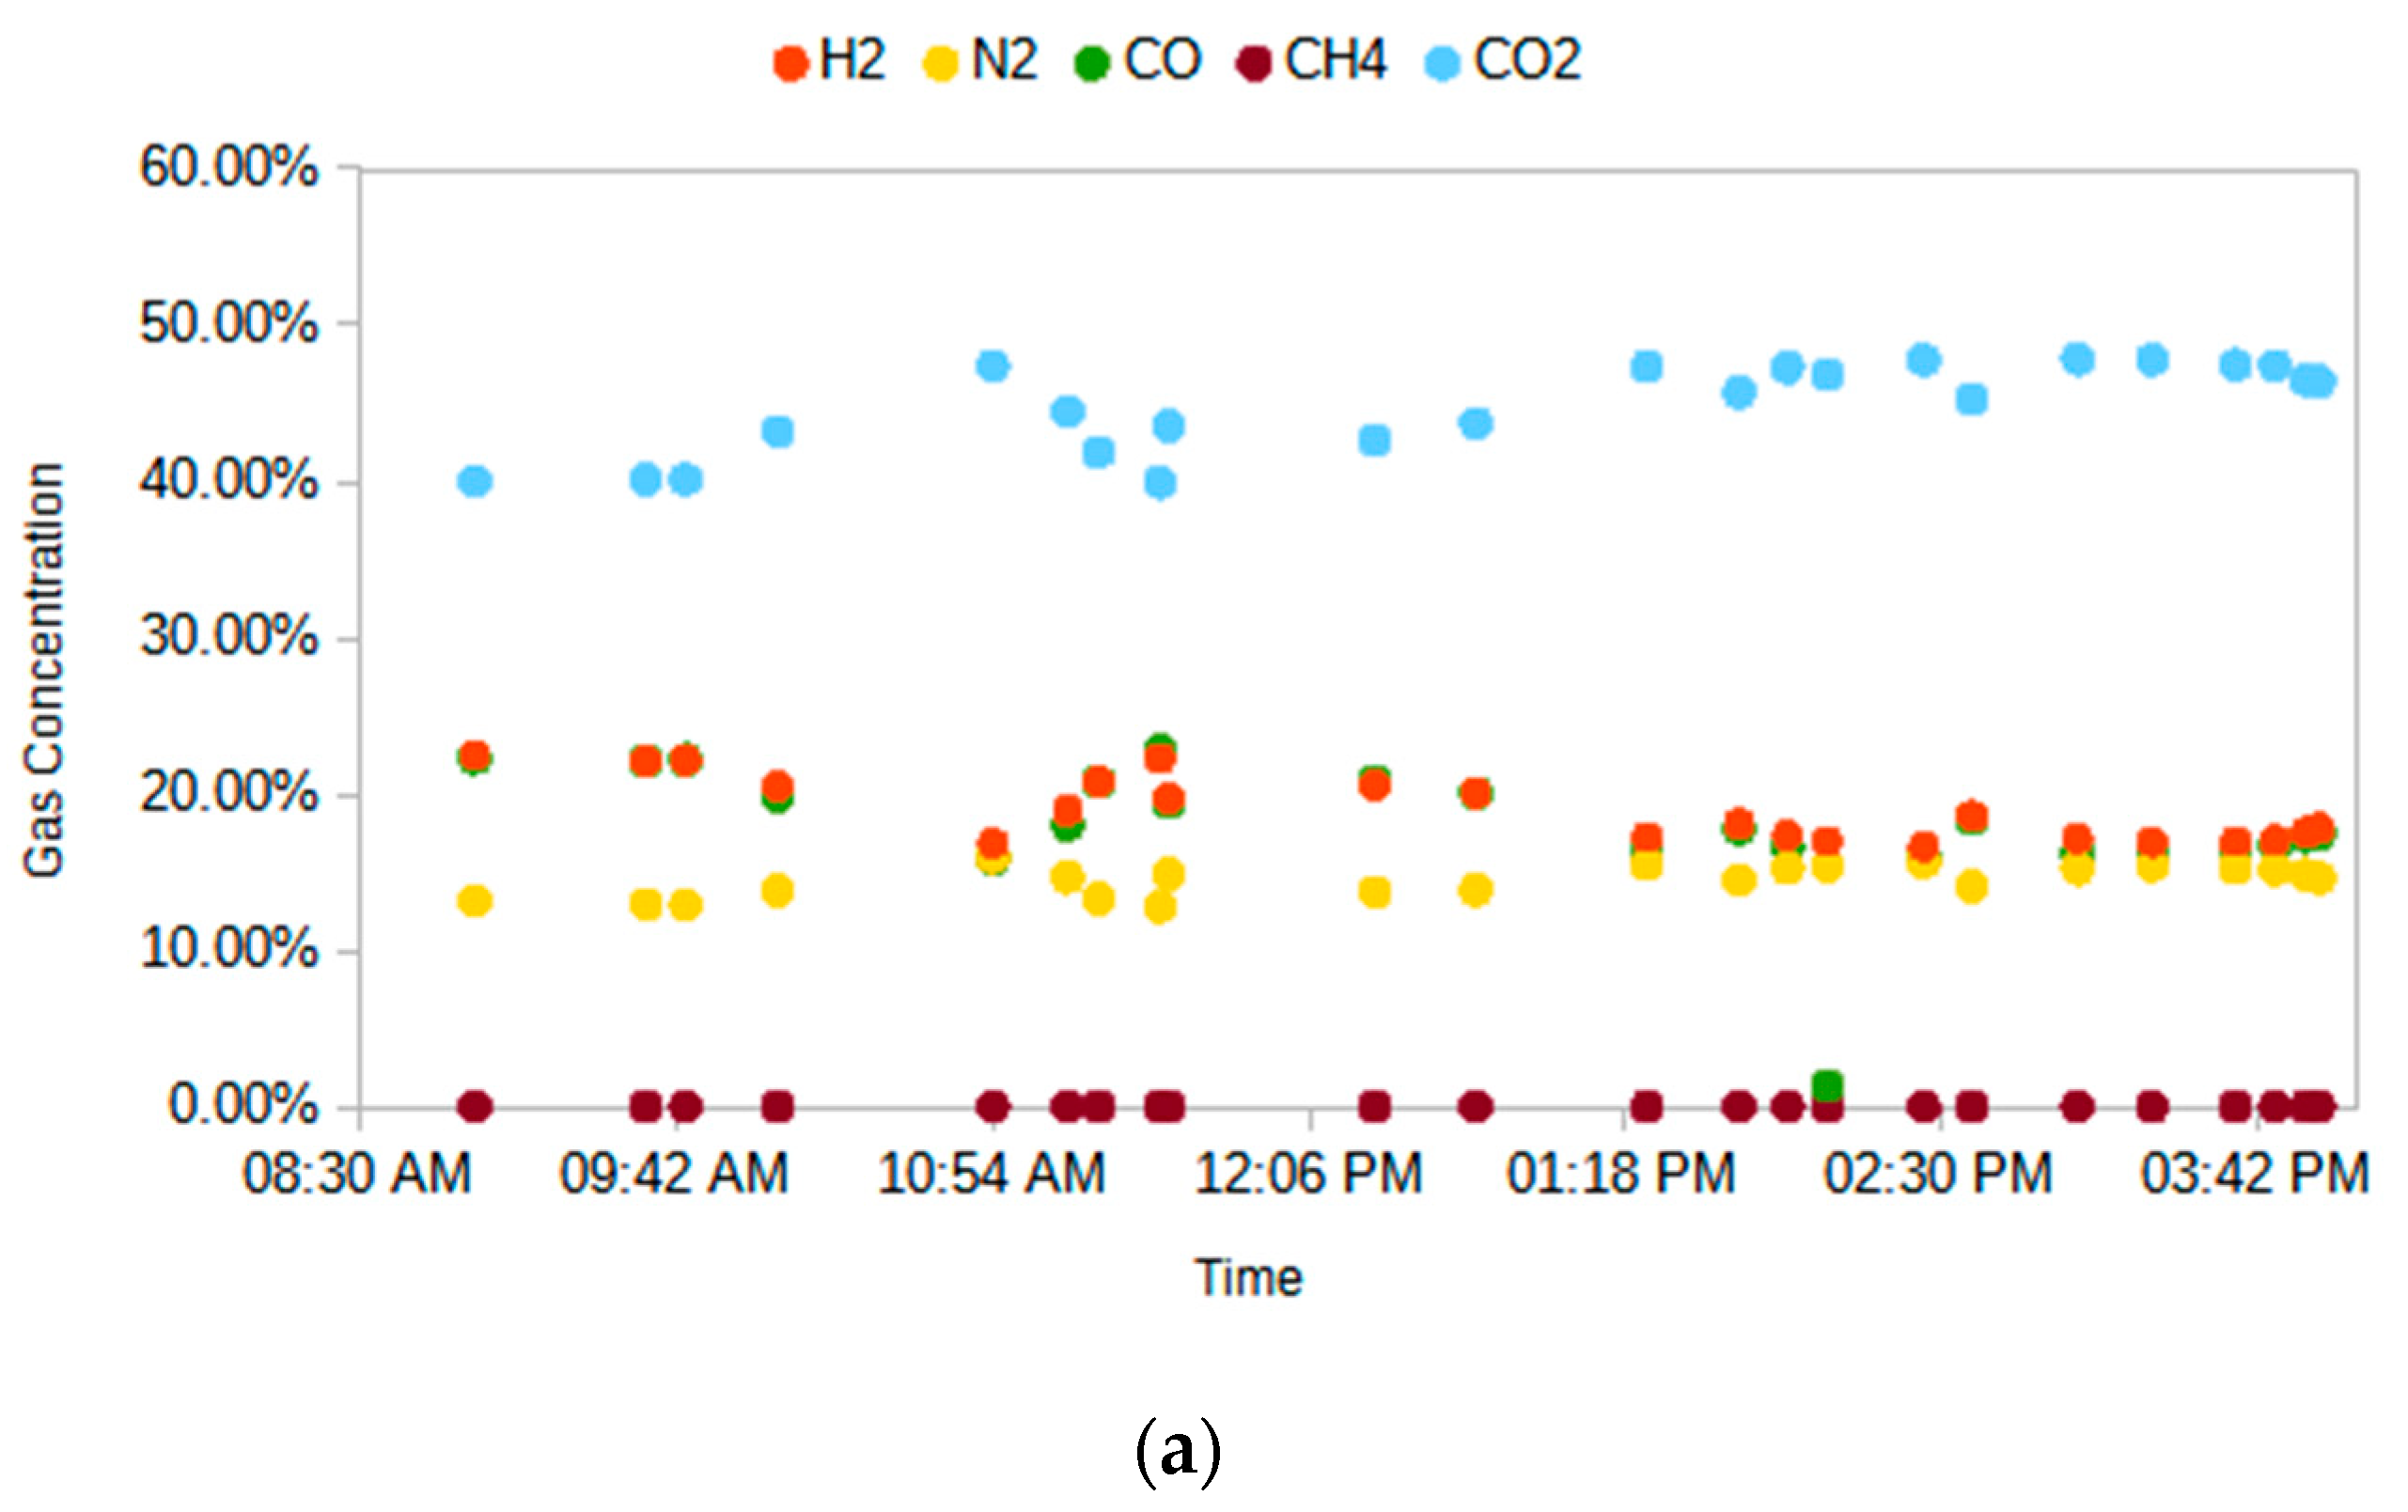
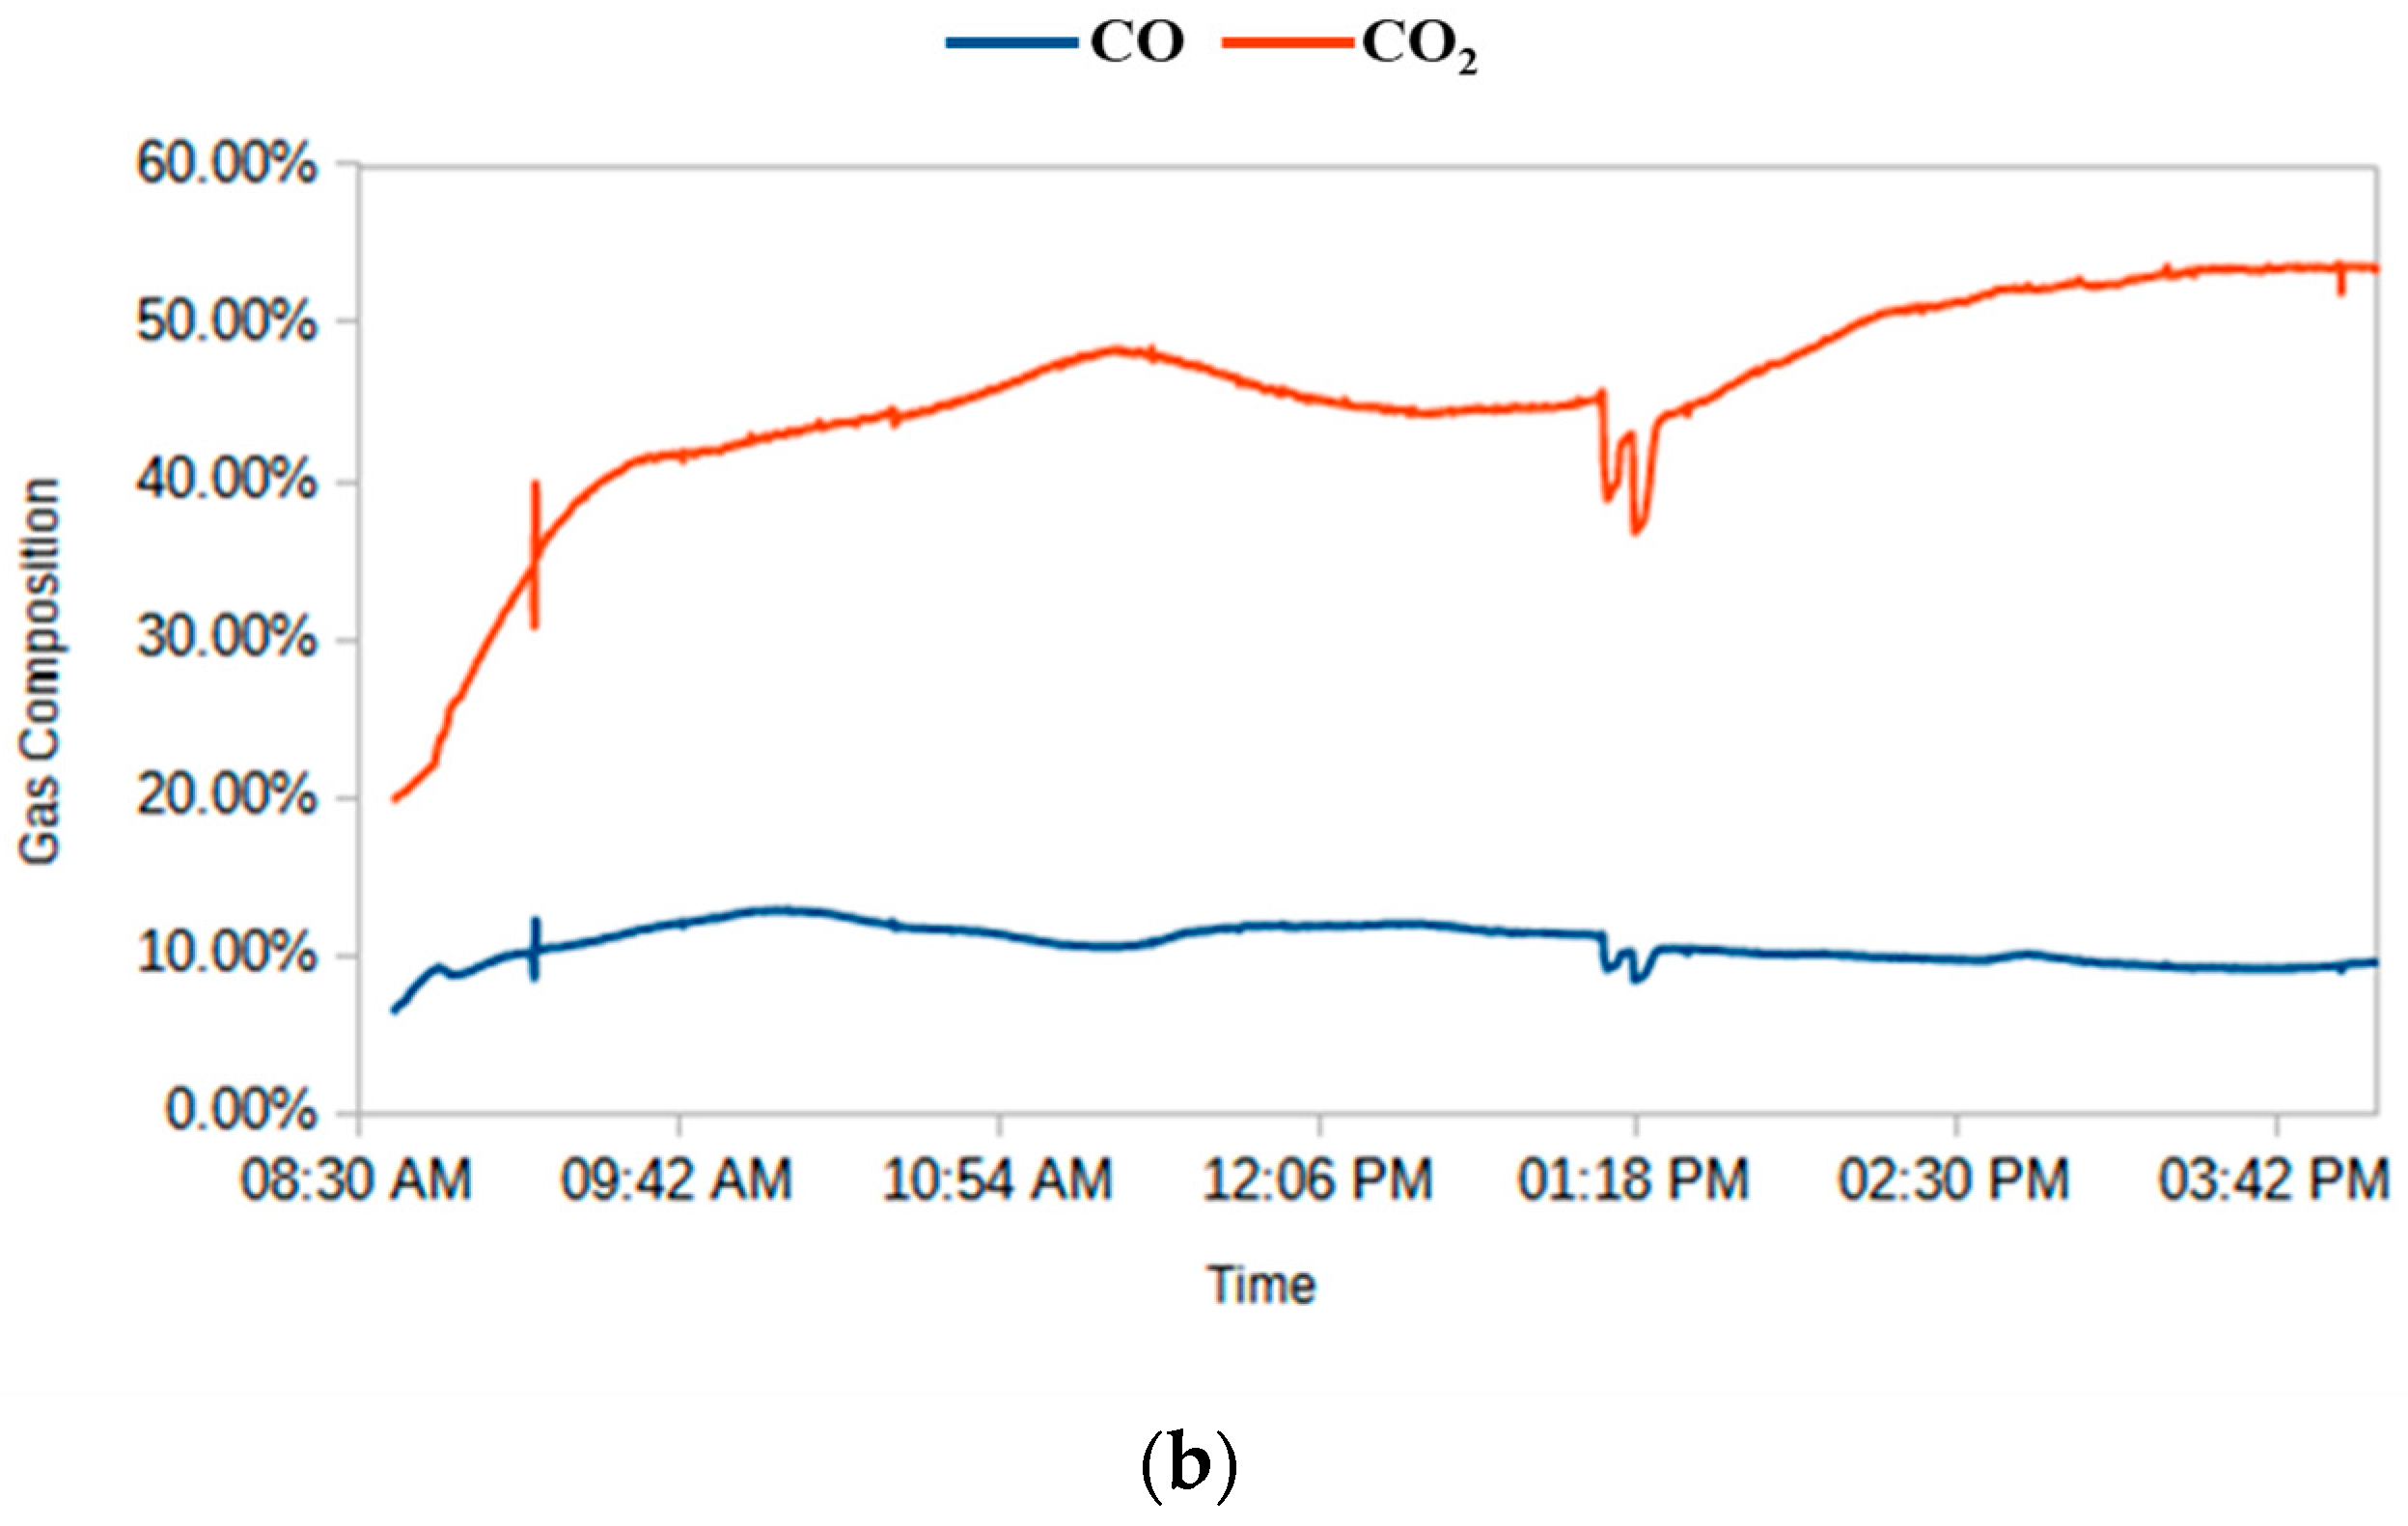
2.2. Installation and Operation of the Field-Scale Unit at the Test Site
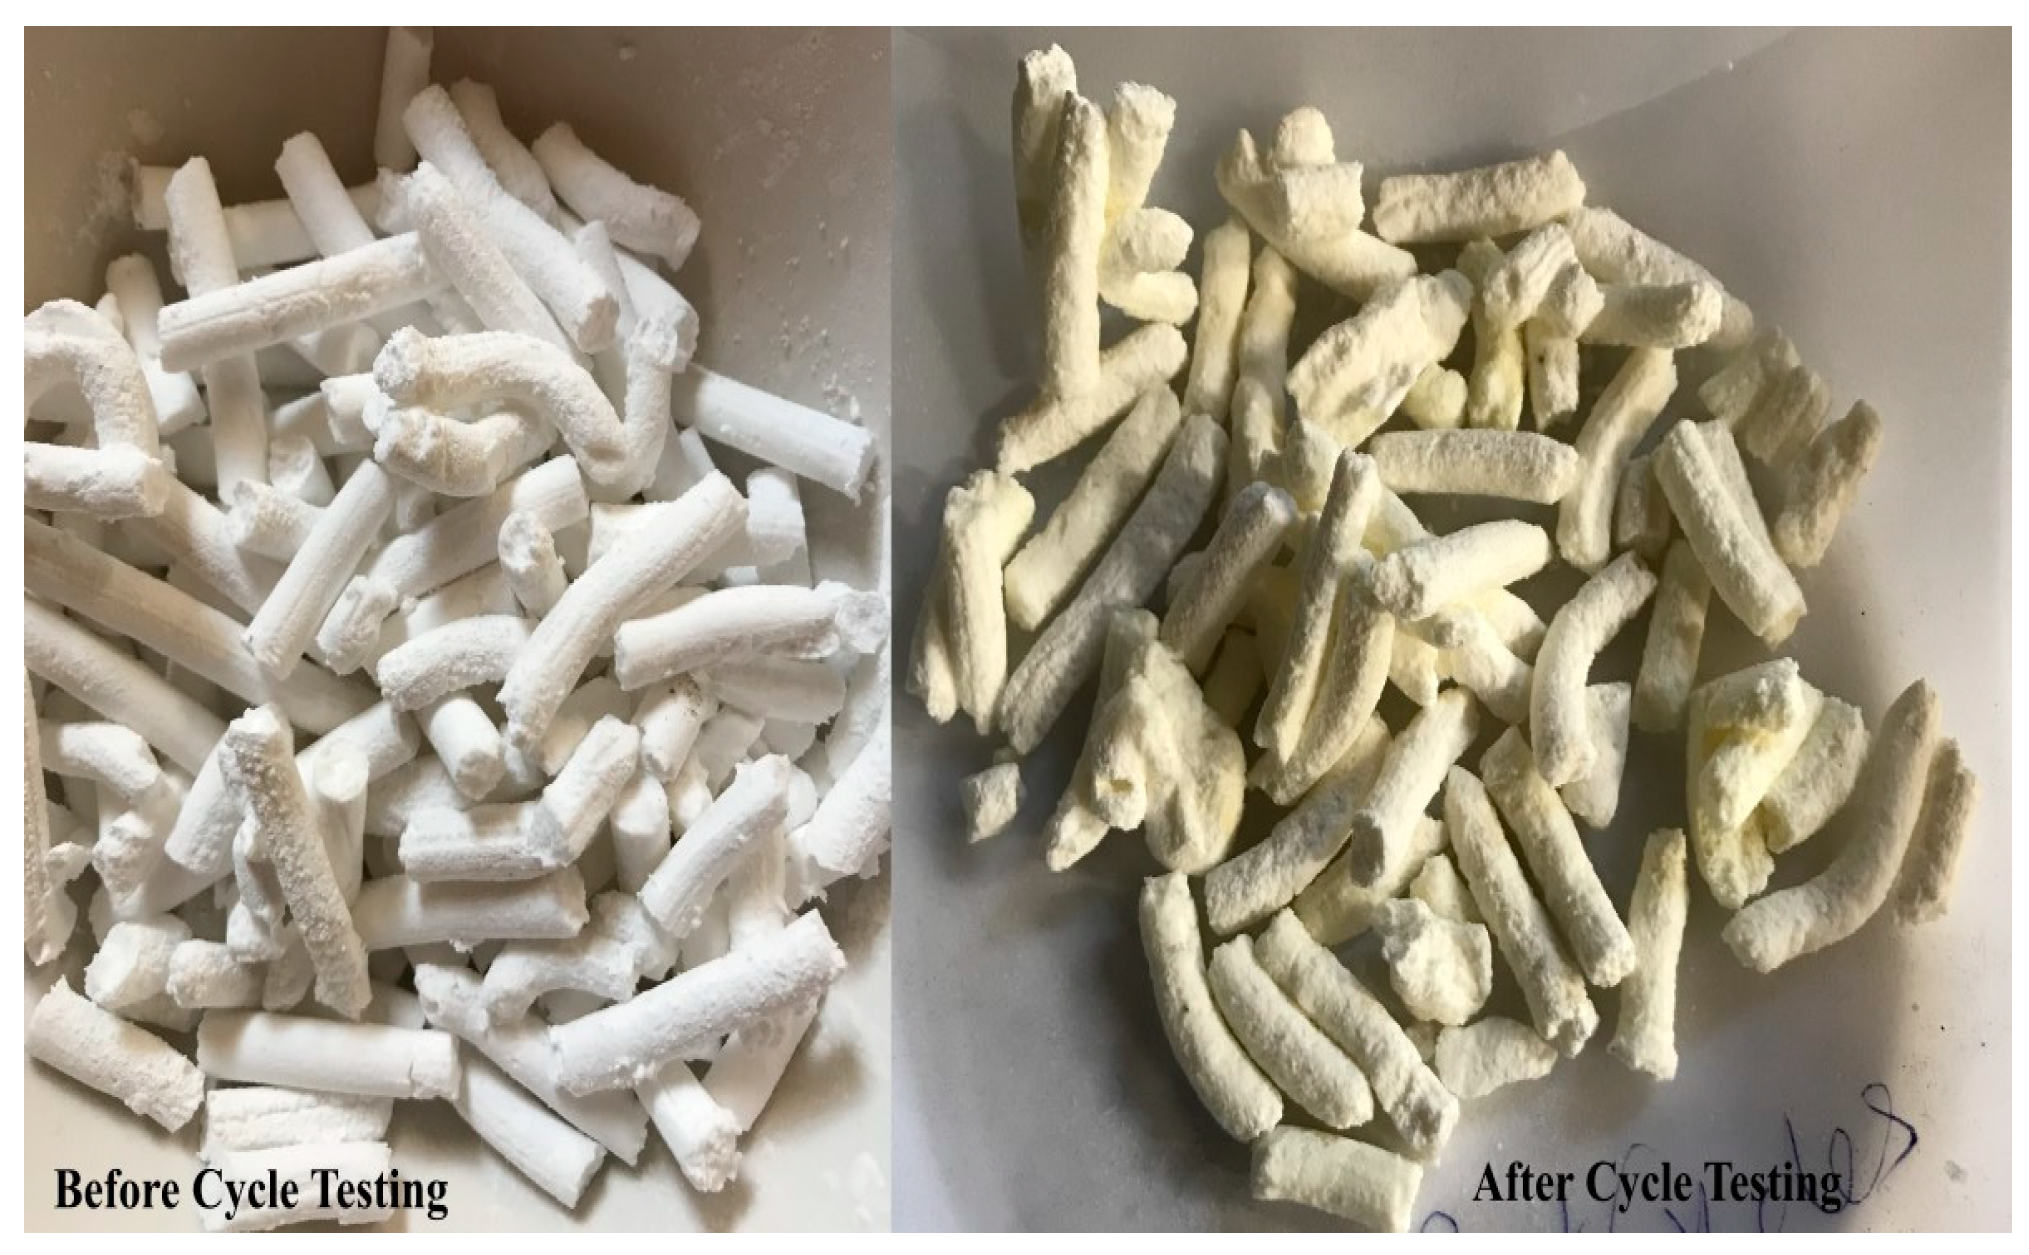
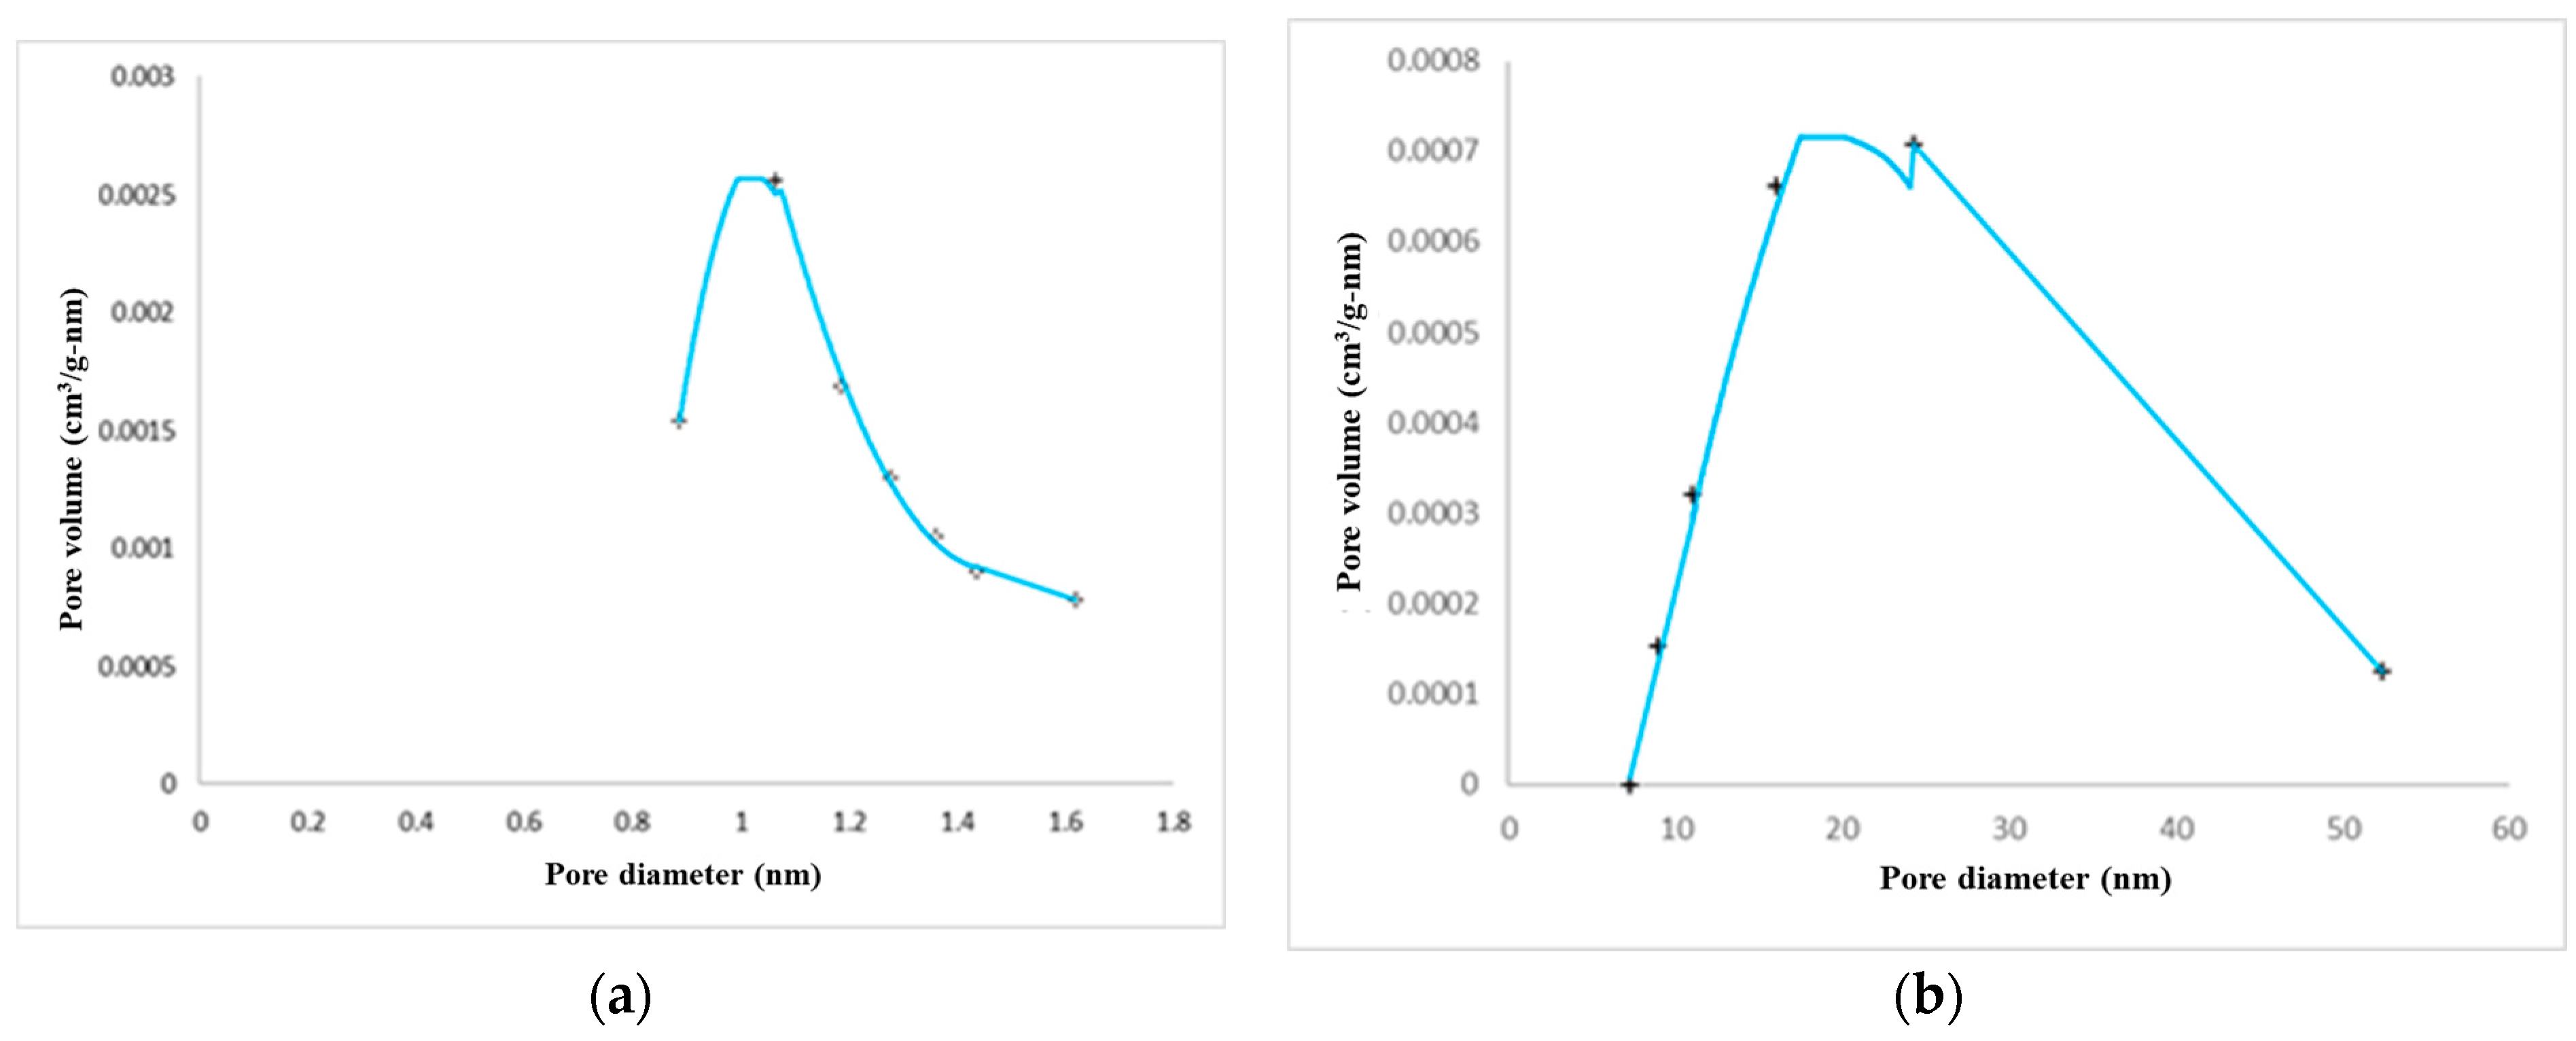
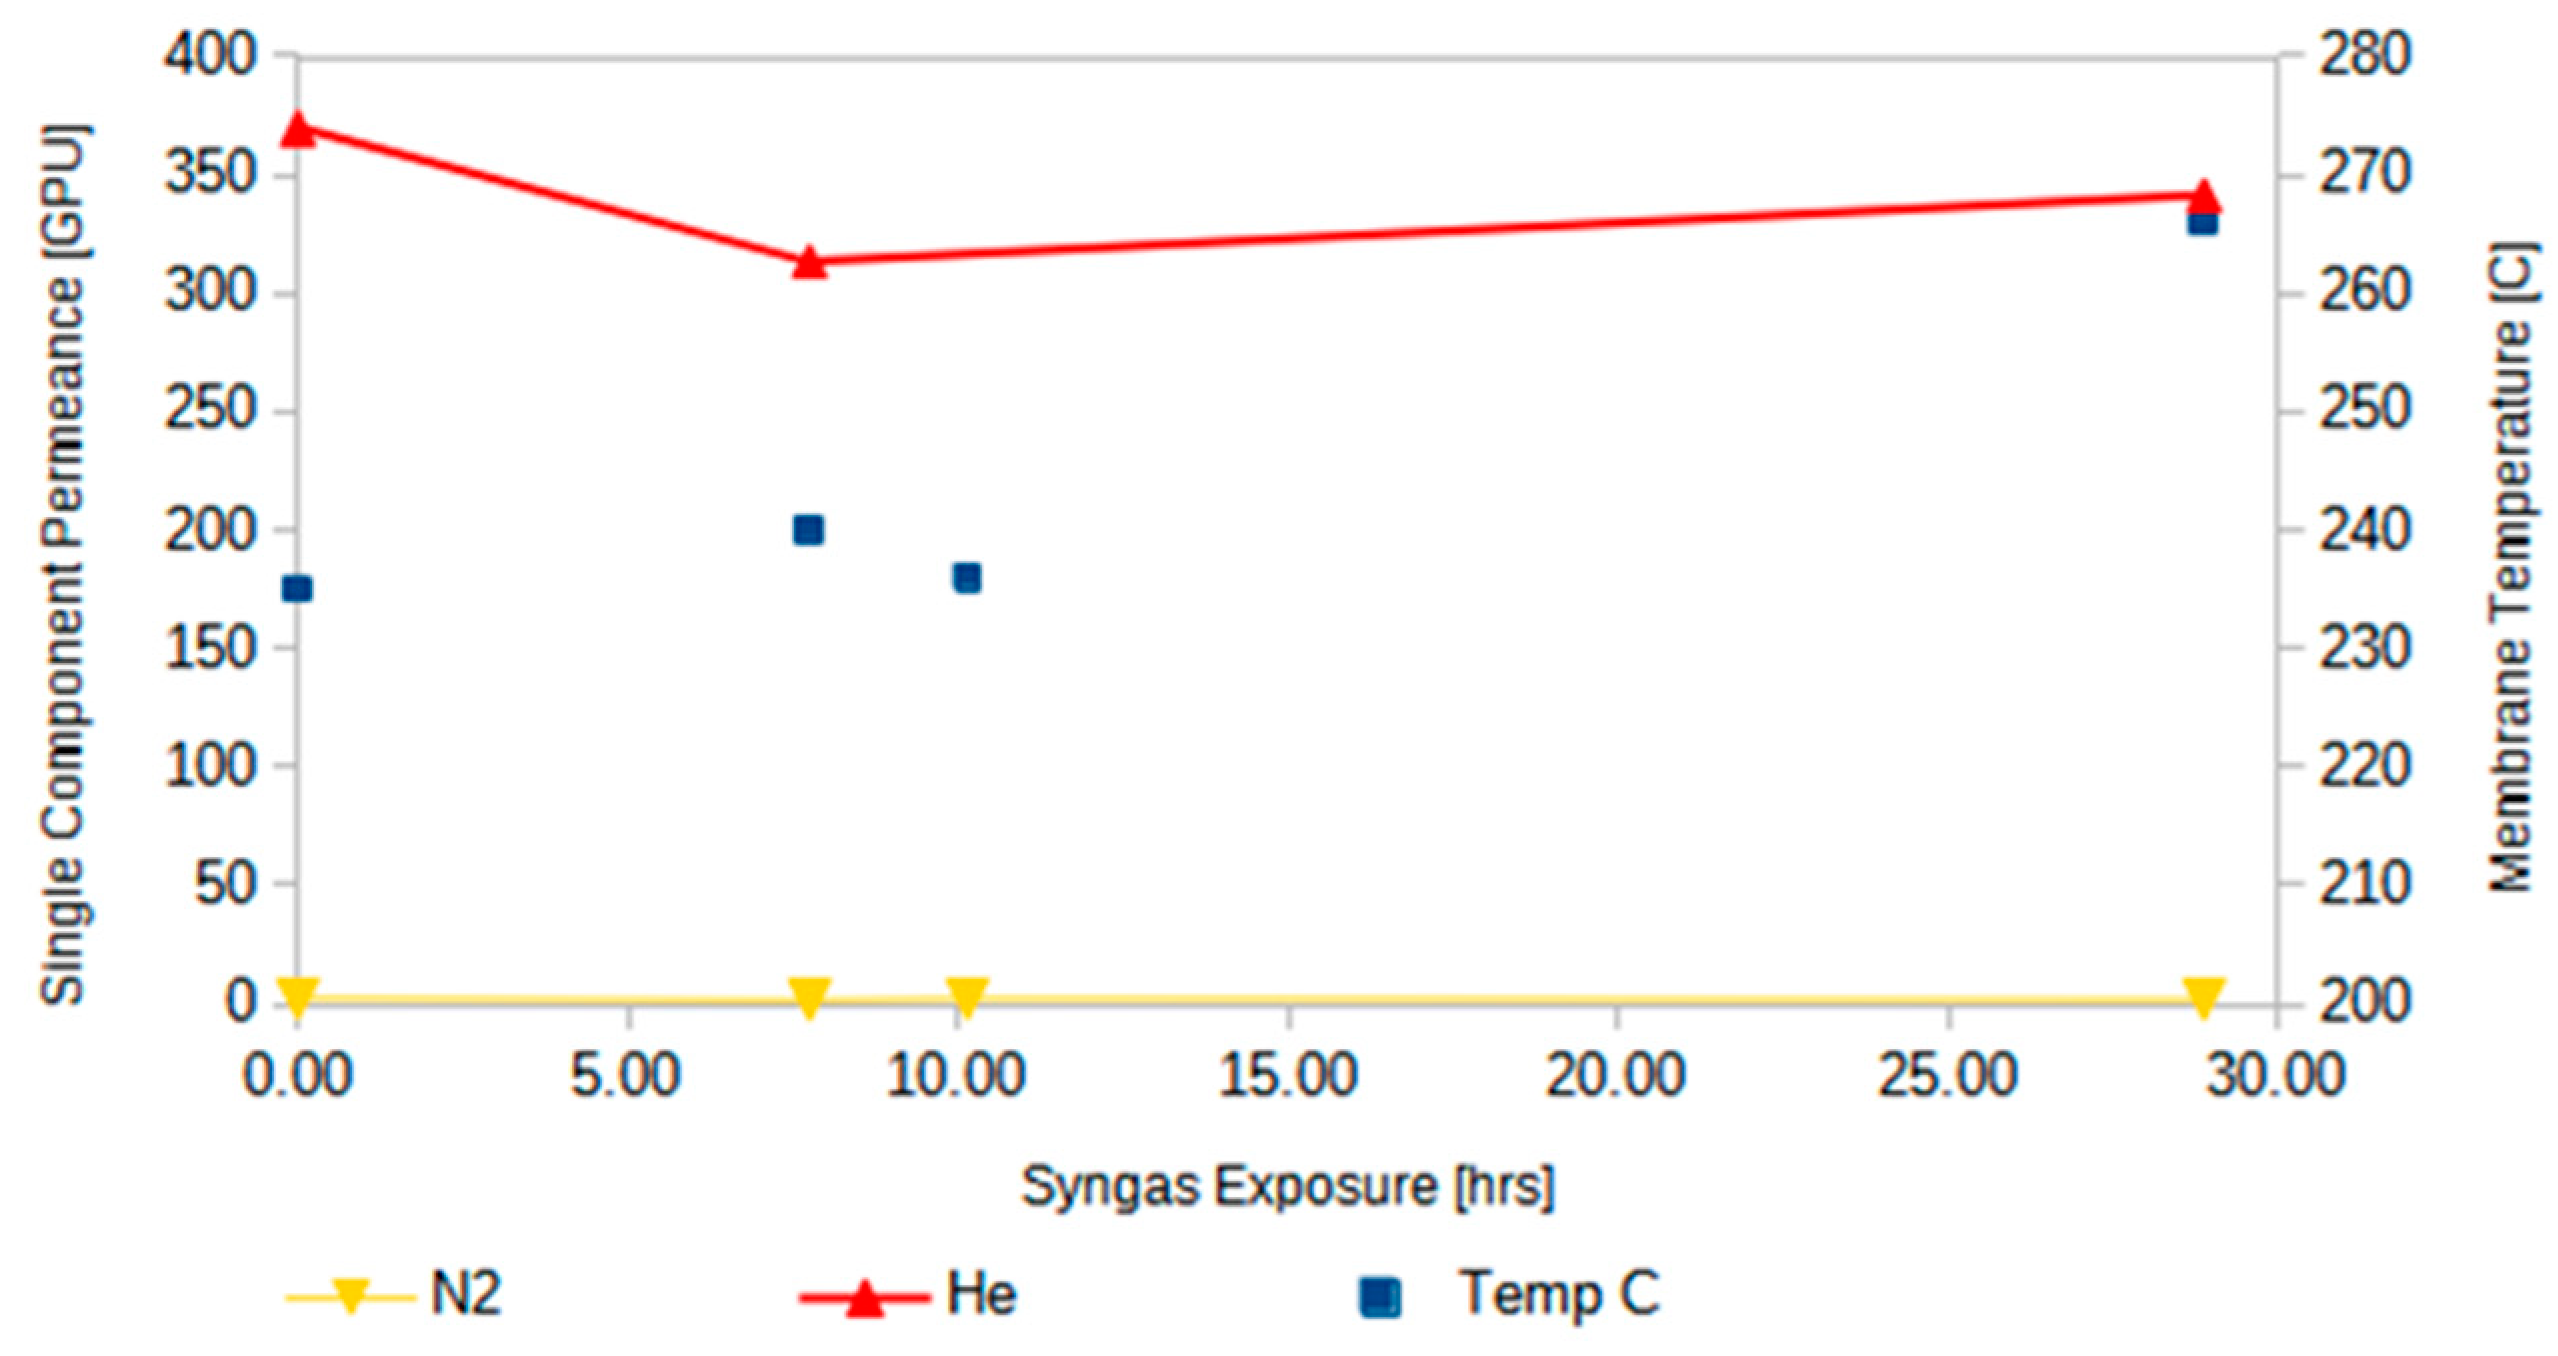
2.3. Post-Mortem Materials Characterization
2.4. Detailed TEA Study
- MRs and ARs replace the WGS reactors in the syngas clean-up (reaction) section of the plant. The MRs feature simultaneous H2 and CO2 generation and H2 removal, while the ARs feature simultaneous H2 and CO2 generation and CO2 removal.
- H2 and CO2 removal is facilitated by multidirectional steam flows during MR operation and AR regeneration, respectively.
- A single-stage Selexol unit is employed in the MR-AR IGCC plant for H2S removal only, as opposed to a dual-stage Selexol unit employed in the baseline case for both CO2 and H2S removal.
- Several of the MR-AR IGCC case studies presented feature elevated syngas humidification, which leads to the generation of humidified H2, whose combustion in the combustion turbine (CT) occurs at reduced temperatures and to the production of saleable N2 that is generated in the Air Separation Unit (ASU).
- A case study also involves ASU modification for the production and sale of both N2 and Ar.
- A capacity factor (CF) of 80% was used for the MR-AR IGCC plant.
- The combustion turbine (CT) operating philosophy is 2 × 232 MWe for a gross output of 464 MWe.
- Air pollution controls meet the applicable New Source Performance Standard (NSPS) targets for sulfur dioxide (SO2) [0.40 lb/MWh-gross], nitrogen oxides (NOx) [0.70 lb/MWh-gross], and particulate matter (PM) [0.07 lb/MWh-gross]. Mercury (Hg) and HCl removal devices meet the Utility Mercury and Air Toxics Standard (MATS) targets of [3 × 10⁻⁶ lb/MWh-gross] and [0.002 lb/MWh-gross], respectively. To meet these standards, H2S is converted into elemental sulfur in a Claus plant with tail gas recycle to limit SO2 emissions; NOx is minimized with the use of low-NOx burners (LNBs) and N2 dilution, as well as with syngas humidification; PM is controlled via water quench and the use of a syngas scrubber and a cyclone; Hg is controlled via sulfur-impregnated carbon beds; HCl is removed from the syngas scrubber with a brine concentrator and crystallizer.
- CO2 capture is greater than or equal to 90%.
- Steady-state process simulations with material and energy balances were used to size various process equipment for cost estimation.
- Capital and operating cost estimates are reported in 2018 dollars.
- The levelized price of coal (Illinois No. 6, Midwest) is $2.11/GJ on a higher heating value (HHV) basis and CO2 transport and storage (T&S) cost is $10/tonne ($9/ton).
3. Conclusions
Supplementary Materials
Author Contributions
Funding
Institutional Review Board Statement
Data Availability Statement
Acknowledgments
Conflicts of Interest
References
- Descamps, C.; Bouallou, C.; Kanniche, M. Efficiency of an Integrated Gasification Combined Cycle (IGCC) power plant including CO2 removal. Energy 2008, 33, 874–881. [Google Scholar] [CrossRef]
- Gao, W.; Zhou, T.; Gao, Y.; Wang, Q. Enhanced water gas shift processes for carbon dioxide capture and hydrogen production. Appl. Energy 2019, 254, 113700. [Google Scholar] [CrossRef]
- Ku, A.Y.; Kulkarni, P.; Shisler, R.; Wei, W. Membrane performance requirements for carbon dioxide capture using hydrogen-selective membranes in integrated gasification combined cycle (IGCC) power plants. J. Membr. Sci. 2011, 367, 233–239. [Google Scholar] [CrossRef]
- Van Selow, E.R.; Cobden, P.D.; Van den Brink, R.W.; Hufton, J.R.; Wright, A. Performance of sorption-enhanced water-gas shift as a pre-combustion CO2 capture technology. Energy Procedia 2009, 1, 689–696. [Google Scholar] [CrossRef]
- Van Selow, E.R.; Cobden, P.D.; Verbraeken, P.A.; Hufton, J.R.; Van den Brink, R.W. Carbon capture by sorption-enhanced water-gas shift reaction process using hydrotalcite-based material. Ind. Eng. Chem. Res. 2009, 48, 4184–4193. [Google Scholar] [CrossRef]
- Van Dijk HA, J.; Damen, K.; Makkee, M.; Trapp, C. Water-gas shift (WGS) operation of pre-combustion CO2 capture pilot plant at the Buggenum IGCC. Energy Procedia 2014, 63, 2008–2015. [Google Scholar] [CrossRef]
- Pichardo, P.A.; Karagöz, S.; Manousiouthakis, V.I.; Tsotsis, T.; Ciora, R. Techno-economic analysis of an intensified integrated gasification combined cycle (IGCC) power plant featuring a combined membrane reactor-adsorptive reactor (MR-AR) system. Ind. Eng. Chem. Res. 2019, 59, 2430–2440. [Google Scholar] [CrossRef]
- Garshasbi, A.; Chen, H.; Cao, M.; Karagöz, S.; Ciora, R.J., Jr.; Liu PK Manousiouthakis, V.I.; Tsotsis, T.T. Membrane-based reactive separations for process intensification during power generation. Catal. Today 2019, 331, 18–29. [Google Scholar] [CrossRef]
- Cao, M.; Zhao, L.; Xu, D.; Ciora, R.; Liu, P.K.; Manousiouthakis, V.I.; Tsotsis, T.T. A carbon molecular sieve membrane-based reactive separation process for pre-combustion CO2 capture. J. Membr. Sci. 2020, 605, 118028. [Google Scholar] [CrossRef]
- Abdollahi, M.; Yu, J.; Liu, P.K.; Ciora, R.; Sahimi, M.; Tsotsis, T.T. Hydrogen production from coal-derived syngas using a catalytic membrane reactor based process. J. Membr. Sci. 2010, 363, 160–169. [Google Scholar] [CrossRef]
- Yu, J.; Tan, M.; Liu, P.K.; Sahimi, M.; Tsotsis, T.T. Hydrogen production from biomass-derived syngas using a membrane reactor based process. Ind. Eng. Chem. Res. 2014, 53, 819–827. [Google Scholar] [CrossRef]
- Zhang, Y.; Ahn, H. The implications of choice between sour and sweet shift on process design and operation of an IGCC power plant integrated with a dual-stage selexol unit. Energy 2019, 173, 1273–1284. [Google Scholar] [CrossRef]
- Karagöz, S.; Tsotsis, T.T.; Manousiouthakis, V.I. Multi-scale modeling and simulation of a novel membrane reactor (MR)/adsorptive reactor (AR) process. Chem. Eng. Process.-Process Intensif. 2019, 137, 148–158. [Google Scholar] [CrossRef]
- Alamoodi, N.; Daoutidis, P. Nonlinear control of coal-fired steam power plants. Control Eng. Pract. 2017, 60, 63–75. [Google Scholar] [CrossRef]
- Harrison, D.P. Sorption-enhanced hydrogen production: A review. Ind. Eng. Chem. Res. 2008, 47, 6486–6501. [Google Scholar] [CrossRef]
- Harale, A.; Hwang, H.T.; Liu, P.K.; Sahimi, M.; Tsotsis, T.T. Design aspects of the cyclic hybrid adsorbent-membrane reactor (HAMR) system for hydrogen production. Chem. Eng. Sci. 2010, 65, 427–435. [Google Scholar] [CrossRef]
- Wu, Y.J.; Li, P.; Yu, J.G.; Cunha, A.F.; Rodrigues, A.E. Sorption-enhanced steam reforming of ethanol on NiMgAl multifunctional materials: Experimental and numerical investigation. Chem. Eng. J. 2013, 231, 36–48. [Google Scholar] [CrossRef]
- Wu, Y.J.; Li, P.; Yu, J.G.; Cunha, A.F.; Rodrigues, A.E. Sorption-enhanced steam reforming of ethanol for continuous high-purity hydrogen production: 2D adsorptive reactor dynamics and process design. Chem. Eng. Sci. 2014, 118, 83–93. [Google Scholar] [CrossRef]
- Liu, P.K.; Sahimi, M.; Tsotsis, T.T. Process intensification in hydrogen production from coal and biomass via the use of membrane-based reactive separations. Curr. Opin. Chem. Eng. 2012, 1, 342–351. [Google Scholar] [CrossRef]
- García-García, F.R.; León, M.; Ordóñez, S.; Li, K. Studies on water–gas-shift enhanced by adsorption and membrane permeation. Catal. Today 2014, 236, 57–63. [Google Scholar] [CrossRef]
- Gallucci, F.; Fernandez, E.; Corengia, P.; van Sint Annaland, M. Recent advances on membranes and membrane reactors for hydrogen production. Chem. Eng. Sci. 2013, 92, 40–66. [Google Scholar] [CrossRef]
- Ghasemzadeh, K.; Liguori, S.; Morrone, P.; Iulianelli, A.; Piemonte, V.; Babaluo, A.A.; Basile, A. H2 production by low pressure methanol steam reforming in a dense Pd–Ag membrane reactor in co-current flow configuration: Experimental and modeling analysis. Int. J. Hydrogen Energy 2013, 38, 16685–16697. [Google Scholar] [CrossRef]
- Ghasemzadeh, K.; Zeynali, R.; Basile, A.; Iulianelli, A. CFD analysis of a hybrid sorption-enhanced membrane reactor for hydrogen production during WGS reaction. Int. J. Hydrogen Energy 2017, 42, 26914–26923. [Google Scholar] [CrossRef]
- Mendes, D.; Mendes, A.; Madeira, L.M.; Iulianelli, A.; Sousa, J.M.; Basile, A. The water-gas shift reaction: From conventional catalytic systems to Pd-based membrane reactors—A review. Asia-Pac. J. Chem. Eng. 2010, 5, 111–137. [Google Scholar] [CrossRef]
- Ali, Z.; Pacheco, F.; Litwiller, E.; Wang, Y.; Han, Y.; Pinnau, I. Ultra-selective defect-free interfacially polymerized molecular sieve thin-film composite membranes for H2 purification. J. Mater. Chem. A 2018, 6, 30–35. [Google Scholar] [CrossRef]
- Sánchez-Laínez, J.; Zornoza, B.; Téllez, C.; Coronas, J. Asymmetric polybenzimidazole membranes with thin selective skin layer containing ZIF-8 for H2/CO2 separation at pre-combustion capture conditions. J. Membr. Sci. 2018, 563, 427–434. [Google Scholar] [CrossRef]
- De la Osa, A.R.; De Lucas, A.; Romero, A.; Casero, P.; Valverde, J.L.; Sánchez, P. High pressure Water Gas Shift performance over a commercial non-sulfide CoMo catalyst using industrial coal-derived syngas. Fuel 2012, 97, 428–434. [Google Scholar] [CrossRef]
- De la Osa, A.R.; De Lucas, A.; Valverde, J.L.; Romero, A.; Monteagudo, I.; Sánchez, P. Performance of a sulfur-resistant commercial WGS catalyst employing industrial coal-derived syngas feed. Int. J. Hydrogen Energy 2011, 36, 44–51. [Google Scholar] [CrossRef]
- Newsome, D.S. The water-gas shift reaction. Catal. Rev. Sci. Eng. 1980, 21, 275–318. [Google Scholar] [CrossRef]
- Parsley, D.; Ciora, R.J., Jr.; Flowers, D.L.; Laukaitaus, J.; Chen, A.; Liu, P.K.; Yu, J.; Sahimi, M.; Bonsu, A.; Tsotsis, T.T. Field evaluation of carbon molecular sieve membranes for the separation and purification of hydrogen from coal-and biomass-derived syngas. J. Membr. Sci. 2014, 450, 81–92. [Google Scholar] [CrossRef]
- Boon, J.; Coenen, K.; van Dijk, E.; Cobden, P.; Gallucci, F.; van Sint Annaland, M. Sorption-enhanced water–gas shift. In Advances in Chemical Engineering; Academic Press: Cambridge, MA, USA, 2017; Volume 51, pp. 1–96. [Google Scholar]
- Wang, Q.; Luo, J.; Zhong, Z.; Borgna, A. CO2 capture by solid adsorbents and their applications: Current status and new trends. Energy Environ. Sci. 2011, 4, 42–55. [Google Scholar] [CrossRef]
- Boon, J.; Cobden, P.D.; Van Dijk HA, J.; van Sint Annaland, M. High-temperature pressure swing adsorption cycle design for sorption-enhanced water–gas shift. Chem. Eng. Sci. 2015, 122, 219–231. [Google Scholar] [CrossRef]
- Cobden, P.D.; Van Beurden, P.; Reijers HT, J.; Elzinga, G.D.; Kluiters SC, A.; Dijkstra, J.W.; Jansen, D.; Van Den Brink, R.W. Sorption-enhanced hydrogen production for pre-combustion CO2 capture: Thermodynamic analysis and experimental results. Int. J. Greenh. Gas Control 2007, 1, 170–179. [Google Scholar] [CrossRef]
- Van Dijk HA, J.; Walspurger, S.; Cobden, P.D.; Van den Brink, R.W.; De Vos, F.G. Testing of hydrotalcite-based sorbents for CO2 and H2S capture for use in sorption enhanced water gas shift. Int. J. Greenh. Gas Control 2011, 5, 505–511. [Google Scholar] [CrossRef]
- Yu, C.H.; Huang, C.H.; Tan, C.S. A review of CO2 capture by absorption and adsorption. Aerosol Air Qual. Res. 2012, 12, 745–769. [Google Scholar] [CrossRef]
- Soria, M.A.; Tosti, S.; Mendes, A.; Madeira, L.M. Enhancing the low temperature water–gas shift reaction through a hybrid sorption-enhanced membrane reactor for high-purity hydrogen production. Fuel 2015, 159, 854–863. [Google Scholar] [CrossRef]
- Katiyar, N.; Kumar, S.; Kumar, S. Comparative thermodynamic analysis of adsorption, membrane and adsorption-membrane hybrid reactor systems for methanol steam reforming. Int. J. Hydrogen Energy 2013, 38, 1363–1375. [Google Scholar] [CrossRef]
- Maroño, M.; Barreiro, M.M.; Torreiro, Y.; Sánchez, J.M. Performance of a hybrid system sorbent–catalyst–membrane for CO2 capture and H2 production under pre-combustion operating conditions. Catal. Today 2014, 236, 77–85. [Google Scholar] [CrossRef]
- Maroño, M.; Torreiro, Y.; Cillero, D.; Sánchez, J.M. Experimental studies of CO2 capture by a hybrid catalyst/adsorbent system applicable to IGCC processes. Appl. Therm. Eng. 2015, 74, 28–35. [Google Scholar] [CrossRef]
- Tsotsis, T.T.; Manousiouthakis, V.I.; Parsley, D. Final Report, Bench-Scale Testing of a High Efficiency, Ultra-Compact Process for Pre-Combustion CO2 Capture; DOE Award Number DE-FE0031737; University of Southern California (USC): Los Angeles, CA, USA, 2023. [Google Scholar]
- Margull, N.; Tsotsis, T.T.; Manousiouthakis, V.I. On multidomain multiscale modeling and simulation of a novel partial pressure and temperature swing adsorptive reactor (PPTSAR) with application to the water gas shift reaction. Chem. Eng. J. 2022, 442, 136161. [Google Scholar] [CrossRef]
- Yang, W.; Kim, Y.; Liu, P.K.; Sahimi, M.; Tsotsis, T.T. A study by in situ techniques of the thermal evolution of the structure of a Mg–Al–CO3 layered double hydroxide. Chem. Eng. Sci. 2002, 57, 2945–2953. [Google Scholar] [CrossRef]


| Dataset | Average Feed Composition [CO/CO2/H2/H2O/N2] | Feed Pressure [psig] | Temp. [°C] | Flow Rate [scfm] | Measured MR CO Conv. [%] | Simulated MR CO Conv. |
|---|---|---|---|---|---|---|
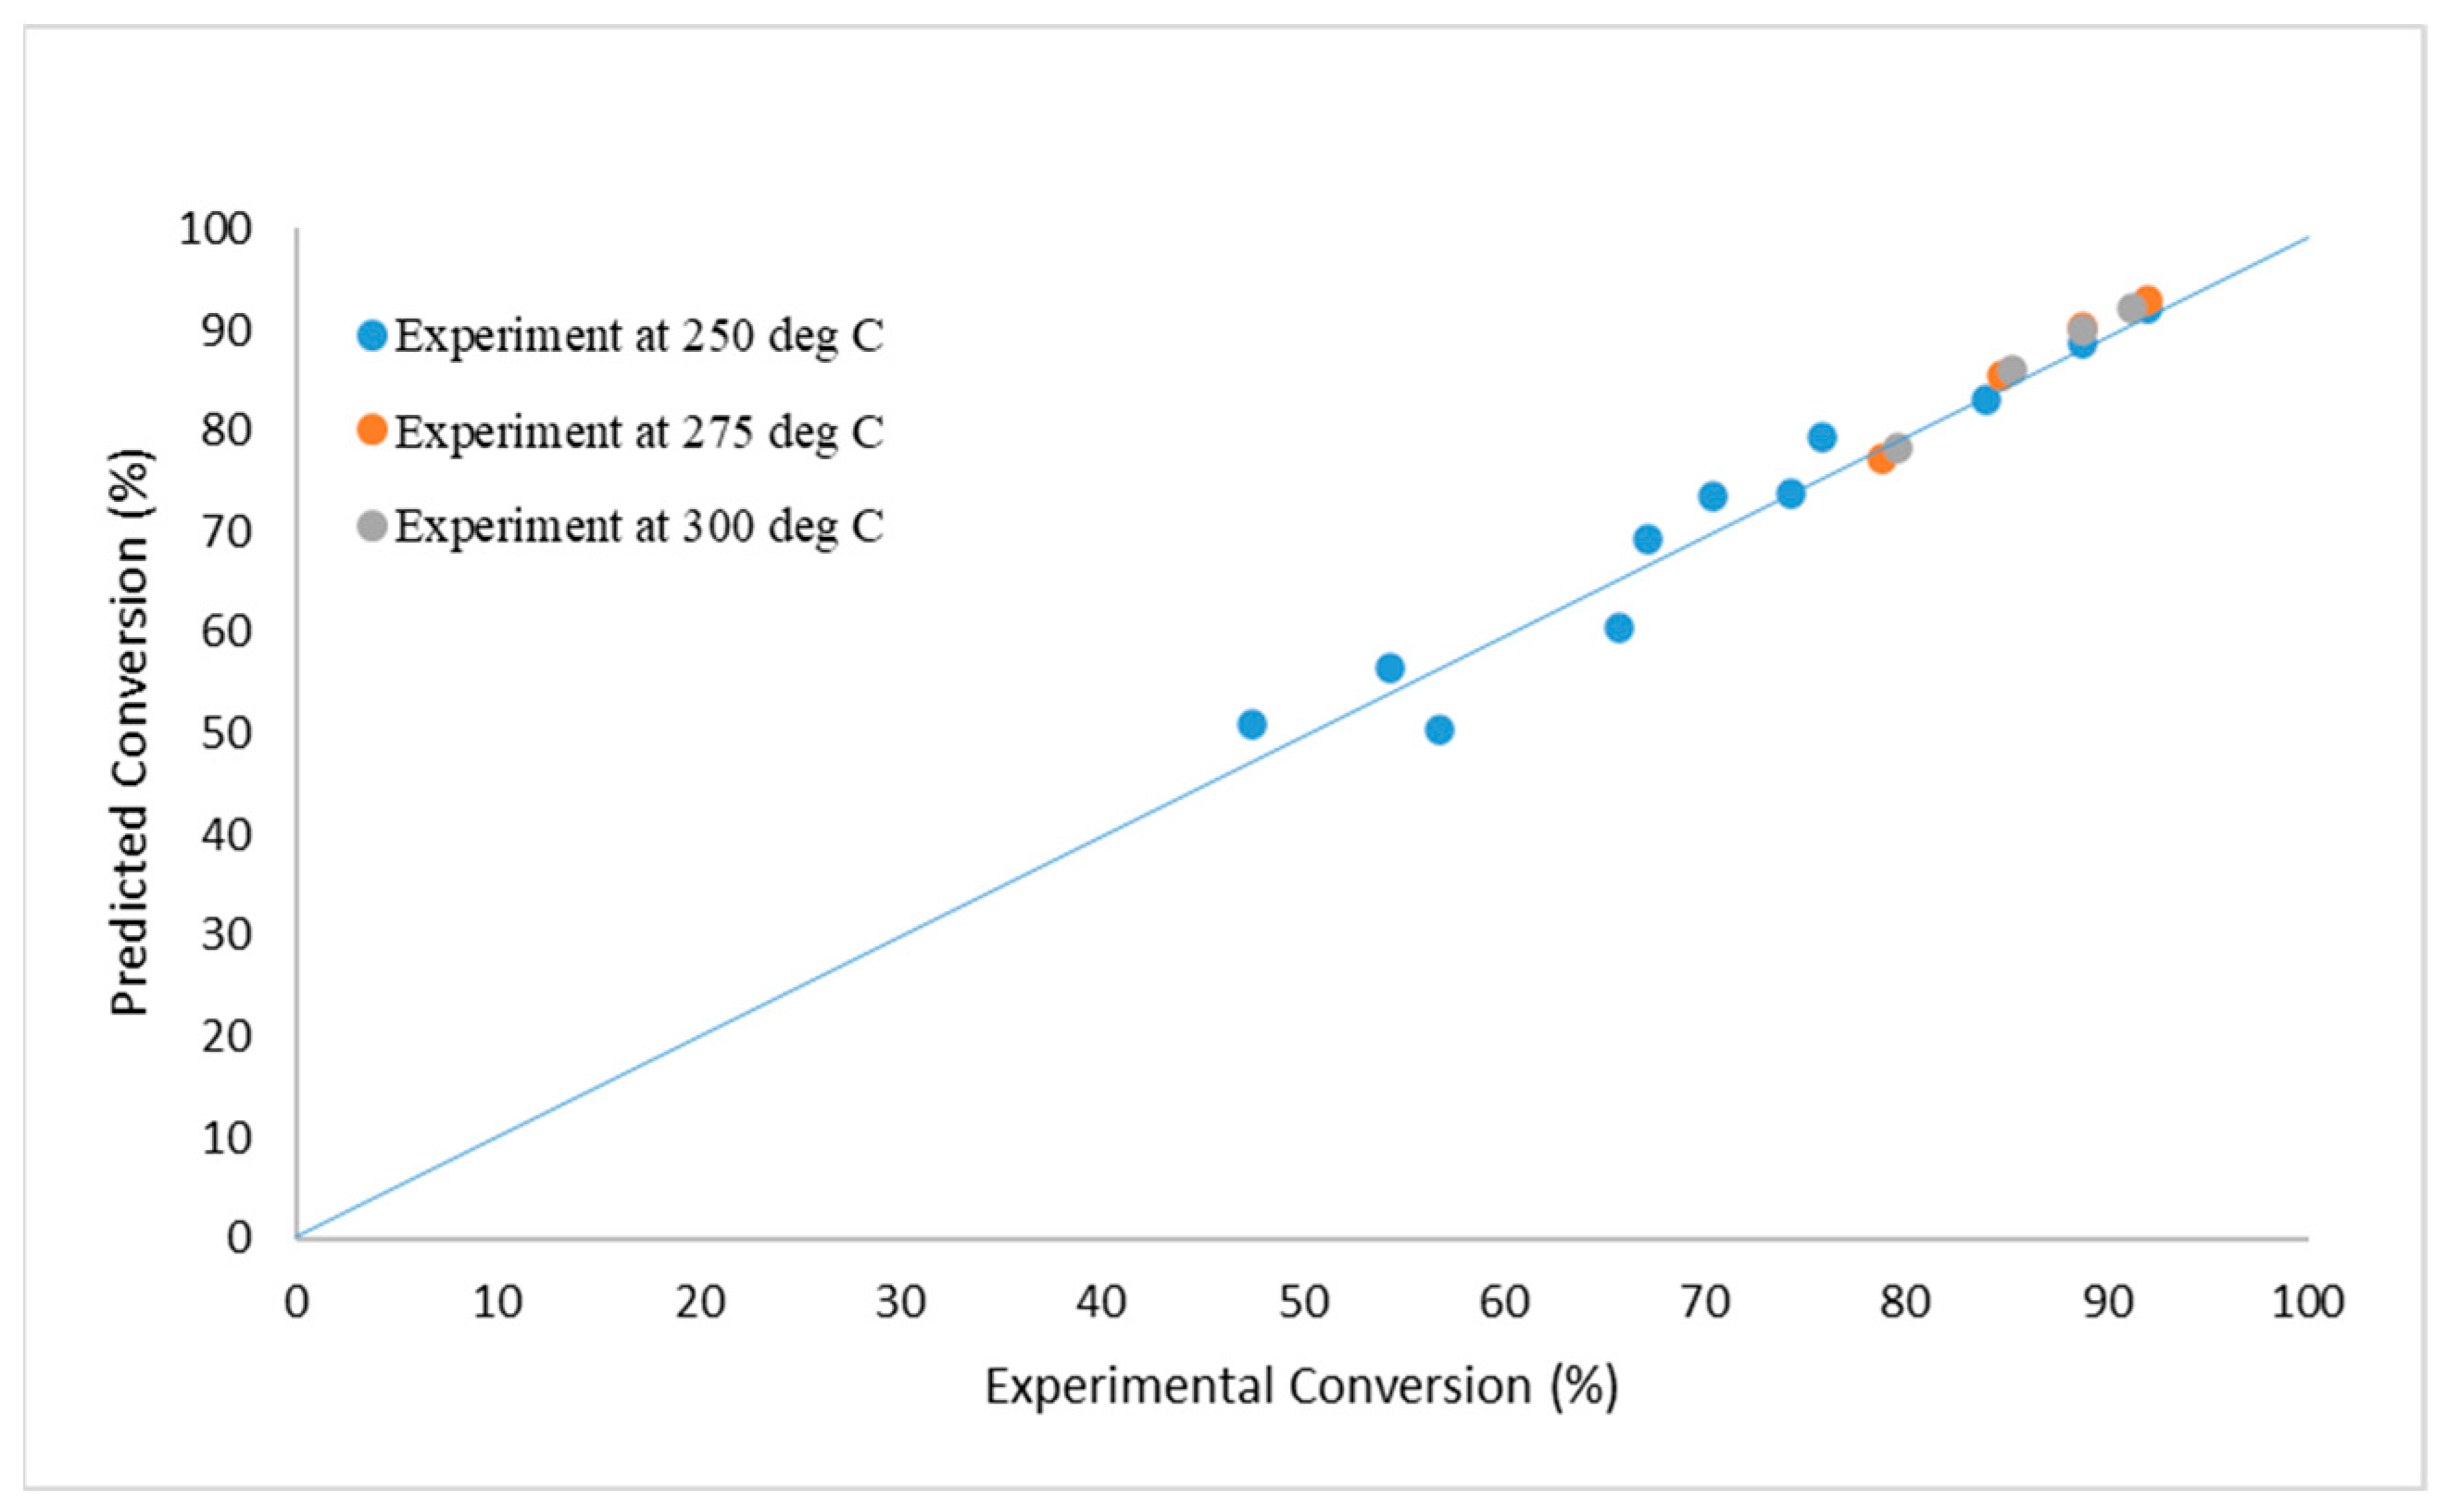
| 12-9 | 23.99/36.25/21.13/7.57/11.06 | 285 | 250 | 0.482 | 53 | 46 |
| 12-13 | 16.35/38.75/16.57/25.84/2.49 | 249 | 240 | 0.585 | 39 | 41 |
| 12-14 | 12.75/32.76/13.90/30.10/10.49 | 255 | 249 | 0.614 | 51 | 52 |
| 12-15 | 14.58/29.90/14.37/29.87/11.28 | 245 | 263 | 0.626 | 52 | 46 |
| Dataset | Average Feed Composition [CO/CO2/H2/H2O/N2] | Feed Pressure [psig] | Temp. [°C] | Flow Rate [scfm] | Measured MR CO Conv. [%] | Simulated MR CO Conv. |
|---|---|---|---|---|---|---|
| 1st MR Test | 15.29/37.09/15.19/22.94/9.49 | 258 | 265 | 0.328 | 35 | 34 |
| 2nd MR Test | 15.73/30.80/16.19/23.60/13.68 | 255 | 265 | 0.284 | 32 | 30 |
| 9.34/24.12/9.05/37.37/20.12 | 220 | 265 | 0.284 | 75 | 74 |
| Net Power | LCOE (Excluding T&S) | CO2 Captured | Cost of CO2 Captured | |
|---|---|---|---|---|
| Plant | MW | $/MWh | tonne/MWh | $/tonne |
| Reference Non-capture Plant COE * | 650 | 64.4 | - | - |
| Baseline IGCC Plant COE (Case B5B) | 556 | 144.2 | 0.814 | 98.06 |
| MR-AR IGCC Plant (with N2 Compression) | 585 | 130.7 | 0.823 | 80.60 |
| MR-AR IGCC Plant with N2 Sales @ $30/ton (with N2 Compression) | 586 | 101.2 | 0.823 | 44.76 |
| MR-AR IGCC Plant with N2 Sales @ $30/ton (with no N2 Compression) | 623 | 95.3 | 0.774 | 39.87 |
| MR-AR IGCC Plant with Ar Sales @ $4.0/kg (with N2 Compression) | 586 | 64.6 | 0.823 | 0.27 |
| MR-AR IGCC Plant with Ar Sales @ $4.0/kg (with no N2 Compression) | 623 | 60.8 | 0.774 | −4.62 |
| Case B5B (Baseline) | MR-AR with N2 Compression | MR-AR (N2 Sale @ $30/ton, No N2 Compression) | MR-AR (N2 Sale @ $30/ton, N2 Compression) | MR-AR (Ar Sale @ $4.0/kg, No N2 Compression) | MR-AR (Ar Sale @ $4.0/kg, N2 Compression) | Target | |
|---|---|---|---|---|---|---|---|
| Carbon Capture | 90% | 96% | 96% | 96% | 96% | 96% | N/A |
| CO2 Purity | 99.5% | 99.9% | 99.9% | 99.9% | 99.9% | 99.9% | 95.0% |
| Net power Production (MWe) | 556 | 586 | 623 | 586 | 623 | 586 | N/A |
| LCOE (Excluding T&S), $/MWh | 144.2 | 130.7 | 95.3 | 101.2 | 60.8 | 64.6 | 100.9 |
| CO2 Captured Cost, $/tonne | 98.1 | 84.7 | 41.3 | 46.5 | −4.6 | 0.3 | N/A |
Disclaimer/Publisher’s Note: The statements, opinions and data contained in all publications are solely those of the individual author(s) and contributor(s) and not of MDPI and/or the editor(s). MDPI and/or the editor(s) disclaim responsibility for any injury to people or property resulting from any ideas, methods, instructions or products referred to in the content. |
© 2024 by the authors. Licensee MDPI, Basel, Switzerland. This article is an open access article distributed under the terms and conditions of the Creative Commons Attribution (CC BY) license (https://creativecommons.org/licenses/by/4.0/).
Share and Cite
Margull, N.; Parsley, D.; Somiari, I.; Zhao, L.; Cao, M.; Koumoulis, D.; Liu, P.K.T.; Manousiouthakis, V.I.; Tsotsis, T.T. Field-Scale Testing of a High-Efficiency Membrane Reactor (MR)—Adsorptive Reactor (AR) Process for H2 Generation and Pre-Combustion CO2 Capture. Membranes 2024, 14, 51. https://doi.org/10.3390/membranes14020051
Margull N, Parsley D, Somiari I, Zhao L, Cao M, Koumoulis D, Liu PKT, Manousiouthakis VI, Tsotsis TT. Field-Scale Testing of a High-Efficiency Membrane Reactor (MR)—Adsorptive Reactor (AR) Process for H2 Generation and Pre-Combustion CO2 Capture. Membranes. 2024; 14(2):51. https://doi.org/10.3390/membranes14020051
Chicago/Turabian StyleMargull, Nicholas, Doug Parsley, Ibubeleye Somiari, Linghao Zhao, Mingyuan Cao, Dimitrios Koumoulis, Paul K. T. Liu, Vasilios I. Manousiouthakis, and Theodore T. Tsotsis. 2024. "Field-Scale Testing of a High-Efficiency Membrane Reactor (MR)—Adsorptive Reactor (AR) Process for H2 Generation and Pre-Combustion CO2 Capture" Membranes 14, no. 2: 51. https://doi.org/10.3390/membranes14020051