
Hydrogen Flux Inhibition of Pd-Ru Membranes under Exposure to NH3
by
Lingsu Chen
1,2,3,
Shuai Li
1,2,*,
Zhaohui Yin
1,2,*,
Zhanbing Yang
4,
Zihui Chen
1,2,4,
Li Han
1,2,4,
Qinghe Yu
1,2 and
Miao Du
1,2 1
China GRINM Group Co., Ltd., National Engineering Research Center of Nonferrous Metals Materials and Products for New Energy, Beijing 100088, China
2
GRIMAT Engineering Institute Co., Ltd., Beijing 101407, China
3
General Research Institute for Nonferrous Metals, Beijing 100088, China
4
School of Metallurgical and Ecological Engineering, University of Science and Technology Beijing, Beijing 100083, China
*
Authors to whom correspondence should be addressed.
Membranes 2024, 14(3), 59; https://doi.org/10.3390/membranes14030059
Submission received: 19 January 2024
/
Revised: 9 February 2024
/
Accepted: 23 February 2024
/
Published: 25 February 2024
Abstract
:The hydrogen flux inhibition of Pd-Ru membranes under exposure to 1–10% NH3 at 673–773 K was investigated. The Pd-Ru membranes were characterized by XRD, SEM, XPS, and hydrogen permeation tests. The results show that when exposed to 1–10% NH3 at 723 K for 6 h, the hydrogen flux of Pd-Ru membranes sharply decreases by 15–33%, and the decline in hydrogen flux becomes more significant with increasing temperatures. After the removal of 1–10% NH3, 100% recovery of hydrogen flux is observed. XPS results show that nitrogenous species appear on the membrane surface after NH3 exposure, and the hydrogen flux inhibition may be related to the competitive adsorption of nitrogenous species. By comparing the hydrogen flux of Pd-Ru membranes exposed to 10% NH3 with 10% N2, it is indicated that the rapid decrease in hydrogen flux is due to the concentration polarization and competitive adsorption of nitrogenous species. The competitive adsorption effect is attenuated, while the concentration polarization effect becomes more pronounced with increasing temperature.
1. Introduction
In recent decades, hydrogen as an ideal energy carrier has received wide attention due to its COX-free nature, environmental friendliness, and high energy density [1]. However, the difficulty in hydrogen storage and transportation and the poor safety hinder the further application of hydrogen. At present, large-scale storage and transportation of hydrogen are mainly achieved with compressed hydrogen [2] and liquid hydrogen [3], but both methods have the limitations of large energy consumption. Alternatively, hydrogen can be stored by chemical storage using hydrogen carriers such as methanol, formic acid, NH3, etc. NH3 is liquid at room temperature and medium pressure (<1 MPa) [4], and it is relatively easy to transport and store. The hydrogen storage density of NH3 (17.8 wt.% [5]) surpasses that of methanol (12.6 wt.% [6]) and formic acid (4.34 wt.% [7]), making it a promising liquid hydrogen carrier. Hydrogen can be produced by the decomposition of NH3, followed by hydrogen separation and purification to meet the requirements of downstream applications. This offers a practical solution for the efficient and secure storage, delivery, and versatile usage of hydrogen.
The gases produced by thermal decomposition of NH3 are hydrogen, nitrogen, and trace ammonia. Hydrogen needs to be further separated and purified from these decomposition gases for downstream applications. Traditional hydrogen purification methods like pressure swing adsorption (PSA) have drawbacks such as high energy consumption, low hydrogen purity, and large foot-print area [8]. Hydrogen purification using Pd membranes shows great potential in small- to medium-scale hydrogen production [9,10]. By integrating the NH3 decomposition process with membrane purification in a single chamber [11,12], the separation and purification of hydrogen are realized while the decomposing reaction is conducted. This facilitates the transition of NH3 decomposition reaction towards the product side, overcoming the thermodynamic constraints of the NH3 decomposition reaction [13], significantly reducing its operating temperature (<773 K) and improving the NH3 conversion efficiency. Cechetto et al. [14] found that the NH3 decomposition membrane reactor achieved 15% higher NH3 conversion than conventional reactors. The hydrogen yield exceeded 86%, and the purity of hydrogen reached 99.998%. This demonstrates the potential of membrane reactors in NH3 decomposition for hydrogen production.
In NH3 decomposition membrane reactors, Pd-based membranes, such as pure Pd [15,16], Pd-Ag [13,17], Pd-Au [18], etc., exhibit outstanding performance in terms of hydrogen separation. However, pure Pd membranes have limitations in terms of working temperature. The pure Pd membranes may cause hydrogen embrittlement at low temperatures (<573 K). Although the above-mentioned Pd-Ag and Pd-Au alloy membranes show property improvements in the aspects of hydrogen embrittlement and hydrogen permeation, defects or pinholes develop with time at high temperatures, and they have poor resistance to impurity poisoning. Pd-Ru membranes were widely used in membrane reactions for their high hydrogen permeability, resistance against impurity, and high thermal stability [19,20,21].
In the process of NH3 decomposition, the presence of N2 and residual NH3 may adversely affect the hydrogen permeation performance of Pd membranes. Sakamoto et al. [22] investigated the effects of N2 and NH3 on the hydrogen permeation performance of Pd membranes. The hydrogen flux of pure Pd membranes was reduced by 13% under exposure to 10% NH3 at 523 K, while it was only reduced by 9% after exposure to 10% N2. They observed the N 1s spectra by XPS on the membrane after NH3 exposure, and the decrease in hydrogen flux was mainly due to the competitive adsorption on the membrane surface occupying the hydrogen dissociation adsorption site. However, the XPS analysis showed that chemical species, such as NH2, NH3, –NO, NO2, etc., could not be identified. Zhang et al. [23] showed a slight decrease (6.3%) in the hydrogen flux of pure Pd membranes with increasing NH3 content in the feed gas from 920 ppm to 63,000 ppm, and no significant hydrogen permeability change was observed over several days. However, owing to the change in hydrogen content at different temperatures, it remains uncertain whether hydrogen partial pressure or NH3 contributes to the decreased hydrogen flux. Similarly, Lundin et al. [24] did not observe any inhibition of hydrogen fluxes by N2 or NH3 at 673 K and 1 MPa. To evaluate the effect of trace NH3, Peters et al. [25] investigated the flux inhibition of Pd77Ag23 membranes exposed to 10–500 ppm NH3. They found no inhibition effect on the hydrogen flux of Pd77Ag23 membranes when exposed to 200 ppm NH3 at 723 K. However, the hydrogen flux of Pd77Ag23 membranes was reduced by 26% in the presence of 200 ppm NH3 at 573 K. They concluded that the inhibition of hydrogen flux might be related to the incorporation of changes in the Pd alloy membranes due to surface segregation.
It is clear that the reported effects of NH3 on the hydrogen flux of Pd-based membranes are contradictory, and the poisoning mechanism of NH3 remains unclear. The role of NH3 seems more complex, and specific studies on individual factors are needed to further elucidate their poisoning mechanisms. In particular, a few issues about the poisoning of NH3 on Pd-Ru membranes are discussed. To further improve the overall performance of Pd-Ru membranes and better optimize the operating conditions in membrane reactors, it is essential to clarify the inhibition effect of NH3 on the hydrogen flux of Pd-Ru membranes under the conditions of NH3 decomposition.
In this paper, we investigate the hydrogen permeation performance of Pd-Ru membranes exposed to 1–10% NH3 at 673–773 K and different pressures. We present the effects of NH3 concentration and exposure temperatures on the hydrogen flux of Pd-Ru membranes, and the NH3 poisoning mechanism on the Pd-Ru membranes is analyzed.
2. Materials and Methods
2.1. Membrane Preparation
Porous alumina ceramic tubes with a diameter of 12 mm and an average pore size of 0.05 μm were used as the supports of the Pd-Ru membrane. The Pd-Ru membrane was deposited by a sequential electroless plating technique [26]. The surface of the porous alumina ceramic tubes was uniformly sprayed with palladium acetate dissolved in chloroform. Subsequently, the tubes were heat-treated for 3 h at 523 K in an air atmosphere to convert the palladium acetate into palladium oxide. These heat-treated substrate tubes were then reduced in hydrazine baths for 1 h to form palladium nano-particles. The Pd layer was deposited on the activated surface by electroless plating at 308 K, followed by the deposition of the Ru layer on top of the Pd layer at 333 K. The bath compositions of the electroless plating are presented in Table 1. The as-deposited Pd-Ru membranes were heat-treated by a hydrogen permeation process at 723 K for 24 h.
2.2. NH3 Poisoning Tests and Characterization
Graphite seals were used to seal the Pd-Ru membrane tubes into tubular stainless steel cavities. The feed gases entered through the shell side and the hydrogen permeated through the membrane to the tube side. The feed pressure was controlled with a pressure regulator installed on the retentate side.
Prior to NH3 exposure, pure hydrogen permeation tests were performed on the Pd-Ru membranes in the range of 623–773 K and 0.1–0.4 MPa. NH3 poisoning tests were performed by passing a 1–10% NH3/H2 mixture through these membranes for 6 h at 723 K. After NH3 exposure, pure hydrogen was introduced to evaluate the recovery performance of hydrogen flux. Pd-Ru membranes exposed to 10% NH3 were further examined for changes in hydrogen flux under different temperatures and pressures. For comparative analysis, the NH3 poisoning tests were all performed on the same membrane. And different membrane samples prepared with the same preparation process were used in the post-process characterization.
The surface microstructural characterization of the membranes was performed by using a Hitachi S-4800 scanning electron microscope (SEM, Hitachi Limited, Tokyo, Japan). The phase and composition of the membranes before and after NH3 exposure were determined using a Rigaku D/max 2500 X-ray diffractometer (XRD, Rigaku Corporation, Tokyo, Japan) and ESCA-LAB Xi+ X-ray photoelectron spectroscopy (XPS, Thermo Fisher Scientific, Waltham, MA, USA). For the XPS analysis, the C 1s reference signal was used as a calibrated reference.
3. Results and Discussion
3.1. Hydrogen Permeation Experiments
SEM micrographs of the as-deposited Pd-Ru membrane are shown in Figure 1. The membrane is compact without pinholes or cracks, which confirms that the electroless plating conditions used in this study are suitable for preparing a uniform membrane surface. As shown in Figure 1b, the Pd-Ru membrane has two distinct layers, Pd and Ru layers. The thickness of the Pd layer is about 5 μm, and the thickness of the Ru layer is about 0.25 μm. EDS mappings of the Pd-Ru membrane are shown in Figure 2, and it is clear that the Ru layer is above the Pd layer. According to the thickness of the Pd-Ru membrane and the metal density, the Ru content is calculated as about 5 wt.%.
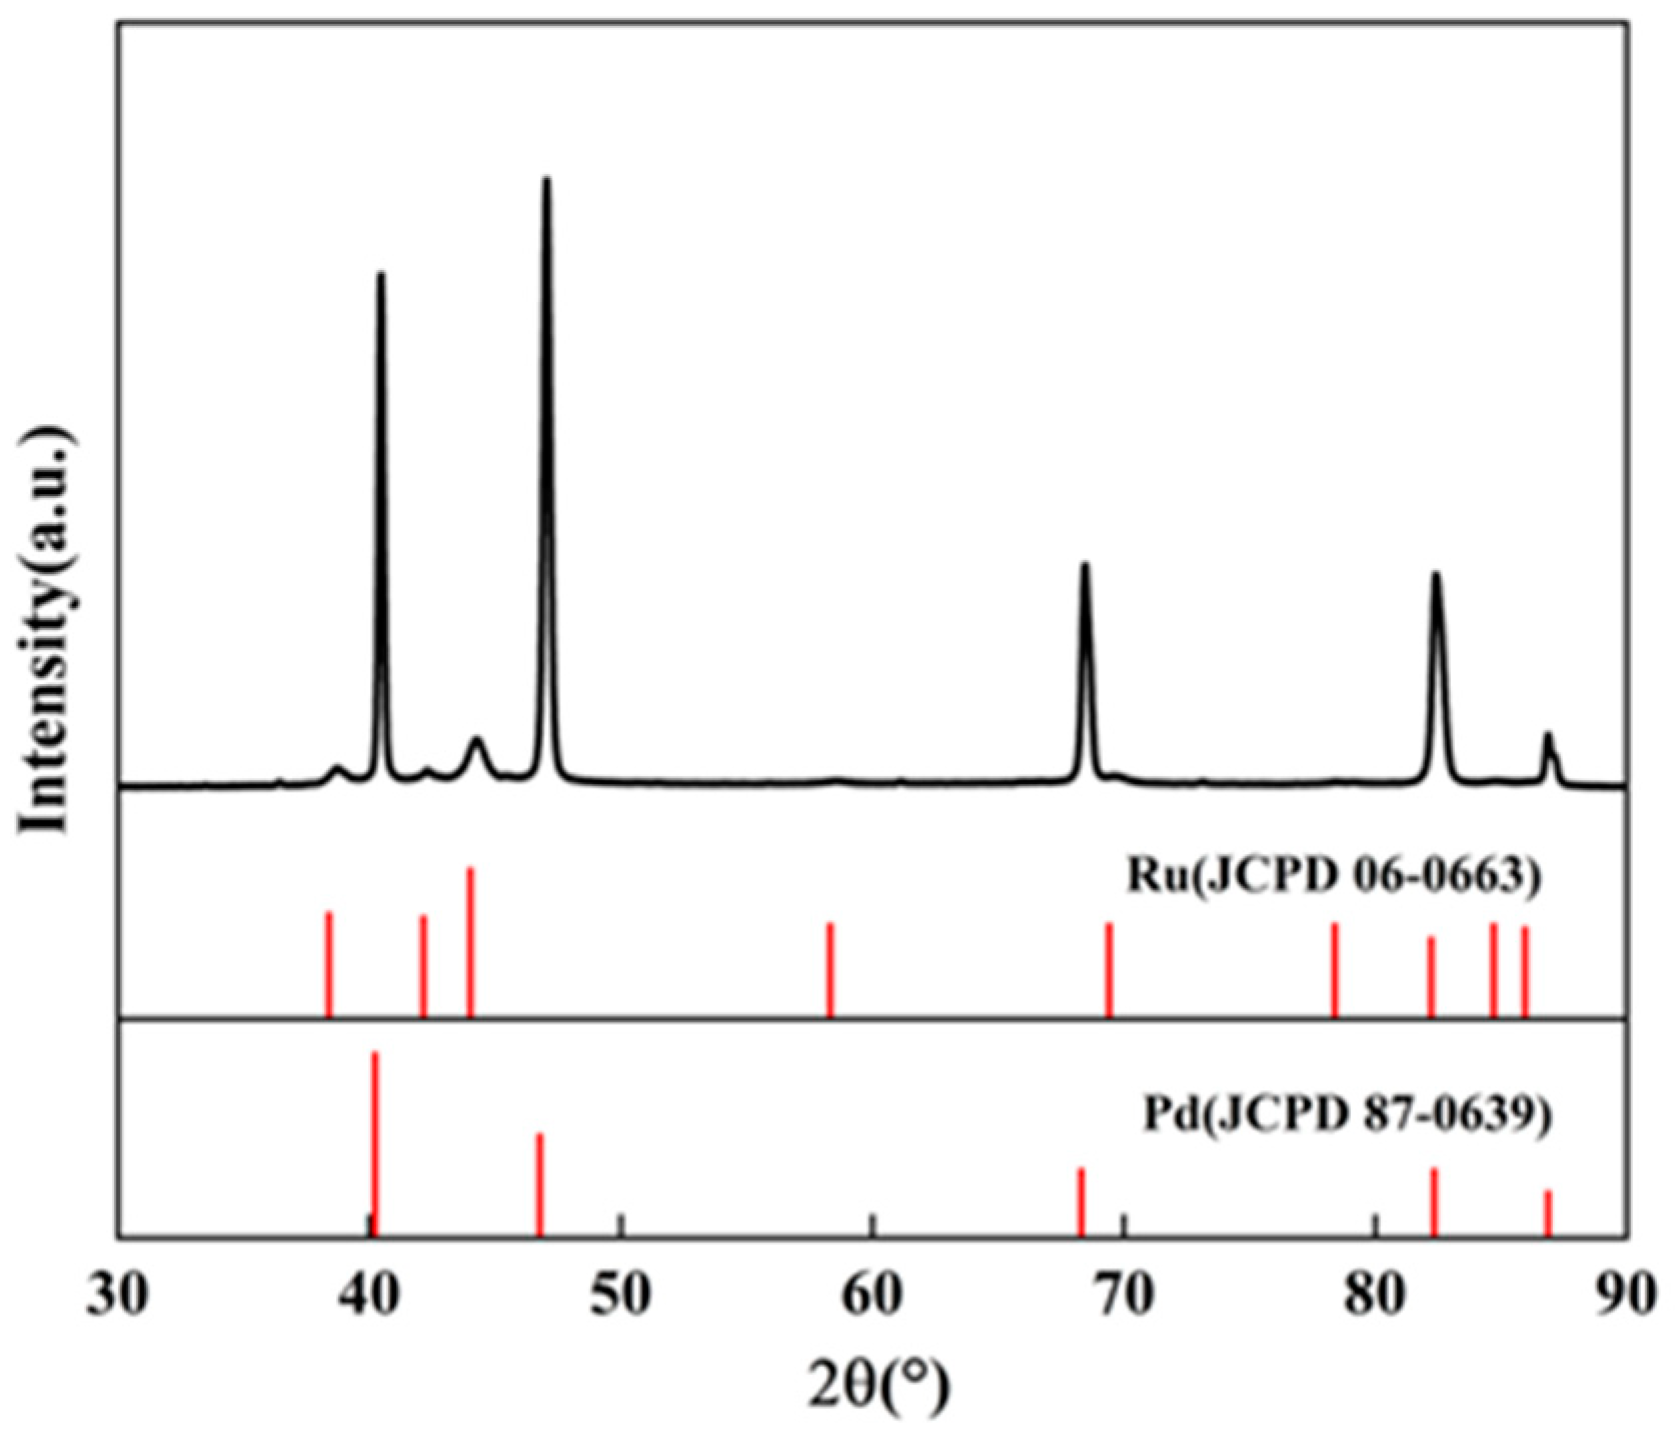
The XRD pattern of the as-deposited Pd-Ru membrane is shown in Figure 3. The diffractogram exhibits peaks of the Pd phase and Ru phase, indicating that the Pd-Ru membrane has been successfully prepared.
Hydrogen permeation through Pd membranes follows the solution–diffusion mechanism [27]. Driven by the partial pressure difference between the two sides of the membrane, hydrogen diffuses from the high-pressure region to the low-pressure region. Hydrogen molecules adsorbed on the surface of the Pd membrane undergo dissociation into hydrogen atoms, which then dissolve in the Pd lattice. When diffused to the membrane surface of the low-pressure side, hydrogen molecules are reconnected and desorbed from the Pd surface. The hydrogen permeation flux is obtained by combining Fick and Sieverts’ law:
where is the hydrogen permeate flux of the membrane, mol∙m−2∙s−1; Pe is the hydrogen permeability of the membrane, mol∙m−1∙s−1∙Pa−n; d is the total thickness of the membrane, m; P1 is the partial pressure of hydrogen on the feed side, Pa; P2 is the partial pressure of hydrogen on the permeated side, Pa; and n is the pressure exponent.
Figure 4 shows the variation in hydrogen flux through Pd-Ru membranes at different temperatures and pressures. The hydrogen flux gradually increases with the rising temperature and pressure difference. At temperatures of 623 K, 673 K, 723 K, and 773 K, the hydrogen permeability values for the Pd-Ru membrane are measured as follows: 4.2 × 10⁻⁹ mol∙m−1∙s−1∙Pa−0.5, 5.3 × 10⁻⁹ mol∙m−1∙s−1∙Pa−0.5, 6.4 × 10⁻⁹ mol∙m−1∙s−1∙Pa−0.5, and 7.3 × 10⁻⁹ mol∙m−1∙s−1∙Pa−0.5, respectively. The determined value agreed quite well with values reported in the literature [28]. The pressure exponent n values are measured as follows: 0.65, 0.69, 0.66, and 0.77. The values of the pressure exponent n are all in the range of 0.5–1, indicating that both the surface reaction and the bulk diffusion of the hydrogen atoms control the hydrogen permeation through the Pd-Ru membranes. At a temperature of 723 K, the H2/N2 selectivity value for the Pd-Ru membrane at 0.1 MPa is 1960.
3.2. Effect of NH3 on Hydrogen Permeation through Pd-Ru Membrane
3.2.1. Effect of NH3 Exposure Concentration
Figure 5 shows the variation in relative hydrogen flux of Pd-Ru membranes exposed to 1–10% NH3 at 0.1 MPa for 6 h at 723 K and the subsequent recovery in pure hydrogen. The above test conditions are based on the conditions of NH3 decomposition, which were convenient to compare with literature data. ”The relative hydrogen flux () is the ratio of the hydrogen flux of the Pd-Ru membrane exposed to NH3 () to the original hydrogen flux () before NH3 exposure.
When exposed to 1–10% NH3, the relative hydrogen fluxes through Pd-Ru membranes decreased sharply by 15–33% before rapidly stabilizing at new steady-state values. The inhibition effect of NH3 became more pronounced with the increase in NH3 concentration. After NH3 removal, the hydrogen fluxes all recovered to 100%, indicating that the inhibition caused by NH3 on the hydrogen fluxes is completely reversible. The physical adsorption of NH3 on the surface of Pd-Ru membranes may be a reason for the decrease in hydrogen fluxes. This is mainly due to the fact that among the available adsorption sites, the top side of the horizontal orientation for hydrogen molecules exhibits the most energetically favorable condition (−0.343 eV), while the adsorption energy of NH3 molecules is greater than −0.84 eV, slightly stronger than that of hydrogen [29,30]. The recovery time of hydrogen flux after pure hydrogen treatment increases with increasing NH3 concentration. These occupied active sites are gradually released over time following pure hydrogen treatment, resulting in the recovery of hydrogen flux. Thus, it can be inferred that the decrease in hydrogen flux may be related to the physical adsorption of NH3 on the surface of the Pd-Ru membrane.
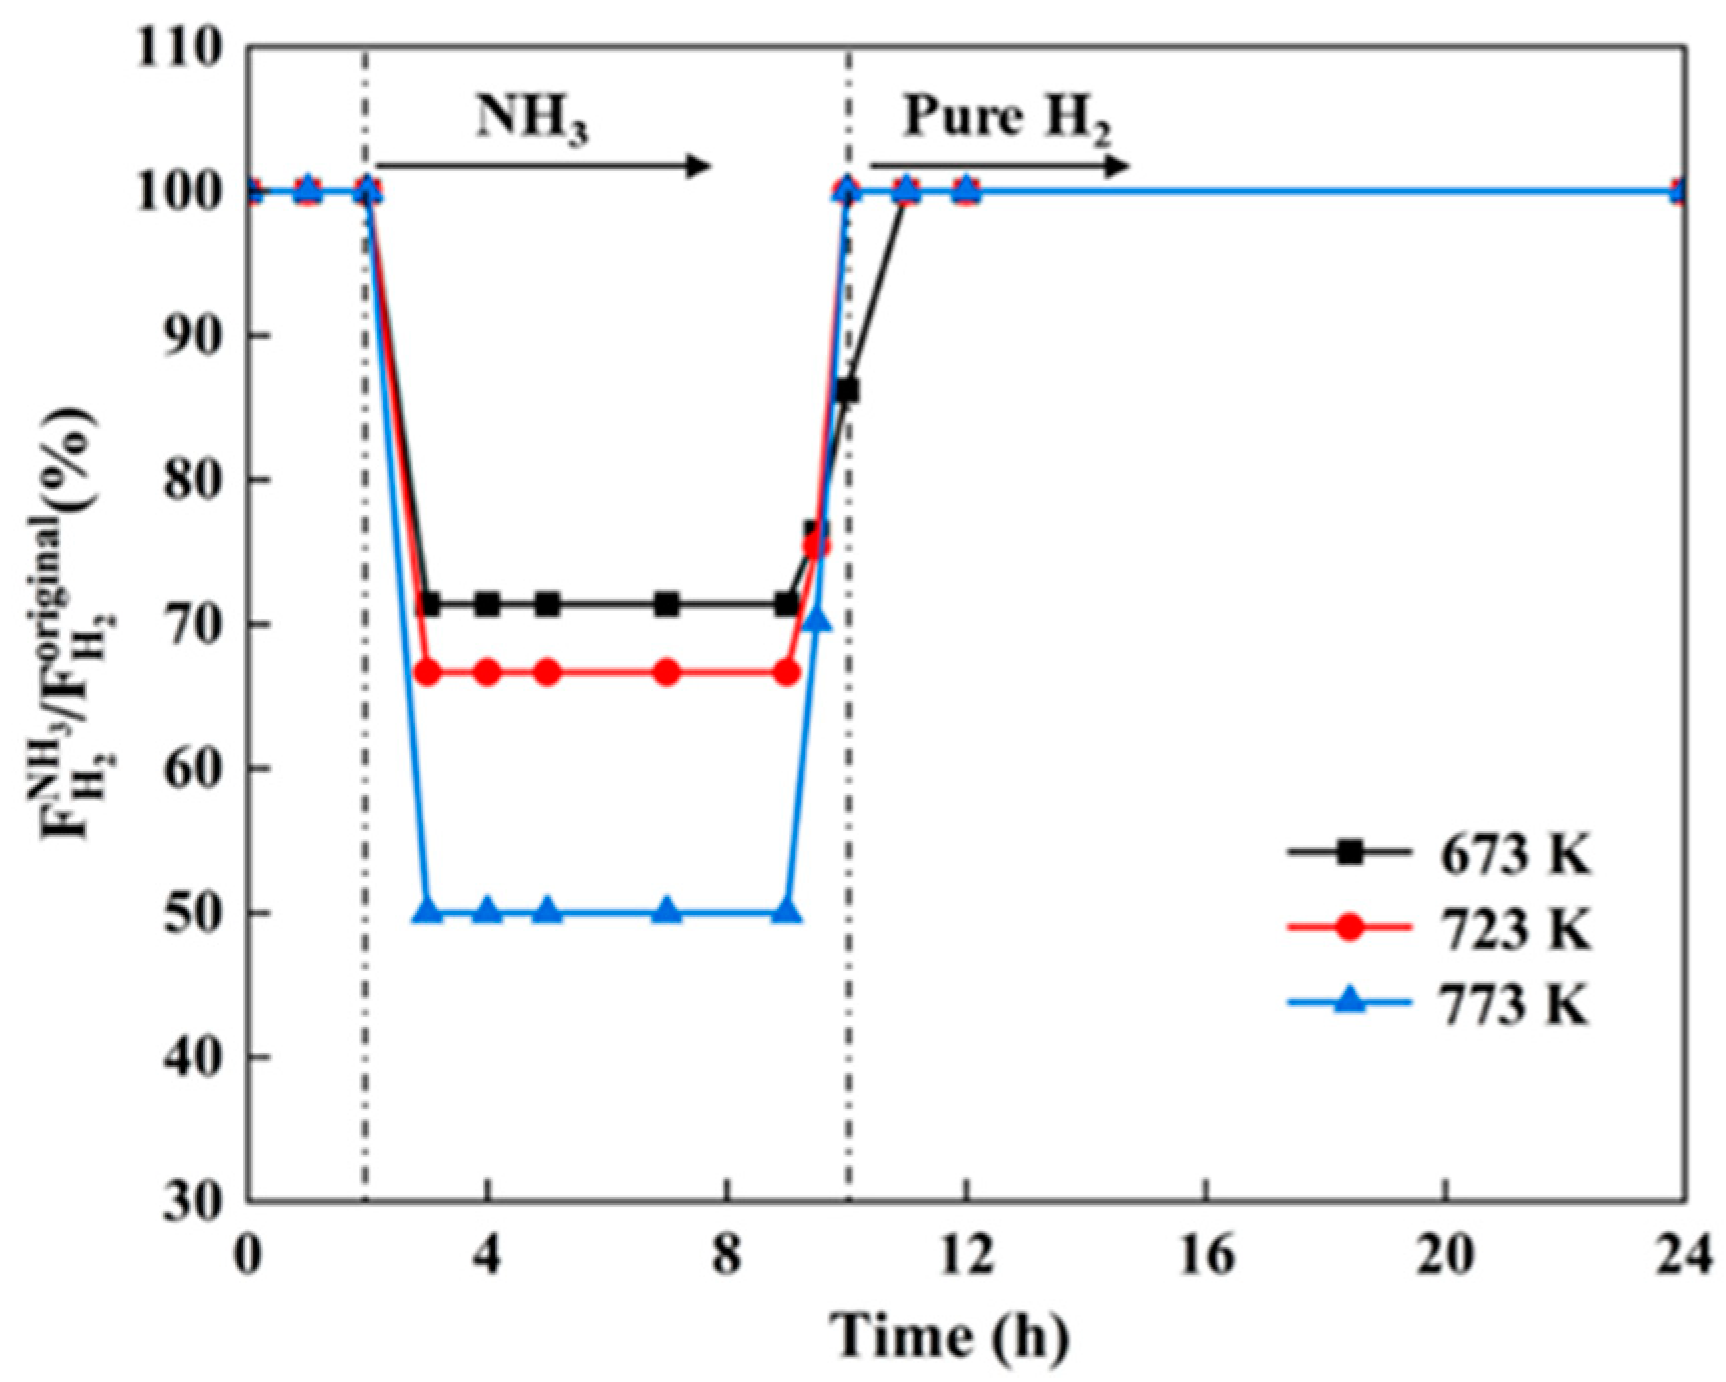
3.2.2. Effect of NH3 Exposure Temperature
As mentioned above, the inhibition effect of 10% NH3 on the hydrogen flux of the Pd-Ru membrane is more significant. Therefore, 10% NH3 was chosen to investigate the effect of NH3 at different exposure temperatures. Figure 6 shows the relative hydrogen flux of Pd-Ru membranes exposed to 10% NH3 at various temperatures at 0.1 MPa and the subsequent recovery using pure hydrogen. The hydrogen flux of Pd-Ru membranes rapidly decreased by 27–50% after exposure to 10% NH3 at 673–773 K, and the inhibition extent of NH3 increased with increasing temperature. All hydrogen fluxes recovered to 100% upon introducing pure hydrogen.
In addition to competitive adsorption effects, the concentration polarization caused by the accumulation of non-permeable gases on upstream surfaces also blocks the permeation of hydrogen. For the NH3/H2 mixtures, both physical adsorption and concentration polarization effects may occur. N2 is usually regarded as an inert gas, and hydrogen flux inhibition is observed after the introduction of N2. This is typically attributed to the concentration polarization rather than competing adsorption [24]. To comprehend the effects of concentration polarization and competitive adsorption of NH3, the variation in the hydrogen flux through Pd-Ru membranes exposed to 10% NH3 and 10% N2 at different temperatures was investigated.
Figure 7 shows the temperature dependence of relative hydrogen flux for the Pd-Ru membrane when exposed to 10% NH3 and 10% N2 at 673–773 K. The difference in relative hydrogen flux () represents the competitive adsorption effect of NH3. The permeation of H2/N2 can be used to study concentration polarization. The decrease in hydrogen flux increases with rising temperature when exposed to 10% N2, which proves a gradual increase in concentration polarization effect. There are two main effects of the temperature on concentration polarization [31]. On the one hand, higher temperature enhances the diffusion coefficient and improves the mass transfer behavior, thereby weakening the concentration polarization effect. On the other hand, with higher temperatures, the hydrogen flux through the membrane is enhanced and the concentration polarization effect becomes more severe. As shown in Figure 6, with increasing temperature from 673 to 773 K, the difference in the relative hydrogen flux between Pd-Ru membranes exposed to 10% NH3 and 10% N2 decreased from 13.3% to 5.9%, indicating a gradual reduction in the competitive adsorption effect. The results suggest that both concentration polarization and competitive adsorption of NH3 occur simultaneously when the Pd-Ru membrane is exposed to NH3. Competitive adsorption has a bigger effect at lower temperatures, whereas concentrated polarization becomes more prominent at higher temperatures. The combined effect of these two effects ultimately leads to an increase in the inhibition effect of NH3 with rising temperature, as shown in Figure 5.
Figure 8 shows the variation in hydrogen flux with pressure when the Pd-Ru membrane is exposed to 10% NH3 and 10% N2 at 723 K. Compared with N2, the inhibition of hydrogen flux is more pronounced for the same NH3 concentration, further indicating that the poisoning effect of NH3 on Pd-Ru membranes is influenced by other factors in addition to the concentration polarization effect. With the same N2 concentration, there is a slight increase in hydrogen flux inhibition with increasing pressure due to an elevation in pressure leading to a higher hydrogen composition gradient and a lower diffusion coefficient. As a result, the effect of concentration polarization increases with rising pressure. In contrast, there are no significant changes in the hydrogen flux under NH3 exposure at different pressures, indicating that pressure plays a minor role in the NH3 poisoning for Pd-Ru membranes.
3.3. Post-Process Characterization
Figure 9 shows the SEM images of Pd-Ru membranes after exposure to 10% NH3 for 6 h at various temperatures. A surface smoothening and grain size growth are observed after exposure to 10% NH3. No cracks or pinholes are observed on the Pd-Ru membranes. The N2 flux of the Pd-Ru membrane before and after NH3 exposure did not show any significant changes and the Pd-Ru membranes remained dense and defect-free, indicating that NH3 exposure has no significant effect on the surface morphology of the Pd-Ru membranes.
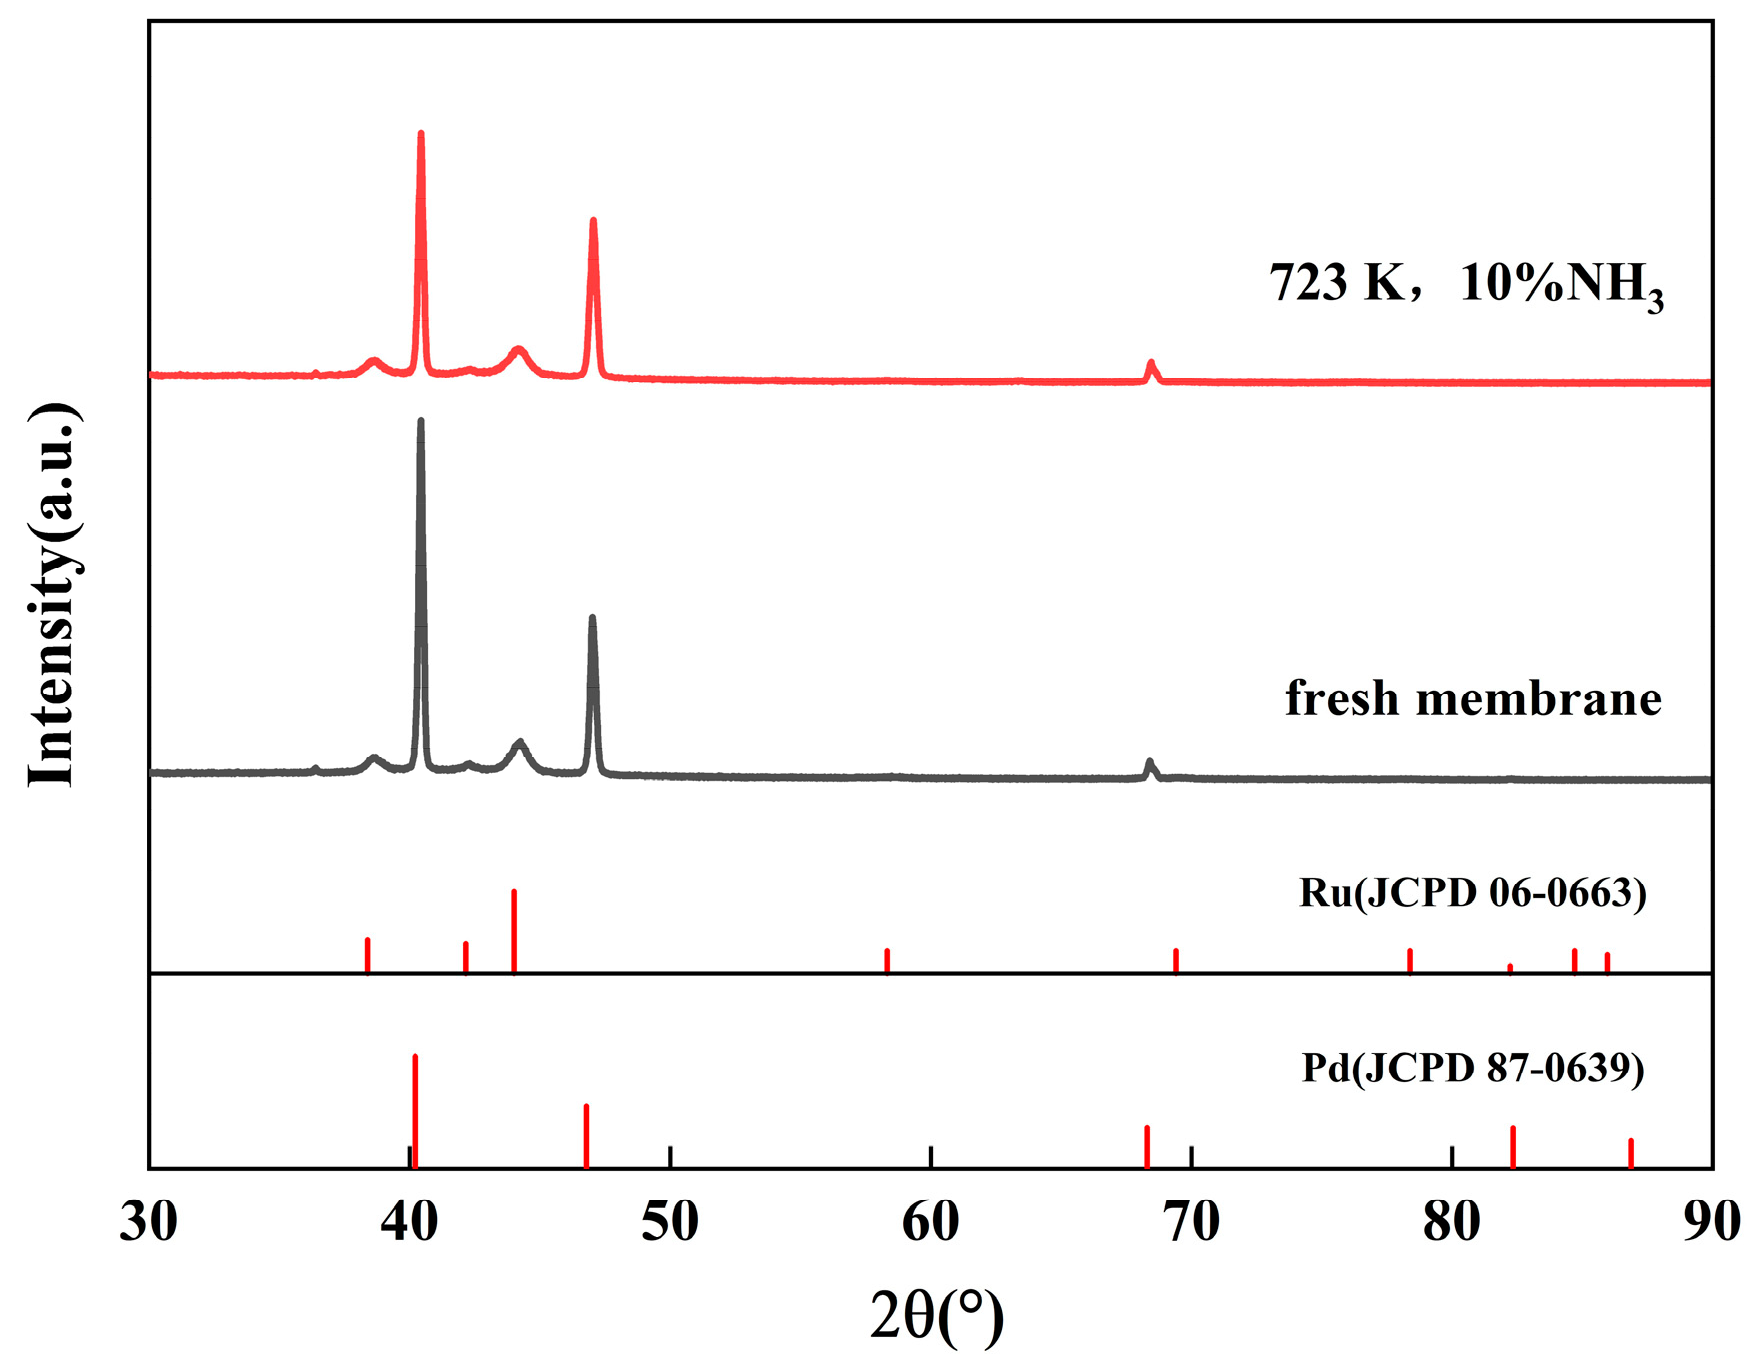
Figure 10 shows the grazing incidence XRD patterns obtained from the Pd-Ru membrane after exposure to 10% NH3 at 723 K for 6 h. After the NH3 exposure, there is no significant change in the phase of the Pd-Ru membrane, which is consistent with the fresh membrane.
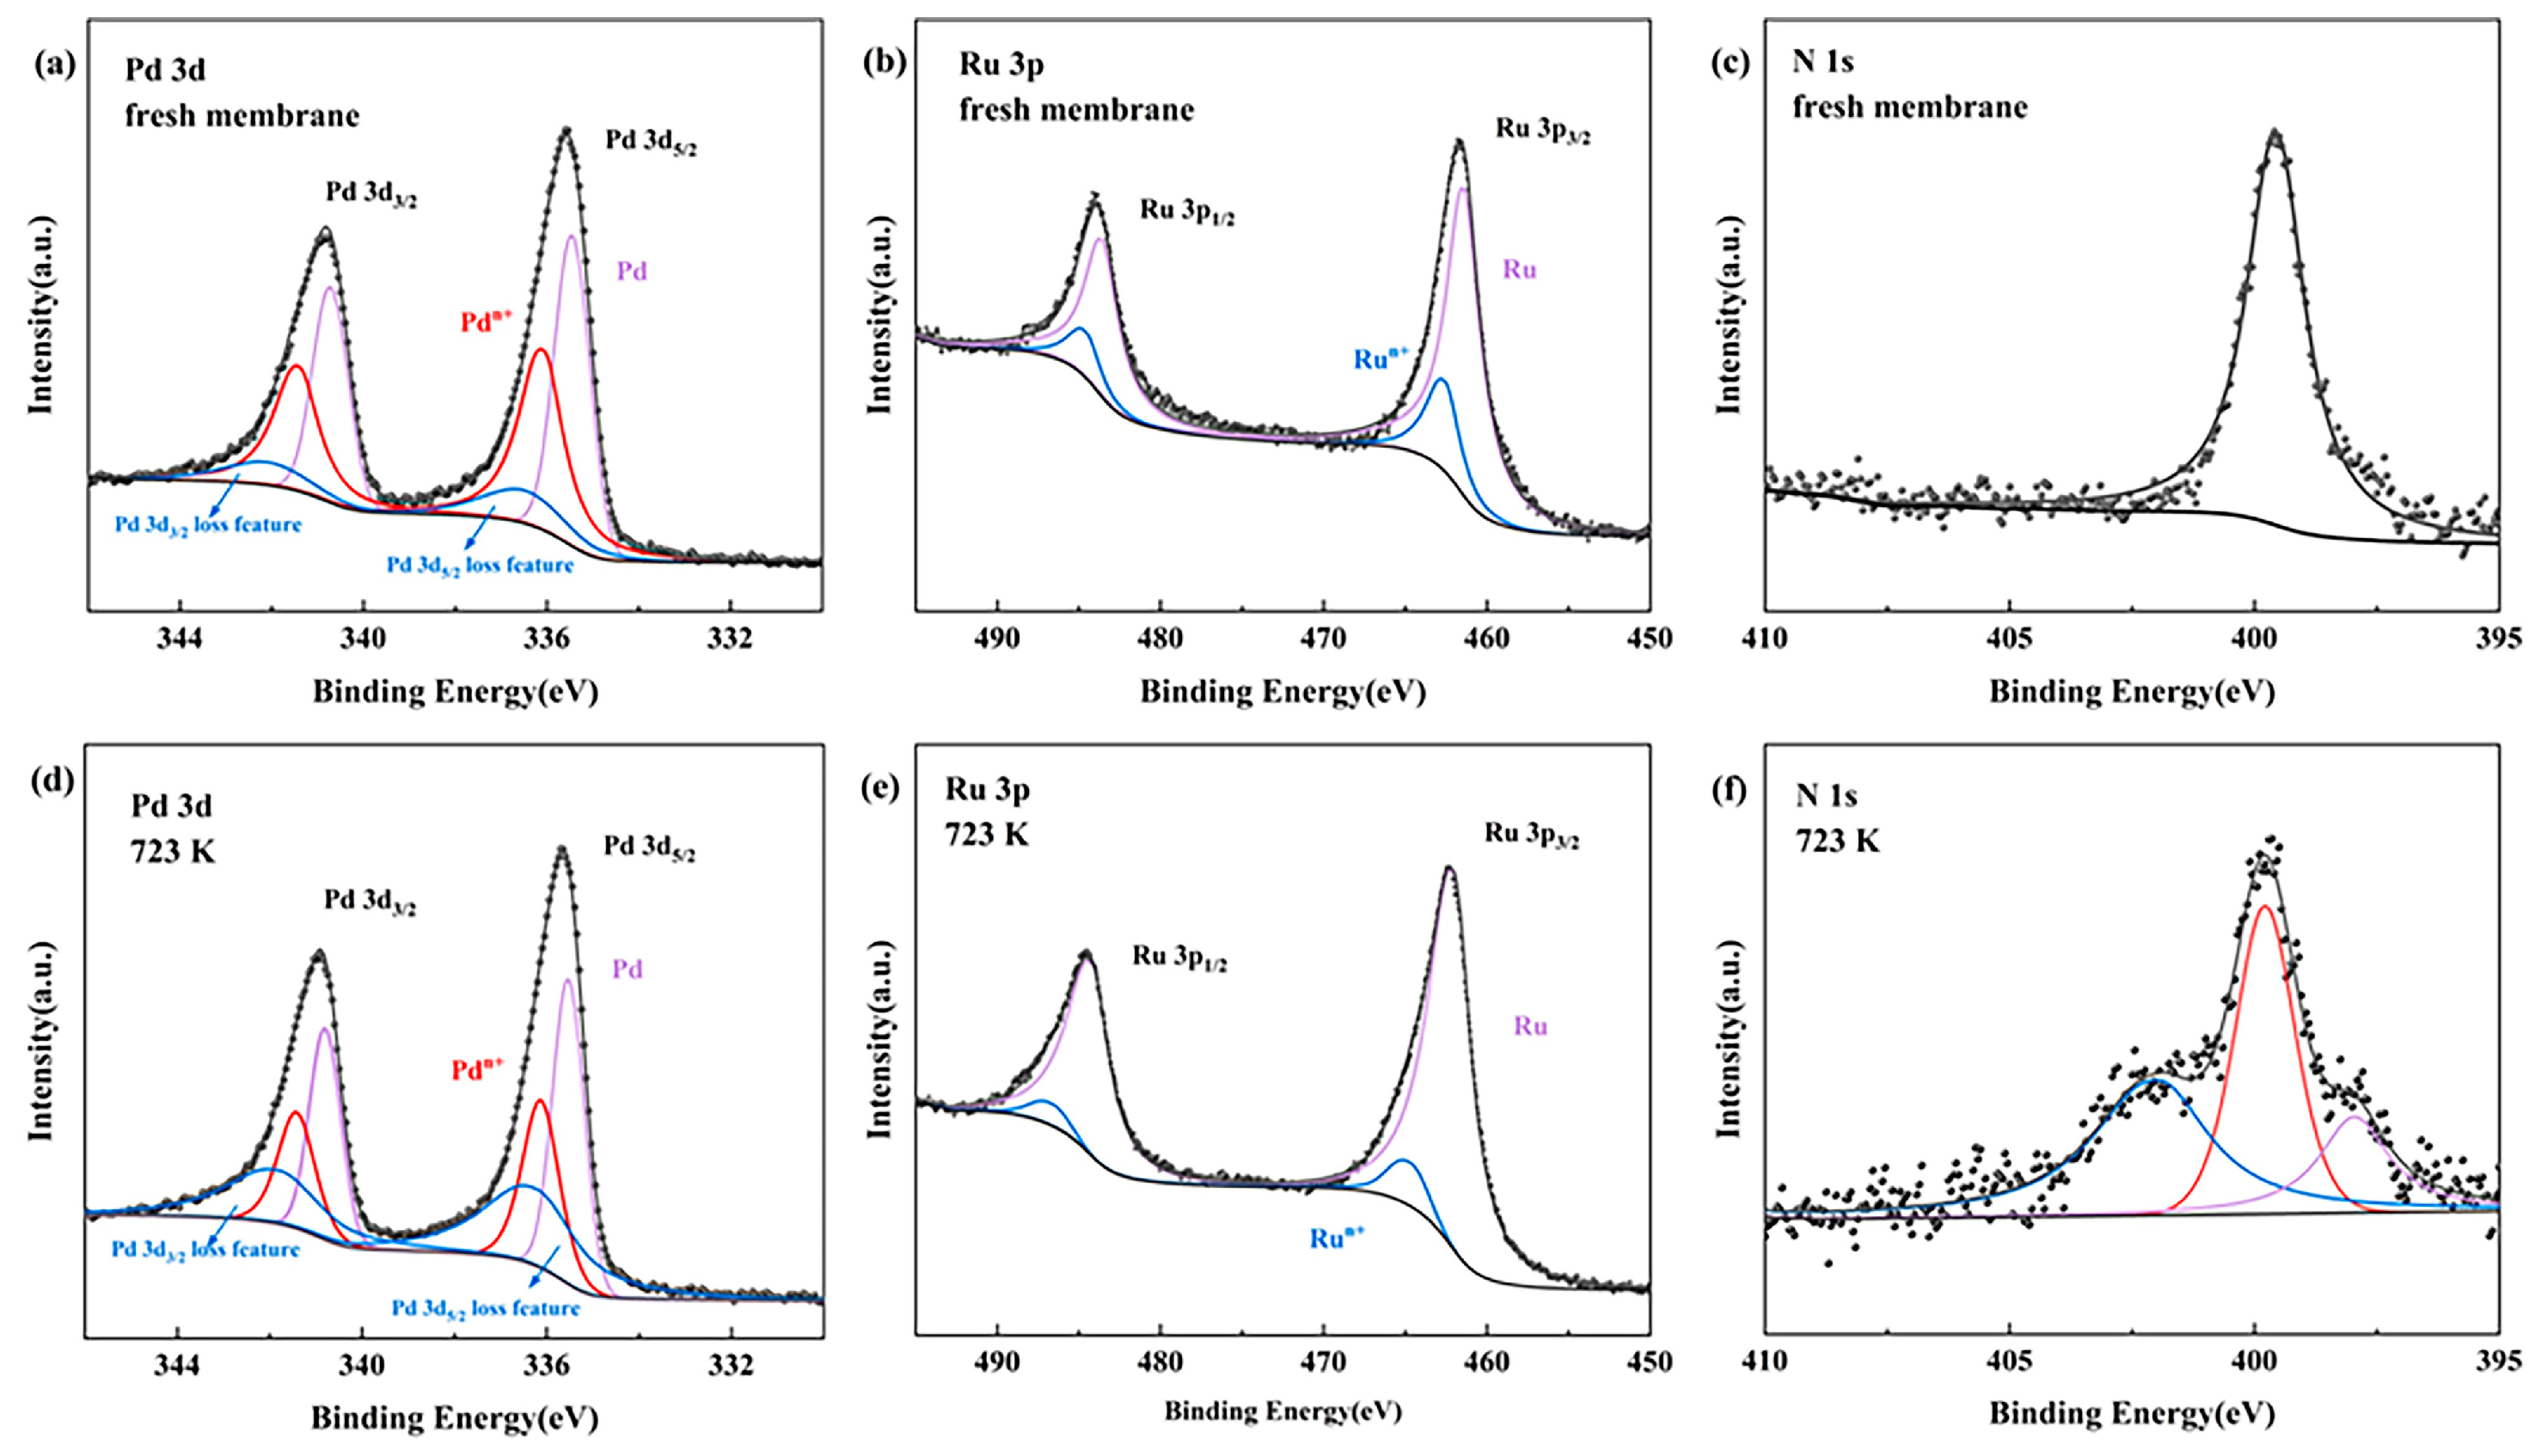
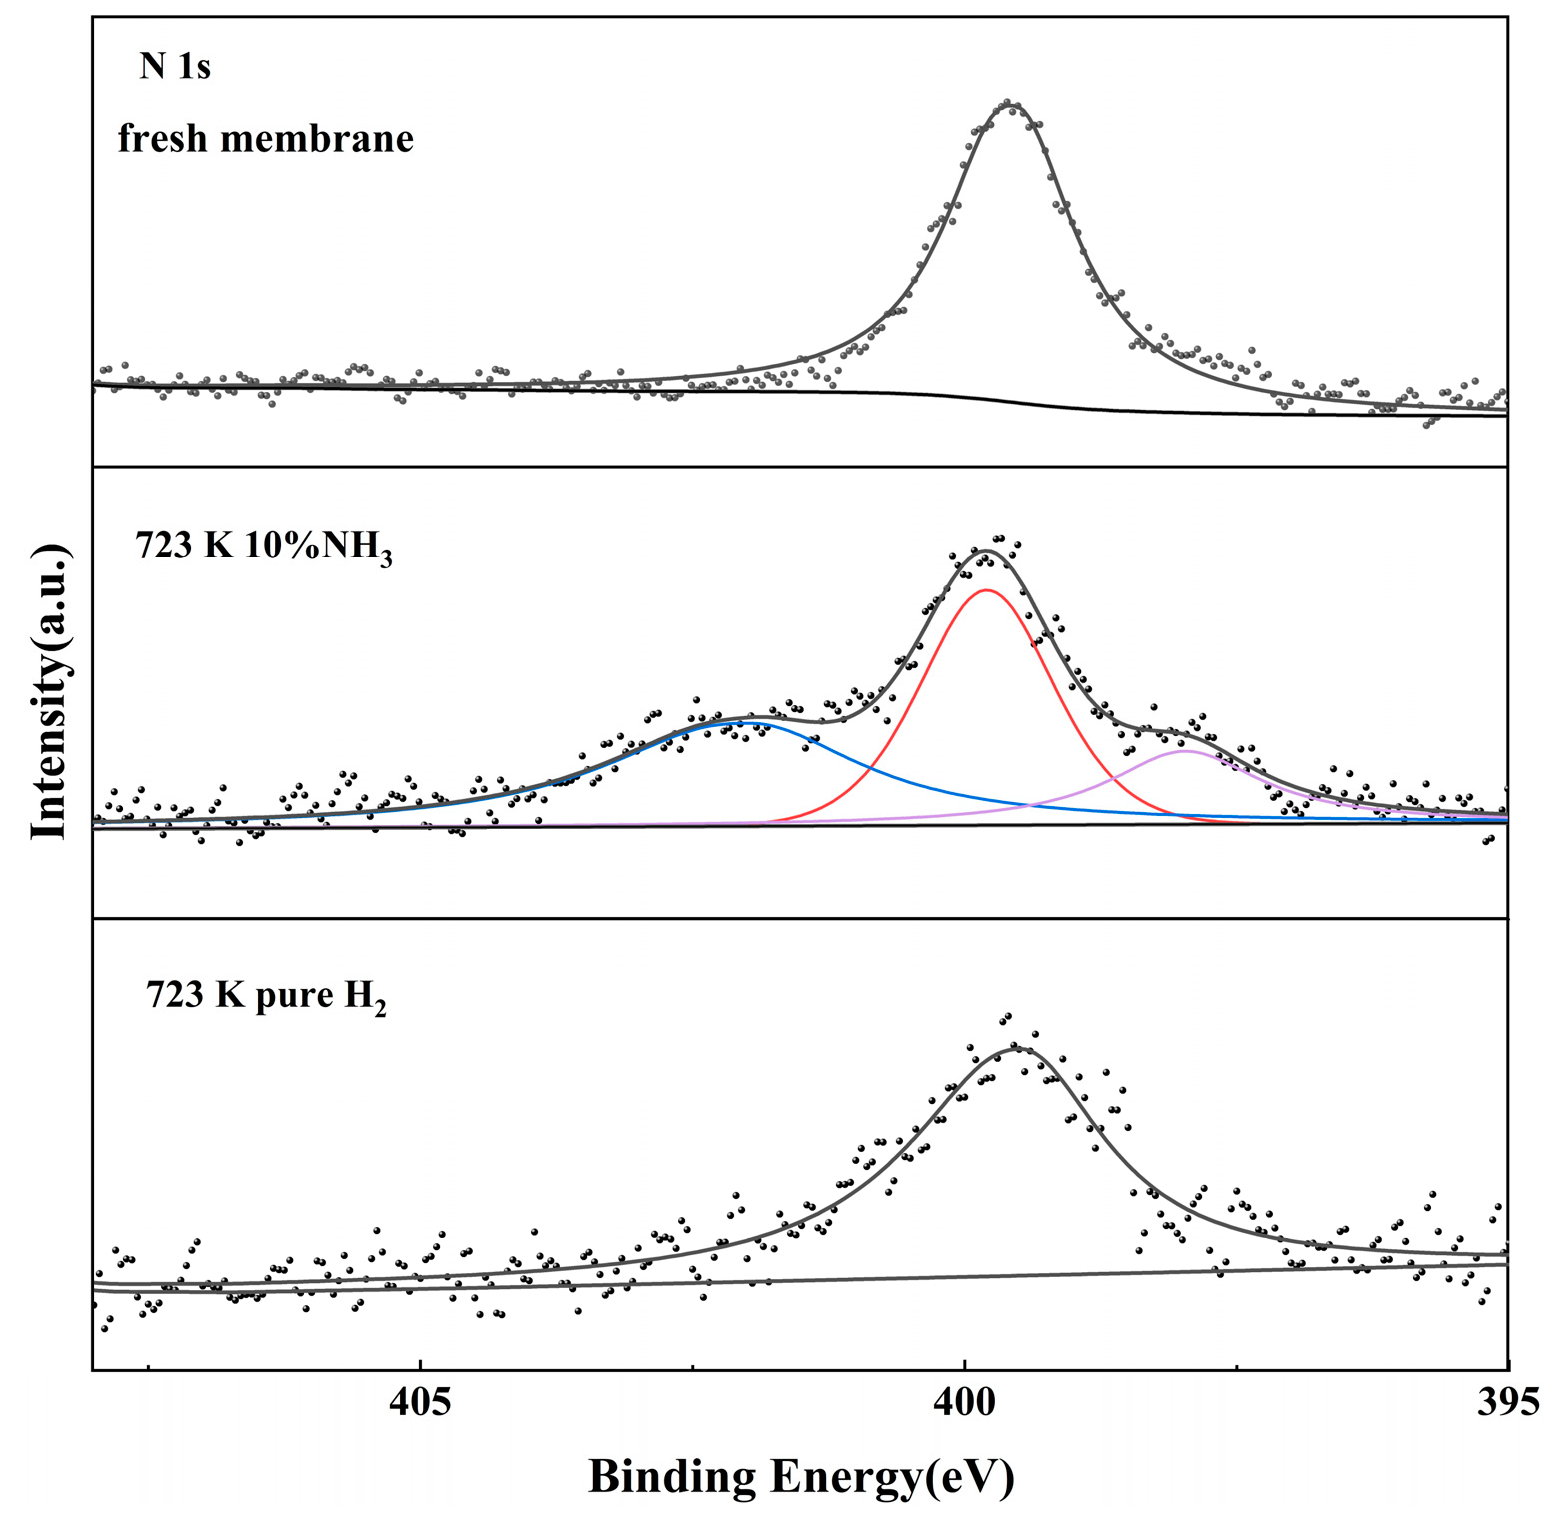
Figure 11 shows the high-resolution XPS spectrum of Pd 3d, Ru 3p, and N 1s signals for the Pd-Ru membranes before and after exposure to 10% NH3 at 723 K for 6 h. All three elements, i.e., Pd, Ru, and N, are detected on the surface of the membrane. There are contributions from high valence states of Pdn+ and Run+ [32]. Figure 11c shows that a fresh Pd-Ru membrane surface results in a dominant N 1s peak centered at an energy level of 399.8 eV corresponding to NH3, which may be introduced by the process of electroless plating. When the Pd-Ru membrane is exposed to 10% NH3 at 723 K, the N 1s spectrum is rather broad and exhibits at least three distinct peaks. It can be seen that the fitted N 1s spectrum reveals a main peak at around 399.8 eV, corresponding to NH3, and the peak at 397.8 eV is assigned to NHX (x = 1, 2) [33]. The N 1s spectrum at 402 eV could not be identified. During NH3 exposure, NH3 molecules and other nitrogenous species are adsorbed on the surface of the Pd-Ru membrane, covering the hydrogen adsorption sites and thus inhibiting hydrogen permeation through the Pd-Ru membrane.
Ru is the catalyst for the cracking of NH3. NH3 consecutively decomposes as NH2 → NH → N on the active site. During NH3 decomposition, NH3 is readily dissociated to give NH2 and NH2 is easily fragmented to form NH. When the Pd-Ru membrane is exposed to NH3, a portion of the active site becomes covered in NH3, whereas a small amount of NH3 decomposition should result in a certain coverage of NHX species.
Figure 12 shows the XPS spectrum of the N 1s for Pd-Ru membranes after different treatments. Compared with the Pd-Ru membrane exposed to NH3, the species in the 397.8 eV and 402 eV range disappeared after pure hydrogen treatment, indicating that only physical adsorption but not chemical adsorption occurred after NH3 exposure. When pure hydrogen was reintroduced, the dissociation and adsorption equilibrium of NH3 on the membrane surface moved in the opposite direction, resulting in the almost complete desorption of physically adsorbed NH3 and NHx (x = 1, 2). Therefore, the hydrogen fluxes all recovered 100% after pure hydrogen treatment.
The combination of the hydrogen permeation test, SEM, XRD, and XPS results suggests that physical adsorption and concentration polarization of nitrogenous species occur simultaneously when the Pd-Ru membrane is exposed to NH3. The competitive adsorption effect weakens and the extent of the concentration polarization effect increases with the temperature rising. No additional defects are formed on the Pd-Ru membrane during NH3 exposure, and the deactivations of the membranes are reversible after pure hydrogen is introduced. When Pd-Ru membranes are exposed to NH3, the effective area decreases due to the adsorption of the nitrogenous species on the surfaces, and thus the hydrogen flux decreases. Pure hydrogen treatment results in almost complete desorption of physically adsorbed NH3 and NHx (x = 1,2) and recovery of hydrogen flux. Otherwise, the high NH3 concentration or the long exposure time may promote a diffusion of the Pd to the surface and thus enhance the adsorption of nitrogenous species. The enrichment of Ru on the membrane surface may have a unique effect on the NH3 tolerance of the Pd-Ru membrane.
4. Conclusions
In this study, we investigated the effect of NH3 concentration and temperature on the hydrogen flux and subsequent recovery in pure hydrogen of the Pd-Ru membranes. The results showed that Pd-Ru membranes exhibit excellent NH3 tolerance. The following results were observed:
- (1)
- The hydrogen flux of the Pd-Ru membrane remains 67–85% under exposure to 1–10% NH3 for 6 h at 723 K. A higher NH3 concentration leads to greater inhibition of hydrogen flux, which can be fully recovered after the removal of NH3.
- (2)
- The inhibition effect of NH3 increases with the temperature increasing. The hydrogen flux of Pd-Ru membranes rapidly decreases by 27–50% after 10% NH3 exposure at 673–773 K.
- (3)
- A difference in relative hydrogen flux of 5.9% is observed at 773 K between 10% NH3 and 10% N2 exposure, while a difference of 13.3% is observed at 673 K. The poisoning effect of NH3 on Pd-Ru membranes is attributed to both competitive adsorption and concentration polarization. With increasing temperature, the competitive adsorption effect of NH3 decreases and the concentration polarization effect increases.
- (4)
- The XPS analysis of the membranes after exposure to NH3 showed that the reduction in hydrogen flux is attributed to the decrease in effective area due to the adsorption of the nitrogenous species on the surfaces during the dissociation process of hydrogen molecules. The poisoning effect of NH3 on Pd-Ru membranes is completely reversible.
Author Contributions
Conceptualization, L.C. and S.L.; methodology, L.C.; formal analysis, L.C.; investigation, L.C., Z.C. and L.H.; resources, M.D. and Q.Y.; writing—original draft preparation, L.C.; writing—review and editing, S.L., Z.Y. (Zhaohui Yin) and Z.Y. (Zhanbing Yang).; supervision, S.L., Z.Y. (Zhaohui Yin) and M.D.; project administration, S.L., M.D. and Q.Y.; funding acquisition, S.L. and Z.Y. (Zhanbing Yang). All authors have read and agreed to the published version of the manuscript.
Funding
This research was funded by the Beijing Natural Science Foundation, grant number 2212039.
Data Availability Statement
The data presented in this study are available on request from the corresponding authors due to restrictions, e.g., privacy or ethical.
Conflicts of Interest
The authors declare no conflicts of interest. Lingsu Chen, Shuai Li, Zhaohui Yin, Zihui Chen, Li Han, Qinghe Yu and Miao Du are employees of China GRINM Group Co., Ltd. and GRIMAT Engineering Institute Co., Ltd. This paper reflects the views of the scientists, not the companies.
References
- Dehghanimadvar, M.; Shirmohammadi, R.; Sadeghzadeh, M.; Aslani, A.; Ghasempour, R. Hydrogen Production Technologies: Attractiveness and Future Perspective. Int. J. Energy Res. 2020, 44, 8233–8254. [Google Scholar] [CrossRef]
- Zheng, J.; Liu, X.; Xu, P.; Liu, P.; Zhao, Y.; Yang, J. Development of High Pressure Gaseous Hydrogen Storage Technologies. Int. J. Hydrog. Energy 2012, 37, 1048–1057. [Google Scholar] [CrossRef]
- Züttel, A. Hydrogen Storage Methods. Naturwissenschaften 2004, 91, 157–172. [Google Scholar] [CrossRef]
- Aziz, M.; Wijayanta, A.T.; Nandiyanto, A.B.D. Ammonia as Effective Hydrogen Storage: A Review on Production, Storage and Utilization. Energies 2020, 13, 3062. [Google Scholar] [CrossRef]
- Lucentini, I.; Garcia, X.; Vendrell, X.; Llorca, J. Review of the Decomposition of Ammonia to Generate Hydrogen. Ind. Eng. Chem. Res. 2021, 60, 18560–18611. [Google Scholar] [CrossRef]
- Kothandaraman, J.; Kar, S.; Sen, R.; Goeppert, A.; Olah, G.A.; Prakash, G.K.S. Efficient Reversible Hydrogen Carrier System Based on Amine Reforming of Methanol. J. Am. Chem. Soc. 2017, 139, 2549–2552. [Google Scholar] [CrossRef]
- Mellmann, D.; Sponholz, P.; Junge, H.; Beller, M. Formic Acid as a Hydrogen Storage Material—Development of Homogeneous Catalysts for Selective Hydrogen Release. Chem. Soc. Rev. 2016, 45, 3954–3988. [Google Scholar] [CrossRef] [PubMed]
- Giddey, S.; Badwal, S.P.S.; Munnings, C.; Dolan, M. Ammonia as a Renewable Energy Transportation Media. ACS Sustain. Chem. Eng. 2017, 5, 10231–10239. [Google Scholar] [CrossRef]
- Peters, T.A.; Stange, M.; Bredesen, R. Flux-Reducing Tendency of Pd-Based Membranes Employed in Butane Dehydrogenation Processes. Membranes 2020, 10, 291. [Google Scholar] [CrossRef]
- Pushankina, P.; Andreev, G.; Petriev, I. Hydrogen Permeability of Composite Pd–Au/Pd–Cu Membranes and Methods for Their Preparation. Membranes 2023, 13, 649. [Google Scholar] [CrossRef]
- Hayakawa, Y.; Miura, T.; Shizuya, K.; Wakazono, S.; Tokunaga, K.; Kambara, S. Hydrogen Production System Combined with a Catalytic Reactor and a Plasma Membrane Reactor from Ammonia. Int. J. Hydrog. Energy 2019, 44, 9987–9993. [Google Scholar] [CrossRef]
- Rizzuto, E.; Palange, P.; Del Prete, Z. Characterization of an Ammonia Decomposition Process by Means of a Multifunctional Catalytic Membrane Reactor. Int. J. Hydrog. Energy 2014, 39, 11403–11410. [Google Scholar] [CrossRef]
- Cechetto, V.; Di Felice, L.; Gutierrez Martinez, R.; Arratibel Plazaola, A.; Gallucci, F. Ultra-Pure Hydrogen Production via Ammonia Decomposition in a Catalytic Membrane Reactor. Int. J. Hydrog. Energy 2022, 47, 21220–21230. [Google Scholar] [CrossRef]
- Cechetto, V.; Di Felice, L.; Medrano, J.A.; Makhloufi, C.; Zuniga, J.; Gallucci, F. H2 Production via Ammonia Decomposition in a Catalytic Membrane Reactor. Fuel Process. Technol. 2021, 216, 106772. [Google Scholar] [CrossRef]
- Lee, E.-H.; Kim, T.-W.; Byun, S.; Seo, D.-W.; Hwang, H.-J.; Yoon, H.-C.; Kim, H.; Ryi, S.-K. Effect of Air Bubbling on Electroless Pd Plating for the Practical Application of Hydrogen Selective Membranes. RSC Adv. 2023, 13, 14281–14290. [Google Scholar] [CrossRef] [PubMed]
- Kim, T.-W.; Lee, E.-H.; Byun, S.; Seo, D.-W.; Hwang, H.-J.; Yoon, H.-C.; Kim, H.; Ryi, S.-K. Highly Selective Pd Composite Membrane on Porous Metal Support for High-Purity Hydrogen Production through Effective Ammonia Decomposition. Energy 2022, 260, 125209. [Google Scholar] [CrossRef]
- Liu, J.; Ju, X.; Tang, C.; Liu, L.; Li, H.; Chen, P. High Performance Stainless-Steel Supported Pd Membranes with a Finger-like and Gap Structure and Its Application in NH3 Decomposition Membrane Reactor. Chem. Eng. J. 2020, 388, 124245. [Google Scholar] [CrossRef]
- Cerrillo, J.L.; Morlanés, N.; Kulkarni, S.R.; Realpe, N.; Ramírez, A.; Katikaneni, S.P.; Paglieri, S.N.; Lee, K.; Harale, A.; Solami, B.; et al. High Purity, Self-Sustained, Pressurized Hydrogen Production from Ammonia in a Catalytic Membrane Reactor. Chem. Eng. J. 2022, 431, 134310. [Google Scholar] [CrossRef]
- Abu El Hawa, H.W.; Paglieri, S.N.; Morris, C.C.; Harale, A.; Douglas Way, J. Application of a Pd–Ru Composite Membrane to Hydrogen Production in a High Temperature Membrane Reactor. Sep. Purif. Technol. 2015, 147, 388–397. [Google Scholar] [CrossRef]
- Kim, C.-H.; Han, J.-Y.; Lim, H.; Kim, D.-W.; Ryi, S.-K. Methane Steam Reforming in a Membrane Reactor Using High-Permeable and Low-Selective Pd-Ru Membrane. Korean J. Chem. Eng. 2017, 34, 1260–1265. [Google Scholar] [CrossRef]
- Albano, M.; Madeira, L.M.; Miguel, C.V. Use of Pd-Ag Membrane Reactors for Low-Temperature Dry Reforming of Biogas—A Simulation Study. Membranes 2023, 13, 630. [Google Scholar] [CrossRef]
- Sakamoto, F.; Kinari, Y.; Chen, F.L.; Sakamoto, Y. Hydrogen permeation through palladium alloy membranes in mixture gases of 10% nitrogen and ammonia in the hydrogen. Hydrog. Energy 1997, 22, 369–375. [Google Scholar] [CrossRef]
- Zhang, J.; Xu, H.; Li, W. High-Purity COx-Free H2 Generation from NH3 via the Ultra Permeable and Highly Selective Pd Membranes. J. Membr. Sci. 2006, 277, 85–93. [Google Scholar] [CrossRef]
- Lundin, S.-T.B.; Yamaguchi, T.; Wolden, C.A.; Oyama, S.T.; Way, J.D. The Role (or Lack Thereof) of Nitrogen or Ammonia Adsorption-Induced Hydrogen Flux Inhibition on Palladium Membrane Performance. J. Membr. Sci. 2016, 514, 65–72. [Google Scholar] [CrossRef]
- Peters, T.A.; Polfus, J.M.; Stange, M.; Veenstra, P.; Nijmeijer, A.; Bredesen, R. H2 Flux Inhibition and Stability of Pd-Ag Membranes under Exposure to Trace Amounts of NH3. Fuel Process. Technol. 2016, 152, 259–265. [Google Scholar] [CrossRef]
- Xu, N.; Kim, S.S.; Li, A.; Grace, J.R.; Lim, C.J.; Boyd, T. Preparation and Characterization of Palladium-Ruthenium Composite Membrane on Alumina-Modified PSS Substrate. Can. J. Chem. Eng. 2014, 92, 1041–1047. [Google Scholar] [CrossRef]
- Alique, D.; Martinez-Diaz, D.; Sanz, R.; Calles, J. Review of Supported Pd-Based Membranes Preparation by Electroless Plating for Ultra-Pure Hydrogen Production. Membranes 2018, 8, 5. [Google Scholar] [CrossRef]
- Yin, Z.; Yang, Z.; Du, M.; Mi, J.; Hao, L.; Tong, Y.; Feng, Y.; Li, S. Effect of Annealing Process on the Hydrogen Permeation through Pd–Ru Membrane. J. Membr. Sci. 2022, 654, 120572. [Google Scholar] [CrossRef]
- Abuelyamen, A.; Ben-Mansour, R.; Habib, M.A.; Manga, V.R.; Harale, A.; Paglieri, S.; Alsayoud, A. Poisonous Effect of Carbon Bearing Species on Adsorption of Hydrogen on Pd-Membrane Surfaces. Int. J. Hydrog. Energy 2024, 50, 420–432. [Google Scholar] [CrossRef]
- Jiang, Z.; Pan, Q.; Li, M.; Yan, T.; Fang, T. Density Functional Theory Study on Direct Catalytic Decomposition of Ammonia on Pd (1 1 1) Surface. Appl. Surf. Sci. 2014, 292, 494–499. [Google Scholar] [CrossRef]
- Yue, L.; Chen, C.; Li, J.; Xiao, C.; Xia, X.; Ran, G.; Fu, X.; Hou, J.; Gong, Y.; Wang, H. Inhibition Effect of CO on Hydrogen Permeation Through a Pd/Al2O3 Composite Membrane: A Comprehensive Study on Concentration Polarization and Competitive Adsorption Effect. Fusion Sci. Technol. 2020, 76, 680–689. [Google Scholar] [CrossRef]
- Yin, Z.; Yang, Z.; Tong, Y.; Du, M.; Mi, J.; Yu, Q.; Li, S. Improved Sulfur Tolerance of Pd–Ru Membranes: Influence of H2S Concentration and Exposure Time on the Hydrogen Flux. Int. J. Hydrog. Energy 2023, 48, 38335–38343. [Google Scholar] [CrossRef]
- Ripepi, D.; Izelaar, B.; Van Noordenne, D.D.; Jungbacker, P.; Kolen, M.; Karanth, P.; Cruz, D.; Zeller, P.; Pérez-Dieste, V.; Villar-Garcia, I.J.; et al. In Situ Study of Hydrogen Permeable Electrodes for Electrolytic Ammonia Synthesis Using Near Ambient Pressure XPS. ACS Catal. 2022, 12, 13781–13791. [Google Scholar] [CrossRef] [PubMed]
Figure 1.
SEM images of the surface (a) and cross-section (b) of the as-deposited Pd-Ru membrane.

Figure 2.
EDS analysis of the Pd-Ru membrane: (a) EDS surface Pd mapping; (b) EDS surface Ru mapping; (c) SEM surface image; (d) EDS line scans.
Figure 2.
EDS analysis of the Pd-Ru membrane: (a) EDS surface Pd mapping; (b) EDS surface Ru mapping; (c) SEM surface image; (d) EDS line scans.

Figure 3.
XRD pattern of the as-deposited Pd-Ru membrane.

Figure 4.
Hydrogen permeation flux of the Pd-Ru membrane as a function of pressure difference at different temperatures. n is the pressure exponent.
Figure 4.
Hydrogen permeation flux of the Pd-Ru membrane as a function of pressure difference at different temperatures. n is the pressure exponent.

Figure 5.
Hydrogen flux inhibition of Pd-Ru membranes exposed to different concentrations of NH3 at 723 K and 0.1 MPa for 6 h and the subsequent recovery in pure hydrogen.
Figure 5.
Hydrogen flux inhibition of Pd-Ru membranes exposed to different concentrations of NH3 at 723 K and 0.1 MPa for 6 h and the subsequent recovery in pure hydrogen.

Figure 6.
Hydrogen flux inhibition of the Pd-Ru membrane exposed to 10% NH3 at 0.1 MPa for different temperatures and the subsequent recovery in pure hydrogen.
Figure 6.
Hydrogen flux inhibition of the Pd-Ru membrane exposed to 10% NH3 at 0.1 MPa for different temperatures and the subsequent recovery in pure hydrogen.

Figure 7.
Relative hydrogen flux difference for Pd-Ru membranes exposed to 10% NH3 and 10% N2 at 0.1 MPa and different temperatures.
Figure 7.
Relative hydrogen flux difference for Pd-Ru membranes exposed to 10% NH3 and 10% N2 at 0.1 MPa and different temperatures.

Figure 8.
Variation in relative hydrogen permeation flux with pressure for Pd-Ru membranes exposed to 10% NH3 and 10% N2 at 723 K.
Figure 8.
Variation in relative hydrogen permeation flux with pressure for Pd-Ru membranes exposed to 10% NH3 and 10% N2 at 723 K.

Figure 9.
SEM images of Pd-Ru membranes exposed to 10% NH3 at different temperatures: (a) fresh sample; (b) 673 K; (c) 723 K; (d) 773 K.
Figure 9.
SEM images of Pd-Ru membranes exposed to 10% NH3 at different temperatures: (a) fresh sample; (b) 673 K; (c) 723 K; (d) 773 K.

Figure 10.
Grazing incidence XRD pattern of Pd-Ru membranes after exposure to 10% NH3 for 6 h at 723 K.
Figure 10.
Grazing incidence XRD pattern of Pd-Ru membranes after exposure to 10% NH3 for 6 h at 723 K.

Figure 11.
High-resolution XPS spectrum of Pd 3d, Ru 3p, and N 1s signals for Pd-Ru membranes. (a–c) Fresh membrane; (d–f) membrane after exposure to 10% NH3 at 723 K.
Figure 11.
High-resolution XPS spectrum of Pd 3d, Ru 3p, and N 1s signals for Pd-Ru membranes. (a–c) Fresh membrane; (d–f) membrane after exposure to 10% NH3 at 723 K.

Figure 12.
High-resolution XPS spectrum of N 1s signals for Pd-Ru membranes after different treatments.
Figure 12.
High-resolution XPS spectrum of N 1s signals for Pd-Ru membranes after different treatments.


Table 1.
Bath compositions of Pd-Ru electroless plating.
| Chemicals | Pd Bath | Ru Bath |
|---|---|---|
| PdCl2 | 4.36 g/L | / |
| RuCl3 | / | 0.0178 g/L |
| EDTA | 60 g/L | / |
| NH3∙H2O | 600 mL/L | 150 mL/L |
| N2H4 | 1 vol% | 10 vol% |
| Temperature | 308 K | 333 K |
Disclaimer/Publisher’s Note: The statements, opinions and data contained in all publications are solely those of the individual author(s) and contributor(s) and not of MDPI and/or the editor(s). MDPI and/or the editor(s) disclaim responsibility for any injury to people or property resulting from any ideas, methods, instructions or products referred to in the content. |
© 2024 by the authors. Licensee MDPI, Basel, Switzerland. This article is an open access article distributed under the terms and conditions of the Creative Commons Attribution (CC BY) license (https://creativecommons.org/licenses/by/4.0/).
Share and Cite
MDPI and ACS Style
Chen, L.; Li, S.; Yin, Z.; Yang, Z.; Chen, Z.; Han, L.; Yu, Q.; Du, M. Hydrogen Flux Inhibition of Pd-Ru Membranes under Exposure to NH3. Membranes 2024, 14, 59. https://doi.org/10.3390/membranes14030059
AMA Style
Chen L, Li S, Yin Z, Yang Z, Chen Z, Han L, Yu Q, Du M. Hydrogen Flux Inhibition of Pd-Ru Membranes under Exposure to NH3. Membranes. 2024; 14(3):59. https://doi.org/10.3390/membranes14030059
Chicago/Turabian StyleChen, Lingsu, Shuai Li, Zhaohui Yin, Zhanbing Yang, Zihui Chen, Li Han, Qinghe Yu, and Miao Du. 2024. "Hydrogen Flux Inhibition of Pd-Ru Membranes under Exposure to NH3" Membranes 14, no. 3: 59. https://doi.org/10.3390/membranes14030059
Note that from the first issue of 2016, this journal uses article numbers instead of page numbers. See further details here.